"globalization": modeling technology adoption timing
TRANSCRIPT
"GLOBALIZATION": MODELING TECHNOLOGYADOPTION TIMING ACROSS
COUNTRIES
by
M. G. DEKIMPE*P. M. PARKER**
andM. SARVARYt
96/38/MKT
Associate Professor at Catholic University Leuven, Naamsestraat 69, 3000 Leuven, Belgium.
Associate Professor at INSEAD, Boulevard de Constance, Fontainebleau 77305 Cedex, France.
Assistant Professor at Stanford University, USA.
A working paper in the INSEAD Working Paper Series is intended as a means whereby a faculty researcher'sthoughts and findings may be communicated to interested readers. The paper should be consideredpreliminary in nature and may require revision.
Printed at INSEAD, Fontainebleau, France.

"Globalization": Modeling Technology Adoption Timing Across
Countries
Marnik G. Dekimpe
(Catholic University Leuven)
Philip M. Parker
(INSEAD)
Miklos Sarvary
(Stanford University)
July 1996
Marnik G. Dekimpe is Associate Professor, Catholic University Leuven, Naamsestraat 69, 3000 Leuven,Belgium (Tel. 32-16-326 944; E-mail: [email protected]); Philip M. Parker is AssociateProfessor, INSEAD, Boulevard de Constance, 77305 Fontainebleau Cedex, France (Tel. 33-1-6072 4000; E-mail: [email protected]); Miklos Sarvary is Assistant Professor, Stanford University, Graduate School ofBusiness, Stanford CA 94035, USA (Tel. 415-725-9206, E-Mail: [email protected]). Theauthors are listed alphabetically.
We would like to thank Marie-Louise Berry, William Fisk, Katrijn Gielens, Eva Szekeres and Hagit Zeev fortheir excellent research support, and Hubert Gatignon, Dominique Hanssens, Donald Morrison, Sunil Sharma,Piet Vanden Abeele and Linda Van de Gucht for useful comments on an earlier draft of the paper. We are alsoindebted to Andrew Roscoe and Jonathan Tarlin of EMCI, Inc. and Claes Tadne of Ericsson Radio Systemswho supplied industry insight for this research.

"Globalization": Modeling Technology Adoption Timing Across
Countries
1. INTRODUCTION
Virtually every textbook on international or global management has a chapter on
international segmentation strategies. The discussions in these focus on various criteria upon
which managers can cluster countries into homogenous units within which uniform strategies can
be developed. These criteria often involve economic, cultural, or social dispositions. Few, if any,
consider the dynamics of globalization as a fundamental segmentation criterion. The globalization
of any technology implies its adoption by the world's 184 countries located in Africa (55
countries), Asia (37 countries), Europe (32 countries), the Americas (45 countries) and other
regions (15, mostly island, countries): For any given technology, some of these countries will
begin adopting sooner than others. In this paper, we explore the idea that countries can be
characterized along the "innovator" to "laggard" spectrum in a similar way that consumers are
classified for new product segmentation purposes (Robertson 1971). Of interest to international
managers who face dynamic operational and/or resource allocation decisions or who have to
establish strategic priorities, is a basic understanding of factors likely to affect the timing of a
country "adopting", or allowing the importation of a given technology. In our paper, we seek to
introduce a theoretical and modeling framework from which managers and academic researchers
can better understand global adoption dynamics, and identify characteristics that can distinguish
between countries which are, using Rogers' (1983) terminology, "innovators," "early adopters",
"early majority", "late majority", or "laggards".
To illustrate the applied importance of this topic, consider Figure 1 which shows the
aggregate adoption of cellular telephone service (subscriptions) on a worldwide basis. While one
might be tempted to directly explain the dynamics of this aggregate diffusion pattern, this curve
inherently masks an underlying process as yet unresearched in the literature: the breadth of
adoption, or the variability in adoption timing across countries; i.e. when will each individual
1 Countries are defined broadly, in that we also include territories, protectorates or colonies of UnitedNations members which are, however, often represented as being sovereign states in international agencies(e.g. the World Health Organization or the International Olympic Committee). These smaller states aregenerally autonomous, have disputed sovereignty, or are distant from the parent country (e.g. the FalklandIslands, Puerto Rico).
1
country first show, or allow, the sales of the technology? While depth processes (i.e. within-
country diffusion dynamics given the adoption time) have been considered in other studies (e.g.
Gatignon, Eliashberg and Robertson 1989; Takada and Jain, 1991; Helsen et al. 1993; Mahajan and
Muller 1994), we focus on the breadth process which, of course, is a critical necessary condition to
the depth process. Knowing that a country will have a large market potential and fast penetration
rate may be inconsequential to planning if the country will only begin adoption well beyond the
planning horizon (e.g., 10 to 15 years after the technology is originally introduced to the
international community).
Over the past 30 years, the management literature has considered various aspects of
technology diffusion. This literature has failed, however, to consider international breadth
processes which, in contrast, have received substantial attention in other social-science disciplines.
Table 1 presents a summary of an extensive cross-disciplinary review of the literature on the
international diffusion of technologies. Based on a pool of over 6,000 diffusion studies across 16
social science disciplines, 77 studies were found to consider international diffusion. We have
classified these studies as focusing either on the breadth or the depth dimension. The twelve studies
dealing with depth processes generally compare and explain differences across within country
diffusion patterns using a limited sample of countries; 6 studies in management (mostly in
marketing), are of this kind. The vast majority of the 65 other studies (all in other social-science
disciplines) consider breadth processes. The breadth studies are further classified, by discipline, into
three distinct groups: (1) bilateral, (2) multinational, and (3) global. The 19 bilateral studies are
limited in scope as they are concerned with diffusion occurring between two specific countries or
geographic regions. In the economics literature, for example, authors are interested in
understanding barriers to or policies affecting technology transfer between the United States and
Japan, or from developed countries to underdeveloped countries. The 36 multinational studies
consider the sequential diffusion across a small group of countries (e.g. the adoption of technology
standards within the European community). The 10 global studies consider the entire community
of nations, as in our study. All of these studies, however, are qualitative or descriptive discussions
on international diffusion patterns (e.g. European countries seem to adopt technologies prior to
African countries) or on international policies which stand to affect global diffusion (e.g.
discussions on the impact of standard setting bodies, like the International Telecommunications
Union).
2

To summarize, within the management literature, the breadth dimension of international
diffusion has been completely ignored, and within the other social-science disciplines, global studies
on the variability in adoption timing have been largely descriptive or qualitative in nature. Even
though some of these studies have proposed theoretical arguments concerning the likely impact on
a country's adoption timing of a variety of factors, none has formally modelled the process or
empirically tested the resulting hypotheses. To supplement the cross-disciplinary international
diffusion literature in general and the international management literature in particular, we propose
in Section 2 a formal modeling approach which can be used to test a variety of international
diffusion theories (e.g. Gatignon and Robertson 1985; Rogers 1983). In Section 3, we apply the
model to an illustrative example, the cellular telephone industry, and conclude in Section 4 with a
discussion on implementation issues, managerial implications, and areas for future research.
2. A GLOBAL ADOPTION MODEL
2.1 Introduction
Since the 1960s, several aggregate diffusion models have been developed and documented
in the literature which are specifically designed to evaluate technology acceptance over time (see
the reviews in Bridges, Coughlan and Kalish 1991; Lilien, Kotler and Moorthy 1992; Mahajan,
Muller and Bass 1990; Parker 1994; Simon 1989). While aggregate diffusion models are well
suited to study the depth of adoption for one product in one country, they are not very useful to
explain the breadth of technology adoption across countries.
Consider, for example, Figure 2 which shows both the actual number of countries
introducing cellular services in a given year and the number of adopters predicted by the aggregate
diffusion model of Easingwood, Mahajan and Muller (1983). Even though this model gives a
parsimonious description of how fast the technology will be accepted across the world, it does not
help management to understand why certain countries adopt sooner than others. Indeed, aggregate
diffusion models treat each country as a homogenous unit, and cannot explain why some countries
have a higher probability of adopting in a given year than others. Micro-level models relax this
homogeneity assumption, and allow the probability of adoption to be heterogeneous across
potential adopters (Chatterjee and Eliashberg 1990; Sinha and Chandrashekaran 1992). Moreover,
since the unit of analysis is at the individual level, various causal factors which may affect the
individual adoption decision can be included into the model and formally tested. Hannan and
3

McDowell (1984), Sharma (1993), Sharma and Sinha (1991a) and Sinha and Chandrashekaran
(1992), for example, all investigated the impact of firm and market characteristics on the adoption
timing of automated teller machines.
Conceptually, we extend these approaches to international diffusion processes where our
units of observation are countries rather than firms. Methodologically, our model will have a
number of advantages over the aforementioned studies. We will use a flexible hazard model which:
(1) adjusts for the grouped nature of the data, (2) assumes no distributional assumptions with
respect to the form of the baseline hazard, (3) incorporates both time-invariant and time-varying
covariates, (4) corrects for unobserved heterogeneity, and (5) explicitly tests the managerial
assumption that eventually all countries will adopt the technology. While each of these individual
features has been applied before in the literature (see e.g. Helsen and Schmittlein 1993; Jain and
Vilcassim 1991; Sharma 1993; Sinha and Chandrashekaran 1992), our study is the first to
incorporate all of them simultaneously.
2.2 The Model
Let T denote the random duration until a country adopts the technology with probability
density function At) , cumulative distribution function F(t) and hazard function X(t). Yearly
grouping intervals [tk_i , tk), k = 1, 2, ..., m+1, to = 0 and t„, 1 = 00 are defined, and adoption in
duration interval [tk_ak) is recorded as tk. It should be emphasized that tk does not refer to actual
calendar time, but to the number of years elapsed since the system first became available. Cellular
technology, for example, was first tried (but not adopted) on a limited scale by the government of
Qatar in June 1979, which becomes the starting point of our time axis. Japan introduced the
technology by the end of 1979, and is therefore given a duration of one (i.e. they adopted within the
first year the technology was available), while France adopted in 1985, the seventh year.' For those
countries which had not yet adopted a cellular system by September 1990 (the right-censored
observations), a duration of 12 years is recorded.3
2 For 87% of the adopting countries, we know both the year and month of adoption so that we can easilycalculate the associated grouping interval (e.g. France adopted in November 1985, i.e. after 78 months, and isassigned to the seventh grouping interval). For 13% of the adopting countries, only the year of adoption isknown, and for those countries we assume that adoption occurred in the middle of the year (June). None of oursubstantive results was affected, however, when we assumed that adoption occurred at the beginning or end ofthe year.
3 The end of the observation period is September 1990. This enables us to clearly distinguish communistfrom non-communist countries, a distinction which became blurred after the Fall of the Berlin Wall. Going
4

Parameter estimates are obtained through maximum-likelihood estimation, and the
contribution to the likelihood function differs depending on whether or not a country has adopted
cellular technology by the end of the observation period. The contribution to the likelihood
function of country k which adopted the technology in year tk is given by S(tk-1)-S(tk), where the
survivor function S(tk) = 1-F(tk) denotes the probability that the country has not yet adopted the
new technology after tk years. By working with the difference of survivor functions rather than
with the density function, we recognize the discrete nature of the yearly duration intervals. This
adjustment is needed since not accounting for the discrete nature of the data has been shown to
result in inconsistent parameter estimates, with increasing asymptotic bias as the grouping becomes
more coarse (Kiefer 1988; Sharma and Sinha 1991a,b). 4 For country 1 which has not yet adopted
cellular systems by September 1990, the contribution to the likelihood function is given by SO-1),
i.e. we assume that censoring takes place at the beginning of the duration interval. Clearly, some
such assumption is required given the grouping in the data. The contribution to the likelihood
function of any country i can therefore be written as:
(ti) = [s(t, - 1) - S(ti) [s(t, - 1) (1)
where d is an indicator variable which takes the value of one if the country has not yet adopted by
the end of September 1990, and zero otherwise; as such, all 184 countries, whether they have
adopted or not, are contributing to the likelihood function.
To incorporate covariates into the model, we first propose an expression for the hazard
function, and subsequently use a general relationship between a distribution's hazard and survivor
function. We write the hazard function X.i(t), which gives the adoption rate of country i in duration
interval t as:
Xi (t) eP xj(t) ec131(t) (2)
This expression consists of three building blocks. First, X0 gives the adoption rate of countries in
the base group in the first year after the technology's introduction. The base group is defined as
beyond September 1990 would also have affected the sample size in that the national boundaries of a numberof countries have changed.
4 As such, not adjusting for the discrete nature of the data may be fairly inconsequential when working withdaily or weekly data (e.g. Jain and Vilcassim 1991), but may seriously affect the parameter estimates whenworking with annual grouping intervals (e.g. Sinha and Chandrashekaran 1992).
5

those countries for which all covariates, given by the vector Xi(t), are zero. Second, when some of
the covariates are different from zero, the country's hazard is multiplied by exp[0 Xi(t)]. A positive
0 coefficient implies that an increase in the value of the associated covariate augments the
(conditional) adoption probability, or conversely, reduces the expected time until adoption.'
Finally, a set of time-varying dummy variables Di(t) is added to capture a wide variety of time
dependencies. Consider, for example, the situation where a separate dummy is included for every
possible adoption year. The time-varying dummy associated with year three is always zero, except
during year three when it takes the value of one, i.e. its different values are (0 0 1 0 ...). To avoid
identification problems when simultaneously estimating c 1 and X0, no dummy variable is included
for the first year. As such, Xo reflects the adoption rate of the base group in the first period, and
positive (negative) c-coefficients for the other intervals indicate a higher (lower) adoption rate
compared to that first year. This approach makes no distributional assumption with respect to the
nature of the time dependence, and is therefore called non-parametric (Vanhuele et al. 1995). The
only assumption made is that within a grouping interval (e.g. a year) the hazard remains constant.
Intuitively, this is equivalent to a piece-wise approximation of an underlying, possibly very complex,
continuous time-dependence pattern. Its main advantage is that it results in consistent parameter
estimates even when the true form of the baseline is unknown. In contrast, an incorrect parametric
specification results in inconsistent parameter estimates (Meyer 1990). Because of the variability in
the observed durations (ranging from one to twelve years), the small number of adopting countries
(63), and the need to have a sufficient number of adoptions in any given period to reliably estimate
the associated c-parameter, we limit in our empirical application the number of discrete jumps in the
baseline hazard. Rather than allowing for a different c-parameter in every year, we allow for a
discrete shift after every three years.'
To estimate the parameters of interest, an expression for the survivor function Si(t)
associated with the hazard in (2) is needed. It can be shown (see e.g. Lancaster 1990) that:
Si (t) = e- io Xi(u)du (3)
When the time-varying covariates are assumed to remain constant within a given year, but are
allowed to vary from year to year, (3) can be written as (Gupta 1991, Vanhuele et al. 1995):
5 Specifically, when the j-th covariate changes by one unit, the hazard changes by [exp(13;)-1)]*100 percent.6 Our substantive findings were not affected by this choice, and similar results were obtained when working
with shifts after two or four years.
6
Si (t) = e- B i(t), where (t) = E tri e° xi(i) D1(j) (4)
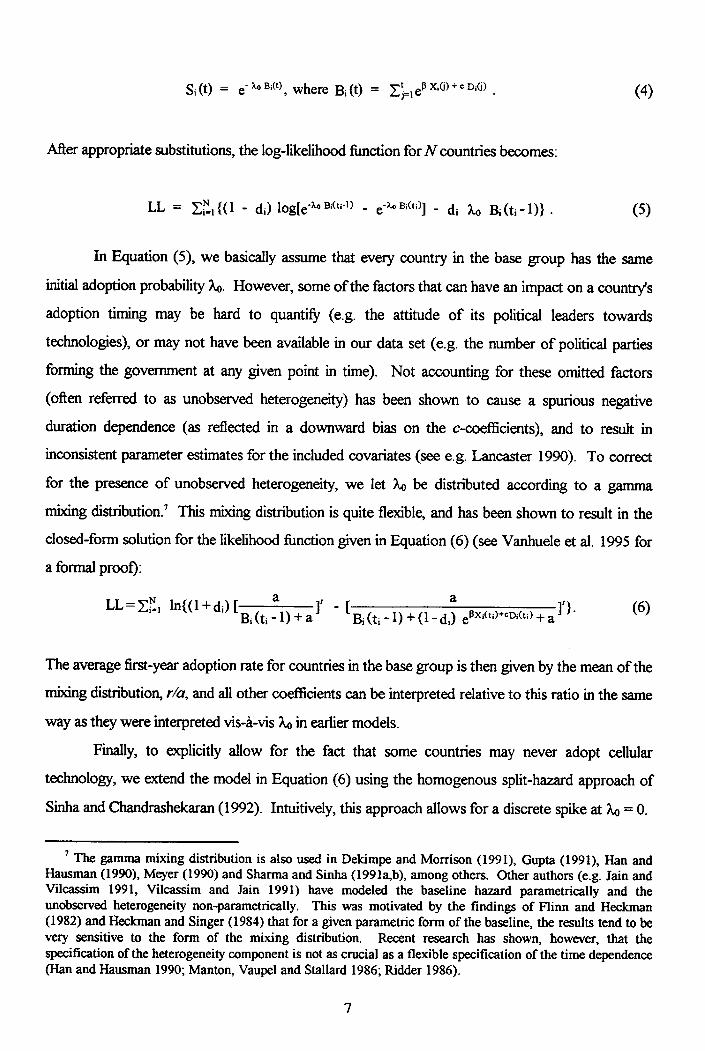
After appropriate substitutions, the log-likelihood function for N countries becomes:
LL = - di) loge-A. _ - di Bi(ti-1)} • (5)
In Equation (5), we basically assume that every country in the base group has the same
initial adoption probability Ao. However, some of the factors that can have an impact on a country's
adoption timing may be hard to quantify (e.g. the attitude of its political leaders towards
technologies), or may not have been available in our data set (e.g. the number of political parties
forming the government at any given point in time). Not accounting for these omitted factors
(often referred to as unobserved heterogeneity) has been shown to cause a spurious negative
duration dependence (as reflected in a downward bias on the c-coefficients), and to result in
inconsistent parameter estimates for the included covariates (see e.g. Lancaster 1990). To correct
for the presence of unobserved heterogeneity, we let 7b be distributed according to a gamma
mixing distribution.' This mixing distribution is quite flexible, and has been shown to result in the
closed-form solution for the likelihood function given in Equation (6) (see Vanhuele et al. 1995 for
a formal proof):
LL = El!, ln(0+ di) Bi a 1)+a
r
( iti - 1) +a
e lbCi(ti)+cD.(ti)± a n.
The average first-year adoption rate for countries in the base group is then given by the mean of the
mixing distribution, r/a, and all other coefficients can be interpreted relative to this ratio in the same
way as they were interpreted vis-a-vis X.0 in earlier models.
Finally, to explicitly allow for the fact that some countries may never adopt cellular
technology, we extend the model in Equation (6) using the homogenous split-hazard approach of
Sinha and Chandrashekaran (1992). Intuitively, this approach allows for a discrete spike at X = 0.
7 The gamma mixing distribution is also used in Dekimpe and Morrison (1991), Gupta (1991), Han andHausman (1990), Meyer (1990) and Sharma and Sinha (1991a,b), among others. Other authors (e.g. Jain andVilcassim 1991, Vilcassim and Jain 1991) have modeled the baseline hazard parametrically and theunobserved heterogeneity non-parametrically. This was motivated by the findings of Flinn and Heckman(1982) and Heckman and Singer (1984) that for a given parametric form of the baseline, the results tend to bevery sensitive to the form of the mixing distribution. Recent research has shown, however, that thespecification of the heterogeneity component is not as crucial as a flexible specification of the time dependence(Han and Hausman 1990; Manton, Vaupel and Stallard 1986; Ridder 1986).
(6)
7

The magnitude of this spike allows us to test the managerial intuition that in the long run all
countries will adopt the technology. Following Sinha and Chandrashekaran (1992), we define an
indicator variable Ai, where Ai is equal to one if the country belongs to the group of eventual
adopters, and zero otherwise. If the probability of A i=1 (denoted as 5 i) is assumed to be
homogeneous across all countries (i.e. 5 i=5), it can be interpreted as the fraction of countries that
will adopt in the long run. A likelihood-ratio test can subsequently be used to test the managerial
intuition that 5 is equal to one in the cellular-telephone industry.
Using a similar logic as in Sinha and Chandrashekaran, but making an adjustment for the
discrete nature of the data, it is easy to show that the likelihood function for N countries is given by:
L = nr=1 {8 {Si (ti - 1 ) - Si (ti)] * - 8) + 5 S, (t, - } di (7)
If all countries which will eventually adopt have the same X0, one can substitute equation (4) into
(7) to derive a split hazard model which does not yet correct for unobserved heterogeneity among
the eventual adopters. In order to account for this heterogeneity, one can again let X0 be distributed
according to a gamma mixing distribution. After lengthy derivations, the following expression for
the log-likelihood function is obtained (see Van de Gucht 1994):
LL= ln{R1 - di) Bi (ti - 1) + a ]r R1 - di) Bi (ti) + a r (8)
8( 1 + di) ar 5 a' [Bi (ti - 1 ) + ar (ti - 1) + (1 - di) ei3xicto ++cimti) ar }'
where all variables are defined as before.
An alternative way to allow for the possibility that adoption will never take place for some
countries is to work with a degenerate parametric density function, such as the Inverse Gaussian, to
describe the baseline hazard. In those instances, S(t)>0 (see Lancaster 1990). This offers
less flexibility in modeling various forms of time dependence, however, does not ensure the
consistency of the parameter estimates (as the a priori parametric form may be incorrect), and does
not allow to characterize which countries are most likely to never adopt. When working with the
split-hazard specification, on the other hand, one may replace S by 5; in (8), where
15, –
[1 + exp(aX i )]
N(81-d1- 8) (1 + di) ar- 8) ar
(9)
8
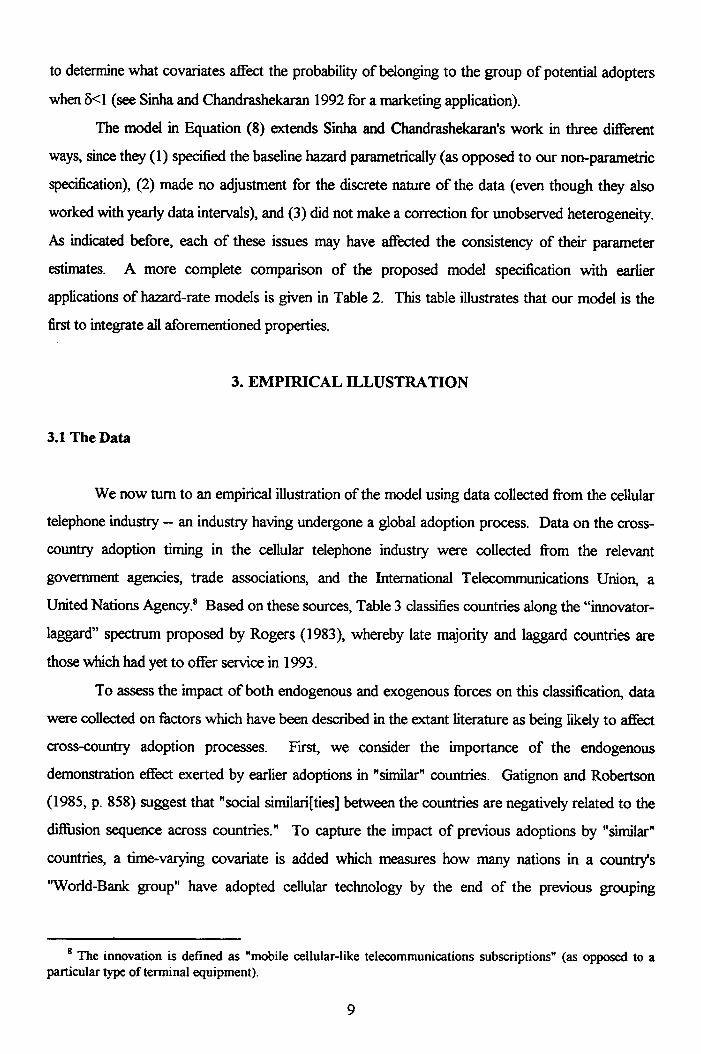
to determine what covariates affect the probability of belonging to the group of potential adopters
when 5<1 (see Sinha and Chandrashekaran 1992 for a marketing application).
The model in Equation (8) extends Sinha and Chandrashekaran's work in three different
ways, since they (1) specified the baseline hazard parametrically (as opposed to our non-parametric
specification), (2) made no adjustment for the discrete nature of the data (even though they also
worked with yearly data intervals), and (3) did not make a correction for unobserved heterogeneity.
As indicated before, each of these issues may have affected the consistency of their parameter
estimates. A more complete comparison of the proposed model specification with earlier
applications of hazard-rate models is given in Table 2. This table illustrates that our model is the
first to integrate all aforementioned properties.
3. EMPIRICAL ILLUSTRATION
3.1 The Data
We now turn to an empirical illustration of the model using data collected from the cellular
telephone industry — an industry having undergone a global adoption process. Data on the cross-
country adoption timing in the cellular telephone industry were collected from the relevant
government agencies, trade associations, and the International Telecommunications Union, a
United Nations Agency.' Based on these sources, Table 3 classifies countries along the "innovator-
laggard" spectrum proposed by Rogers (1983), whereby late majority and laggard countries are
those which had yet to offer service in 1993.
To assess the impact of both endogenous and exogenous forces on this classification, data
were collected on factors which have been described in the extant literature as being likely to affect
cross-country adoption processes. First, we consider the importance of the endogenous
demonstration effect exerted by earlier adoptions in "similar" countries. Gatignon and Robertson
(1985, p. 858) suggest that "social similarities] between the countries are negatively related to the
diffusion sequence across countries." To capture the impact of previous adoptions by "similar"
countries, a time-varying covariate is added which measures how many nations in a country's
"World-Bank group" have adopted cellular technology by the end of the previous grouping
8 The innovation is defined as "mobile cellular-like telecommunications subscriptions" (as opposed to aparticular type of terminal equipment).
9

interval.9 The World Bank defines nine categories of countries which are similar in terms of a
number of socioeconomic and political variables; 156 countries fit into one of these categories.
Rather than combining the remaining 28 countries in an "others" category (which would imply
considering Cuba and Monaco as similar countries), we will test the impact of this endogenous
factor on the more restricted data set of 156 countries. Countries also have political and economic
ties with countries outside their World-Bank group. The demonstration effect from adoptions in
those countries will be reflected in the baseline hazard, which is therefore expected to increase over
time (Helsen and Schmittlein 1993; Sharma and Sinha 1991a). We also consider the following
exogenous forces motivated in the literature, discussed below: political disposition (communist or
not), socioeconomic characteristics (GNP per capita, crude death rate, population growth), social-
system homogeneity (number of ethnic groups) and population concentration (number of major
population centers). The data covering these covariates were collected from Euromonitor Ltd. and
the World Factbook (Central Intelligence Agency, 1993). Relevant summary statistics are
presented in Table 4. 1 ° The highest correlation between the respective variables does not exceed
0.4, suggesting that multicollinearity is not a problem.
3.2 Estimation and Hypothesis Testing
Parameter estimates for a number of different model specifications are given in Table 5. In
Table 5, we impose the managerial assumption that all countries will eventually adopt; we will test
that assumption later on. The first column of Table 5 presents the estimates for a model which
explicitly accounts for unobserved heterogeneity (Eq. 6), but which does not yet include the time-
varying proportion of earlier adoptions in a country's World-Bank group. It is found that non-
communist countries, with a high GNP per Capita, a low crude death rate, few ethnic groups and
many major population centers tend to be early adopters of cellular technology. Most estimates
have the signs that could be expected on the basis of diffusion theory and/or managerial intuition for
this technology. The diffusion literature has argued that a society's adoption timing is related to its
standard of living and stage of economic development (Antonelli 1993; Gatignon and Robertson
1989), for which gross national product (wealth) and crude death rate (poverty) are main indicators
9 Since June 1979 is the start of our time axis, we computed the percentage of adopters in each World-Bankcategory in May 1980, May 1981, etc. Percentages are used to correct for the fact that not all groups have thesame number of countries.
10 As data on 184 countries are difficult to collect on a year-to-year basis, we treat the exogenous covariatesas time-invariant, i.e. we assume that they did not vary in a systematic fashion over the considered time span.
10
(Helsen et al. 1993). Similarly, several case studies have shown that the planned economies of the
Soviet Union and Eastern Europe tend to lag in the adoption of new technologies (see e.g. Amann
and Cooper 1982; Berliner 1976; Leary and Thornton 1989). With respect to the negative impact
of the number of ethnic groups, Gatignon and Robertson (1985) argue that homogenous social
systems (for which we use the number of ethnic groups as a proxy) tend to be characterized by
faster (and in our case, earlier) diffusion rates. Several managers in the industry argue that the
relative advantage of cellular phone systems over existing technologies is directly related to the
number of urban areas or major population centers, which explains the positive parameter estimate
for this covariate. Population growth (a surrogate for the need to expand the telecommunications
infrastructure), on the other hand, had no significant impact on the countries' adoption timing.
The increasing baseline hazard in this model captures the "demonstration" (Mansfield 1968,
Sharma and Sinha 1991a) or "snowball" (Helsen and Schmittlein 1993) effect resulting from
previous adoptions within and outside a country's World-Bank group: as more countries have
adopted the technology, the uncertainty surrounding its value diminishes since potential adopters
can benefit from the experience of the earlier adopters.
In Model 2, no adjustment for unobserved heterogeneity is made. Even though the signs of
the respective coefficients are not affected, we see that the magnitude of the parameter estimates is
somewhat larger when this correction is made. Accounting for unobserved heterogeneity therefore
seems to eliminate (some of) the attenuating effects of the omitted variables. Note in this respect
that the number of ethnic groups in the country only has a significant impact when correcting for
unobserved heterogeneity. Also the demonstration effect is much more pronounced in Model 1,
since the downward bias caused by the spurious aggregation effect has been reduced by adding the
gamma mixing distribution. This phenomenon is illustrated further in Figure 3 where we use the
parameter estimates from Model 1 and 2 to derive the hazard rate for an "average" non-communist
country.
To obtain further insights into the relative importance of the demonstration effect, we
explicitly account for the proportion of previous, similar adopters in Model 4. As indicated before,
the World-bank classification which is used as a measure of similarity is only available for 156
countries. To enhance the comparability with the previous models, we re-estimated Model 1 on
this restricted sample (see Model 3 in Table 5), and found the results to be very similar across the
two samples. The main difference appears in the initial base hazard (r/a) which becomes larger
when estimated on 156 countries. Some face validity for this result is obtained when noting that
11

only 7 of the omitted countries had adopted the technology, and that those seven all did so shortly
before the end of the observation period. Put differently, they appear to have been "lagging" in
their adoption decision, and their omission from the sample caused an increase in the average
hazard for the remaining countries. Consistent with the hypothesis that there is a strong
demonstration effect among "similar" countries, a significant positive parameter estimate is
obtained. In terms of the economic significance of the estimate, a country's hazard in any given
year is 43.1 (104.7) percent higher when one fourth (half) of the countries in its World-Bank group
have adopted the technology than if none had done so. Also, the baseline hazard in Model 4 only
reflects the demonstration effect by non-member countries, and is not as steep as in Model 3.
Finally, we estimated a split-hazard model (both with and without gamma mixing
distribution) to test whether, as managers in the industry expect, all 156 countries will eventually
adopt. The parameter estimate for the proportion of ultimate adopters (the parameter 5) converged
to one in both cases, and for the split-hazard model with unobserved-heterogeneity correction, the
same parameter estimates as in Model 4 were obtained. As such, in the long run, all countries will
likely adopt cellular-telephone networks.
Summarizing this illustrative study, we have relaxed the homogeneity assumption common
to aggregate diffusion models, and assessed which covariates affect a country's adoption timing. In
addition to demonstrating the approach's flexibility to incorporate theoretical paradigms, our
particular application indicates that planned economies lag in allowing technologies, and that
homogenous countries with a high level of economic development and population concentration
are, on average, earlier adopters. Support was also found for the demonstration effect of earlier
adoptions: the baseline hazard increases over time, and adoptions by countries significantly increase
the likelihood of "similar" countries adopting (World Bank group members). Moreover, we
provided empirical support for the managerial intuition that eventually all countries will adopt
cellular technology.
4. CONCLUDING REMARKS
This paper studied global adoption processes, or the timing of initial adoption at the
country level (breadth). We illustrated the application of our approach to the global adoption of
cellular telephone systems across 184 countries.
12

4.1. Pragmatic Considerations
Our approach allows researchers to rigorously test a number of hypotheses/theories,
whether generated by the academic community, managers, or economic planners. There are,
however, a number of pragmatic issues associated with generating and testing international theories
of diffusion which should be kept in mind. First, specific theories or hypotheses ultimately depend
on the category under consideration, even though general diffusion and economic theories can offer
the overall framework. For example, in their study of cross-European diffusion patterns for
household appliances, Gatignon et al. (1989) propose that diffusion patterns for time-saving
technologies are a function of the country's sex roles, or the percentage of women in the labor
force. While this might appear plausible for dishwashers and deep freezers, it is not clear that this
proposition is (or should be) a useful hypothesis for all technologies (e.g. nuclear submarines). As
such, we do not claim that the covariates included in our study should be equally relevant for all
other technologies. Our empirical results should be interpreted as an illustration of how a variety of
hypotheses can be tested rigorously, rather than as empirical generalizations. Second, a practical
problem in testing "global theories" is the need to use globally representative proxies. As applied
international researchers are well aware, the requirement to use covariates which measure
international differences across 184 countries leaves us with a limited set of variables (e.g. basic
socioeconomic characteristics). As a consequence, some of the factors which could potentially
have an impact on, say, the adoption timing were not included in the model because their values
were only available for a small fraction of the countries," and also the development of multi-item
scales was infeasible.
4.2. Extensions
While the modeling approach suggested is quite general, we have illustrated it on an
industry undergoing a decentralized process. Indeed, the manufacturers themselves did not
determine when sales would begin in a specific country. Instead, local governments determined
from what point in time the technology was allowed to be introduced in their country. Such
processes are likely to exist for a wide variety of technologies or products such as most medical
11 As indicated before, this makes a correction for unobserved heterogeneity an important property of ourhazard specification.
13

products, telecommunication services, energy-supply systems, electronic products which must meet
local type approval, cosmetics, or any other packaged consumer goods which require government
approval or face non-tariff barriers. For other industries, global cross-country diffusion may be the
result of what Rogers (1983) calls a centralized process whereby the firm (i.e. the change agent)
systematically determines where the technology should be sold next. When firms themselves plan
the introduction sequence (i.e. when dealing with centralized processes), one can still use the
proposed modeling techniques as research tools, though the nature of the explanatory variables may
be somewhat different. Clearly, the use of the proposed modeling approach should be extended to
such processes.
Finally, we have applied the model to a typical "high technology" industry. Future research
is warranted on generating empirical generalizations with respect to cross-country adoption
patterns. Do most categories undergo international diffusion patterns? Are the "innovative"
countries similar across categories (similarly for the other categories of adopters identified by
Rogers)? If there is variance across categories, what factors explain these differences? We leave
these questions to future research.
14

References
Amami, R. and J.M. Cooper (1982), Industrial Innovation in the Soviet Union, New Heaven: YaleUniversity Press.
Antonelli, C. (1993), "Investment and Adoption in Advanced Telecommunications," Journal ofEconomic Behavior and Organization, 20, 227-245.
Berliner, J. (1976), The Innovation Decision in the Soviet Industry, Cambridge, Mass: MIT Press.
Bridges, E., A.T. Coughlan and S. Kalish (1991), "New Technology Adoption in an InnovativeMarketplace: Micro- and Macro-level Decision Making Models," International Journal ofForecasting, 7, 257-270.
Chatterjee, R. and J. Eliashberg (1990), "Innovation Diffusion Process: A Micro-ModelingApproach," Management Science, 36, 1057-1079.
Dekimpe, M.G. and D.G. Morrison (1991), "A Modeling Framework for Analyzing Retail StoreDurations," Journal of Retailing, 67, 68-92.
Easingwood, C.J., V. Mahajan and E. Muller (1983), "A Nonuniform Influence InnovationDiffusion Model of New Product Acceptance," Marketing Science, 2, 273-296.
Gatignon, H., J. Eliashberg and T.S. Robertson (1989), "Modeling Multinational DiffusionPatterns: An Efficient Methodology," Marketing Science, 8, 231-247.
Gatignon, H. and T.S. Robertson (1985), "A Propositional Inventory for New Diffusion Research,"Journal of Consumer Research, 11, 849-867.
GOntil, F. and K. Srinivasan (1993), "Consumer Purchase Behavior in a Frequently Bought ProductCategory: Estimation Issues and Managerial Insights from a Hazard Function Model withHeterogeneity," Journal of the American Statistical Association, 88, 1219-1227.
Gupta, S. (1991), "Stochastic Models of Interpurchase Time with Time-Dependent Covariates,"Journal of Marketing Research, 28, 1-15.
Hannan, T. and J.M. McDowell (1984), "The Determinants of Technology Adoption: The Case ofthe Banking Firm," Rand Journal of Economics, 15, 328-335.
Helsen, K., Jedidi, K. and W.S. DeSarbo (1993), "A New Approach to Country SegmentationUtilizing Multinational Diffusion Patterns," Journal ofMarketing, 57, 60-71.
Helsen, K. and D.C. Schmittlein (1993), "Analyzing Duration Times in Marketing: Evidence for theEffectiveness of Hazard Rate Models," Marketing Science, 11, 395-414.
Helsen, K. and D.C. Schmittlein (1994), "Understanding Price Effects for New Nondurables: HowPrice Responsiveness Varies Across Depth-of-Repeat Classes and Types of Consumers,"European Journal of Operations Research, 76, 359-374.
15

Jain, D.C. and N. Vilcassim (1991), "Investigating Household Purchase Timing Decisions: AConditional Hazard Function Approach," Marketing Science, 10, 1-23.
Kiefer, N.M. (1988), "Analysis of Grouped Duration Data," in N.U. Prabhu (Ed.), StatisticalInference from Stochastic Processes, Providence: American Mathematical Society.
Lancaster, T. (1990). The Econometric Analysis of Transition Data. Cambridge: CambridgeUniversity Press.
Leary, N.A. and J. Thornton (1989), "Are Socialist Industries Inoculated Against Innovation? ACase Study of Technological Change in Steelmaking," Comparative Economic Studies, 31,42-65.
Lilien, G.L., P. Kotler and K.S. Moorthy (1992), Marketing Models, Englewood Cliffs, NJ:Prentice Hall.
Mahajan, V. and E. Muller (1994), "Innovation Diffusion in a Borderless Global Market: Will the1992 Unification of the European Community Accelerate Diffusion of New Ideas, Productsand Technologies," Technological Forecasting and Social Change, 45, 221-237.
Mahajan, V., E. Muller and F.M. Bass (1990), "New Product Diffusion Models in Marketing: AReview and Directions for Research," Journal of Marketing, 54, 1-26.
Mansfield, E. (1968), Industrial Research and Technological Innovation: An EconometricAnalysis, New York: W.W. Norton and Co.
Meyer, B.D. (1990), "Unemployment, Insurance and Unemployment Spells," Econometrica, 58,757-782.
Parker, P.M. (1994), "Aggregate Diffusion Models in Marketing: A Critical Review," InternationalJournal of Forecasting, 10, 1994, 353-380.
Robertson, T.S. (1971), Innovative Behavior and Communication, New York: Holt, Rinehart andWinston.
Rogers, E.M. (1983), Diffusion of Innovations, New York: The Free Press.
Sharma, S. (1993), "Behind the Diffusion Curve: An Analysis of ATM Adoption," Working Paper,Department of Economics, UCLA.
Sharma, S. and R.K. Sinha (1991a), "Firm Characteristics, Market Structure and the Dynamics ofTechnology Diffusion: A Semiparametric Econometric Model," Working Paper,Department of Economics, UCLA.
Sharma, S. and R.K. Sinha (1991b), "Firm Characteristics and the Diffusion of InformationTechnology," Working Paper, Department of Economics, UCLA.
Simon, H. (1989), Price Management, North Holland, Elsevier Science Publishers: Amsterdam.
16
Sinha, R.K. and M. Chandrashekaran (1992), "A Split Hazard Model for Analyzing the Diffusionof Innovations," Journal of Marketing Research, 24, 116-127.
Takada, H. and D. Jain (1991), "Cross-National Analysis of Diffusion of Consumer Durable Goodsin Pacific Rim Countries," Journal of Marketing, 55, 48-54.
Van de Gucht, L.M. (1994), "Leveraged Buyouts: An Empirical Examination of the Decision toReturn to Public Status," Unpublished Ph.D. Dissertation, University of South Carolina.
Vanhuele, M., M.G. Dekimpe, S. Sharma and D.G. Morrison (1995), "Probability Models forDuration: The Data Don't Tell the Whole Story," Organizational Behavior and HumanDecision Processes, 62, 1-13.
17

Table 1. Cross-Disciplinary Summary of International Studies of Technology Diffusion
Discipline
Breadth Studies
Depth Studies Bilateral Multinational Global
Biotechnology 1Demography 1Development Economics 7 7 1Ecology 1Economic History 2 2 6Economics 4 1 14Forecasting 1Geography 1Industrial Economics 1 2 2 1Law 1Management 6Political Science 2 1 2Public Health 1 2 6Urban Studies 1
Total 12 19 36 10
Note: Details on the included studies are available from the authors upon request.

Table 2. Summary of Hazard-rate Models in Marketing
Study Covariates Correction forGrouped Nature
NonparametricBaseline Hazard
UnobservedHeterogeneity
Split Hazard
Dekimpe and Morrison (1991) No Yes No Gamma No
GOniil and Srinivasan (1993) Yes No Yes Fixed effects/ NoGamma
Gupta (1991) Yes No No Gamma No
Hannan and McDowell (1984) Yes Yes No No No
Jain and Vilcassim (1991) Yes No No Normal/ NoNonparametric
Sharma (1993) Yes Yes Yes Gamma No
Sharma and Sinha (1991 a, b) Yes Yes Yes Gamma No
Sinha and Chandrashekaran (1992) Yes No No No Yes
Helsen and Schmittlein (1993) Yes No No No No
Helsen and Schmittlein (1994) Yes No No No No
Vilcassim and Jain (1991) Yes No No Nonparametric No
Present Study Yes Yes Yes Gamma Yes

Table 3. Diffusion of Cellular Services Across Countries
Early Majority (33%)
Algeria
American Samoa
Argentina
Bahamas
Bangladesh
Belgium
Bermuda
Bolivia
Botswana
Brazil
Brunei
Bulgaria
Cayman Islands Late Majority and Laggards (51%)
Chile Afghanistan Malawi
China, People's Rep Albania Maldives
Colombia Andorra Mali
Costa Rica Angola Martinique
Cyprus Antigua & Barbuda Mauritania
Czechoslovakia Barbados Monaco
Dominican Republic Belize Mongolia
Ecuador Benin Mozambique
Egypt Bhutan Namibia
El Salvador Burkina Faso Nauru
Fiji Burma Nepal
Gabon Burundi Netherlands Antilles
Ghana Cambodia New Caledonia
Greece Cameroon NicaraguaGuatemala Cape Verde NigerHonduras Central African Rep Papua New Guinea
Hungary. Chad Puerto Rico
India Comoros Qatar
Kenya Congo Reunion
Laos Cote D'Ivoire RwandaLebanon Cuba Sahara, Western
Macau Djibouti San MarinoMalta Dominica Sao Tome E PrincipeMauritius East Germany Senegal
Early Adopter (12%) Mexico Equatorial Guinea Seychelles
Australia Morocco Ethiopia Sierra Leone
Austria New Zealand Falkland Islands Solomon Islands
Bahrain Nigeria French Guiana Somalia
Canada Pakistan French Polynesia St. Lucia
France Panama Greenland St. Vincent & the Gr
Germany (west) Paraguay Grenada Sudan
Iceland Peru Guadeloupe Suriname
Ireland, Republic of Philippines Guam Swaziland
Israel Poland Guinea Syrian Arab RepublicItaly Portugal Guinea-Bissau Tanzania
Kuwait Romania Guyana The Gambia
Luxembourg Singapore Haiti Togo
Malaysia Sri Lanka Iran, I.R. of Tuvalu
Innovator (4%) Netherlands St. Kitts and Nevis Iraq Uganda
Denmark Oman Switzerland Jamaica United Arab Emirates
Finland South Africa Ta iwan Jordan USSR (Former)
Indonesia South Korea Tonga Kiribati Vanuatu
Japan Thailand Trinidad & Tobago Lesotho Virgin Islands, USNorway Tunisia Uruguay Liberia Western Samoa
Saudi Arabia Turkey Venezuela Libya Yugoslavia
Spain United Kingdom Vietnam Liechtenstein Zambia
Sweden _United States Zaire Madagascar Zimbabwe
Time

Table 4. Summary Descriptive Statistics of Exogenous Covariates (N = 184 countries)
Covariate Means STDV Min. Max.
Demographic FactorsAvg. Annual Pop. Growth Rate 2.0 1.3 -0.6 6.3No. of Major Population Centers 8.0 4.0 1.0 19.0
Economic FactorsGNP per Capita ($000) 5,065.0 7,488.0 71.0 50,000.0Crude Death Rate 9.4 4.4 2.0 23.0Communism 0.1 0.3 0.0 1.0
Social System FactorsNo. of Ethnic Groups 5.0 2.6 1.0 15.0
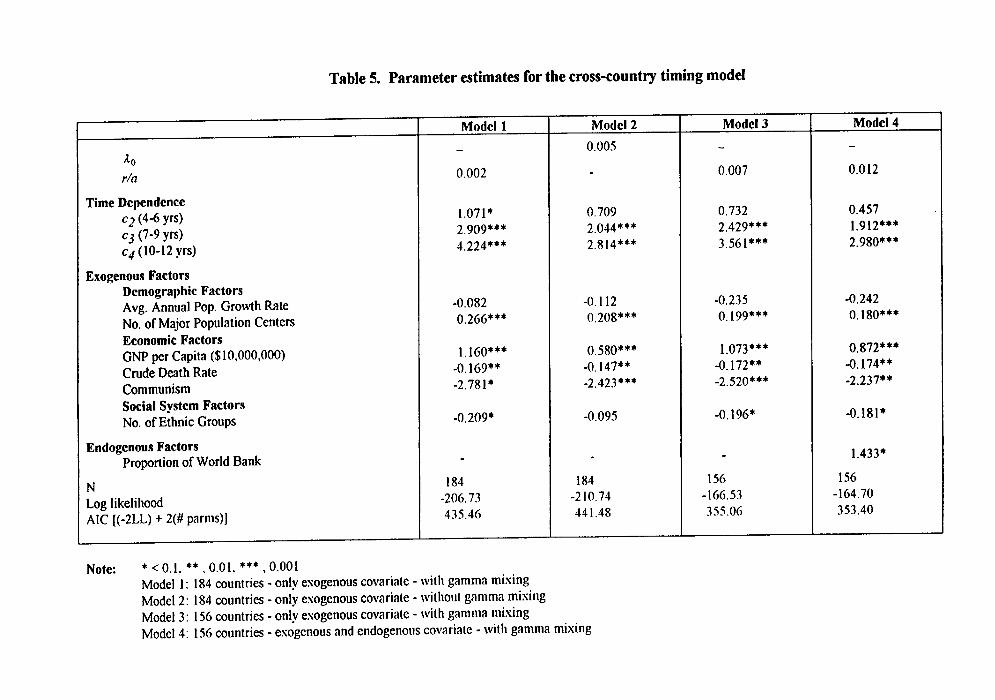
Table 5. Parameter estimates for the cross-country timing model
Model 1 Model 2 Model 3 Model 4
0.005'tor/a 0.002 0.007 0.012
Time Dependencec2 (4-6 yrs)c3 (7-9 yrs)c4 (10-12 yrs)
1.071*2.909***4.224***
0.7092.044***2.814***
0.7322.429***3.561***
0.4571.912***2.980***
Exogenous FactorsDemographic FactorsAvg. Annual Pop. Growth RateNo. of Major Population Centers
-0.0820.266***
-0.1120.208***
-0.2350.199***
-0.2420.180***
Economic FactorsGNP per Capita ($10,000,000)Crude Death RateCommunism
1.160***-0.169**-2.781*
0.580***-0.147**-2.423***
1.073***-0.172**-2.520***
0.872***-0.174**-2.237**
Social System FactorsNo. of Ethnic Groups -0.209* -0.095 -0.196* -0.181*
Endogenous FactorsProportion of World Bank
• 1.433*
NLog likelihoodAIC [(-2LL) + 2(# parms)]
184-206.73435.46
184-210.74441.48
156-166.53355.06
156-164.70353.40
* < 0.1, ** 0.01, *** , 0.001Model 1: 184 countries - only exogenous covariate - with gamma mixingModel 2: 184 countries - only exogenous covariate - without gamma mixingModel 3: 156 countries - only exogenous covariate - with gamma mixingModel 4: 156 countries - exogenous and endogenous covariate - with gamma mixing
Note:

Figure 1. Worldwide Adoption of Cellular Subscriptions
25,000 -
■/
20,000 -
1313.C
2 15,000 -
12"u
13 10,000 -//
5,000 -
0 •
1979 1980 1981 1982 1983 1984 1985 1986 1987 1988 1989 1990 1991 1992Year

1111 Actual
0 Predicted
<C) COCD CD CDCD C:) CDCV CV CV
IOO
Figure 2. Country Adoption of Cellular Telephone Systems
First - Time Adoption
14 -
12 -
C7,10
O
111
-o8 —N
6 -
4
2 -.-
0
1 1 1 1 1 1 1 1 1
CIZr' C.0 CO C) CO CO CD
ONO CO c0 c0 C CI C Cr)
ol C crl c-7) C CT c)
Year of First - Time Adoption
Cummulative Adoption
180
-160 -on 140
72E120 -
1 0 ——
.74:.CU 80 -.:w
60 -EC_) 40 -
20 -
0Gil N •.1" CID CO C) (C) co C)N- oc) co co co C 0-, cr)cr a' o Cr' cr, cr, CT)
cN4
Year of Cummulative Adoption
—r
C• C=,r,.
111 Actual
Predicted

Figure 3. Evolution of the Hazard Rate
• •
■ ■
1 2 3 4 5 6 7
8 9 10 11 12
Time (years since introduction)
--e— Model 1 —a—Model 2
Note: The "average" non-communist country considered has a GNP per Capita of 5,065, a crudedeath rate of 9.4, 5 ethnic groups and 8 major population centers.Model 1: with correction for unobserved heterogeneityModel 2: without correction for unobserved heterogeneity