global warming science, lecture 14 - mit opencourseware · direct radiative effect . ipcc and...
TRANSCRIPT

Aerosols
12.340 Global Warming Science April 3, 2012 Dan Cziczo
Reading: IPCC 2007 2.4
(www.ipcc.ch/publications_and_data/ar4/wg1/en/ch2s2-4.html)
1

Today’s Class • What are aerosols? Where are they from? • Why should we care about aerosols? • How do aerosols affect radiation? • How do we measure aerosol? • Optical depth (taero) and direct radiative effect (DRE) • How much aerosol is there? How much is anthropogenic? (soot and lead) • Best estimates of the anthropogenic direct effect
2

What are Aerosols?
Seinfeld and Pandis, Atmospheric Chemistry and Physics 3
An aerosol that impedes vision and may consists of a combination of water droplets, pollutants, and dust. DP < 1 µm.
Suspensions of solid particles produced by mechanical disintegration of material such as crushing, grinding, and blasting. DP > 1 µm.
A loose term applied to visible aerosols in which the dispersed phase is liquid. Usually, a dispersion of water or ice, close to the ground.
The solid particles generated by condensation from the vapor state, generally after volatilization from melted substances, and often accompanied by a chemical reaction such as oxidation. Often the material involved is noxious. DP < 1 µm.
Liquid, usually water in the form of particles suspended in the atmosphere at or near the surface of the Earth; small water droplets floating or falling, approaching the form of rain, and sometimes distinguished from fog as being more transparent or as having particles perceptibly moving downward. DP > 1 µm.
An aerosol particle may consist of a single continuous unit of solid or liquid containing many molecules held together by intermolecular forces and primarily larger than molecular dimensions (> 0.001 µm). A particle may also be considered to consist of two or more such unit structures held together by interparticle adhesive forces such that it behaves as a single unit in suspension or upon deposit.
A term derived from smoke and fog, applied to extensive contamination by aerosols. Now sometimes used loosely for any contamination of theair.
Small gas-borne particles resulting from incomplete combustion, consisting predominantly of carbon and other combustible material, and present in sufficient quantity to be observable independently of the presence of other solids. DP > 0.01 µm.
Agglomerations of particles of carbon impregnated with "tar," formed in theincomplete combustion of carbonaceous material.
An aerosol that impedes vision and may consist of combination of water droplets, pollutants and dust. DP > 1 µm.
Soot
Dusts
Fog
Fume
Hazes
Mists
Smog
Smoke
Aerosols, aerocolloids, aerodisperse systems
Particle
Tiny particles dispersed in gases
Table : Terminology Relating to Atmospheric Particles
Image by MIT OpenCourseWare.

Where do aerosols come from?
From ‘new particle formation’ (normally sub-micrometer) and mechanical processes (normally super-micrometer) Particles evolve by interaction with each other and the gas phase Ultimate removal by gravity, deposition and clouds (precipitation)
Seinfeld and Pandis, Atmospheric Chemistry and Physics
This image has been removed due to copyright restrictions. Please see Figure 2.15,Seinfeld, John H., Spyros N. Pandis. Atmospheric Chemistry and Physics - From AirPollution to Climate Change. 2nd ed. John Wiley & Sons, © 2006.
4

New Particle Formation
This image has been removed due to copyright restrictions. The image is from Iida et al. JGR (2008).
5

Combustion
These images have been removed due to copyright restrictions. The images arefrom Li et al. JGR (2003) and J. J. Helble, Journal of Aerosol Science (1998).
6
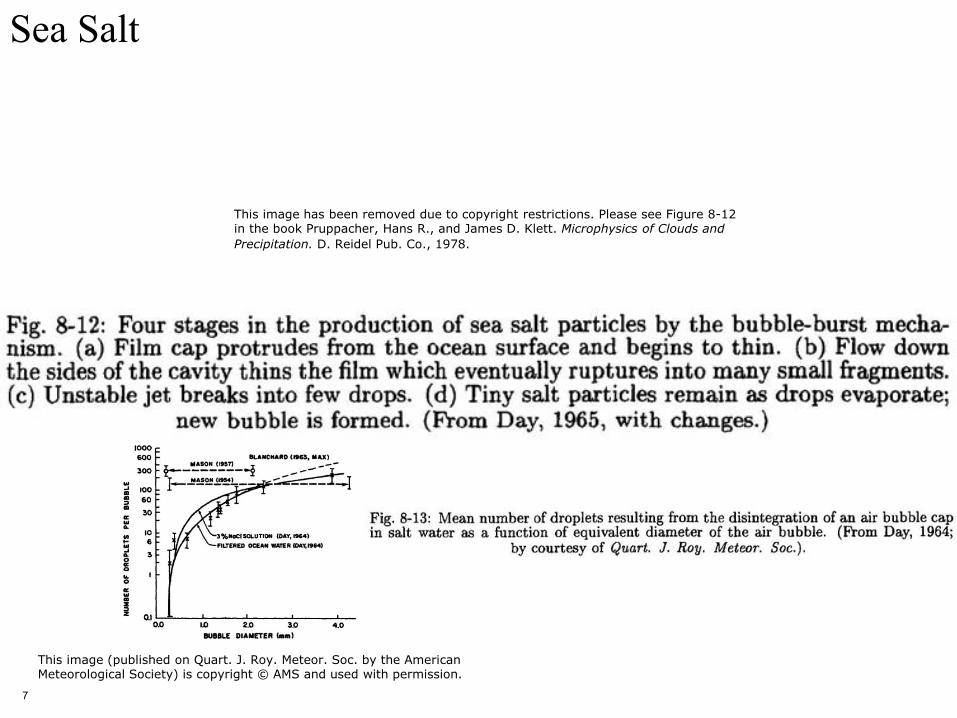
Sea Salt
This image has been removed due to copyright restrictions. Please see Figure 8-12in the book Pruppacher, Hans R., and James D. Klett. Microphysics of Clouds andPrecipitation. D. Reidel Pub. Co., 1978.
This image (published on Quart. J. Roy. Meteor. Soc. by the AmericanMeteorological Society) is copyright © AMS and used with permission.
7

Mineral Dust
This image has been removed due to copyright restrictions. Please see Figure 8-11in the book Pruppacher, Hans R., and James D. Klett. Microphysics of Clouds andPrecipitation. D. Reidel Pub. Co., 1978.
8

IPCC
IPCC 2007
Who Cares
?
Climate Change 2007: The Physical Science Basis. Working Group I Contribution to the Fourth Assessment Report of theIntergovernmental Panel on Climate Change, FAQ 2.1, Figure 2. Cambridge University Press. Used with permission.9

Who Cares ? (Part 2)
Murphy et al. JGR 2009
This image has been removed due to copyright restrictions.Please see Figure6 on page http://onlinelibrary.wiley.com/doi/10.1029/2009JD012105/full.
10

http://en.wikipedia.org/wiki/Great_Smog
Why Care ? : Beyond Climate
‘The Great Smog’ – London, 1952 Combination of meteorology (cold air / increase heating and temperature inversion) Particles reached 14,000 μg/m³ (280 current US standard average and 93 times peak allowable) Visibility < 1 m (!) 4000 deaths within 2 weeks, 10000 estimated total
11
This image has been removed due to copyright restrictions. Please sethe image on page http://en.wikipedia.org/wiki/File:Nelson%27s_Column_during_the_Great_Smog_of_1952.jpg.
e

Radiative Balance 1
Seinfeld and Pandis, Atmospheric Chemistry and Physics
This image has been removed due to copyright restrictions. Please see Figure 1.12,
Seinfeld, John H., Spyros N. Pandis. Atmospheric Chemistry and Physics - From AirPollution to Climate Change. 2nd ed. John Wiley & Sons, © 2006.
12

Radiative Balance 2
Seinfeld and Pandis, Atmospheric Chemistry and Physics
This image has been removed due to copyright restrictions. Please see Figure 1.15,Seinfeld, John H., Spyros N. Pandis. Atmospheric Chemistry and Physics - From AirPollution to Climate Change. 2nd ed. John Wiley & Sons, © 2006.
13

Aerosol Measurement : From the Ground and Aircraft
www.tsi.com
Most measurement involves collection and off-line analysis (see Prof. Prinn’s ‘Experimental Atmospheric Chemistry’ if interested) On-line instruments include those that measure light scattering to determine absorption, scattering, size Some ‘advanced’ instruments use e.g. electro-mobility Many aircraft instruments are an extension of these techniques
These images have been removed due to copyright restrictions.Please see the images on page http://www.tsi.com.
14

Aerosol Measurement : From Aircraft to Satellites
http://earthobservatory.nasa.gov/Features/Terra/, http://history.nasa.gov/SP-4312/ch3.htm
Various techniques for ‘remote sensing’ (not in situ). Among these: LIDAR (LIght Detection And Ranging) : distance to and some other properties of aerosol and cloud. UV to many micrometers, detection via backscattering. (Spectro)Radiometer - reflection or transmission properties of a material (as a function of wavelength).
Image courtesy of NASA.
15

But there’s a problem…
16

Particle Mass Spectrometry
Particle Inlet
Particle Sizing
Particle Composition
+ - + -
start 0
200
100 300 µs
stop
0
200
100 300 µs
0
200
100 300 µs
Image courtesy of Deborah Gross. Used with permission.17

Influential Results
Murphy et al. Science 1998 18
0.3
0.2
0.1
0.0
0.3
0.4
0.2
0.1
0.0
0 20 40 60 80 100 120
0 20 40 60 80 100 120
O-S-
HSO4-
HSO3-
SO3- SO4
-H34SO4
-OH-
OH-C2
-
CHO2-
C2H2O-O-H-
C2H5CO2-
CH3CO2- SO4
-79Br-35Cl-
A
B
19980507 #667219 km: 31oNθ=437 K
19980501 #112014.6 km: 22oNθ=360 K
Det
ecto
r Sig
nal (
mA)
Det
ecto
r Sig
nal (
mA)
Ion mass/charge
CN- & C2H2-
SO3-
HSO3-
HSO4-
l-
CH2OHSO3-
H34SO4-
La
Ac Th Pa U
Ce Pr Nd Pm Sm Eu Gd Tb Dy Ho Er Tm Yb Lu
H
Li Be
Na Mg
K
Rb
Cs
Fr
Ba
Ra
Sr
Ca Sc Ti V Cr Mn Fe Co Ni Cu Zn Ga Ge As Se Br
Ru Rh Pd Ag Cd In Sn Sb Te ITc
Re Os Ir Pt Au Hg Tl Pb Bi Po At
Mo
W
Nb
TaHf
ZrY
most many common some rare maybeHe
NeB C N O F
Al Si P S Cl Ar
Kr
Xe
Rn
Images by MIT OpenCourseWare.

Optical Depth (‘Thickness’)
IPCC 2007
• I = I0 exp [-mt] • 0.55 mm
(80%) (60%)
Climate Change 2007: The Physical Science Basis. Working Group I Contribution to the Fourth Assessment Report ofthe Intergovernmental Panel on Climate Change, Figure TS.4. Cambridge University Press. Used with permission.
19

Direct Radiative Effect
IPCC and Bellouin et al. Nature 2005
Climate Change 2007: The Physical Science Basis. Working Group I Contribution to theFourth Assessment Report of the Intergovernmental Panel on Climate Change, Table2.3. Cambridge University Press. Used with permission.
20
Aerosol optical thickness at 0.550 µm
Prob
abili
ty d
ensi
ty fun
ctio
n
0.00
20
0
40
60
80
100
120
140
0.05 0.10 0.15 0.20
SW clear-sky direct radiative forcing (Wm-2)
Prob
abili
ty d
ensi
ty fun
ctio
n
4
3
2
1
0
-15 -10 -5 0
Top of the atmosphere
Surface
SW clear-sky direct radiative forcing (Wm-2)
Prob
abili
ty d
ensi
ty fun
ctio
n
3
2
1
0
-15 -10 -5 0
GlobalOcean Land
Image by MIT OpenCourseWare.

How Much Aerosol is There?
Unless otherwise specified figures from Seinfeld and Pandis
This image has been removed due to copyright restrictions. Please see Table 2.20,
Seinfeld, John H., Spyros N. Pandis. Atmospheric Chemistry and Physics - From AirPollution to Climate Change. 2nd ed. John Wiley & Sons, © 2006.
21

Clear Air Aerosol Continental US, spring 2011
• Regional Biomass Burning
• Sulfate-Organic mixturesdominate in UTLS
• Mineral Dust: 10-30%
• Little Sea Salt in UT
• Meteoric particles in stratosphere
• Oil Combustion at low alt
• Sulfate Acidity is high only in stratosphere
Tropopause
K. Froyd, unpublishedImage courtesy of Karl Froyd. Used with permission.22

How Has Aerosol Changed? Sulfate - fossil fuel : ~70% vs natural (biology, volcanoes) : 30% Organic – poorly constrained, anthro. mainly from fuel combustion, ~40% of total Black carbon – mainly from fossil fuel combustion, a minor component of natural biomass burning. A net absorber (warmer) Biomass burning – different from above in that it is normally incomplete combustion, only from plant material. Net scattering (cooling) due to combination with organics and sulfate Nitrate – natural but dominated by anthropogenic farming / fertilizers Mineral dust – now 30 – 50% due to land use changes (note: sometimes not considered anthropogenic)
IPCC 2007 23

Aerosol History : Soot
McConnel et al. Science 2007
Use of ice core Melted, aerosolized by ‘month’ of material Abundance of soot
This image has been removed due to copyright restrictions. Please see Figure1 on page http://www.sciencemag.org/content/317/5843/1381.full.
24
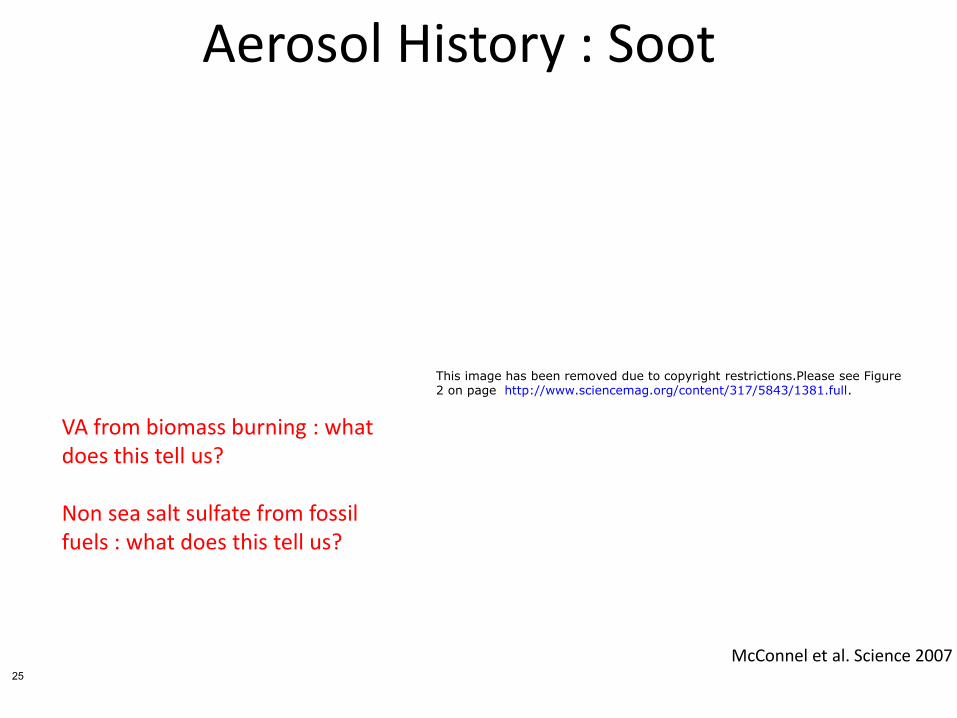
Aerosol History : Soot
This image has been removed due to copyright restrictions.Please see Figure2 on page http://www.sciencemag.org/content/317/5843/1381.full.
VA from biomass burning : what does this tell us? Non sea salt sulfate from fossil fuels : what does this tell us?
25
McConnel et al. Science 2007

Lead
Shotyk et al. Science 1998
Use of peat bog cores Abundance of anthropogenic tracers e.g. Pb
Peak at -3000 to -1600 years? Peak at -10.5k years?
This image has been removed due to copyright restrictions. Please see Figure1 on page http://www.sciencemag.org/content/281/5383/1635.full.
26

Decouple the Anthropogenic Effect
IPCC 2007
Model Anthropogenic Aerosol Optical Depth: From model studies, assumes a knowledge of what aerosol is natural and what is anthropogenic Difference : Model – Satellite How good to models do? (Answer : OK, not great)
Climate Change 2007: The Physical Science Basis. Working Group I Contributionto the Fourth Assessment Report of the Intergovernmental Panel on ClimateChange, Figure 2.12. Cambridge University Press. Used with permission.
27

Best Estimates
IPCC 2007
Observation and model based estimates of ANTHROPOGENIC aerosol direct effect (in all but two cases a cooling) Best estimate : -0.5 W/m2
Note greenhouse gas warming is ~+2.5 W/m2 Unlike greenhouse gases the level of certainty is “medium-low”
Climate Change 2007: The Physical Science Basis. Working Group I Contribution tothe Fourth Assessment Report of the Intergovernmental Panel on Climate Change,Figure 2.13. Cambridge University Press. Used with permission.
28

Recap • What are aerosols? Where are they from? • Why should we care about aerosols? • How do aerosols affect radiation? • How do we measure aerosol? • Optical depth (taero) and direct radiative effect (DRE) • How much aerosol is there? How much is anthropogenic? (soot and lead) • Best estimates of the anthropogenic direct effect
29

MIT OpenCourseWarehttp://ocw.mit.edu
12.340 Global Warming ScienceSpring 2012 For information about citing these materials or our Terms of Use, visit: http://ocw.mit.edu/terms.