global syndicated loans review - reutersshare.thomsonreuters.com/general/pr/loan-1q15-(e).pdf ·...
TRANSCRIPT

GLOBAL SYNDICATED LOANS REVIEWREUTERS / Gonzalo Fuentes
GLOBAL SYNDICATED LOANS REVIEWMANAGING UNDERWRITERS
Fi t Q t 2015First Quarter 2015

Global Syndicated Loans
Global Loans - Bookrunners (R1) 1
2
2
Leading Underwriters for 2015
Asia Loans - Asian Currency (S3i)
Table of Contents
Global Loans - Mandated Arrangers (R3)
Global Deals Intelligence
Top 10 Global Syndicated Loans
1
1
Global Scorecard 2
Global Loans Rankings - Last Ten Years 3
EMEA Mandated Lead Arrangers (R19) 7
Asia Loans - Bookrunners (S5c)
EMEA Sponsored Loans (P13)
Asia Pacific (Excl. Japan) Syndicated Loans
Asia & Australia Deals Intelligence
Global Debt & Syndicated Loans (DL1) 2
European Leveraged Loans (P10) 8
Top Asia Syndicated Loans
First Quarter 2015
MANAGING UNDERWRITERS
SYNDICATED LOANS REVIEW
9
8
9
9
9
10
11
11
Japan Loans - Mandated Arrangers (S12a)
Thomson Reuters Solutions for the Deal Making Community
10
Syndicated Loans Criteria Summary 13
Regional Contacts
10
14
12
Americas Syndicated Loans
EMEA Syndicated Loans
Japan Syndicated Loans
5
EMEA Deals Intelligence 7
Americas Deals Intelligence 4
US Leveraged Loans - Bookrunners (R11a)
Top Australia Syndicated LoansTop Americas Syndicated Loans 4
6
Australia Loans - Bookrunners (S7)
Australia Loans - Mandated Arrangers (S6a)
Japan Deals Intelligence
Top Japan Syndicated Loans
Japan Loans - Bookrunners (S12b)
Latin America Loans - Mandated Lead Arrangers (R16)
Top EMEA Syndicated Loans 7
US Investment Grade Loans - Bookrunners (R11b)
North America Loans - Bookrunners (R9) 5
5
EMEA Bookrunners (R17) 7
6
Americas Loans - Mandated Arrangers (R8c)
US Loans - Bookrunners (R11) 5
Americas Loans - Bookrunners (R7)
13
Ranking Criteria Summary
11
4
Asia Loans - Mandated Arrangers (S5b) 9

First Quarter 2015
MANAGING UNDERWRITERS
SYNDICATED LOANS REVIEWGlobal Syndicated Lending Totals US$831 billion, down 17% from 2014 I US Loans Account for 50% | Europe Lending Down 9% I Bank of America Merrill Lynch Tops Rankings
Global Syndicated Loans VolumeGlobal Deals Intelligence
US LENDING ACCOUNTS FOR 50% OF ACTIVITYAmericas loans accounted for 55% of global loan volume during the first quarter of 2015, as lending in theregion decreased by 17% from the same period last year. Within the Americas, loan volume in the UnitedStates totaled US$415.5 billion, down 18% compared to the same period last year and representing 50% ofglobal volume. Europe accounted for 22% of global volumes as lending decreased by 9% compared to the firstquarter of 2014. Asia Pacific fundraising saw a year-over-year decrease of 48%, while Japanese lending fell10% compared to the first quarter of 2014.
GLOBAL SYNDICATED LENDING FALLS 17% FROM 2014Global syndicated lending reached US$830.6 billion during the first quarter of 2015, a 17% decrease comparedto the first quarter of 2014 and the slowest three-month period for lending since the third quarter of 2012.Lending activity during the first quarter quarter saw a 36% decrease from the fourth quarter of 2014. Nearly2,100 transactions closed during the quarter, a decrease of 25% compared to the first quarter of 2014.
AQUISITION FINANCING CONTINUES DURING FIRST QUARTERAbbvie secured a US$18.0 billion financing package to fund its US$19.9 billion acquisition of Pharmacyclics,topping the list of syndicated loans closed during first quarter of 2015. Other notable acquisition-related loansincluded AT&T’s US$9.2 billion facility and Dollar Tree’s $9.0 billion loan to fund its purchase of Family DollarStores.
ENERGY & POWER, FINANCIALS & INDUSTRIALS LEAD LENDING0
2,000
4,000
6,000
8,000
10,000
12,000
$0 0
$1.0
$2.0
$3.0
$4.0
$5.0
# of
Issu
es
Pro
ceed
s (U
S$t
)
Q4 Volume (US$t) Q3 Volume (US$t) Q2 Volume (US$t) Q1 Volume (US$t) # of Issues
14.1
0.2▲ TD Securities Inc1.1
23
-36.1% -16.8% ▼
13.0
17.4
0.5 ▲-3.3
9.58.6
13.1 ▼
9.0
-1.7-1.2-1.4-1.8 ▼
4.4
19.518.3
▼
8.5
17.98 ▲
▼
531,780.8Top Twenty Five Total
10.2
12.8 9.53.6
3.9
43.0
7,956.9
25
1.21.1
73.8
24
4.8
22
7,770.6
▼
▲▲
Industrial & Comm Bank ChinaBank of China Ltd
Industry % Change from Last Quarter
BMO Capital Markets 20
▲▲
Industry % Change from Same Period Last Year
2423
Scotiabank25
-17.2%
Bookrunner Total
Societe Generale
722,165.7▲
37
1,819
32
▼▼▼
-0.1
-24.0% -39.9%
-574
-0.2
100.02,470.3
0.7▼
2.01.1
100.0
▲ ▲
2.0▲
26 7,683.7
321.323
360.2
1.1
▼▼▲
3.6
63
1,612.3
▲
0.2
11
0.2
0.5
33 -101.8
57
▲ 65
▲
3.054
3.13.5
40
▼
▼-16
2.2
-35-12
▼-40
▼
18.17
-69
-44.9%
▼
▲0.2 ▲
1.8
▲68.840.3
▲▼▲
▼
0.0
1.6
21.6-▲
▲
0.7
0.6
▲▲
▲
▼0.0
▼
-
-1.9
0.2
0.31.6
1.4
2.8
1.0
2.3
-0.7
23.5
-2.8
-0.2
40.3
72.5 2.9-2.5
-18
0.1
1.20.9
30.0
0.4
0.70.1
65.3
9.8
0.0
4.32.048.4
106.5
2.5 0.9
-38 ▼▼
▲▼
▲▼
▲▲
▼▼
0.1
Share Ch.Fees# of Deals
Global Loans - Bookrunners (R1)
MarketImputed Fees (US$m)
Jan 1 - Mar 31
Proceeds per Bookrunner (US$m) # of Deals per Bookrunner2015 Rank Share Ch.Bookrunner Proceeds
2014 Rank Share %
MarketMarket Manager# of MarketMarket Change in
JP Morgan
Wells Fargo & CoCiti
Deutsche Bank
US Bancorp
Sumitomo Mitsui Finl Grp IncMorgan Stanley
Barclays
2 1 56,633.3
Share %Deals
197 ▼-101
Share %249Bank of America Merrill Lynch 1 2 61,687.9 -47 ▼8.5 0.5 ▲ 13.7 7.2 0.1178.6
1.115.9151.5 -0.7
0.413.9 9 ▲ 2.869.96.2 1.7 ▲
6.1290 -27 ▼
10.892.9 3.8
▲
▼Mitsubishi UFJ Financial Group 3 5 44,410.9
5.9 2.0
7.8 -1.3
5 4 36,534.234,298.7
Mizuho Financial Group 4 7 42,750.4184 ▼ 109.710.15.1 0.5 ▲ -29252
▼1.8 -0.5
0.5 ▲▲
4.40.56.04.8 -0.26 3 -42 4.3109 ▼ 106.2▼
8 17 20,083.67 10 24,790.0
2.83.4 ▲ 227 ▼0.2
0.9-14
71.0 2.9 -0.4-0.6▲ 48.5
44.9
5.3 2▲
12.5▼42 2.3 -25 ▼
11 8
HSBC Holdings PLC 9 14 19,660.8
85
2.1
3.810 6 18,702.1 2.618,595.9 ▼2.6
▼
3.2▲ 5.295
80
70
59▼ 39
▲
-10
3-45
4.44.7
55.7▼
60.8
-6633.3
▼▼
918
PNC Financial Services Group 19Credit Suisse
21
Goldman Sachs & Co16
18
12RBS 15BNP Paribas SA
Credit Agricole CIB
RBC Capital Markets13
1514
9,590.1
1711,734.0
8,080.0
9,046.020
10,527.111
8,912.121
13
1.3
1.8
28 10,708.6
12,718.1
18,167.018,069.5
12,669.312
0.4
-1.2-0.22.5
-1.7
0.4-1.0
1.3
1.6 -0.20.7
-1.5
▼
2.5
1.5
1.8▼
1.5▼
-0.991.62.02.7
-1.8 3.7-70 ▼▲ 97
▼
41.9
Current Qtr Market Share
(%)Mkt. Share Chg. from Last Qtr (%)
16.3
▲15.0
▼
Asia-Pacific ex. Japan ex. Australia (S5b)
Market SectorGlobal Loans (R1)Americas Loans (R7)North American Loans (R9)US Loans (R11)US Leveraged Loans (R11a)
Bank of America Merrill LynchBank of America Merrill Lynch
Latin America Loans (R15)
Asia-Pacific ex. Japan ex. Australia (S5c)
Latin America Loans (R16)EMEA Loans (R17)EMEA Leveraged Loans (P10)
Bank of America Merrill Lynch
Industrial & Comm Bank ChinaIndustrial & Comm Bank China
▲Mizuho Financial GroupANZ Banking Group
Leading Underwriters During the First Quarter 2015
Mizuho Financial GroupMizuho Financial GroupJP MorganDeutsche Bank
No. 1 ManagerBank of America Merrill Lynch
US Investment Grade Loans (R11b)
17.2
Japan Loans (S12b)Australian Loans (S7)
Mizuho Financial GroupJapan Loans (S12a)
35.8 ▲
Bank of America Merrill Lynch
Borrowing in the Energy & Power sector totaled US$182.0 billion during the first quarter of 2015, accounting for22% of global loan activity, up 35% from global lending in the sector during the first quarter of 2014. Healthcareand Consumer Products lending saw the largest year-over-year declines, down of 43% and 41%, respectively.Energy & Power, Industrials and Financials together accounted for 49% of syndicated loan volume during thefirst quarter of 2015, compared to 42% a year ago.
BANK OF AMERICA MERRILL LYNCH TOPS BOOKRUNNER RANKINGSBank of America Merrill Lynch secured the top ranking for global bookrunners, by proceeds, with US$61.7billion from 249 transactions during the first quarter of 2015, an increase of 0.5 market share points comparedto the first quarter of 2014. JP Morgan fell to second place, with US$56.6 billion or 7.8% of overall loanproceeds during the first quarter of 2015, a loss of 1.3 market share points from a year ago.
SYNDICATED LENDING FEES DOWN 40%According to Thomson Reuters/Freeman Consulting, bookrunning fees from global syndicated loans totaledUS$2.5 billion during the first quarter of 2015, a decrease of 40% from last year. Fees from leveraged lendingdecreased 48% compared to a year ago and accounted for 63% of all lending fees during the first quarter of2015.
Bank of America Merrill Lynch 12.9
0$0.02011 2012 2013 2014 2015
https://www.thomsonone.comVisit http://dmi.thomsonreuters.com to View Archives and Order Custom League Tables1

Netherlands
Italy
11,555.2
7,577.46
5
4,127.0
7,710.9
8,710.4
Germany
United Kingdom
3,873.0
France
Luxembourg
Global
▲
Brazil
-0.3
50.8
Sweden
-
Norway4,599.1
Market
19,075.3
Belgium
Eastern Europe1214
-0.4% ▼
5.7
3.2%
14.611.4
-0.42
51,580.7Proceeds
Bank of America Merrill LynchShare Ch.Mandated Arrangers
Market 5,059.3
-65
Western Europe
Switzerland
-104
Market
100.0
52
6,829.3
448,495.3
33,004.6
5
12
Proceeds (US$m)
543,492.6
80
5,648.6
26
2,651.42,065.0
17,404.1
759839
5,567
Fees
▼
-6.6%
Market
-571
-9.3%Industry % Change from Same Period Last Year
2015 Rank
Global Loans - Mandated Arrangers (R3)
Deals # of Deals
Industry Total
# of
Industry % Change from Last Quarter
1
-9.0%
Market2014 Rank
JP Morgan 2
1,140,493.1
1
49.8
Share % Share %
2,302,064.4
▼
-0.7
# of Deals per MA
-2.2
▼
157.7
4,353.5
Manager
-13.7%
-0.7
8,589.8
▲
0.0
574.7
▼
▼
Europe
Jan 1 - Mar 31
▼ 6.4 6.4
▼
Share % Share Ch.
5.5
mputed Bookrunning Fees (US$m
184.1
3
Spain 33,092.139,521.2
25,488.5
▲Mexico▼
South America
183,001.4
4.0
5.3
▼
-0.7Central America
▼
▼2.6
Region/Nation
First Quarter 2015 | Syndicated Loans | Managing Underwriters
-99 339.4
▼-0.7▼
▼
North America
220.1
7.7
5.3
▲
5.3
4.7 1.3
-92
337.2
Share %
▼ 456.4
▼558.5
# of Deals Fees
454.4
GlobalAmericas
0.6 830,565.5
1/1/2015 - 3/31/2015Share Ch.
▼
461,454.6
5
33
12
40
275
69
41
26
20
261
1,000,757.2
18,687.2
1,500.31,395.3
Proceeds (US$m)
857
3
7,359.4
6,135.7
415,490.8United States of America
187,128.4Colombia
5,900.05,900.0
Canada
15,860.4
2,229.9
1/1/2014 - 3/31/2014
Scorecard: Global Syndicated Loans
1,096
6
2312
▼-32.7
-52.6
-17.5
▼▼
-47.4
▲823.7
▼-38.2
349
18
30,739.7
4
3,020.2
55,363.5
49
834.8
31,619.518
27
2,730# of Issues
326
10,522.4
206,152.0
1,133
1,177.5
# of Issues2,051
5
6,273.2
197,441.6
87
557,315.3
1,010
4
506,531.0
2
36,961.5
15
239.8
-46.3
-17.2-17.5
▲
▼
▼
▲
▼
-10.7
▼
▼322.8
▼
293.3
-18.0
▲
▼
▲
▼
75.4 ▲▼▼
95
-57.7
▼108.6
▼
▼-28.6-7.3-9.2
531.6-19.4
-43.4
▲
31
% Chge in Proceeds
-17.0
Change in
-483.1 0.4 ▲
100.0
6.2
BNP Paribas SA 10 10 70,300.7Top Ten Total
1.3 ▲
234-0.847,187.2
1.0
Proceeds per Mandated Arranger US$m)
▲
▲
300▼▼
Wells Fargo & Co 8 8 84,281.7 3.7Goldman Sachs & Co 9 9 82,025.6 3.6
4280.1275.8 3.2
557.7444 8.0 ▼
3.9HSBC Holdings PLC 7 7 95,537.0 4.2 0.4
Deutsche Bank 5Morgan Stanley 6 6 96,209.2 4.2 -0.7
448 8.06.5 -1.3
5 116,984.8 5.1 0.5354 6.4
▲▼
294
▼▼478.7 5.6 -0.5
-37-35
▲
▲ 459 8.2
264
Citi 3
-1.0
-8▼ 499 9.0
Barclays 4 4 127,744.8 5.6 0.0 -▼ ▼
556 10.0 -57 ▼ 6.7-76 ▼ 658.3
# ofMandated Arrangers
0.3 ▲-223 141,966.7 6.2 -0.4
11.4Share %
Bank of America Merrill Lynch 2 2 147,911.2 6.4
Market2014 Rank
JP Morgan 1 1 177,531.4 7.7 0.2 ▲ 632
Market Change in ManagerMarket Market Market
Global Debt & Syndicated Loans (DL1)
Imputed Fees (US$m)# of Deals per MA
Share Ch.Proceeds
Proceeds per Mandated Arranger US$m)
Jan 1 - Mar 31
Deals2015 Rank Share %
3,071.4450.0
6Russian Federation
344.4
Turkey
Croatia
26
15,471.5
37
64
Ghana
33,855.3
4,127.6
4,243.9
2,885.4
72,509.7
7,296.6
-1.3
226
14,018.0
25,758.9Middle East
North Asia
Hong Kong
350.0
4,468.7Singapore4,026.2
Indonesia1,832.9
22.9 0.8 0.6
1/30/2015 D k E C
China
-36.5% ▼
Acquisition Fin.
7 500 0
8,464.7
1/21/2015
▼
659
6
Industry % Change from Last Quarter
7,035.4 12
4
Deutsche Annington-Hotels(5)
83,688.8
200.0Australasia
6
1
6,425.9
Germany
Yalong River Hydropower DvlpUnited States
▲2,473.0
South Africa
150
-6795
22▼
Capital ExpendituresUnited States
3/11/20153/11/2015
Acquisition Fin.
1/13/2015 7,655.2Ball Corp
9,000.0
121
8,265.4
27,301.6
139,601.9
2,854.3
3712
2,639.89,849.324 17
139.313,999.2
-
26
-
104
4.4
3.6 295
143▲
10.631,121.7
19.0▲0.1
1.7
8.02181645
45,331.25.34 3
▲ 14.6
0.71.8
0.0
44,139.5
▲1.8
0.2
3.0
2.7
-0.6-1.3
▼
-0.6
0.3
4.3 -74.2
▼-48
15688
7.6▼
0.2
86▲
▼-1.2
1110.5
51-0.4
-0.1
2.6 -69▲
▼
2.9
▼
104▼
89
5.1
4.4
▼
81
53
2.6
3.92
-19
-72-21
-82
4.3-42
5.1
-14
5.4
2.6
7.3
41
-18
79.70.1
-49▼
2,051
▼▼
-45
64.8
▼
▼-0.2▼
0.1-88
70.4121.5
2.6
▼9 40.5
0.9
0.7
Top Twenty Five Total
0.3-1.4
15
54-251.5
▼
Scotiabank 25 1.3
27
1.2
1.3
Industrial & Comm Bank China
19
25
1.3 0.3
23
100.0-0.90.3
0.210,428.4
830,565.5
▲
▲▲
11
67.4
10,496.6
1.4
▼
23
10,188.8
-17.0%
557,579.2
19
30 54
299
▲
59
149
▼
91
▼▲
4.0
1.3
-32
49.4▲
2.5
78.6▼
1.6
1.3
2.5
1.20.1
2.9
5.5
0.1
▲
13
1415
13 14,658.913,452.9
22,027.6
14,756.412
10
5
9
23,772.1
7
20,613.7
7
25,268.0
30,215.68
4
Mizuho Financial Group 3
20
Industry Total
21
Sumitomo Mitsui Finl Grp Inc
Mitsubishi UFJ Financial Group
6 6Citi
RBC Capital Markets
PNC Financial Services Group
Closing Date
ING
18Credit Agricole CIB17
-35.9%Industry % Change from Same Period Last Year
12
14
Bank of China Ltd 2218
21
Morgan Stanley10,786.011,293.511,455.9
20
11
Societe Generale
Orchid Alliance Holdings Ltd
Top 10 Global Syndicated Loans
12,378.216Credit Suisse
16
AT&T Inc
10,591.1
3/30/2015
3/25/20152/12/2015
10,443.8
3/19/2015
22BMO Capital Markets
Goldman Sachs & Co
Saudi ArabiaEnel SpA
10
US Bancorp
28,515.4
24
-0.136,653.2
3.8
3.4
Target Market
10,222.8
Borrower
Wells Fargo & Co
▼
HSBC Holdings PLC
Deutsche Bank
RBS
Barclays
52 -29
0.0
▼
▼2.4
2.1
-1.9
-2.5
-0.4
0.2
2.5
1.7
0.4 0.0
▲
▼▼
▼57.7
▼ 115.9 1.1
-0.6
3.9
Taiwan
China12.4
▲
▼
102.1
Central Asia
▲1.4
71.6
-0.514.4
-292.7
-50-26
-38
▼
▼
7.0
3.82.0
2.3
2.4
3.54.2
▲
▼
1.4▼
-5
3,245.4
▲
▼
▲
-
▲
Africa/Middle East/Central Asia
▲ Saudi Arabia
Nigeria
46,283.3
Malaysia
IndiaSouth Asia▲
South Korea
Czech Republic
705.0
22,495.8
▲3.5
▼
-0.9
▲▼
▼
0.5
▲
-
100.0
69.0
2.8
23.734.3
0.860.4
1.2
63.5
40.2
38.1 Southeast Asia0.0
75.2
0.3
1.4
40.3
▼0.1
-0.7
0.5110.1112.3
0.4 2,610.9
143.0
3,049.5
4
1
United Arab Emirates
Asia-Pacific (ex Central Asia)
Sub-Saharan Africa
125.4
4,937.1
1,000.03,133.4
12
-2,900.0
8
23,913.037
3
4,937.1
44
5
1,984.7
71
6,981.6
General Corp. Purp.
20
12
Japan 75,617.5
-43.0%
ARAMCO
Primary UOPAbbVie Inc
▼
United States
Italy
3/9/2015 Dollar Tree Inc
* The Global Scorecard comprises deal volume and counts from club and bookrun deals, mirroring the mandated arranger rankings.
▼▼-24.9%
U it d St t
Japan
Package Amt (US$m)
-19.7%Australia
549.2Philippines8,966.3
New Zealand
Thailand 3
27,717.412,322.9
2,506.2
22
3,236.7
28
645.6
22
29,793.1
52
11,904.654
14,517.0
6,234.0
20,942.9
169
3,339.3
23,826.6
1,500.0
61,564.3
1
1-
495
▼
4
▼
1
3920
-57.2
17.0-13.4
▼▼
-9.6
-82.2
▼
-51.9
174.6-80.1
▲
-69.1
1
5
302
740
59
2
486.1
224.5
-62.5
-41.2
15
124.5
191
80
▲
-48.1
▲
393.0
5
-24.8
▲
-76.7
-24.9
▼
▼
▼
-5.9
-83.4
▼
▼
-51.3
-54.9
-
▼
▼
▼
-10.0
▲
141.8
17.6
-
▲
39.2
-
161.5▲▲
▼
▲
▼
▼
▲
▼
▼
-▼-89.1
United States
▲
1.4
2.5BNP Paribas SA
89
390
-186
1.0
9.1
▼
Jan 1 - Mar 31
10,764.0 Refinancing
▲▲
Acquisition Fin.G l C P
9,999.3
Acquisition Fin.
18,000.011,838.0
Acquisition Fin.General Corp. Purp.
9,155.0
7,658.8
1/30/2015 Duke Energy Corp 7,500.0
Visit http://dmi.thomsonreuters.com to View Archives and Order Custom League Tables
United States
https://www.thomsonone.com
General Corp. Purp.2

Global Loans Bookrunner Ranking - Last Ten Years*First Quarter 2015 | Syndicated Loans | Managing Underwriters
1
2
3
4
5
1
2
3
4
5
Bank of America Merrill Lynch
JP Morgan
Mitsubishi UFJ Financial Group
Mizuho Financial Group
5
6
7
8
9
10
5
6
7
8
9
10
2006 2007 2008 2009 2010 2011 2012 2013 2014 2015
Ran
k
Wells Fargo & Co
Citi
Sumitomo Mitsui Finl Grp Inc
Morgan Stanley
HSBC Holdings PLC
Deutsche Bank
*League Table positions reflect consolidation within the banking sector. Rankings shown are as of the current quarter end in each calendar year.
Visit http://dmi.thomsonreuters.com to View Archives and Order Custom League Tables https://www.thomsonone.com3

Primary UOP
Top Americas Syndicated LoansClosing Date Target Market
JP Morgan ▼
Package Amt (US$m)
2▼
BNP Paribas SA 15 12
▼Mitsubishi UFJ Financial Group 5 11 21,573.8 4.7
Market2014 Rank
0
176▲
181 21.2 -28
Share%169.0 ▼28.0 -44 9.2Fees Share Ch.
▼ -0.2
Americas Deals Intelligence
# ofImputed Fees (US$m)Proceeds per Bookrunner (US$m) # of Deals per Bookrunner
ManagerChange in
First Quarter 2015 | Syndicated Loans | Managing Underwriters
AmericasAmericas Proceeds at US$461 Billion | US Leveraged Lending Down 51% | Latin America Lending Down 4%
Americas Loans - Bookrunners (R7) Jan 1 - Mar 31
MarketMarket2015 Rank
MarketMarket
1 44,837.2
DealsBank of America Merrill Lynch 2 239Bookrunner Proceeds
59,708.1 13.0 0.9Share%Share%
1# of DealsShare Ch.
-2.2▼ 114.89.8 -3.9 20.6 -108 6.3 ▼Wells Fargo & Co 3 3 36,424.1 7.9 0.7 ▲ 0.6 ▲109.5 6.0Citi 4 4 28,134.2 6.1 -0.5 10.6 -39 95.7▼ 90 5.2 0.5 ▲
2.3 ▲ 1.4 ▲48 5.6 -1 ▼ 52.5 2.9Morgan Stanley 6 10 19,429.9 4.2 1.4 4.5 -28▲ 38 3.6 -0.7▼ 66.6 ▼Barclays 7 6 14,674.7 3.2 -1.6 ▼ -0.1 ▼60 7.0 -39 ▼RBC Capital Markets 8 8 12,146.9 2.6 -1.7
92.8 5.16.4 -45 ▼ 65.1▼ 55 3.5 0.0 -
RBS 9 13 12,005.1 2.6 0.5 ▲ 1.2 ▲70 8.2 11 ▲ 49.1 2.7Goldman Sachs & Co 10 7 11,346.0 2.5 -2.2 3.4 -61▼ 29 2.6 -3.0▼ 47.2 ▼US Bancorp 11 21 10,708.6 2.3 1.0 ▲ 1.0 ▲HSBC Holdings PLC 12 18 10,555.5
65 7.6
0.3 ▲2.3 0.6 ▲ 44
40.3 2.25.2 7 ▲ 27.5
11 ▲1.5
0.5 ▲63 7.4-0.4
Credit Suisse 14 9 9,311.9 3.9 -62 ▼ 58.72.0
▼PNC Financial Services Group 13 15 9,590.1 2.1 -16 ▼ 40.3 2.2
1.6 -0.9-0.1▼
▼ 30.0
-1.8 ▼ 33▼24.6 1.3
3.2 -2.6 ▼▼ 31 3.6 -10
BMO Capital Markets 16 17 9,046.02.0 -0.19,186.9
-1.4 ▼2.0 0.3 6.7 -12▲ 57 ▼1.9
TD Securities Inc 18 19 7,770.6Deutsche Bank 17 5 8,560.4 33 3.9
1.7 0.3 ▲ 32-3.5 ▼ 69.8 3.8
3.8 7 ▲ 18.1 1.0-74 ▼
0.1 ▲Scotiabank 19 20 7,683.7 1.7 0.4 ▲ 0.2
1.6 -0.1▲37 4.3 8 ▲ 15.9 0.9
-7.4 0▼ 63 -0.3- 36.4
CIBC World Markets Inc 21 23 6,814.7SunTrust Banks 20 16 7,140.2
0.9 0.11.5 29 3.4
▼2.00.5 ▲ 7.9
▲
8 ▲ 0.42.6 4 ▲ 15.7
0.0▲
35 8 2 026 6,288.8
48 5 6 0 4General Electric Co 23 24 3 620 6 0 8 0 0Mizuho Financial Group 22 1.4 0.7 ▲ 22Jan 1 - Mar 31
Borrower
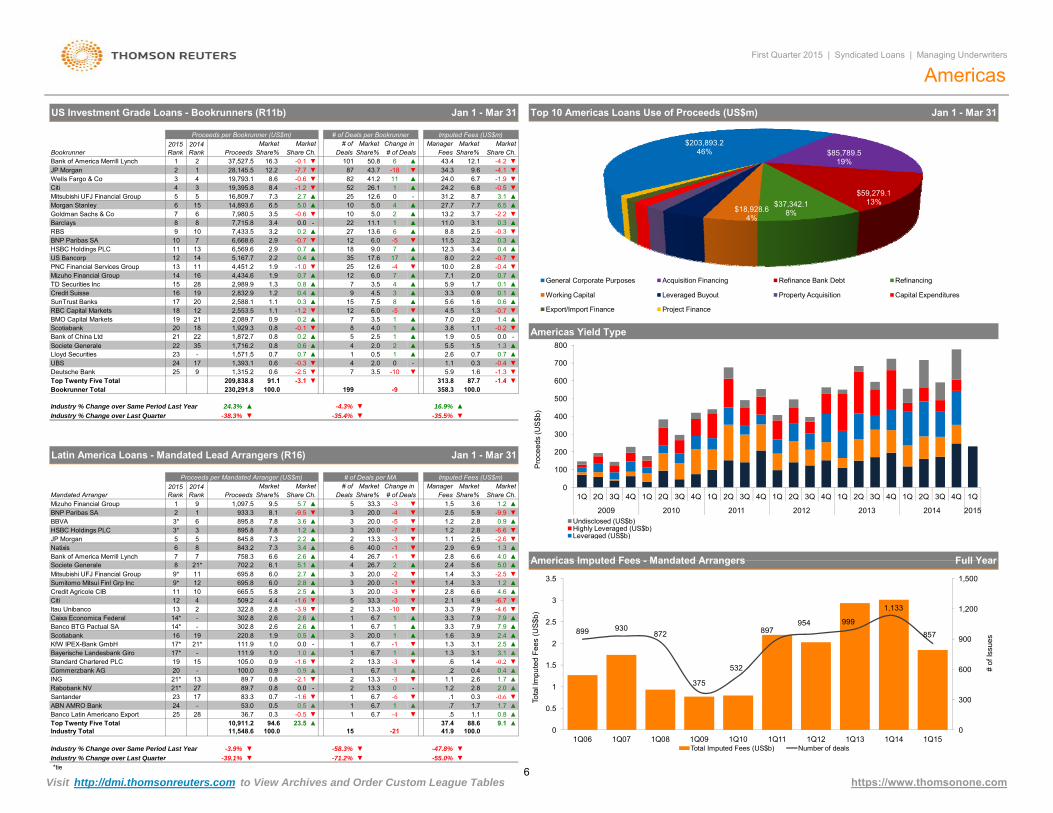
Overall syndicated lending in the Americas during the first quarter decreased 17.2% from 2014, with proceeds ofUS$461.5 billion from 857 transactions. First-quarter totals fell 41.2% from the fourth quarter of 2014.
Leveraged lending in the United States totaled US$149 billion from 415 deals, representing a 51% decrease from totalproceeds raised in the first quarter a year ago.
Loans for general purposes dominated the market in the first quarter, accounting for a 46% share, with proceedstotaling US$203.9 billion. Acquisition Financing followed, with 19% of the market.
Lending in Latin America decreased compared with the same period last year, down 3.9% with total proceeds ofUS$11.5 billion.
Estimated bookrunning fees for the Americas yielded a 38.4% lower total in the first quarter of 2015 compared to lastyear, with a total of US$1.8 billion, according to estimates from Thomson Reuters/Freeman Consulting. Fees paid tobookrunners for U.S. leveraged loans decreased 45.4% compared to a year ago, totaling over US$1.3 billion.
9,000.0
Primary UOP
1/21/20153/9/2015
PetSmart Inc3/5/2015
Duke Energy Corp
3/11/2015
Dollar Tree Inc
5,000.0
Acquisition Fin.General Corp. Purp.
3/19/2015Closing Date
1/30/2015 7,500.07,658.8
6,950.0
United States
Jan 1 - Mar 31
United States
Target Market
United StatesAT&T Inc
Ball Corp United States-5.8
1,836.771.5
-
81.33/11/2015
United States
American Honda Finance 7,000.0
US Leveraged Volume
100.0 -276460,037.7Acquisition Fin.
2.2 1.1▼ 0.1 ▲▼
Package Amt (US$m)18,000.0
038 3,591.0
▲0.3
-0.8 ▲ 18
- 35.8 2.0▲0.5
1,308.1
48 5.6
-0.24.58
▼
Leveraged BuyoutUnited States
0.40.0
General Corp. Purp.
100.0
25
General Electric Co 23
20.3
24 3,620.6 0.8 0.0
2,960.025 -301924 2.1United States
Top Twenty Five Total
Acquisition Fin. National Bank of Canada Fin'l0.6Acquisition Fin.9,155.0 KeyBanc Capital Markets Inc
Industry % Change over Last Quarter
373,109.0
-37.3%Industry % Change over Same Period Last Year
-5.2 ▼
-41.2%
Bookrunner Total 853
▼-24.4% ▼-45.5%
-16.9% -38.4%▼
▼▼▼
2/5/2015 Export/Import FinanUnited States
Working CapitalAmerican Tower Corp
Mexico2/23/2015
PEMEX
Americas Loans by Industry (Proceeds US$m)
Anadarko Petroleum Corp United States1/23/2015Acquisition Fin.
5,250.05,050.0
AbbVie IncBorrower
$92,810.620%
$56,962.212% $43,865.5
9%$41,098.7
9%
$38,779.68%
$34,700.18%
$33,416.27%$31,132.1
7%
$25,642.06%
$23,848.65%
$23,456.65%
$2,686.61%
Energy and Power Financials Industrials Retail
Materials Healthcare Real Estate Consumer Products and Services
Telecommunications High Technology Consumer Staples Media and Entertainment
Government and Agencies
2,136 2,086
1,737
1,107
1,470
2,006
2,259
3,017 2,959
415
0
500
1,000
1,500
2,000
2,500
3,000
$0
$300
$600
$900
$1,200
$1,500
2006 2007 2008 2009 2010 2011 2012 2013 2014 2015
# of
Issu
es
Pro
ceed
s (U
S$b
)
Q1 Volume (US$b) Q2 Volume (US$b) Q3 Volume (US$b) Q4 Volume (US$b) # of Issues
Visit http://dmi.thomsonreuters.com to View Archives and Order Custom League Tables https://www.thomsonone.com4

0.51.4
Deutsche Bank
Barclays
PNC Financial Services Group
RBC Capital Markets
-0.1
▲ US Bancorp
RBS
9.2
North America Loans - Bookrunners (R9)
Share% 1
BookrunnerBank of America Merrill Lynch
# of
15.90.1
Credit SuisseBMO Capital Markets
Mitsubishi UFJ Financial Group
HSBC Holdings PLC
27.5
Deutsche Bank
BNP Paribas SA10,112.5
1810,507.4
9.2
▲
▲
-7
18,877.7
90.9
162.9
▼12.8
14,941.2
7
116
Citi1.4
1.3
1.5
12RBS 11
7.2US Bancorp
▲73.8
13,365.4
17,322.81.33.2
▲8
24.9115
-1.1
▼0.3 ▲
8.8
-0.1
# of Deals
2.8
▼
▼
-1.3110
62
575 ▼
▼
10.592.8
▼
-11
69.8
-1410.4
9
7
-0.6
▼40▼
▼
86
▲
2.0 -0.342
0.2
36.458.7
11.40.4
BMO Capital Markets
PNC Financial Services Group2.7
0.2
90
16
4.714
13
5.1445
▲2.3
12,525.2
79
10
14
12
15
▼
208
10,591.1
2.1
12,321.02.7
9,643.0
7,863.2
0.6 ▲
▲0.6
▲0.32.3
0.1
0.61.80.6
0.31.4
-0.72.2
9,950.1
9,582.6
40
▼
5.13.7
▲ 6.2
3.9
35
4.7 -68
-656.3
4.1
3.6 -2
16
▲
▼
8
32
10.0▼
▲5354
▲
1.6
0.93.2
1.0
10.5
2.6
4.9
65.1▼
▼-31-20
3.6
▼
49.1▲3.8
24.6▼40.2
▼
47.2
0.0
0.2
▲0.2
-0.0
▼-2.8
0.9
9,715.7Morgan Stanley
24 5,103.0
20
22
1.1
9
SunTrust Banks
▲▲
2.217
Scotiabank 18
CIBC World Markets Inc
19 21
2.1
8,281.6
15.9▲ 0.6
0.9
7.9
14.1
▲ -8.6
Bank of America Merrill Lynch
0.80.5
▲
1-2.2
10.4 ▼
Proceeds per Mandated Arranger (US$m)Change in
Share%270 31.5 -58 -0.2 ▼1
6.7
Market Market
47,848.12
89
6.4
34,395.8
56
▼-3.030,843.4
-3.0-49
-1.9
3
3.5
18.1
▼
-88
5
1.22.7-1.4
-2.6▲
66.6▼
6
-10▼
▲
Credit Suisse 17
74
29,322.1
12,905.8RBC Capital Markets
15
13
4
0.4
4
2Wells Fargo & Co 3
10
HSBC Holdings PLCBarclaysMitsubishi UFJ Financial Group
JP Morgan3
7.5
5.0
109.5
2.990
213
▼
195
4.1-37
-0.2
▼▲52.4▲
169.2
0.6▲
6.05.2
21
28.0 -4443,991.4 ▼
13.19.8 -106
-0.2
▲8.6
1.0
▲2.1
-0.9
0.52.2
44
▲
31
▼
58,962.32 -4.1
# of Deals per Bookrunner
174
# of Deals per MA Imputed Fees (US$m)
Americas
Market
Jan 1 - Mar 31
30.0
-1.6
2.5 -2.30.0
2.2▼▲ 8
▼
Share Ch.
▲6.2
2014 RankDealsProceeds
Jan 1 - Mar 31
First Quarter 2015 | Syndicated Loans | Managing Underwriters
Imputed Fees (US$m)
Share Ch.
▼
Proceeds per Bookrunner (US$m)2015 Rank
2014 Rank
Manager
-37▲
40.3
Market
▼
JP MorganWells Fargo & Co
-0.4
Market
22.8
Share%
13.4
▼
Market
-109 114.8
95.7-42
MarketMarketShare%Fees Share Ch.
Change in ManagerProceeds
2015 Rank
# of MarketMandated Arranger
Goldman Sachs & Co 331.7 -2.1
MarketShare%
TD Securities Inc
▼ 0.16,588.1 ▲1.4Societe Generale
21 2239
Mizuho Financial Group
320.30.5
6,583.11.423
1.1
Regions Bank 25 29 4,318.0
2.123 6,267.3
18▲
BBVA -3▼
10
4
▼-
12
16
TD Securities Inc 18
Citi
▼6Morgan Stanley
27,754.2
Goldman Sachs & Co
10 19,429.9
7 11,346.0
3 3 36,424.1 8.187
0.8 ▲ 181▼4
Share Ch.▲ ▼
21.5 -27 ▼20.7
Deals0.8 236
▼▼-0.4166.4 9.2
Fees# of Deals
0.6 ▲
Share%
109.5 6.1-2.36.3 ▼113.7
0.793.62 ▲
10.3 -35 ▼ ▲465 11 20,965.5 51.1 2.8
6.2 -0.3 5.2
384.7 2.5 ▲4.3 1.4 ▲ 3.7
5.5-0.7 ▼4.5 -28 ▼ 66.61.4 ▲
-0.37 6 14,674.7 3.3 ▼60 7.1 -39 ▼ 92.8 5.18 12,146.9 2.7 -1.7 6.5 -45▼ 55 0.0▼ 65.1 -3.6
9 12 12,005.1 2.7 0.6 1.2 ▲70 8.3 12 ▲ 2.7▼
49.13.4 -60 ▼ 47.229
▲2.6 -3.1 ▼
11 21 10,708.6 2.4 1.1 ▲ 1.0
63
▲65 7.7 11 ▲ 40.3 2.241 1.5 -0.2▲ 26.318 9,659.6 2.2 0.7 4.9
33
▼13 14 9,590.1 2.1 0.3 ▲
9▲0.4 ▲
14 9 9,311.9 2.1 -1.8 ▼ 3.9 -62 ▼ 58.7 3.37.5 -16 ▼ 40.3 2.2
-2.6 ▼15 16 9,046.0 2.0 0.2 ▲ -0.9 ▼57 6.8 -12 ▼ 30.0 1.7
5 8,560.4 1.9 -3.6 3.9 -72▼ 33 3.9 -1.4▼ 69.8 ▼BNP Paribas SA 17 17 8,166.1 1.8 0.1 ▲ 0.2 ▲28 3.3 -7 ▼ 1.2
19 7,770.6 1.7 0.322.1
3.8 7 ▲ 18.1▲ 32 1.0 0.1 ▲Scotiabank 19 20 7,375.4 1.6 0.2 ▲ 0.1 ▲34 4.0 5 ▲ 14.3 0.8SunTrust Banks 20 15 7,140.2 1.6 -0.2 7.5 0▼ 63 2.0 -0.4- 36.4 ▼CIBC World Markets Inc 21 23 6,814.7 1.5 0.5 ▲ 0.0 -29 3.4 8 ▲Mizuho Financial Group 22 26 5,257.1 1.2 0.5
7.9 0.42.1 4 ▲ 14.3▲ 18 0.8 0.1 ▲
General Electric Co 23 24 3,620.6 0.8 0.0 - 0.4 ▲48 5.7 0 - 35.8 2.0National Bank of Canada Fin'l 24 36 3,591.0 0.8 0.5 2.1 8▲ 18 0.3 0.0▲ 4.5 -KeyBanc Capital Markets Inc 25 25 2,960.0 0.7 -0.1 ▼ 0.1 ▲19 2.3 -30 ▼ 20.3 1.1
Americas Loans - Mandated Arrangers (R8c)
▼▲1.3▼▲▲
▼▲
66.6
6.2
Market
1.0
4.00.3
0.5
-0.3
12
-5.1
-4.2 ▼
Market
▲
▲
▼
▼
-3.9
-17.4% ▼
416,901.5
▲
▲
▲
100.0
-
▼
0.4
0.3341,761.8
10.5
0.6
▼23.5
Market
3.8
2.3
▼
0.5
Market
▲
-0.6Share Ch.
-5.7
2.3 0.5
▼100.0
69.8
US Loans - Bookrunners (R11)
Industry % Change over Same Period Last Year
JP Morgan
2014 Rank
▼
▼
43,591.4
5.3
Change in
▼
69.8
Share%
-2.5 ▼
1,838.81,281.8
Jan 1 - Mar 31
▼-45.6%
-276
▼9.4
Manager
▼
Industry Total
-38.4%
Top Twenty Five Total 359,775.2
-24.4%
857461,454.6
▼-17.2%
100.078.2
▼
Top Twenty Five Total 367,272.4 81.8 -5.2 1,294.2▼ 71.7 -6.0 ▼Bookrunner Total 449,906.0 100.0 842 -253 1,805.9 100.0
▼ -36.1% ▼ -45.2%Industry % Change over Same Period Last Year ▼ -23.1% -37.8%
-41.3%-17.0%
▼
Jan 1 - Mar 31
▼▼
Proceeds per Bookrunner (US$m) # of Deals per Bookrunner Imputed Fees (US$m)
Industry % Change over Last Quarter-37.4%Industry % Change over Last Quarter -41.2%
Bookrunner Proceeds# of
Share% Share Ch.2015 Rank
Market
236Fees# of DealsDeals Share%
31.0 166.3-42Bank of America Merrill Lynch 1 2 58,962.3 14.1 1.0173 22.7 -104 ▼ 113.2 6.4
Wells Fargo & Co 3 3 36,202.9 8.7 0.9 -27 ▼ 109.0▲ 179Citi 4 4 27,274.1 6.5 -0.2 0.9 ▲85 11.2 -33 ▼ 93.4 5.3Mitsubishi UFJ Financial Group 5 11 20,965.5 5.0 2.8 6.0 4▲ 46 2.9 1.6▲ 51.0 ▲Morgan Stanley 6 10 19,429.9 4.7 1.6 ▲ -0.8 ▼38 5.0 -28 ▼Barclays 7 6 14,666.8 3.5 -1.8 7.7 -39 ▼ 92.7▼ 59RBS 8 12 12,005.1 2.9 0.7 70 9.2 13 ▲ 49.1 2.8Goldman Sachs & Co 9 7 11,346.0 2.7 -2.5 3.8 -60▼ 29 2.7 -3.3▼ 47.2US Bancorp 10 17 10,708.6 2.6 1.2 65 8.5 11 ▲ 40.3PNC Financial Services Group 11 14 9,590.1 2.3 8.3 -15 ▼ 40.3▲ 63Credit Suisse 12 8 9,311.9 2.2 -2.0 ▼ -2.9 ▼33 4.3 -62 ▼ 58.7 3.3HSBC Holdings PLC 13 18 8,759.6 2.1 0.7 5.1 10▲ 39 1.4 -0.1▲ 25.0
-6
▼Deutsche Bank 14 5 8,560.4 2.1 -3.8 ▼ -1.3BNP Paribas SA 15 16 7,896.1 1.9 0.2 ▼ 22.0▲ 27 1.3
33 4.3 ▼-713.5
RBC Capital Markets 16 9 7,890.1 1.9 -1.5 ▼ 0.2 ▲42 5.5 -35 ▼ 60.1 3.4SunTrust Banks 17 15 7,140.2 1.7 -0.2 8.3 0▼ 63 2.1 -0.4- 36.4 ▼Mizuho Financial Group 18 24 5,257.1 1.3 0.6 ▲ 0.1 ▲18 2.4 5 ▲BMO Capital Markets 19 19 4,698.6 1.1 -0.1
14.0 0.85.0 -14 ▼ 24.538 1.4 -1.0 ▼
General Electric Co 20 21 3,620.6 0.9 0.0 ▲48 6.3 2 ▲ 35.8 2.0TD Securities Inc 21 27 3,335.8 0.8 0.3 1.6 2▲ 12 0.8 0.2▲ 14.3 ▲KeyBanc Capital Markets Inc 22 22 2,960.0 0.7 -0.1 ▼ 0.2 ▲19 2.5 -30 ▼Scotiabank 23 28 2,813.1 0.7 0.2
20.3 1.21.6 2 ▲ 7.012 0.4 0.1 ▲
Rabobank NV 24 42 2,490.4 0.6 0.4▼ 9.1
▲8 1.0 4 ▲ 19.7 1.1 0.5Societe Generale 25 34 2,285.2Top Twenty Five Total ▼
0.5 0.2 ▲-5.1
-11,285.8
100.0-247
1.0▲82.1
873.1
1,763.3
34 5% ▼
Bookrunner Total
I d t % Ch L t Q t 40 4%Industry % Change over Same Period Last Year -24.5% ▼ -36.4%
US Leveraged Loans - Bookrunners (R11a)
Proceeds per Bookrunner (US$m) # of Deals per Bookrunner
125 -55
2015 Rank
2014 Rank Proceeds
Market MarketShare% Share Ch.
Manager Market# of Deals
Imputed Fees (US$m)Market
Fees Share% Share Ch.# of Market Change in
Bank of America Merrill Lynch 1 2 19,210.1Deals Share%Bookrunner
▲ ▼-45
9.0 -0.30.7 ▲6.1▼
▼ 119.29.2 2.0
12.9 1.3
18.1▲ 86
30.1
76.3-928.7 -3.380.5Wells Fargo & Co 2 4 13,641.7 20.7
▼JP Morgan 3 1 12,886.7 ▼ 5.8 -2.6▼ 75Citi 4 8 7,095.2 4.8 -0.5 ▼ ▲30 7.2 -37 ▼ 67.1 5.1 1.0Deutsche Bank 5 3 6,835.3 4.6 -2.9 6.0 -60▼ 25 4.8 -0.9▼ 63.1 ▼Barclays 6 5 6,678.3 4.5 -2.1 ▼ 0.0 -34 8.2 -43 ▼Credit Suisse 7 6 6,478.9 4.4 -2.1
81.0 6.15.8 -65 ▼ 55.4▼ 24 4.2 -2.8 ▼
RBC Capital Markets 8 10 4,845.3 3.3 -0.9 ▼ 0.9 ▲27 6.5 -30 ▼ 55.1 4.2US Bancorp 9 19 4,785.1 3.2 2.3 5.8 -3▲ 24 2.4 1.4▼ 31.4 ▲Morgan Stanley 10 9 4,469.9 3.0 -1.3 ▼ -2.2 ▼27 6.5 -33 ▼RBS 11 14 4,134.0 2.8 1.1
38.8 2.99.2 5 ▲ 38.5▲ 38 2.9 1.6 ▲
SunTrust Banks 12 12 3,626.1 2.4 0.0 - -0.5 ▼35 8.4 -12 ▼ 29.1 2.2General Electric Co 13 16 3,493.3 2.3 1.0 11.1 5▲ 46 2.6 0.9▲ 34.6 ▲Goldman Sachs & Co 14 7 3,365.6 2.3 -3.8 ▼ -3.4 ▼19 4.6 -62 ▼PNC Financial Services Group 15 17 3,278.3 2.2 1.2
34.0 2.65.3 -10 ▼ 28.2▲ 22 2.1 0.5 ▲
Mitsubishi UFJ Financial Group 16 25 2,301.0 1.5 0.9 ▲ 0.4 ▲11 2.7 -4 ▼ 14.9 1.1KeyBanc Capital Markets Inc 17 20 1,996.5 1.3 0.4 2.4 -24▲ 10 1.4 0.3▼ 18.9 ▲BMO Capital Markets 18 15 1,891.7 1.3 -0.2 ▼ -1.3 ▼25 6.0 -18 ▼Jefferies LLC 19 13 1,808.1 1.2 -0.7
17.1 1.32.2 -26 ▼ 30.6▼ 9 2.3 -0.7 ▼
Rabobank NV 20 45* 1,750.4 1.2 1.1 ▲ 1.1 ▲5 1.2 3 ▲ 19.0 1.4Macquarie Group 21 27 1,609.6 1.1 0.6
1.2 ▲1.2 -7▲ 5 1.9 0.9▼ 25.6
0.8 -0.2
▲Nomura 22 32 1,449.2 1.0 0.6 ▲ 1.8
3.6 -2 ▼ 11.36 1.4 2 ▲
Credit Agricole CIB 24 28 890.6 0.6
23.8HSBC Holdings PLC 23 18 1,181.8
0.6▼ 15 0.9 -0.4 ▼
▼0.1 ▲ 0.3 ▲9 2.2 -1 ▼ 8.1
BNP Paribas SA 25 23 876.3 0.6 -0.1 11 0.7 0.0▼ 9.3 -2.7 -3Top Twenty Five Total 120,579.0 81.2 -5.5 -3.9 ▼
149,021.0 415100.01,010.9 76.4
-289▼
1,325.8 100.0762
47 3%-45.4%Industry % Change over Same Period Last Year ▼ -41.1% ▼
Bookrunner Total
44 5% ▼ ▼▼▼I d t % Ch L t Q t ▼ 43 5%
-51.0%48 4%
▼▼ -34.5% ▼Industry % Change over Last Quarter -40.4% -47.3%-44.5% ▼ ▼ ▼Industry % Change over Last Quarter ▼ -43.5%-48.4%
https://www.thomsonone.comVisit http://dmi.thomsonreuters.com to View Archives and Order Custom League Tables5
12.1 -4.2
Market
▼
▲
▼
▲ 7.7
-1.96.7
Imputed Fees (US$m)
9.6
Market
-4.1
▲ 0.67.50.9
6.0
0-10
▲1
▼
▲
2
2014 Rank
1
43
5 5
2
Share%
Proceeds per Bookrunner (US$m)
Share Ch.
-1.2
28,145.537,527.5
▼12.2
4
-0.1
10
8
18
▲▼
0.4
1.1
16,809.719,395.8
3.57,715.8
Proceeds
▼
▼
-7.7
5.0
-
▼
▼▼
313 8
0.7
3.4
7.3
22
▼
4
52
Deals101
Share%
87
Market
43.7
17.6
-5
4
6
12-4
915
▼
3
12
35
7▲
12.6 ▼▲6.0
-5▲▲
9.0
-0.5
4.5
-0.3
2.0
3.411.5
5.6
3.7
8.8
8.7
▲
▼
▲
3.1
▲
10.0
0.3
3.2
▼
0.1▲
Americas
-2.2
3.1▲6.5
▲
6.8
0.3▼
Share%
2.5
▲▼
# ofBookrunner
2015 Rank
3 1
14,893.6
1,872.7
7,980.5
Market
0.0
16.3
▲2.7
-0.6
2.2
8.4
Market
▲
-1.0
-0.7
2,832.9
1,716.2
1,929.3
122,588.1
-35
2118
521 22
25 1,315.2
2,089.7
▼249
209 838 8
1,393.117
Mizuho Financial Group 14
1928
Lloyd SecuritiesUBSDeutsche Bank
22
2.0
▲2.0 ▲
PNC Financial Services Group
1516
13
20
11
▲0.6
91 1▼
▲
7-2.54
0.51
SunTrust Banks
2019BMO Capital Markets
1718
Bank of China Ltd
TD Securities Inc
Societe Generale
Credit Suisse 16
Scotiabank
RBC Capital Markets
3.81.4
1.687 7
1.10.7
0.51.3
0.3
5.51.9
0.7
0.1
1.5
3.3
-0.4
1.7
1.1
-
Share Ch.
▼
▼
34.3
0.4
1.6
-0.7-0.4
41.282
2524.2
2.61
712
27
1
-1850.8
1
27.713.22
12.6
11
31.226.1
# of Deals per Bookrunner
▲
▲
-0.7
▲-
▼▲
0.0
-
▲
11
7
US Investment Grade Loans - Bookrunners (R11b)
1
# of Deals
Goldman Sachs & Co
6,668.6 6.013.6
▲
5.0
11.1▲
0
▲9
122.9 ▼7
6.5 10
0.210
Bank of America Merrill Lynch
7,433.5
2,989.9
5,167.76,569.6
RBS
13
4,451.2
Wells Fargo & CoJP Morgan
BNP Paribas SA12.3
7.1
4.5
▲▲
4,434.625
HSBC Holdings PLC10
1.9
0.6
0.8
0.8
2.9
1.9
0.7
0.9
0.8
1.3
-0.3
▼
▲
▲
0.2
0.3
▲
0.80.7
0.7
0.6
▲▲
▼-0.6
▲
5.0
▼6 ▲
14
8
4
83.2
19,793.1 8.6
▼ Americas Yield Type-0.2
2,553.5 1.1 -1.23.54.0-0.1
Mitsubishi UFJ Financial Group6 15Morgan Stanley
Citi
6Barclays
3
US Bancorp
Change in
Jan 1 - Mar 31
43.4
24.0
Manager
First Quarter 2015 | Syndicated Loans | Managing Underwriters
Jan 1 - Mar 31
▲
2
7
5.9
8.0
11.0
7.0
1
▼
▼
1
2.8
▲
2.0
2.2
▲
7
8
17
0.4
2.5
1.23.5
5.91 4
3.5
Top 10 Americas Loans Use of Proceeds (US$m)
-1.3▼
23 0.7
1.3
Top Twenty Five Total
1,571.5
Fees
0.2
$203,893.246% $85,789.5
19%
$59,279.113%$37,342.1
8%$18,928.64%$16,253.1
4%
$7,693.82%
$7,163.12%
$5,391.51%
$4,633.81%
General Corporate Purposes Acquisition Financing Refinance Bank Debt Refinancing
Working Capital Leveraged Buyout Property Acquisition Capital Expenditures
Export/Import Finance Project Finance
600
700
800
2.0 ▲Santander 23 17 83.3 0.7 ▼6.7 -6 ▼ .1
▲1.71.2 2.8
0.3 -0.6Rabobank NV 21* 27 89.7 0.8 -
▲ING 21* 13 89.7 0.8 -3 ▼ 1.1 2.6
Industry % Change over Same Period Last Year -3.9% ▼
Top Twenty Five Total
Standard Chartered PLC 13.3 ▼
Full Year
-58.3% ▼
-3 ▼1
2 0
6.7
▼
▼
15
12
2
13.3▼
-71.2%
-21
-1
▲
.6▲
13.3
1.3
1.1
-3
▲
1
0.5-1.6 1
▲▼
0.9 -1.6
-0.0-2.1
0.9 0.9
- 6.7
▲▼
1
▲
1
1
▼
Market
0.3 -0.5
0.01.0
1.0
1.2
1 ▲
313.8
37.4
▲
1.2
▼3.3
Jan 1 - Mar 31
-9.9
2.8 6.6
Share%
▼
Share%33.3
Market
-4895.8
-3.1
21*
15
1,097.5
▲
Latin America Loans - Mandated Lead Arrangers (R16)
Industry % Change over Last Quarter -38.3% ▼
209,838.8
Industry % Change over Same Period Last Year
Mizuho Financial Group
91.1
▲
-2.6
4.0
3.1
▲
▼
▼
-6.6
Share Ch.
▲
-4.6
▲2.5
88.6 9.1
1.3 3.1
.2
-2.5
1.4 -0.2
3.3
7.9
0.4 0.4
Americas Imputed Fees - Mandated Arrangers
▼
FeesMarket
▲
▲
▲
7.9
2.8
87.7
1.591
2014 Rank
Proceeds per Mandated Arranger (US$m)
▲
# ofDeals
3.6
Market# of Deals per MA
100.0
16.9%
9.5
-10 ▼
6▲ 2
5
3 20.0
-1
▼
1.3▼
▼
6.926.7 -1
13.32.8
2.92.5
1.2▲ -7
▼
-1.4199
▼▲5.9
▼ -35.5%▼
# of DealsChange in Manager
20.03
3.67.8
2.6
1.2
20.0
7.3
▼
895.8-5
Market
▼5.7
Proceeds
933.37.8 3
2015 Rank
8.1
Share% Share Ch.
2 -9.5
Mandated Arranger
3*BBVA
5
BNP Paribas SA 16
845.886
JP Morgan 5HSBC Holdings PLC 3* 3
Bank of America Merrill Lynch 7 77.3 ▲ 40.0Natixis
758.3843.2 3.4
▼-32.2
Mitsubishi UFJ Financial Group 9* 11 695.8Societe Generale 8 702.2 2 ▲ 2.4 5.6 5.05.1 26.74
20.0 -2 ▼ 1.4▲ 36.0
4▲
3
▲
2.76.16.6
Credit Agricole CIB 11 10 665.5Sumitomo Mitsui Finl Grp Inc
-36.0 2.8 ▲
2.89* 12 695.8 20.0 -1 ▼ 1.4
2-3.94.4 ▼
1.22.5
56.620.0 ▼
-1.6▲ 35.8
Itau Unibanco 13 2 322.8Citi 12 4 509.2
2.8▼33.3 -3 ▼ 2.1 4.9
3.313.3
Banco BTG Pactual SA 14* - 302.8Caixa Economica Federal 14* - 302.8
▼
3.9
2.6 2.6 1 ▲▲ 3.36.7 3.3
1.6▲
1
3
6.7
6.71.0
20.0
ABN AMRO Bank
Scotiabank 0.51.9KfW IPEX-Bank GmbH 17*
111.9-111.9
100.0105.0
Bayerische Landesbank Giro 17*21*
Commerzbank AG 20 -19
100.094.6 23.510,911.2
11,548.6Industry Total
▼
▲ 116 19 220.8 ▲
2.6 2.6
-39.1%
41.9
▼-55.0%
100.0
▼-47.8%
▲
7.9
-6.74.6
7.9
-9
▲
▲0.9
Imputed Fees (US$m)
2.5
2.411
3.1
▼Top Twenty Five Total
▲▲▼
▲
▼
7.9
Industry % Change over Last Quarter
-4.3%
Bookrunner Total 358.3
Banco Latin Americano Export-
28
-35.4%24.3%
230,291.8 100.0
53.0▼
.7 1.76.7 12425
0.536.7
1.7 ▲.5 1.1 0.8 ▲
▲6.7 -4
0
100
200
300
400
500
600
1Q 2Q 3Q 4Q 1Q 2Q 3Q 4Q 1Q 2Q 3Q 4Q 1Q 2Q 3Q 4Q 1Q 2Q 3Q 4Q 1Q 2Q 3Q 4Q 1Q
2009 2010 2011 2012 2013 2014 2015
Pro
ceed
s (U
S$b
)
Undisclosed (US$b)Highly Leveraged (US$b)Leveraged (US$b)
899 930872
375
532
897954 999
1,133
857
0
300
600
900
1,200
1,500
0
0.5
1
1.5
2
2.5
3
3.5
1Q06 1Q07 1Q08 1Q09 1Q10 1Q11 1Q12 1Q13 1Q14 1Q15
# of
Issu
es
Tota
l Im
pute
d Fe
es (U
S$b
)
Total Imputed Fees (US$b) Number of deals
*tie
https://www.thomsonone.comVisit http://dmi.thomsonreuters.com to View Archives and Order Custom League Tables
y g Q
6

`
EMEA syndicated lending for the first quarter of 2015 reached US$221 billion, essentially flat compared to the sameperiod last year. Borrowers from the Energy and Power sector were the main drivers of EMEA activity, accounting for24% of volume, with borrowers from Industrials and Financials receiving 19% and 12% of loans proceeds, respectively.General Corporate Purposes made up 45% of loan uses in the year-to-date period, followed by Refinancing andRefinancing of Bank Debt, accounting for a combined 26% share.
The target nations with the largest year-on-year gains were Italy (up 532%), Switzerland (up 240%), Qatar (up 156%)and Spain (up 109%). Target nations in decline included Egypt (down 59%), France (down 43%) and Belgium (down33%).
According to Thomson Reuters/Freeman Consulting, first quarter 2015 arranging fees decreased 26% from the sameperiod a year ago. The leading fee earner in the EMEA region was JP Morgan, with US$41.6 million in fees (a 6.3%wallet share).
Jan 1 - Mar 31 2015
Europe, Middle East & AfricaEMEA Borrowing Flat | Italy and Switzerland Targeted Loans Up Significantly | JP Morgan Top EMEA Fee Earner
EMEA Use of Proceeds (US$b) Jan 1 - Mar 31 2015
Top EMEA Syndicated Loans (US$m)
First Quarter 2015 | Syndicated Loans | Managing Underwriters
EMEA Deals Intelligence
$10,764.0
$9,999.3
$7,655.2
$5 300 0
Enel SpA
ARAMCO
Deutsche Annington-Hotels(5)
Trafigura Beheer BV
$100.145%
$28.213%
$28.113%
$22.310%
$11.05%
$6.93%
$6.53%
$10.85%
General Corporate Purposes
Refinance Bank Debt
Refinancing
Acquisition Financing
Project Finance
Export/Import Finance
Leveraged Buyout
Working Capital
Capital Expenditures
▼ -32.4%
Bookrunner Total
1,402.925
▼Industry % Change from Last Quarter -30.0%
1.0
348.483.4
5
135,872.1113,105.0Top Twenty Five Total
▲▼
100.0
58CaixaBank SA
Industry % Change from Last Quarter
▲0.8
Industry % Change from Same Period Last Year -8.0% ▼ ▼-15.5% ▼-27.0%
2.7
-51.1%
▲
▼
▲ 70.8 4.38.7 ▲
-45.8%
-30163
0.5▲72.6
Industry Total
3.5DNB ASA 23 23
29
Industry % Change from Same Period Last Year
252.2 8.7100.0
▼1.2
0.9
4.9 -3 ▼2.5▼ 4
81,740.0-0.8
Standard Chartered PLC-0.1
▼-0.31.01.4 ▼
▼4.7
100.0
▲2
1,979.8 0.122 2.7▼▲ 12▲
Nordea 24-0.6DNB ASA 23 19
Bank of America Merrill Lynch 22 1.5 1.17.4 9.5-1Mizuho Financial Group 21 32 2,293.5
18 1,623.8 -61.3
▲Lloyds Bank 20 11 2,328.4 1.7Sumitomo Mitsui Finl Grp Inc 19 -26.1
-1.4 3.1▼2.12.89.6▲13▲ 8.0
-1.90.10.9▼ 3.0
▼14 8.6 -6 ▼ 0.91.7
Standard Chartered PLC 18 24 2,699.4Banca IMI (Intesa Sanpaolo) 17 2.0 1.4 ▲
102.0 0.8 ▲15
26 2,683.2 ▲ 102.0 1.00.0
0.1
1 ▲ 2.9
▲▲9.2 7.57
-2.2 1.60.8
▲6.1
36 2,778.5
Santander
14 ▼Mitsubishi UFJ Financial Group 15 13Barclays 14 7
4.82,849.2
2.9 ▼1.4 -0.58.6 -82.1
3,896.0▲ 15 9.2 4.8BBVA 16 31 1.1 1.46 ▲
13
-0.0
3.521 12.9
0.4 ▲
13.812
3,921.1 ▲3,941.5 ▲
27▼2.92.9 0 -
25 ▲1.5 ▲21 12.9 -4
8.2▼ 12.1
1.8 ▲16.6-1.2 1.6
2.3 1.64.0
▼Natixis 12 16 3,966.4 2.9
3.2 -0.2 ▼ 23ING 11 10 4,296.0 2.5 -1.414.1 -3 ▼ 8.8-0.5 ▼
3.2 -0.73.4
▼Societe Generale 917.2-0.5 ▼UniCredit
6 23 14.14,986.711.710 8 4,499.3 283.3 -5 ▼
3.8 -1.1Commerzbank AG 8 5 5,116.53.7 -0.6 ▼
Citi-0.9 ▼26 16.0 -9 ▼▼
1.17.2
▼ 11.3-11
▲7 12 5,498.52.1
RBS 6 9 5,831.2 4.3▲2.7 0.510.4 04.1
▼
▼ 17.7▼
14.725.25.6
-1.4 ▼42
0.7 ▲0.1 ▲3
2414.2
-2 ▼
JP Morgan 1
BNP Paribas SA 4 2 7,906.0 5.8Credit Agricole CIB 3 34
-2 ▼ 18.2▼-0.520.9
3.1HSBC Holdings PLC 5
Deutsche Bank 2 4 9,217.16.2
-1.041
5.225.81 8,282.7
7,664.4 ▼
# ofShare Ch.
6.1 ▲
Manager
Imputed Fees (US$m)Market
DealsChange in
Proceeds per Bookrunner (US$m)
# of Deals13.5
2015 Rank
2014 Rank
MarketShare % Share %
36.0 10.3Share Ch.
EMEA Mandated Lead Arrangers (R19)
# of Deals per MLA
39
EMEA Bookrunners (R17)
MarketShare %Bookrunner Proceeds Proceeds Share % Share Ch. Deals Share %
2014 RankFees13 12,640.7 5.7 3.5JP Morgan 1
▲6.1 -1.76.8 1.5 ▲
# of Deals per Bookrunner
5.1-2
Jan 1 - Mar 31
Proceeds per MLA (US$m)Change in
Jan 1 - Mar 31
16.6▲
Market
Imputed Fees (US$m)
2015 Rank
17 - 9.5
-1 ▼32 19.6▼
▲4.1 -1.3
▼
3.6
4.8
Manager Market MarketMandated Arranger
Market # of Market# of Deals Fees Share % Share Ch.
Market
10.8-4
Market
7
-31.3%
15
22.5
11,702.9 8.6 22 5 ▲0.3
▲52
1.0
0.0
71.3 1.8
13.33.0 0.4
▼
-1 ▼
1.0
4.7▲-
1.4
3.83.1
2.21.7
- 14.6
26.928.8
▲
▼ 4.1-0.8
-0.2▼ 31.1
0.0▲
▼
▼-
0.6 ▲4.3▼
3.4▼
RBS 6
4.8 -0.2
3.7Credit Agricole CIB 5 3 8,135.9
8,099.0
BNP Paribas SA 3
-8
▲1.2
713.7 -0.9 ▼4
62 19.6UniCredit 7
▲-31 ▼
5 7,618.3 3.5
-1.7
0.5-0.8 ▼
▼-0.9
▼
4.032.8 5.0
▲12.3
Deutsche Bank 2 6 10,775.9 4.9▼▼
26.5 4.0 -0.21.041.6 6.3 2.8▲ ▲
HSBC Holdings PLC 26.46
64
16.5 0 -30.797
7 12 8,090.6 3.7▼ 25.1
20.520.3 -28
2 10,611.54 1 10,528.8 4.8 -2.3 ▼ 89 28.2
▲
2.0 0.5 ▲2.6
-12-0.5 ▼-6
63-0.1ING 10
Barclays 8 7 7,945.1 70 22.2
10 7,398.6
-0.3 ▼
19.963
3.4 -1019.9
▼Societe Generale 9
15 5,727.818.0 11Santander 13 17 6,147.5
Commerzbank AG 12Citi 11
4911 6,622.2 429 6,620.3 3.0
▲▲ 57
7.910.2
▲ 13.812.2-0.6
6 ▲
-5▲ 12.4
15.3▲1.5-40.6 ▲ ▼ 10.228 8.9
-0.2 41
0.5
2.30.1
▼
1.8 -0.6
0.6
▼▼
2.8 0.8
22.3
▼ 15.338
2.1
2.02.0
-1.7
1.9 ▲
15.5 -10 ▼▼
2.312.01.2 -0.41.5 -2.2
43 13.6 17 ▲ ▼▲
0.4 ▲1.9▼
11.5
16 8
8.9 1Banca IMI (Intesa Sanpaolo) 20 31 3,756.2 9.8
281.7 0.6Mizuho Financial Group 19 30 3,830.6Natixis 18 14 4,174.6Sumitomo Mitsui Finl Grp Inc 17 22 4,342.4
13.0 -11
4,447.2
▲1.6
1.2 9.46.6 2.0 -1.3 ▼
1.4 -0.32,688.7
220,983.7156,877.5
0
▲
-0.1 ▼631 ▲
1.5 0.7 220.6 ▲
▼-0.2 ▼ ▼
1.2 -0.8-0.0
447.40.31.712
67.6
0.67.0
13.3
1.2
8 ▲ 3.8 ▼
-58
7.3-0.1
-1
100.0
1.2 0.1 ▲2,592.0Top Twenty Five Total
▼-15.5% ▼ -26.3%
316
37 11.7
13.8 2.1
-30
0.3
▼ -39.5%
662.9▲
3.8
Club deal volume is not included in Thomson Reuters' Bookrunner League Tables; however, Mandated Lead Arrangers volumes include both bookrun and club transactions.
▼
0.4%
Goldman Sachs & Co 24 16
3,670.1
Bank of China Ltd
▲31
3,303.89.8
1.7 0.6 ▲
▲
Bank of America Merrill Lynch 21 19 1.7▲
-1 ▼21▼23
22 37
252,600.8
Lloyds BankBBVA 15 21 4,508.9Mitsubishi UFJ Financial Group 14
$5,300.0
$5,197.1
$3,935.0
Trafigura Beheer BV
Borealis Swedish Elecity
Vodafone Group PLC
Capital Expenditures
Others
Visit http://dmi.thomsonreuters.com to View Archives and Order Custom League Tables https://www.thomsonone.com7

Danske Bank 24 - 200.3 1.0 1.0 ▲ 1 2.9 1 ▲ 1.3 0.7 0.5 ▲Top Twenty Five Total 17,736.4 88.3 11.5 ▲ 136.1 79.5 9.9 ▲
Share Ch.
6.91,328.13 6
Share %
Market2014 Rank
2015 Rank Deals
Market
Bookrunner
European Leveraged Loans (P10)
Europe, Middle East & AfricaFirst Quarter 2015 | Syndicated Loans | Managing Underwriters
Proceeds per Bookrunner (US$m)
Jan 1 - Mar 31
Proceeds
EMEA Quarterly Syndicated Loan Volume
Share % # of Deals
Credit Agricole CIB 21 5 2,532.4 ▲
Share Ch.
# of Deals per BookrunnerMarket
Fees Share %
Market# of Market Change in Imputed Fees (US$m)
12.8Deutsche Bank
34.3121.1 ▲-2.4
6.74
▼2.71
▼
▲
9.6 5.69 25.7 23 1,369.16.6 31.4 ▲0.1-211 ▼ 6.210.6
Manager
▲3.4 -1.9▲ 5.7
▲
▲
0.31HSBC Holdings PLC
RBS-5.8 0.0▲ 11,080.17 5.4 0.3
11.422.9
1.56.2 4.2 ▲8JP Morgan
4.5
▲ 83.01 970.5
7 19 942.2Natixis
4 16 1,232.4
6.1
10.0-5.2
▲
5 ▲BNP Paribas SA 6
4.73.8 2.3
22.96 17.1 28
5.0
6.6
▼9.3
Goldman Sachs & Co 9 2 706.1 ▼-3
7 ▼6
20.03.6 -6.3
11.4▲ ▲2
▲1.7
-2.55.4
21 754.2
3.2 4
▲ 4.2
-1.0
-1.1-0.4
3.8
2.92.7
4.57.78.8
-3 -3.3
▼ 9 25.7▲ 3.6
0 -4.9
Barclays
ING 12 2.9 423 575.1 1.4
-0
▲
8 654.24.611.4
▼
641.9 ▼
5.1
▼▼UniCredit 10
Societe Generale 113.3
-2▼17.10.0
0.3 ▲
Nomura 15 4 528.714 536.0 4
2.8 5 14.311.42.7
▲▲
Credit Suisse 13 10 555.8Citi 14
2.7 -3.7 4 11.4
185392.0 1.1 ▲ 14.3 1
21.830
0.02.0
- 3 ▼ 6.6▲
42 513.1 2.6
29
Banca IMI (Intesa Sanpaolo)40* 441.4
16Santander 17 2.2 1.6
▲Instituto de Credito Oficial 21* - 365.3Morgan Stanley 20 11 383.9
8.6-5.7
-1
4.22.3▲
12RBC Capital Markets 19
2.2
11.4 ▲
426.2Bank of America Merrill Lynch
Mizuho Financial Group 23 - 1.2▲ 1
242.1
-014 11.4
3.40.0
0.42.9 11.8-0.4 ▼
1.81.9
365.3 2.91.21.8 1.4 -1
▲ 2 5.7Bankia 21* 40*
▲
▼▲
0.4.7
▲▲
▲0.0
▲-
▼
EMEA Syndicated Loans by Industry (US$b) Jan 1 - Mar 31 20153.6
.7
6.1
3.8
0.4
2.2
▼
▲
-
-0.63.2
2▼
6.9
2.00.51.92.44.0
2.440.93.9
3
▲
▲▲
-
▲-1 5.5
0.60.1 0.2
4.1-1 ▼
2.12.47.4 4.4
▼
9
Energy and Power
223276
249 264 265
341315
362
379
464
418
400300
390
315355
355 387 395424
374
519501
460
316
0
100
200
300
400
500
600
$0
$50,000
$100,000
$150,000
$200,000
$250,000
$300,000
$350,000
$400,000
Q1 Q2 Q3 Q4 Q1 Q2 Q3 Q4 Q1 Q2 Q3 Q4 Q1 Q2 Q3 Q4 Q1 Q2 Q3 Q4 Q1 Q2 Q3 Q4 Q1
2009 2010 2011 2012 2013 2014 15
# of
Issu
es
EMEA Proceeds (US$m)Number of deals
Pro
ceed
s (U
S$m
)
Morgan Stanley 25 15 48.2 0.7 -1.4 ▼ 1 5.3 -2 ▼ 1.0 1.0 -0.6 ▼Top Twenty Five Total 6,547.2 89.3 - - 87.3 84.5 5.8 ▲
19,860.2 100.0 35 -25 170.9 100.0Bookrunner Total
▼Industry % Change from Same Period Last Year
1.0
10.52.5
▼0.1
▲
5.31-2.2
1.1-
0.8▲-5.31.1
15.86.221.1 6.00 -
4.34.7
▲ -310.52▲▲
▲
▼
4.5-3 ▼
1 ▲ 3.84.03
▲ ▼
▼4.9 4.8
-1.1
4.9 ▼-5.115.8
--35.3
5.31
2.4
15.82
2.3
▼1
▲
-25.311
1.8▼
▼
-1.42.3
▲ 0.5
1.8
▲2.5 2.5 1.0 ▲
6.1
2.4
5.9
1.51.4 1.4
0
5.6
▲
1.1▼ 0.2
2.5
▲
▼1.7 ▲
▲
▲
1
▲
5.3 -1
5.3
1
-3 ▼
2.3
0.31.1
1.51.5
.8
1 ▲1 5.3
1
-1.4
-5
3.2
2.32.3
▼1.8
2.9 2.9
▼ 5.1
26110.2
JP Morgan 15 6 158.5 2.2 2.2
3.48
RBS 14
Nordea 16* -
-4.1
3.3
121.6
▲210.5-3 ▼
▲ 210.5 -1
18
-0.9
-53.7%
.10.51.0
Banca IMI (Intesa Sanpaolo) 22▲
1
1
DNB ASA 16* - 131.9 1.8 1.8
4 110.2 1.5Bank of IrelandNomura 19*
162.5
1.7
31 81.321 98.8
Rabobank NV 19* 19*Credit Mutuel SA
RBC Capital Markets 8 17 281.4
10 76.1 1.0 ▼76.1
▲
▲ 1Santander 23* 5.3Lloyds Bank 23*
▼Industry % Change from Last Quarter -50.8% ▼ -20.8% ▼ -53.6% ▼
-59.0%▼ ▼-67.2%
BNP Paribas SA 9
131.9
13 209.8Bank of America Merrill Lynch 11*
14
Mizuho Financial GroupCredit Suisse 10
3.3 3.3
24 186.3ING
3.5
2.5
1.8
248.011* - 242.1 3.3
3.4
12 242.13.3
Goldman Sachs & Co 526.34.5 ▲
1 330.5 4.5
4.2 4.27 309.5
4.5 ▲
▲ 3HSBC Holdings PLC 6 9 330.0 54.5UniCredit 7
3
6.5
Bookrunner1,701.1Deutsche Bank 1
Barclays 2 18 370.2 21.1▲5 23.2
▲ 55.1 ▲
26.34.9
Industry % Change from Last Quarter -16.7%-26.1%
# of Deals per Bookrunner
Share %Proceeds
▼
Change in Market Market
Proceeds per Bookrunner (US$m)Market
Share %# of2015
Rank
Bookrunner Total
4 1.15.62.3
3 330.64.9
EMEA Sponsored Loans (P13)
4.5Natixis 3 11 361.6Credit Agricole CIB
-41.7%
▲1 ▲ 5.36.3
Jan 1 - Mar 31
Imputed Fees (US$m)
▲
▲
ManagerShare %
▲
▲
-46.4%
▲
▼5.1 -3.62.1
▼
4.9
▼
EMEA Imputed Fees Jan 1 - Mar 31
4.8
7,328.6 100.0 19 -22 103.3 100.0
▼
▲
3.8
-2.92.7
0.5
23.2
-0.9
▲
2.42.6
▲
▼
5 26.3
▼▼ -49.1%
-5
Market Market# of Deals
6.6Fees
1 ▲ 5.05.74.5 ▲ 3 15.8 -2 ▼
15.8 ▼
2
2 259.2
5.3-1 ▼ 2.2-5
3.5
-2.3
33.8 ▲ 43.8
▲
3 15.8
Industry % Change from Same Period Last Year
-42.0% ▼
5.1
2014 Rank Share Ch.
▲Deals
0.14
Share Ch.6.8▼
434
504
344
223
265
379
300
354373
316
0
100
200
300
400
500
600
$0
$1,000
$2,000
$3,000
2006 2007 2008 2009 2010 2011 2012 2013 2014 2015
# of
Issu
es
Tota
l Im
pute
d Fe
es (U
S$m
)
Total Imputed Fees (US$m)Number of Deals
$70.032%
$34.115%$23.4
11%
$17.78%
$14.47%
$13.36%
$10.55%
$9.34%
$8.84%
$7.03%
$6.93% Industrials
Financials
Media and Entertainment
Telecommunications
Retail
Materials
High Technology
Consumer Products and Services
Healthcare
Consumer Staples
Real Estate
Visit http://dmi.thomsonreuters.com to View Archives and Order Custom League Tables https://www.thomsonone.com8

Axis Bank LtdFubon Financial Holding Co Ltd
Sumitomo Mitsui Finl Grp Inc 1023 676.9 3.0▼1.4 -2.00.12.2
-6 ▼ ▼3.1-0.8
▲1.4 1.1 ▲ ▲
▼ -2 0.31.8 1.0-4
0.9
5.05
▼53.8
▼5
▼
1.321
Chang Hwa Commercial Bank 22
▼-4▲
16
8
Oversea-Chinese Banking 19▲
679.2
2.3741.3
3.11.5 -1.2
5.03.1
1.6
48
8
▲1.9 -3 ▼ 2.4 ▼
13
1.220 33 768.9-1.4
2.83
▼ 4.78.10.6
1.6 -0.1
840.11.0
800.8838.5 -1 1.4
1.4▲
ANZ Banking Group 17 28 1.718 37
▲CTBC Financial Holding Co Ltd 1.7
▲▲
▲ 3.39▲ 12
1 0.47.5 0.33.5 2.1-4 ▼5.6 2.0
1.81.8 1.0
0.4Bank of Taiwan 15Mega Financial Holding Co 16 32 900.9
-3 ▼ 3.90
▲ 9
▲▲
7 ▲
60.2
- 3.11.6
▲2.3 1.61.6Deutsche Bank
5.621 907.11.9 1.014 31
▲ 125.2924.6
-6▲ 4.3
7.5
BNP Paribas SA 3.3 1.4
Taiwan Cooperative Bank 13 26 930.13.7 1.23.7
0.71.92.2
▼-0.1 ▼
2.712 953.9 -2 ▼1.9Korea Development Bank 12
▼ 5.5
▼2.03.4
7-1.53.9
5.611
11 14 1,040.2 ▲6.8 -6 6.6 ▼4.3 -2▲
1,157.4 2.4 -0.5 ▼0.32.1
-0.55.6 0.15.2
-1 ▼▼
02.8 ▲DBS Group Holdings 9 19
HSBC Holdings PLC 10 7
▲1,360.1
9Mitsubishi UFJ Financial Group 8 20 1,370.891.4
3.1-0.4 2.1
State Bank of India
-2.8 1.4 ▲14Standard Chartered PLC 7 5 1,441.1 3.4
▼6 1-92.9
▼1,804.8 4.3 -34▼
78.7
1.33.7 -17.9China Development Bank 5 4 2,263.9 -0.8
2,349.84.6
Mizuho Financial Group 42 4,937.3
2.5 10.69.9
▲ 174 2.5▼
1 3China Construction Bank 2 11
4.810.0
9Bank of China Ltd 3
11.4 9.316
▲▲
52.8
Industrial & Comm Bank China
MarketShare %
19.420.5 -33# of Deals Share %Bookrunner Proceeds
5,626.68,464.4 17.2 ▲10.4 ▲11.6 8.3
▲▼
▼3.5 -0.7▲4.9▲▲
8.2
-1.82.2
▼-4.3 ▼
▼
0.71.4
-39
▼ 3.8 2.3-71
▼ 5.817.3-4 ▼
333.1
Share Ch.
10.3 7.8
Fees2014 Rank
MarketManagerDeals
# of MarketShare % Share Ch.
Market Change in 2015 Rank
First Quarter 2015 | Syndicated Loans | Managing Underwriters
Asia (ex-Japan)Slow Start to Asian Syndicated Loans l Yalong River Hydropower - Largest Dea for Asia in Q1 | Australia - Lowest Since 2010
Asia Loans - Bookrunners (All Currencies) (S5c) Jan 1 - Mar 31Asia & Australia Deals IntelligenceSyndicated lending in Asia (ex Australia) during the first quarter of 2015 declined sharply from the same period in 2014,down 46.4% with proceeds reaching US$63.9 billion from 200 deals. This was the slowest first quarter start since 2012across the region, with significant growth seen only in High Technology, which posted an increase of 87.2%, totalingUS$4.4 billion from 9 deals.
A CY53 billion (US$8.5 billion equivalent) CAPEX loan for Yalong River Hydropower was the largest deal completed inthe first quarter. The loan was closed in March with ICBC and China Construction Bank as joint Bookrunners andMandated Arrangers. Australian syndicated lending in the first quarter of 2015 reached US$7 billion from 20 deals, a 51.9% drop from thesame period in 2014. Acquisition Financing (up 41.2% at US$881 million) showed the only positive growth in a sluggishfirst quarter, the lowest since 2010. The club deal SDP Finco Pty Ltd's A$1.7 billion (US$1.3 equivalent) was the largestdeal completed in the period, with 9 Mandated Arrangers.
According to Thomson Reuters/Freeman Consulting, estimated fees from Asian syndicated lending totaled US$155.7million in the first quarter of 2015, down 47.8% from the comparable period in 2014. In Australia, estimated fees wereUS$60 million, declining 3.9% from the first quarter of 2014.
Proceeds per Bookrunner (US$m) # of Deals per Bookrunner Imputed Fees (US$m)Market
Jan 1 - Mar 31 2015Top Asia Syndicated Loans (Ex Japan, Ex Australia)
$8,464.7
$2,321.3
Yalong River Hydropower Dvlp
Henderson Land Dvlp Co Ltd
Bookrunner
30 4% ▼ 39 9%-41.3%Industry % Change from Same Period Last Year ▼
I d t % Ch f L t Q t 37 2%
70.1
▼
-4523.7
-39.1%
16,400.7 79.3 ▲
▼
6420,750.1 100.0
▼
100.0109.7
-47.3% ▼ ▼
12.1 ▲
▼I d t % Ch f L t Q t 49 7% ▼ 42 4% 48 9%▼Industry % Change from Same Period Last Year -46.4% ▼ -54.1%
Industry Total
-47.8%▼
78.5 11.063,543.449,787.4
100.071.1
219.4 100.0155.7
-236
0.2 ▲2.2▲
1.0
200
4.59674.49.2
▼▲
1.1 ▲ -100.6Chang Hwa Commercial Bank 25 53Top Twenty Five Total
▼1.1▼ 3.9 ▲1.8
1.9 -1.3▼ 4.2-4-7
Bank of Taiwan 24 29 678.3ANZ Banking Group 23
0.21.1 -0.6
▲ 10 5.01.1▼ 15 7.5
▲1.1 -0.8 ▼ 5 2.5 ▼ 0.8 0.31.8Axis Bank Ltd1.6-13 ▼ 3.5
22 13 699.61.2
-3▲0.435 736.7 ▲16 0.38.0
Fubon Financial Holding Co Ltd1
19 45 824.71.3 0.5 ▲ 5.511 ▼2.1 0.9▲ -0.2
▲- 4.0 1.820 36 805.8
1.3 1.0140.7 ▲ 7.0 01.0 ▲2.25 ▲
7.5 1.1 ▲0.6
-7-0.8
1.312
7.50.8 ▲▼-0.4
15
-1.83.116 874.7
16 11 875.9 7▼1.4BNP Paribas SA 1.4
▼1.4-14 ▼6.0 3.43.5
▼
▲8.0 -6 ▼ 0.3
1.32.7 1.2
2.210.5 4.8Taiwan Cooperative Bank 14 1,012.0CTBC Financial Holding Co Ltd 15 39 960.3 1.5 0.8 -2 ▼▲ 21
12 15 1,230.980.113
0.1 ▲1.71.6 1.0 ▲
▲1.9 7 ▼
16▼ 4.1
▲1.9 ▲-4 1.2
3.5 -0.44.4 2.0-8 ▼4.0
1,355.0▼
8.0 -16 ▼ 7.6 ▼8.5 -13
-1.2 ▼ 3.5 -1.02.1172.4 -2.216
0.2 ▲1,537.310 9Standard Chartered PLC -1.0▼▼
▼27
-2.72.2 1.0
4.1 1.913.5 3.0-14 ▼
▼6.5
8 1 1,804.8 2.8 -36 ▼-12.0 7▲
6.4▼ 7.8 0.4
-2.03.6-7
3.5
▲2.24.2 14.033
6-0.5
1.1▲▲
3.0 -7 ▼ 4.7▼-10 ▼
2.5
16.5
-35.6%
Proceeds per Mandated Arranger (US$m) # of Deals per Arranger
1.1
49,228.7
Land Bank of Taiwan-0.4 ▼
▼ 11.5 5.30.8
Industry % Change from Same Period Last Year -39.7%
-181100.042,836.6
4325 18
▼-37.7%
529.6
Top Twenty Five Total528.3
24
Bookrunner Total
Credit Agricole CIB
161 167.5
▼▼
▼-52.9% ▼
-38.6%
2.0▼2.5▲
100.015.9
▲▼1.2
75.9 ▲13.34
2.21.1
▲87.1
8-0.6
127.2-3
0.75.0 20.7 ▲ 1.3
Imputed Fees (US$m)
Jan 1 - Mar 31
2.5
11
China Development Bank
State Bank of India
5
17
Mega Financial Holding Co
8
Mizuho Financial Group
Korea Development BankOversea-Chinese Banking
HSBC Holdings PLC10
Sumitomo Mitsui Finl Grp Inc 6
18
9
5
Industry % Change from Last Quarter -46.6%
Asia Loans - Mandated Arrangers (All Currencies) (S5b)
Change in MarketShare % # of Deals
9,518.9 46
2,664.3
44
18
6
▲
4
15.0
2,717.4
▼-0.3
▼
1,069.9
17
China Construction Bank 2
United Overseas Bank Ltd
DBS Group Holdings1,598.8
Mitsubishi UFJ Financial Group
48
7
14
21ING
Land Bank of Taiwan
Manager
844.7
2,988.5
9.4
4
▲
MarketShare Ch.Fees Share %
Market
23.0Share %
8.4
3.4
10.020▼
973
5,953.9Bank of China Ltd
2015 Rank
21
3 5,829.9
# ofMarketMandated Arranger
2014 Rank
Industrial & Comm Bank China
MarketProceeds DealsShare Ch.
692.7
1,838.0 2.9
▲
2.8 ▲ 264.3
30
0.7 ▲
-63 ▼
-2
-19▼
4.715.0
6.19.2
13.0
▲6.04.5 18.4 5.5 ▲
20.5 9.3▼ 8.4
▼-41 3.6 -1.17.9
2.7 ▲
▲
▼
▲
▼
▲
▼
3.03.0 -1.6
2.5▼
7.2▲
Imputed Fees (US$m)
-0.9
▼4.9 2.4 ▲2.3
4.9
Share Ch.
4.4 0.5
2.2 -1.3 ▼4.8 2.9
2.8 0.81.8
5.8 -0.8
Mizuho Financial Group 1 3China Development Bank 2
1 1,115.2 5.4
Proceeds per Bookrunner (US$m) # of Deals per Arranger
- 1,600.0 7.7
Bank of Taiwan
HSBC Holdings PLC 5
10.4
2015 Rank
Asia Loans - Bookrunners (US$, EURO, JPY, A$, HK$ & S$) (S3i)
7.7 ▲ 1 1.65.1
Market MarketManager
7.8Proceeds Share %
2,147.4
2014 Rank # of Deals Fees
Market Change in
Jan 1 - Mar 31
Share %Share Ch. Share %Market
-
Market # ofDeals
▲ 15 23.4 01 ▲ 3.3
Standard Chartered PLC 3 2 1,398.8 6.7 0.0 - 13 20.3 -7 ▼ 3.3Mitsubishi UFJ Financial Group 4 12 1,168.3 5.6 2.3 ▲ 7 10.9 -2 ▼
-1.4 ▼ 10 15.6 -7 ▼ 6.4BNP Paribas SA 6 6 997.9 4.8 0.6 ▲ 6 9.4 -3 ▼ 5.4DBS Group Holdings 7 10 951.0 4.6 1.2 ▲ 6 9.4 -4 ▼ 2.6Deutsche Bank 8 19 924.6 4.5 2.4 ▲ 7 10.9 0 - 5.2Oversea-Chinese Banking 9 8 800.8 3.9 0.2 ▲ 3 4.7 -2 ▼ 2.4ANZ Banking Group 10 17 797.9 3.9 1.3 ▲ 8 12.5 0 - 3.1Credit Agricole CIB 11 11 528.3 2.6 -0.8 ▼ 4 6.3 -3 ▼ 2.0 -0.5
12 21 527.5 2.5 1.0 ▲ 4 6.3 -2 ▼ 2.4 2.2 1.6 ▲Sumitomo Mitsui Finl Grp Inc 13 4 474.4 2.3 -3.0 ▼ 3 4.7 -8 ▼ 4.6 4.2 -1.8Fubon Financial Holding Co Ltd 14 24 469.6 2.3 1.0 ▲ 5 7.8 -3 ▼ 3.0 2.7 1.4 ▲Mega Financial Holding Co 15 29 458.5 2.2 1.1 ▲ 6 9.4 -5 ▼ 2.1 1.9 0.1 ▲
▲ .7ABN AMRO Bank 16 49 445.2 2.2 2.0ING 17 46 437.5 2.1 1.8
18 13
0.7 0.3 ▲
▲
▲ 2 3.1 1▲ 2 3.1▼
▲Bank of China Ltd 0.44.3 3.9
▲
▲416.4 2.0 -1.3 3 4.7
2 ▲ 2.2 2.0 1.6
1.01.11▼-3
0.2
▼National Bank of Abu Dhabi 19 - 382.9 1.9 1.9 ▲ 2 3.1
63.81.6CTBC Financial Holding Co Ltd 20 30 358.5 1.7 0.6 9.4 -2
Bookrunner Total
▲ 6Top Twenty Total
▲3.3 3.0
$2,320.9
$2,236.8
$2,168.7
$1,747.5
$1,600.0
$1,500.0
$1,290.2
Wuxi Metro Group Co Ltd
SapuraKencana TMC Sdn Bhd
Innolux Corp
Pertamina(Persero)PT
China Star OptoElectns Tech
Formosa Group (Cayman) Ltd
Sun Hung Kai Ppty(Finl Svcs)
-30.4% ▼ -39.9%Industry % Change from Last Quarter -37.2% ▼ ▼ ▼Industry % Change from Last Quarter
https://www.thomsonone.com
-49.7% ▼ -42.4% -48.9%▼
Visit http://dmi.thomsonreuters.com to View Archives and Order Custom League Tables9

------
▲
▼ -43.8% ▼ -41.0%
68.6 20.17.0Bookrunner Total 10.2 100.0100.0
▲Top Ten Total 2,643.3 100.0 -
▼4 ▲ 2 .4 0.7▲118.95.9
4.2▲12.6 140.0
5
.4 -1.3▼ -4.7▼-15.9
Commonwealth Bank of Australia 7* 333.4 2
35.815.0National Australia Bank
397.8
10.83461.4 194.4
Deals Share % Share Ch.Fees947.4
31 2 14.2 ▲
Share Ch.2015 Rank
4.6- 219.3 15.5 2.8
Market # of MarketShare %
Change in
9
Jan 1 - Mar 31
Proceeds per Bookrunner (US$m) # of Deals per Bookrunner Imputed Fees (US$m)
Share %
Australia Loans - Bookrunners (All Currencies) (S7)
Market
ANZ Banking Group
▼-66.1% ▼
▲Mizuho Financial Group 9 216.4 1.3 2 ▼
HSBC Holdings PLC 5.5 3.5 4.1320.7
Mitsubishi UFJ Financial Group 5 619.2 4.8 ▲
7 4.6220.5
5
2.08
8 ▲▲
-48.7%
3.2 2.4
8.9
3.186.6
7 8.84
2
-3.9%
7.159.9
3
ANZ Banking Group 1
▲4 4 765.2 1.1 ▲ 0.5
912.3 13.1 -2.6
-0.2
8▼
19.8
Market
▼
15.1
-17 ▼129 71.5
9.1-10 10.5
3.1▼▼ 1.7
-5.318.2
▲
# of Deals per Arranger Imputed Fees (US$m)
6,032.0100.0
6.3
▲
▲
-42.3%
MarketMarket MarketShare %Proceeds
▼
▼-18
Industry Total 100.0
▼
-19
▼Industry % Change from Last Quarter -87.2% ▼ -69.0% ▼ -79.0%
-63.4%
42.9
Market
24.6 ▲
First Quarter 2015 | Syndicated Loans | Managing Underwriters
Proceeds per Mandated Arranger (US$m)
Share %# of Deals Share % Deals
▲
17.7 ▲
0.5
▼
2.4
13.65.3
4.6
84.7
4.04.2
1.6.9
- 2.50
50.8-2
16.0-2
2 ▲
Fees99.0
23.0
55.0 -5
10.9
11.0
▲
14.365.5
2
66.7
▼
▲
4.4-2
1 ▲2.8
6,981.6
▲
▼Industry % Change from Last Quarter -81.2%
997.33
3.1
1
1.5-1
1
-
Westpac Banking3.7 ▲
▼ 1
7
National Australia Bank
# of DealsChange in
Share Ch.Manager Market
2 -8.3
# of
Australia Loans - Mandated Arrangers (All Currencies) (S6a) Jan 1 - Mar 31
▼1,380.0
Mandated Arranger Share Ch.2014 Rank
Manager Market 2015 Rank
8.12.5-3 3.1
8.20-3
27.5▼
2
44.5
15.5▲
2▲
Mizuho Financial Group
10
Industry % Change from Same Period Last Year
Commonwealth Bank of Australia
381.1
20
▲
▼
▼2.3
0.8
Sumitomo Mitsui Finl Grp Inc5*
HSBC Holdings PLC
-1.03.1
Top Ten Total
-51.9%
6.0▲
0158.95*
15*
6
Top Australia Syndicated Loans
2,643.3
2.2
Jan 1 - Mar 31 2015
.36
17.5
2014 Rank Proceeds
Asia (ex-Japan) & Australia
Bookrunner
2 1
▲- 158.9
5 283.5
Sumitomo Mitsui Finl Grp Inc
10.7
-7
6.0 6.0 ▲ 1 66.7 1 ▲
CIBC World Markets Inc
Asian Loans by Maturity Date
9
▼ ▼
.3 2.8 1.2 ▲Westpac Banking 7 3 140.9 5.3 -14.7 ▼ 1 58.9 -8 ▼ .2 2.3 -18.1 ▼
.2Mitsubishi UFJ Financial Group 8 9 91.1 3.4 2.0 ▲1.1Investec 9 10* 67.8 2.6 1.4
▲ 1.837.8 0 - 0.3▲ 1 28.9 0 -
110.9 3.9 ▲ RBC Capital Markets
Industry % Change from Same Period Last Year
*tie
1000
1200
1400
250.00
300.00 Proceeds (US$b) # of Issues
$1,293.9
$815.1
$813 4
SDP Finco Pty Ltd
ConnectEast Finance Pty Ltd
I f h Fi Pt Ltd
Asian Loans by Currency (%)Jan 1 - Mar 31 2015 First QuarterAustralian Loans Proceeds by Industry (US$m)
$30,364.933%
$18,099.720%
$10,863.612%
$8,324.3 9%
$7,330.38%
$4,641.85%
Financials
Industrials
Media and Entertainment
Energy and Power
Real Estate
Consumer Staples
51.3% 55.8% 68.3% 84.3% 78.6% 70.0% 66.0% 69.2% 61.8% 63.1%
48.7%44.2%
31.7%
15.7%21.4%
30.0%34.0%
30.8%
38.2% 36.9%
2006 2007 2008 2009 2010 2011 2012 2013 2014 2015
Local Currency G3
$249.9 $218.5 $199.4 $189.1 $157.10
200
400
600
800
1000
-
50.00
100.00
150.00
200.00
2015 2016 2017 2018 2019
# of
Issu
es
Pro
ceed
s (U
S$b
)$813.4
$575.2
$563.6
$388.7
$384.9
$317.8
$273.2
Infrashore Finance Pty Ltd
Hills Motorway Management Ltd
Consolidated Press(Finance)
LS NewCo Pty Ltd
Laing O Rourke Au Pty Ltd
AGL Energy Ltd
Metcash Ltd
https://www.thomsonone.comVisit http://dmi.thomsonreuters.com to View Archives and Order Custom League Tables
Local Currency G3
10

Japanese syndicated lending during the first three months of 2015 was down 9.6% compared to the same period in 2014, with proceedsreaching US$75.6 billion from 659 deals. Japanese loans accounted for 9.1% of global loan volume during the period.
Borrowings in the Financials sector drove the Japanese syndicated loans market, accounting for 26.2% of activity, with proceedsreaching US$19.8 billion. Industrials and Materials followed with proceeds reaching US$11.8 billion and US$7.1 billion, respectively. Thetop three sectors accounted for about 51.3% of Japanese syndicated lending activity during the first quarter of 2015.
Non-Japanese borrowers' involvement on Japanese deals decreased compared to the same period last year, registering US$1.3 billionin proceeds from 9 deals.
0.0
0.0
Bank of Kyoto Ltd 11.319
-15
Norinchukin Bank17
0.011.9- ▲0.2
▲-1 1
1-
0.0
1
2
0.210.0
10.0 ▲
▲0.2 1▼0.2 -422
0.0
-1.30.00.0
-20.0
0.0▼-
▼▲2
-20.00.3-
1
-0.3
0.2-0.1
0.10.1
122.9 --4▼
▲
▼-1
0.2
-1-0.20.3
▼▼
▼112 0.3 ▲
▼
1.7
1
-2611
1
1.7▼ -9▼
▼-2.5 0.2
810 1.6▼
-1.5
137.9 0.1
-0.8
▲-2 ▼0.8
▼▼ 1.7
20.00.20.2
1
-1.3
0.8
34.2 -1911
655.4 ▲0.9
218▼23.7
Aozora Bank Ltd
7
56
Fukuoka Financial Group Inc8
Sumitomo Mitsui Trust Holdings555.0
# of Deals per BookrunnerMarket
1.7 -2.0 ▼-1# of Deals
-1.9200
Jan 1 - Mar 31
3
Market Market
Japan Loans - Bookrunners (S12b)
Deals31,659.4
Proceeds per Bookrunner (US$m)2014 Rank
2015 Rank
Mitsubishi UFJ Financial Group 34
Bookrunner
Development Bank of Japan Inc 4
Mizuho Financial Group2
Share %▲
367.4
26.2
444.5
Share Ch.Proceeds
1,246.1
43.019,274.6
9.9
# of
20431.4 ▲
▼-5▼ 32.0
Shoko Chukin Bank 1314
1Sumitomo Mitsui Finl Grp Inc
12
5 16
15
BNP Paribas SA 12
0.5
12Nishi-Nippon City Bank Ltd
20*Shinsei Bank 10
Resona Holdings Inc9
First Quarter 2015 | Syndicated Loans | Managing Underwriters
JapanJapanese Syndicated Lending down 10% | Financials Lead Industry | Non Japanese Borrowers Activity down 47%
7 0.6Citi
17,479.33
Sh %Change in
-0.111 104.813
0.0
8
6
34.022
108.7
19.6
Capital Expenditures
2,774.3
3/19/2015
Sumitomo Corp
Working Capital
Toshiba Corp
2,497.21,175.4
Senshu Ikeda Holdings Inc
-
19.7
14.9
Gunma Bank
18
15.3Bank of YokohamaAshikaga Bank Ltd
-
3/30/2015 998.9Lotte Co Ltd
1,090.83/19/20153/26/2015 Hokuetsu Bank Ltd 20 -
Japan Deals Intelligence
Package Amt (US$m)Borrower
Jan 1 - Mar 31 2015
General Corp. Purp.Primary UOP
16
Working Capital
1,076.3Working Capital
Orchid Alliance Holdings Ltd3/25/2015 11,838.0
Idemitsu Kosan Co LtdToshiba Corp
Working Capital
Top Ten DealsClosing Date
1,159.1
3/19/2015
1,159.1Rakuten Card Co Ltd
2/24/20153/31/20153/27/2015
Working CapitalWorking Capital
Orient Corp
Working CapitalMarubeni Corp
7.5 0.0 0.0 - 2 0.3 2 ▲Bank of Iwate Ltd 21 - 4.2 0.0 0.0 - 1 0.2 1 ▲
Japan Loans Proceeds by Industry (US$m) Jan 1 - Mar 31 2015
Overall Japan Loans Volume
p pSG Holdings Co Ltd 840.72/19/2015 Oper Fund / Cash Res
637100.0100.0
-85
Industry % Change from Same Period Last Year -8.9% ▼ -11.8% ▼Industry % Change from Last Quarter 84.2% ▲ 109.5% ▲
▼-0.773,710.0Top Twenty Five Total73,710.0Bookrunner Total
2,051
1,658 1,6611,686
1,826 1,870
1,992
659
0
500
1,000
1,500
2,000
2,500
$0
$50
$100
$150
$200
$250
$300
$350
2008 2009 2010 2011 2012 2013 2014 2015
# of
Issu
es
Pro
ceed
s (U
S$b
)
Q4 Proceeds (US$b) Q3 Proceeds (US$b)
Q2 Proceeds (US$b) Q1 Proceeds (US$b)
# of Issues
$19,833.526.2%
$11,849.015.7%
$7,110.49.4%
$6,962.39.2%
$6,229.88.2%
$5,393.87.1%
$5,074.56.7%
$3,524.24.7%
$390.90.5%
Financials Industrials Consumer Staples
Materials Energy and Power High Technology
Real Estate Retail Consumer Products and Services
Healthcare Media and Entertainment Government and Agencies
Telecommunications
.
Visit http://dmi.thomsonreuters.com to View Archives and Order Custom League Tables https://www.thomsonone.com
2008 2009 2010 2011 2012 2013 2014 2015 Telecommunications
11

2122
0.10.20.2
-
0.0
0.03
Mitsubishi UFJ Financial GroupSumitomo Mitsui Trust Holdings
6
0.03
-0.0
Development Bank of Japan Inc-1.0
Resona Holdings IncAozora Bank Ltd
-1.8
4
70.8
3Sumitomo Mitsui Finl Grp Inc 2
5
-2.0
4 1,108.11.6
0.1
3
Mandated Arranger1
1,170.5
-1.1Mizuho Financial Group
2015 Rank
9.4
Jan 1 - Mar 31
2 ▼▲
0
Proceeds per Mandated Arranger (US$m)
213
# of# of Deals
Market
Japan
-
First Quarter 2015 | Syndicated Loans | Managing Underwriters
Japan Loan Volume - Non-Japanese Borrowers
Share Ch.
Japan Loans - Mandated Arrangers (S12a)
Market
31,707.6Proceeds
20,479.9
2014 Rank
0.0
0.1
Share %
1.5
16,925.65
-0.1
0.6
▲
0.4 -0.3
-1.3
0.3
-0.1
▼▼
0.0▼
9
7
▼
41.927.122.4
1
697.2
# of Deals per MA
Sh %Market
32.3
▼14
34.6 -▼
▲
237
Deals
▼
8
0.2
1.7
0
▲
228
Change in
36.0 -230 ▼4.6▼-20
▲
277.5
-2.2 ▼
443.6 -0.9
171.1 0.2212.8
17
0.4
0.9
6
0.1 ▲3 0.5 -20.5 ▲0.2
-21
11
3
▼
1
0.3
▼
14
10.2
1
2.1
2.1 -28-30.2 -21
1 ▲
0.30.3
-120.5 ▲
▲
▼
▲1-
0.53
0-41
3
▼
▼-2-
-45▲▼
2
-22
▲
0.21- 1 0.2
0 10.30 2▼21 6 425
24 27.50 0 1
0.00.0Hokuetsu Bank Ltd
20
15.3-
11.3
Senshu Ikeda Holdings IncAshikaga Bank LtdBank of Kyoto Ltd
Bank of Yokohama19.7
0
▼8*8*
0.2
-
21
0.0
-
Shinsei Bank
0.0Norinchukin Bank
-▼
82.40.1
0.0
108.7▼
0.0
17 -
14
0.025
34.0
13
23-
21.1
0.00.0
104.8
28.00.0
0.08
Sapporo Hokuyo Holdings Inc
1615
Fukuoka Financial Group Inc 23*12
BNP Paribas SA19
-
15
18
-0.2
0.0
13Gunma Bank
26.8
--
Shinkin Central Bank-
Citi
Shoko Chukin Bank 19 22.9
16
Nishi-Nippon City Bank Ltd
Hokuhoku Financial Group Inc
Credit Agricole CIB10
0.211
144.31812
277.5Hiroshima Bank Ltd
2
1
1▼
▲
▼14
4
6
4
9
3
6
8
10
12
6
13
6
10
4
11
3
10
6
20
4
9
5
10
15
20
25
$500
$1,000
$1,500
$2,000
$2,500
$3,000
$3,500
# of
Issu
es
Pro
ceed
s (U
S$
m)
Proceeds (US$m)
No. of Deals
Jan 1 - Mar 31 2015
▼
▼-81
-0.1
-10.9%-9.6%
98.00.2▼
Top Twenty Five Total21 6.425
74,104.6Industry Total
-0.7
Industry % Change from Same Period Last Year
0.0 1 -0
Japan Loan Volume by Maturity Date
Shinkin Central Bank
Japan Loans - Top 10 Uses of Proceeds (US$m)
*tie
Industry % Change from Last Quarter 84.1% ▲ 111.2% ▲
75,617.5 100.0
▼
659
32
3 3 3
0$0Q1 Q2 Q3 Q4 Q1 Q2 Q3 Q4 Q1 Q2 Q3 Q4 Q1 Q2 Q3 Q4 Q1 Q2 Q3 Q4 Q1 Q2 Q3 Q4 Q1
2009 2010 2011 2012 2013 2014 15
198.0 139.2 124.8 97.1 66.2 42.8 29.7 22.3 91.8
1585
11021024
783
626
365296
213
1064
0
200
400
600
800
1,000
1,200
1,400
1,600
1,800
$0
$50
$100
$150
$200
$250
2015 2016 2017 2018 2019 2020 2021 2022 2023 & Beyond
# of
Issu
es
Pro
ceed
s (U
S$b
)
Proceeds(US$b)
# of Issues
$115,506.8 56%
$28,711.9 14%
$18,753.0 9%
$14,140.1 7%
$8,202.1 4% Working Capital
General Corporate Purposes
Capital Expenditures
Future Acquisitions
Refinancing
Operating Fund/Cash Reserve
Property Acquisition
Refinance Bank Debt
Construction
Export/Import Finance
.
https://www.thomsonone.comVisit http://dmi.thomsonreuters.com to View Archives and Order Custom League Tables
Export/Import Finance
12

-
-
-
-
-
-
Global, Americas, EMEA, Asia-Pacific and Japan bookrunner and mandated arranger league table volumes and rankings are based on general close date instead of financial close date.
Database coverage includes all loan transactions that have reached financial close by the submission deadline and of which Thomson Reuters has been made aware. All current andprevious year's data is as of 12:00pm EDT on March 31, 2015.
Mandated Arranger league tables will give equal credit to the Non-Americas mandated arranger and equal credit to the Americas Tier 1 agent. In cases of consolidation, credit will be giviento the surviving/parent firm.
Bookrunner league tables will give full credit to the bookrunner, equal if joint. In cases of consolidation, credit will be given to the surviving/parent firm
All league tables are based on deal proceeds unless otherwise specified. Regional league tables are based on Target Market.
Bilateral, self-arranged, commercial and unknown loans are excluded from league tables as well as loans with a maturity of less than 90 days.
First Quarter 2015 | Syndicated Loans | Managing Underwriters
Ranking Criteria Summary
E-mail: [email protected]
JapanMegumi KonoTel: +813 6441 1155
E-mail: [email protected]
Europe
If you would like to participate in the submission process, receive quarterly press releases, orhave questions about league table criteriaplease contact:
AmericasSalvatore ReresTel: +1 646 223-8455
Ewelina JareckaTel: +44 207 542 2246E-mail: [email protected]
Asia-PacificCarina Causon-IsraelTel: +632 858 7221E-mail: [email protected]
-
-
-
-
-
- Thomson Reuters Investment Banking loans data is compiled in conjunction with Loan Pricing Corporation (LPC). In combination, Thomson Reuters Investment Banking and LPC offer the most comprehensive and accurate view of the syndicated loans market available.
League table volumes for Mitsubishi UFJ Financial Group and Morgan Stanley, included herein, reflect changes after the commencement of their jointly established securities firms in Japan: (1) Mitsubishi UFJ Morgan Stanley Securities and (2) Morgan Stanley MUFG Securities. Credit for the newly established joint ventures rolls up to Morgan Stanley. For Japanese involvement league tables Morgan Stanley will be represented as "Mitsubishi UFJ Morgan Stanley".
Bookrunner league tables include club syndicate transactions that are sold down in the syndication process to firms that were not part of the original club syndicate. Mandated Arranger league tables include all club syndicate transactions, regardless of sell-down process.
Non-US dollar denominated transactions are converted to the US dollar equivalent at the time of pricing.
Imputed fees are calculated using Freeman Consulting proprietary algorithm where spreads or fees are not disclosed. Deal fees are on a gross basis before all expenses. Each underwriteror advisor is allocated its share of deal fees using Freeman & Co. allocation methodology, based on the number of underwriters or advisors on the deal and their role. No fees are allocatedto syndicated members.
Bookrunner and Mandated Arranger league tables only include amendments that require 100% lender vote for the following amendments: decrease in pricing, change in tenor if maturity is extended by a period of more than 90 days, guarantor or collateral release. An increase in deal size after syndication has ended will be reflected as an add on tranche.
While Thomson Reuters has used reasonable endeavors to ensure that the information provided in this document is accurate and up to date as at the time of issue, neither Thomson Reuters nor its third party content providers shall be liablefor any errors, inaccuracies or delays in the information, nor for any actions taken in reliance thereon, nor does it endorse any views or opinions of any third party content provider. Thomson Reuters disclaims all warranties, express orimplied, as to the accuracy or completeness of any of the content provided, or as to the fitness of the content for any purpose to the extent permitted by law. The content herein is not appropriate for the purposes of making a decision to carryout a transaction or trade and does not provide any form of advice (investment, tax, legal) amounting to investment advice, nor make any recommendations or solicitations regarding particular financial instruments, investments or products,including the buying or selling of securities. Thomson Reuters has not undertaken any liability or obligation relating to the purchase or sale of securities for or by any person in connection with this document.
© 2015 Thomson Reuters. All rights reserved.
Thomson Reuters and the Thomson Reuters logo are registered trademarks and trademarks of Thomson Reuters and its affiliated companies. Any third party name or mark herein belongs to the relevant third party.
https://www.thomsonone.com13

© 2015 Thomson Reuters..Thomson Reuters and the Kinesis logo are trademarks of Thomson Reuters.
FOR INFORMATION PROFESSIONALSSDC Platinum is the world’s foremost financial transactions database, covering new issues, M&A, syndicated loans, private equity, project finance, poison pills, and more.
Solution for:• Market Analysis & Trends (Geography, Sector,
Asset Class, Deal Type, Deal Size, etc.)• Deal Origination (Debt Maturity Analysis,
Company Lifecycle including Private Equity)• Pitch Creation (Firm Credentials,
Representative Acquirors)• M&A Targeting (Active Strategic/Sponsor
Acquirors, Target Company Screener)• Negotiation (T&C Benchmarking)
FOR INVESTMENT BANKERSThomson Reuters Eikon is the most intuitive and comprehensive way of staying informed. With natural-language search, you can quickly find global information, news, charts and analytics. Company and industry views provide top-level summaries, and then detailed information is just a click away. Identify new opportunities and gain deep understanding of markets, industries, companies and events.
Thomson Reuters Eikon also includes an Add-In for Microsoft® Office to help you increase your efficiency. From screening and targeting to comparables analysis, building league tables, valuing a company and
developing a client pitch book, you can do all this without leaving Microsoft Office. Search and autosuggest features in Excel make model-building easier.
Solution for:• Managing Client Relationships• Deal Origination• New Issues Pre-Marketing/Roadshows• Financial Modeling• Customized League Tables• Simple Deals screening• Valuation analysis and comparable
deal screening• On-brand pitch book creation
FOR STRATEGY AND PLANNING TEAMSThomson Reuters Deals Business Intelligence enables you to slice and dice our renowned Deals and Fees data to create ad hoc reports, analyze market trends, benchmark your performance and identify opportunities – all within a tool built into your workflow in Excel®, saving you valuable time and giving you a competitive edge.
Solution for:• Conducting market analysis and
identifying trends• Benchmarking your performance and
monitoring competitors• Targeting clients by wallet size and
banking relationship• Allocating resources more effectively by
evaluating and analyzing lost deals
Send us a sales enquiry at: financial.thomsonreuters.com/salesRead more about our products at: financial.thomsonreuters.com/products
To purchase individual Thomson Reuters Deals or League Table reports, please contact our Thomson Reuters On Demand group:
Web: http://financial.thomsonreuters.com/ondemandEmail: [email protected]
Access unique analysis for free anytime using Thomson Reuters Deals Intelligence website and receive regular updates, delivered direct to your inbox.
Go to: dmi.thomsonreuters.com/dealsintelligence
Thomson Reuters Solutions for the Deal Making Community
14