global outlook (may 2007) - scotiabank global site€¦ · · 2011-11-22global outlook may 2007...
TRANSCRIPT

Global Outlook is available on: www.scotiabank and Bloomberg at SCOE
Global Economic Research
Global Outlook May 2007
Warren Jestin / Mary Webb
E nvironment issues have rapidly moved towards the centre of the public policy agenda. While the specific requirements attached to the Kyoto
Protocol continue to generate controversy, governments in the major developed nations are changing regulations, taxes and subsidies to achieve ambitious long-term environmental and energy conservation targets. Because of the enormous price tag, questions concerning who pays, and how much, are central to the policy debate. The answers will have a big impact on industrial competitiveness and relative economic performance among regions.
Europe has pioneered several aspects of climate change policy, embracing renewable energy such as wind power and launching market trading in greenhouse gas (GHG) emission credits. By 2020, the EU is aiming to reduce GHG emissions by at least 20% from 1990 levels, derive 20% of its energy from renewable sources and trim 20% of its primary energy consumption. Achieving these goals will require massive public and private investments and the integration of EU power markets — a big challenge with member states at different starting points with respect to technology usage and resources.
In the United States, President Bush has committed to scaling back national gasoline usage by 20% over the next decade, a goal also aimed at restraining petroleum imports that currently exceed US$300 billion annually. In the absence of national targets for reducing GHG emissions, California and other states are tightening emission limits and mandating the use of alternative energy sources such as wind and solar. To avoid a patchwork of state regulations, corporate support is building for Washington to take more leadership in setting national regulations.
The quest for low-carbon efficient energy sources already is triggering diverse investments in wind, hydro, biofuel, nuclear, clean coal and solar power. The production of biofuels such as ethanol — driven by ambitious fuel content targets and substantial subsidies — has already elevated prices for corn, other grains and oilseeds. The auto industry is focusing on developing new gas-electric and flex-fuel hybrid vehicles. The low-emission advantage of nuclear power has prompted plans for about 168 new nuclear reactors around the world by 2020, triggering a more than five-fold increase in spot uranium prices over the past three years.
But as Kermit the Frog told us years ago, it’s not that easy bein’ green. On a global basis, meaningful progress requires major adjustments in all nations. China — the second-largest national producer of GHG emissions annually after the United States — India, and many other emerging
OVERVIEW — Going Green … Don’t Plan On Business As Usual.........................................................................................................1-4 NAFTA — Resource Strength Offsets Manufacturing Weakness In Canada While Housing Downturn Slows U.S. Growth..................5-7 INTERNATIONAL — China Slows But Retains Global Growth Crown ...................................................................................................7-9 INDUSTRY & COMMODITY — The Mining Boom Continues ............................................................................................................10-11 THE PROVINCES — Construction-Led Growth...................................................................................................................................12-13
To view a recent webcast of Scotiabank Chief Economist Warren Jestin and
ScotiaMcLeod’s Director of Equity Trading, Fred Ketchen, discussing the economic outlook, visit www.scotiabank.com
Going Green … Don’t Plan On Business As Usual
Energy, 84%
Agriculture, 7%
Waste, 3%Industrial
Processes, 6%
Industrialized Nations’ GHG Sources*, 2004 ...
* European Community, Japan, U.S. and Canada.
-20 0 20 40
1990-2004,% change
Germany
U.K.
Japan
U.S.
Australia
Canada
Italy
Spain
Sweden
France
… And Emissions Growth
2
Global Economic Research Global Outlook May 2007
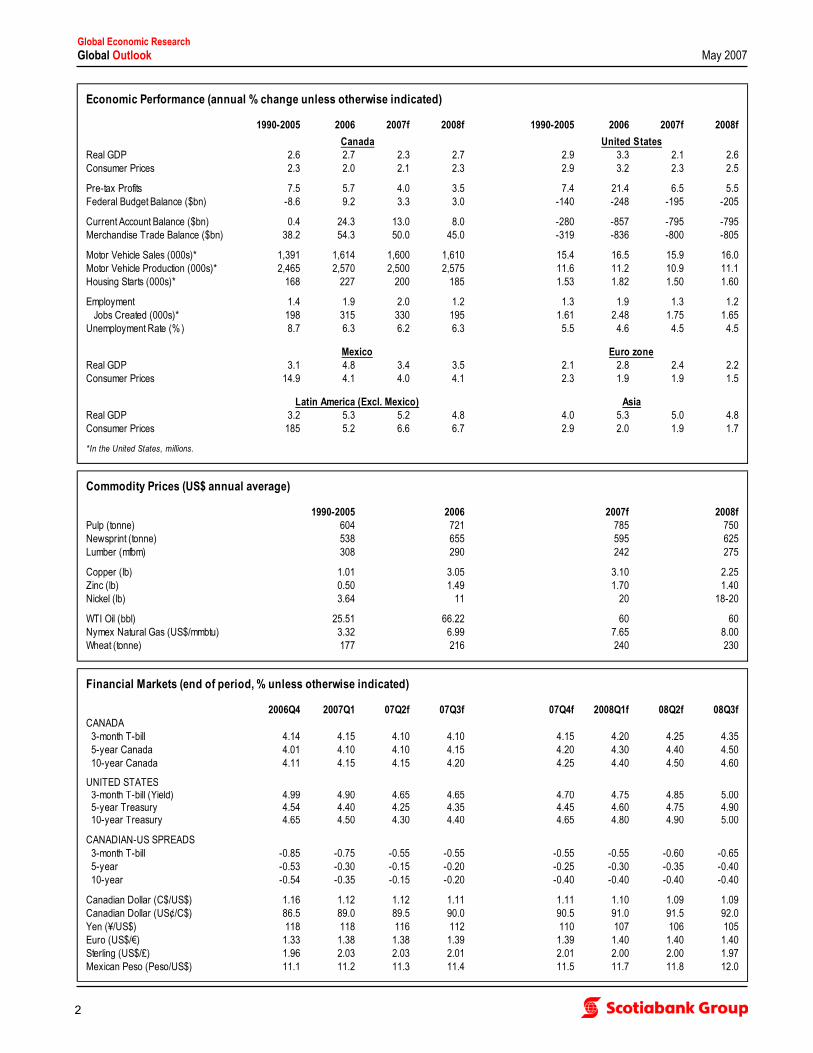
Economic Performance (annual % change unless otherwise indicated)
1990-2005 2006 2007f 2008f 1990-2005 2006 2007f 2008f
Real GDP 2.6 2.7 2.3 2.7 2.9 3.3 2.1 2.6Consumer Prices 2.3 2.0 2.1 2.3 2.9 3.2 2.3 2.5
Pre-tax Profits 7.5 5.7 4.0 3.5 7.4 21.4 6.5 5.5Federal Budget Balance ($bn) -8.6 9.2 3.3 3.0 -140 -248 -195 -205
Current Account Balance ($bn) 0.4 24.3 13.0 8.0 -280 -857 -795 -795Merchandise Trade Balance ($bn) 38.2 54.3 50.0 45.0 -319 -836 -800 -805
Motor Vehicle Sales (000s)* 1,391 1,614 1,600 1,610 15.4 16.5 15.9 16.0Motor Vehicle Production (000s)* 2,465 2,570 2,500 2,575 11.6 11.2 10.9 11.1Housing Starts (000s)* 168 227 200 185 1.53 1.82 1.50 1.60
Employment 1.4 1.9 2.0 1.2 1.3 1.9 1.3 1.2 Jobs Created (000s)* 198 315 330 195 1.61 2.48 1.75 1.65Unemployment Rate (% ) 8.7 6.3 6.2 6.3 5.5 4.6 4.5 4.5
Real GDP 3.1 4.8 3.4 3.5 2.1 2.8 2.4 2.2Consumer Prices 14.9 4.1 4.0 4.1 2.3 1.9 1.9 1.5
Real GDP 3.2 5.3 5.2 4.8 4.0 5.3 5.0 4.8Consumer Prices 185 5.2 6.6 6.7 2.9 2.0 1.9 1.7
*In the United States, millions.
Commodity Prices (US$ annual average)
1990-2005 2006 2007f 2008fPulp (tonne) 604 721 785 750Newsprint (tonne) 538 655 595 625Lumber (mfbm) 308 290 242 275
Copper (lb) 1.01 3.05 3.10 2.25Zinc (lb) 0.50 1.49 1.70 1.40Nickel (lb) 3.64 11 20 18-20
WTI Oil (bbl) 25.51 66.22 60 60Nymex Natural Gas (US$/mmbtu) 3.32 6.99 7.65 8.00Wheat (tonne) 177 216 240 230
Financial Markets (end of period, % unless otherwise indicated)
2006Q4 2007Q1 07Q2f 07Q3f 07Q4f 2008Q1f 08Q2f 08Q3fCANADA 3-month T-bill 4.14 4.15 4.10 4.10 4.15 4.20 4.25 4.35 5-year Canada 4.01 4.10 4.10 4.15 4.20 4.30 4.40 4.50 10-year Canada 4.11 4.15 4.15 4.20 4.25 4.40 4.50 4.60
UNITED STATES 3-month T-bill (Yield) 4.99 4.90 4.65 4.65 4.70 4.75 4.85 5.00 5-year Treasury 4.54 4.40 4.25 4.35 4.45 4.60 4.75 4.90 10-year Treasury 4.65 4.50 4.30 4.40 4.65 4.80 4.90 5.00
CANADIAN-US SPREADS 3-month T-bill -0.85 -0.75 -0.55 -0.55 -0.55 -0.55 -0.60 -0.65 5-year -0.53 -0.30 -0.15 -0.20 -0.25 -0.30 -0.35 -0.40 10-year -0.54 -0.35 -0.15 -0.20 -0.40 -0.40 -0.40 -0.40
Canadian Dollar (C$/US$) 1.16 1.12 1.12 1.11 1.11 1.10 1.09 1.09Canadian Dollar (US¢/C$) 86.5 89.0 89.5 90.0 90.5 91.0 91.5 92.0Yen (¥/US$) 118 118 116 112 110 107 106 105Euro (US$/€) 1.33 1.38 1.38 1.39 1.39 1.40 1.40 1.40Sterling (US$/£) 1.96 2.03 2.03 2.01 2.01 2.00 2.00 1.97Mexican Peso (Peso/US$) 11.1 11.2 11.3 11.4 11.5 11.7 11.8 12.0
Canada United States
Mexico Euro zone
Latin America (Excl. Mexico) Asia

3
Global Economic Research Global Outlook May 2007
industrial nations largely rely upon coal-burning power generation to help fuel their fast-track growth. These emerging nations are going to have a very difficult time implementing, let alone affording, the huge expenditures needed to reduce pollution intensity and improve energy efficiency. Adapting to the fallout from climate change — which can take the form of severe droughts and other extreme weather conditions — also carries enormous cost.
Scientific issues are just as complex. A wide array of technologies and processes is being championed to mitigate environmental impact, yet the path from innovation to implementation is often not smooth. For example, wind-based electricity generation has considerable advantages, but still poses challenges as a complement to other power sources. Integrating highly variable wind-power output into the European grid was cited as a factor in last November’s blackout. The Greening Of Canadian Policy As in other developed nations, the greening of the policy agenda has rapidly gathered momentum in Canada. In recent months, Ottawa and the Provinces have set new environmental targets and unveiled multi-billion-dollar spending initiatives. The new federal accelerated depreciation incentive for machinery and equipment purchases also will help support energy-efficient investments.
Ottawa is negotiating the details of its proposed Clean Air Regulatory Agenda that will impose mandatory targets on industries with relatively high emissions, including utilities generating power by combustion, the petroleum sector, forest products, chemicals and metal smelting. In addition to the GHG intensity reductions slated for 2010, absolute caps are proposed for other forms of air pollution as early as 2012. Stiffer energy efficiency or emission standards also are in the works for motor vehicles, other transportation modes, and a range of consumer and commercial products.
For the industries directly targeted by the federal plan, GHG and air pollutant emissions will become a liability that must be reported and contained. If these companies cannot meet their emission abatement requirements, their options include purchasing emission credits in domestic markets or investing in designated green projects, either directly or through a federal technology fund. Firms not directly affected by the proposed regulations will still feel the impact through higher costs, particularly for energy. More generally, environmental actions are becoming a bigger factor in public expectations concerning corporate social responsibility.
Ottawa has opened the door to equivalency agreements that will allow each Province and Territory to lead its own clean air agenda. This flexible approach recognizes both the unprecedented co-operation required among all levels of government and each jurisdiction’s different industrial structure, prior policy settings and resources. Ultimately, the impact of new clean air regulations will be determined by the negotiated mix of federal-provincial objectives.
On a regional basis, Alberta has led the country in economic growth and fiscal performance for the past four years. However, it also faces the biggest challenge in reducing GHG emissions. While the province’s emissions relative to GDP dropped 16% from 1990 to 2004 — over half way to the 30% interim target for intensity reduction set for 2010 — in absolute terms it still accounted for 31% of Canada’s GHG emissions and over 40% of the national rise since 1990.
Canada’s potential as an energy super-power hinges on developing its massive non-conventional petroleum resources, largely in Alberta. As oil sands output ramps up, investment in new technology will be needed to limit the relatively high GHG emissions from their extraction. One ambitious proposal receiving federal and provincial funding for further analysis is large-scale carbon dioxide (CO2) capture and storage, including a pipeline to transport CO2 to enhanced oil recovery sites. Clean coal and nuclear options also have been proposed to meet the substantial power demands of major resource developments. All of these alternatives carry multi-billion-dollar price tags.
Canadian GHG Emissions By Sector, 2004
Energy Consumption
Waste, 4%
Commercial & Institutional, 5%
Other, 14%
Thermal Power, 17%
Oil, Gas & Coal Ind., 20%
Road Transportation,
19%
Industrial, 7%
Agriculture, 7%
Residential, 6%
0 15 30 45
CanadaU.S.
Renewable (ex. Hydro)
Nuclear
Hydroelectric
Coal
Natural Gas
Petroleum
2004, % share
0.5
1.0
1.5
2.0
2.5
3.0
3.5
4.0
4.5
00 01 02 03 04 05 06 07150
175
200
225
250
275
300
325
350US$
Canola (RHS)
Corn per bushel (LHS)
Ethanol per gallon, Omaha, Nebraska (LHS)
US$ per tonne
Biofuel Targets Elevate Corn And Oilseed Prices

4
Global Economic Research Global Outlook May 2007
0.0
0.5
1.0
1.5
2.0
00 01 02 03 04 05 06 07f
installed capacity, gigawatts
Alberta is one of four Provinces expected to release a new climate change strategy in the months ahead. As a follow-up to its 2002 climate change plan, Alberta recently introduced legislation requiring a 12% cut in emissions intensity for large corporate emitters by July 1, 2007. Companies unable to achieve this reduction have the choice of investing in an Alberta-based offset or a new provincial technology fund.
The situation is much different in Ontario, where fiscal manoeuvring room is limited, annual growth since 2003 has lagged Alberta’s pace by 2½ percentage points and its manufacturing sector is undergoing difficult competitive adjustments. With the Province officially committed to retiring its coal-fired power generating stations by 2014 — the source of about one-fifth of provincial generating capacity — and its accessible hydro potential largely developed, the options for generating additional low-carbon power are limited. Beyond smaller renewable power projects, Ontario is looking to conservation, tapping new hydroelectric power from neighbouring provinces and refurbishing or, where necessary, constructing nuclear capacity.
By 2025, Ontario’s Integrated Power System Plan assumes that peak demand will be scaled back by 6,300 megawatts (MW), an amount roughly equivalent to projected growth in supply. For households, the Province’s conservation strategy centres on installing smart metres to discourage peak-period power usage. For smaller renewable projects, Ontario is blazing a trail with longer-term standard offer contracts with access to the provincial power grid. Considerable investment in transmission capacity will be required to accommodate smaller producers, lessen potential bottlenecks and enhance secure distribution.
For Atlantic Canada, the long-term nexus between environmental requirements and energy investment would be fundamentally altered if hydro power from the proposed Lower Churchill development is sold to the United States via the Island of Newfoundland, New Brunswick and Nova Scotia instead of through Quebec. In the near term, Eastern Canadian Premiers, including Quebec, and New England Governors have agreed upon a regional goal of constraining GHG emissions in 2010 to 1990 levels, with a 10% cut by 2020.
Provinces across Canada are adopting individual environmental strategies and are also shaping policy to match their resource endowments and constraints. Nova Scotia, for example, has integrated environmental goals into its sustainable prosperity strategy. Reflecting its focus on grains and oilseeds, Saskatchewan was the first Province to target ethanol content in gasoline and is also focusing on biodiesel production. With excellent sites for wind power, Prince Edward Island has ambitious plans to expand this source of power — which currently meets 12½% of local electricity demand — permitting green power exports from the Province in the near future.
While national wind power capacity has climbed sharply, the 2,000 MW forecast by the end of 2007 still represents a small share of Canada’s total power generation. Across Canada, the potential for ramping up wind power is limited by geographic constraints and climate conditions. In Southern Alberta, for example, the viability of wind power is currently impeded by its variability.
Among the provinces, Quebec and Manitoba, relative to 1990, will likely achieve the greatest reductions in GHG emissions over the next half decade with expanded hydroelectricity capacity. Newfoundland and Labrador, and more recently British Columbia, also are looking ahead to major hydro investments. This clean energy source offers a big competitive advantage — power rates last spring for large customers in Winnipeg and Montreal averaged roughly half the Toronto level.
From a Canadian perspective, new environmental requirements are not the only factors altering the competitive landscape. Intense global competition, the soaring loonie, high energy prices, and on a longer-term basis, the aging of the baby boom generation greatly complicate strategic planning. At the same time, the green agenda will unleash enormous business and employment opportunities. Industries focusing on environment remediation and improving energy efficiency will probably be among the growth leaders over the next decade.
0
50
100
150
200
250
BC AB SK MB ON QC Atlantic
megatonnes of CO2 equivalent
19902004
Provincial GHG Emissions ...
Canadian Wind Power
0
20
40
60
80
100
BC AB SK MB ON QC NB NS NL*
% share of generating capacity, 2005p
… And Hydroelectricity Power
* Major hydroelectric power exports from Labrador to Quebec.

5
Global Economic Research Global Outlook May 2007
NORTH AMERICA Canada — Resource Strength Offsets Manufacturing Weakness Adrienne Warren
T he gradually decelerating trend in domestic activity that emerged in mid-2006 has continued into the early part of 2007. Slowing U.S. growth has
further pressured the nation’s export-oriented manufacturing industries, which were already straining under the weight of a strong domestic currency and fierce overseas competition. Consumers are still relatively upbeat, though sales growth has cooled somewhat in recent months, despite extensive retail discounting and continued healthy job gains. A levelling off in housing activity is also contributing to the more modest growth trend.
This more moderate economic profile is expected to persist through 2007, with output growth averaging just 2.3% this year. The downgrading in growth expectations remains centred on the manufacturing sector, which is grappling with intense international competition and the rise in the Canadian dollar in recent years. More than 150,000 factory jobs have been shed in the past two years, while the volume of shipments has been declining on a year-over-year basis since early 2006.
Given the moderation in U.S. growth now underway and the renewed strengthening in the Canadian dollar, additional production cuts and factory job losses are likely in the coming months. Looking further ahead, however, these cost-cutting measures alongside an accelerated pace of business investment should eventually put the sector on a firmer footing. It should also begin to narrow the wide performance gap between the manufacturing-dominated economies of Central Canada and the resource-rich Western provinces. Supported by falling import costs and the need to boost efficiencies, real machinery and equipment purchases have increased at close to a 10% annual rate since 2003.
Pressures to remain globally competitive alongside tight labour markets should keep equipment outlays at a high level well into 2008. Non-residential construction is also expected to remain an important contributor to growth in the year ahead, particularly in the areas of office building, transit and other infrastructure, and energy and mining. Overall, business investment in new facilities and equipment is expected to contribute about a percentage point to GDP growth in 2007, effectively offsetting the drag from a deteriorating net export performance.
At the same time, the contribution of the household sector to overall growth is expected to gradually diminish. Residential housing activity, while still at a high level, has reached a cyclical peak in most markets across the country. Reduced affordability, rising inventories and depleted pent-up demand after a multi-year upswing point to a gradual softening in new construction, existing home sales and price appreciation through 2007.
Low unemployment and continuing moderate wage gains should sustain a reasonably healthy pace of consumer spending. Nevertheless, the cooling off in housing activity and renewed run-up in gasoline prices already appear to be tempering buyer enthusiasm. An expected slowing in the pace of job creation will add to consumer caution. Combined, consumers and housing will contribute about 1½ percentage points to Canada’s overall output advance this year, down a full percentage point from 2006.
Canada’s forward economic momentum will be reinforced by very stimulative federal and provincial fiscal settings. New spending initiatives and tax relief in this spring’s federal budget totalled $7.4 billion in FY07/08 and FY08/09, equivalent to about 0.5% of GDP in each year. With price pressures aggravated by a number of factors, including rising food costs and tight labour markets, core inflation trends are expected to run slightly above the Bank of Canada’s 2% comfort level. In this environment, monetary authorities have limited manoeuvring room.
Loonie Switching To Glide
Businesses Keep Investing
Non-Residential Building Boom
-8
-4
0
4
8
12
16
00 01 02 03 04 05 06 07f 08f
Canada
U.S.
y/y % change
Machinery & Equipment
-20
-16
-12
-8
-4
0
4
8
12
00 01 02 03 04 05 06 07f 08f
CanadaU.S.
y/y % change
Non-Residential Construction
0.60
0.65
0.70
0.75
0.80
0.85
0.90
0.95
00 01 02 03 04 05 06 07
US$/C$
20-year Average
(1986-2006)
Canadian Dollar
forecast

6
Global Economic Research Global Outlook May 2007
United States — Housing Downturn To Trim Consumer Outlays Meny Grauman
A fter three straight years of robust expansion, U.S. real economic growth will likely drop to an average of around 2½% over the next two years as the
continuing downturn in the housing sector puts greater pressure on consumer spending. Price pressures remain elevated, but should gradually moderate as the country’s economic momentum slows, and energy prices stabilize.
During the first three months of 2007, U.S. real GDP growth fell to its slowest pace in three years, registering just over 1% on an annualized basis. While household spending provided much of the thrust, the year-over-year growth in consumer purchases continues to slow. Much of the residual strength in consumer spending can be attributed to a booming stock market and favourable employment and income gains over the past year. However, some of these supportive factors are unwinding as job creation slows and corporate earnings growth moderates. Further weakness in the U.S. housing market is also expected to result in a more cautious consumer spending profile. Consumer confidence indicators have recently softened, affected in part by the recent uptick in gasoline prices which is constraining household purchasing power.
Expectations of continuing U.S. economic weakness is based on further housing market weakness. Declining residential construction remained the single largest drag on overall activity in the first quarter of 2007. Despite historically low mortgage rates and good income gains, housing affordability remains stretched for many households following almost a decade of steadily appreciating home prices. High inventory levels should continue to depress both new and existing home sales, which will in turn push prices lower and curb home equity extraction. Tighter lending standards and mortgage defaults in the wake of the fallout from the subprime market should further exacerbate the situation. Real residential investment, which has fallen at a double-digit annual rate for four consecutive quarters, will likely continue to retrench through year-end.
As consumers scale back spending, the onus will increasingly fall on private sector firms to push growth forward. Companies remain cautious about economic prospects, but the recent uptick in durable goods orders and better-than-expected first-quarter business investment suggest that capital expenditures could rebound from their recent soft performance. Healthy corporate balance sheets, tight capacity utilization rates, and low financing costs remain supportive of the outlook for both equipment and software purchases and non-residential investment. Meanwhile, municipal infrastructure requirements will bolster state and local government spending on construction and engineering-related projects.
The external sector should also prove supportive of U.S. growth over the next two years. A weakening U.S. dollar and ongoing strong foreign demand point to continuing gains in export volumes, particularly in areas such as aircraft, industrial machinery and high-tech goods. At the same time, a moderation in U.S. consumer spending growth and a slower pace of inventory expansion will help contain import demand. However, any significant narrowing in the trade deficit from its current level of roughly US$800 billion will be difficult to achieve given the United States’ massive reliance on imported energy products and growing appetite for low-cost manufactured goods from China and other emerging nations.
Inflation trends are beginning to move lower, providing the Federal Reserve with the manoeuvring room to ease the monetary reins by the end of the year if economic activity continues to decelerate. Both core CPI inflation and the core PCE deflator have recently edged down from their earlier highs, though both measures remain above the Fed’s 2% comfort zone. Meanwhile, relatively high wage pressures are expected to moderate as the labour market cools.
Housing Demand Cools
Employment Growth Moderates
U.S. Twin Deficits Persist
100
150
200
250
300
00 01 02 03 04 05 06 07f 08f1.0
1.5
2.0
2.5
3.0
Canada (LHS)U.S. (RHS)
thousands
Housing Starts
millions
-2
-1
0
1
2
3
4
00 01 02 03 04 05 06 07f 08f
CanadaU.S.
annual % change
Employment
-900
-700
-500
-300
-100
100
300
500
00 01 02 03 04 05 06 07f 08f
US$ billions
Totalex. Social Security
Trade Balance
Federal Deficit

7
Global Economic Research Global Outlook May 2007
Mexico — Structural Reforms Amid Cyclical Expansion Pablo Bréard
M exican President Felipe Calderón’s first six months in office have been characterized by a favourable economic environment that has included
strong growth, real exchange rate stability, low single-digit inflation and a vibrant financial sector. A positive working relationship with Congress is improving the likelihood of an effective implementation of his policy platform, including the approval of pending structural adjustments; public sector pension reforms have already been approved. Further progress will help to establish the foundation for a pick-up in investment, setting the stage for solid, sustainable growth. Public finances, underpinned by high oil prices, remain under strict discipline. However, comprehensive reform is urgently needed to increase tax collection — tax revenue is only 12% of GDP — and thereby enable increased expenditures in social and physical infrastructure.
Real GDP will expand by an average rate of just over 3½% in 2007-08, down about a full percentage point from the solid 4.6% gain in 2006. High oil prices, strong automotive exports, growing employment and robust domestic consumption underpinned last year's robust performance, but the slowdown in the U.S. economy is weighing on foreign sales. Investment is now the most vibrant component of aggregate demand.
Domestic credit expansion is on the rise, supported by a relatively stable exchange rate, and low and sustainable inflation of around 4%. Nevertheless, with inflation at the top of the central bank’s target range and credit continuing to grow at a very rapid pace, the Banco de México has recently shifted to a more restrictive stance, announcing a 25 basis point tightening in monetary policy conditions. Commercial bank lending to the private sector has been growing at annualized rates approaching 30%, while housing credit has been expanding even more quickly.
Some widening in the current account deficit will be evident in 2007-08. Nevertheless, the shortfalls — which are unlikely to exceed 2% of GDP — will be readily manageable and are likely to be financed largely, if not entirely, by investment inflows. Import growth will remain strong, sustained by solid gains in business investment and consumer spending. Export earnings will remain highly sensitive to oil prices and to the U.S. economic cycle, as that market absorbs approximately 85% of Mexico's foreign sales. The current account position will also continue to be influenced by large remittance inflows from Mexican workers residing in the United States which exceed US$20 billion annually.
Mexico's capital account has undergone significant changes. While foreign portfolio investment is still flowing into peso-denominated bonds and the local equity market, holdings of U.S. dollar-denominated bonds have been declining. Foreign holdings of peso-denominated government bonds have been steadily increasing and will be reinforced by the investor-friendly electoral results. Although foreign direct investment remains positive, inflows are still rather small compared with the country's potential. Unless the new government successfully negotiates the required structural reforms with opposing political forces, this situation will not materially change.
INTERNATIONAL Latin America — Stable Growth Through 2008 Pablo Bréard
T he developing Americas region as a whole will post a lower, yet more sustainable, economic expansion. Growth differentials between the more stable,
better-performing economies — Brazil, Chile, Mexico, Peru and Colombia — and the post-crisis fast-growing countries — Argentina and Venezuela — will tend to narrow.
International Outlook
2006 2007f 2008fCanada 2.7 2.3 2.7United States 3.3 2.1 2.6Mexico 4.8 3.4 3.5
Brazil 3.4 4.2 4.5Argentina 8.5 7.8 6.5Chile 4.5 5.5 5.0
U.K. 2.8 2.3 2.0Germany 2.9 2.4 2.1France 2.1 2.2 2.2Italy 1.9 1.2 1.5
Japan 2.2 2.1 1.8China 10.7 10.5 10.0India 8.8 8.0 7.5Korea 5.0 4.5 4.8
Real GDP (% change)
2006 2007f 2008fCanada 1.7 0.9 0.5United States -6.5 -5.7 -5.5Mexico -0.2 -1.1 -1.6
Brazil 1.5 1.0 1.3Argentina 2.9 2.4 1.7Chile 4.0 2.2 0.7
U.K. -3.0 -2.8 -2.9Germany 3.7 3.9 4.3France -2.0 -2.1 -2.1Italy -2.5 -2.4 -2.5
Japan 3.9 4.3 4.3China 9.4 10.2 9.9India -1.9 -2.3 -2.8Korea 0.7 0.0 -0.4
Current Account (% of GDP)
2006 2007f 2008fCanada 2.0 2.1 2.3United States 3.2 2.3 2.5Mexico 4.1 4.0 4.1
Brazil 3.1 4.0 4.2Argentina 9.8 12.0 12.0Chile 3.5 2.8 3.0
U.K. 3.0 2.5 2.0Germany 1.4 1.7 1.3France 1.7 1.5 1.7Italy 2.1 2.0 1.8
Japan 0.3 0.2 0.1China 2.8 3.0 2.8India 5.7 5.5 5.0Korea 2.1 2.0 2.2
Consumer Prices (% change)

8
Global Economic Research Global Outlook May 2007
The contribution of domestic demand to economic performance will increase in countries such as Brazil and Chile, as the export sector's expansion moderates as a result of a decelerating U.S. economy. Improving monetary and inflation conditions in the context of still-low global interest rates will provide a boost to domestic consumer and mortgage credit activity in those countries with robust (e.g. Chile) or strengthening (e.g. Peru, Colombia and Brazil) local financial sectors.
The largest countries in the developing Americas are in an excellent position to weather any negative contagion effects from adverse external financial shocks. The region as a whole is recording a current account surplus. Moreover, the quality and profile of public sector external debt in most key countries show signs of continuous improvement. Rating agencies have rewarded many countries with upgrades.
In aggregate, Brazil, Mexico, Argentina and Venezuela have more than US$225 billion in foreign exchange reserves to counteract any speculative attacks against their currencies or to moderate disruptive exchange rate fluctuations. With the important exception of Argentina — which has yet to close the chapter on its debt restructuring — most countries in the region have successfully completed creative debt-enhancing buybacks, pre-payments or refinancing operations, taking advantage of favourable external financial conditions.
The largest economies in the developing Americas — Brazil and Mexico — will continue to converge towards U.S.-style inflation standards, aiming to catch up with the more advanced economies, such as Chile and Peru. Inflation, however, will remain a major issue in the shock-prone economies of Venezuela and Argentina. Both countries continue their unsuccessful use of unorthodox and confidence-damaging administrative price controls to contain and reverse inflation rates that remain in double-digit territory.
Sustained progress in macroeconomic stabilization and growth is allowing national leaders to seek structural integration with neighbouring countries. The pursuit of energy security has been a key driver to advance regional integration. The collapse of the U.S.-led Free Trade Area of the Americas initiative has translated into an array of bilateral trade and investment agreements within the region. The Peruvian president is promoting the revival of the Andean group of countries as a means of connecting the Pacific Americas. Venezuela will attempt to strengthen its ties within South and Central America even as it turns its back on the IMF and the World Bank. Nevertheless, it will be overshadowed by Brazil’s emergence as a regional force and a key emerging-market economy. Europe — Sustainable, Low-Inflation Growth Erik Nilsson
W estern Europe is on a moderate, sustainable growth trajectory. Nevertheless, the combination of higher interest rates, an appreciating euro,
slower growth in overseas markets and fiscal deficit reduction will dampen the rate of expansion. Employment is increasing, but household spending may be limited by higher consumption taxes and by subdued wage gains. Business investment will be more focused on plant modernization than on capacity expansion.
In the U.K., slowly rising joblessness and monetary policy tightening will tend to limit consumer spending. There is still no appetite for fiscal retrenchment in the run-up to an anticipated early general election: the relatively subdued pace of economic growth, coupled with the uncertainties regarding the June 27th change in leadership of the ruling Labour Party have weighed against significant budget deficit reduction.
In contrast, fiscal consolidation is finally taking shape in the euro zone. A pick-up in private sector spending and a change in government in 2005 have helped to stiffen German resolve to address the nation's budgetary problems. In France, the May 6th presidential election and parliamentary elections in June have tended to limit near-term deficit-reduction gains, while a fragile coalition militates against substantial spending cutbacks in Italy.
International Outlook
2006 2007f 2008fCanada 0.6 0.2 0.2United States -1.9 -1.4 -1.4Mexico -1.2 -1.0 -0.8
Brazil -3.2 -2.5 -2.8Argentina 2.0 1.5 1.0Chile 7.9 5.0 4.0
U.K. -2.6 -2.8 -2.9Germany -1.7 -0.8 -0.5France -2.5 -2.4 -2.3Italy -4.4 -3.0 -3.0
Japan -4.3 -4.0 -3.8China -1.5 -1.8 -2.0India -6.5 -6.2 -6.0Korea 2.1 1.8 2.0
Fiscal Balance (% of GDP)
2006 2007f 2008fMexico 68 69 70
Brazil 86 130 160Argentina 34 40 45Chile 19 16 15
U.K. 41 41 40Germany 42 44 44France 43 40 39Italy 26 27 28
Japan 880 950 1050China 1069 1350 1700India 192 170 170Korea 239 250 255
Foreign Reserves (US$ bns)
Global Benchmark Interest Rates
0
1
2
3
4
5
6
03 04 05 06 07
U.K.
Canada
Euro zoneU.S.
Japan
% Official Short-TermInterest Rates

9
Global Economic Research Global Outlook May 2007
Appreciating currencies vis-à-vis the U.S. dollar, fiscal and monetary policy tightening and moderate wage settlements will ensure that price pressures in Western Europe remain well contained through 2008. Recent easing in energy cost pressures have translated into a cooling in consumer inflation, although the VAT increase in Germany has had a temporary adverse impact.
International trade will begin to weigh on western European growth by 2008. Euro appreciation — it gained almost 12% against the U.S. dollar in 2006 and we anticipate a further 5% rise by the end of 2007 — will offset the support to exports offered by further, albeit somewhat reduced, expansion in external demand for capital goods. As a result, the euro zone's current account will remain in modest deficit through the forecast period. In the U.K., the trade deficit will likely continue to hover above US$150 billion over the next two years, though substantial surpluses in both services and net investment income flows will help to limit the current account shortfall to less than 3% of GDP. Asia/Pacific — Increasing Reliance On Domestic Spending Erik Nilsson
J apan remains on track to record moderate, sustainable growth. The impetus will come largely from business investment and foreign trade, as the
government will remain focused on spending restraint. Consumer spending gains will remain subdued as high-cost retiring workers are replaced with lower-salaried entrants to the labour force.
China’s administration is attempting to shift the locus of growth from capital expenditures to consumer spending, and is giving greater emphasis to rural development. Nevertheless, Beijing is proceeding cautiously, as it is determined to avoid any marked slowdown in overall economic activity that might then lead to increased joblessness and, perhaps, social unrest. As a result, GDP growth will average more than 10% through 2008.
India is now in the top ranks of the global growth charts. The economy is poised to continue expanding by an average of close to 8% in 2007-08. After decades of being focused largely on domestic markets, Indian manufacturers are turning their attention outwards. Even more striking has been the rapid development of internationally focused Indian-based software development and business services. However substantial rupee appreciation is beginning to weigh on the competitiveness of export-oriented firms.
Elsewhere in the Asia/Oceania region, economic growth prospects remain favourable. South Korea and Taiwan successfully coped with the run-up in energy costs in 2006 without any significant domestic dislocations, and the subsequent easing in energy prices should prove beneficial. In Australia, however, a bias towards monetary policy tightening and the strength of the Australian dollar may limit growth to no more than 3% through 2008.
The ever-deepening array of bilateral and multilateral exchange rate support mechanisms, ongoing efforts to develop Asian currency bond markets and increasing informal intra-regional consultations among the monetary authorities — all backstopped by more than US$3 trillion in international reserves — highlight Asia's collective financial power. Growing interest within the region for more active reserves management reinforces the likelihood of some diversification out of U.S. dollar-denominated assets.
We expect the Chinese authorities to countenance a moderate quickening in the pace of renminbi appreciation in 2007, in turn setting the stage for renewed yen strengthening. Other central banks within the region will likely take their lead from Japan and China, with the result that most major Asian currencies will move in tandem, though the adjustments will not be perfectly synchronized. Such a pattern of change would prevent any serious shift in relative competitiveness within the region.
Europe
Asia
Latin America
-6
-4
-2
0
2
4
6
8
01 02 03 04 05 06 07
y/y % change
France
Germany
U.K.
-15
-10
-5
0
5
10
15
20
25
01 02 03 04 05 06 07
y/y % change
South Korea
China
Japan
-25
-20
-15
-10
-5
0
5
10
15
20
01 02 03 04 05 06 07
y/y % change
Brazil
Chile
Argentina
Industrial Production

10
Global Economic Research Global Outlook May 2007
INDUSTRY & COMMODITY The Mining Boom Continues Patricia Mohr / Carlos Gomes
S cotiabank’s Commodity Price Index has climbed to new record highs in the spring of 2007 — surpassing the previous peak in December 2006 — and
up more than 123% from the cyclical bottom in October 2001. The Metal & Mineral Index has led the advance — reaching consecutive monthly records — triggering stepped-up international interest in Canadian assets and major foreign takeovers. Considerable liquidity in world financial markets, relatively low interest rates and cash-rich resource firms are spurring merger and acquisition activity and consolidation in mining, steel and aluminium — recognizing the growth opportunities on the global stage.
The tremendous staying power of metal prices in this business expansion, despite slowing U.S. growth, reflects a global economy which is less and less dominated by the United States. This not only mirrors the re-acceleration of China’s GDP growth in the first quarter — resulting in a strong rebound in copper and zinc prices — but also the emergence of robust growth in newly emerging areas such as Vietnam, the Middle East, India, the Baltic countries, Russia and Latin America (in some cases linked to new-found wealth in the resource industries).
The strength of metal prices has been widespread — ranging from uranium, molybdenum, fertilizer-related minerals such as potash, and nickel. Uranium has been the ‘top’ performing commodity within the Scotiabank Commodity Price Index this year, climbing 67% from late 2006 through early May. Further gains are expected, given the planned 38% expansion of the world’s nuclear power capacity by 2020 amid very tight current uranium supplies. Nuclear power emits virtually no greenhouse gases. Canada is the world’s largest primary producer of uranium.
Strong global demand for nickel-containing stainless steel and recent delays in new mine expansion have recently propelled nickel prices to new record highs (more than double the previous peak in 1988). A major pick-up in world business investment in processing plant (refineries, bitumen upgraders, petrochemical plants), after underinvestment in the 1990s, and booming aircraft orders in the Far East lie behind the strength of high-specification stainless steel. A ‘super cycle’ is expected for nickel, given only a handful of new nickel mines likely starting up over the balance of the decade.
The Oil & Gas Index has also rallied back in recent months, after weather-related weakness in early 2007, and — while well below the peak of October 2005 — is at a high level. WTI oil prices are expected to hover around the US$60 mark through 2008, underpinned by a fairly wide ‘geopolitical risk’ premium and only gradually improving supplies. OPEC-Ten output cuts of 1.2 mb/d since last September, while less than the 1.7 mb/d pledged, have also been sufficient to draw down stocks in the United States, Japan and Europe by 1 mb/d in the first quarter of 2007. Natural gas prices will likely strengthen over the next eighteen months, as last fall’s cuts in Western Canadian drilling activity tighten North American supplies.
80
90
100
110
120
130
140
150
160
170
180
190
90 92 94 96 98 00 02 04 06 08
Index: 1997=100
Scotiabank Commodity Price Index
Record High in March 2007 at 123.4%
Above Cyclical Low
Strong Cyclical Upswing In Commodity Prices
Canadian Output (annual % change in real GDP)
2005 Share 1990-2005 2006 2007f 2008f
100.0 Total: All Sectors 2.4 2.7 2.3 2.7
67.4 Services 2.7 3.6 3.2 3.04.6 Communications 4.7 2.2 2.4 2.56.3 Wholesale Trade* 4.5 6.7 3.2 3.8
32.6 Goods Production 1.8 0.8 0.2 2.1
13.3 Primary 1.5 -0.9 -0.2 2.32.6 Agriculture & fishing 1.9 -1.6 2.8 3.02.5 Forestry & lumber 1.9 -3.0 -3.2 0.51.6 Pulp, paper & printing -0.2 -5.3 -2.5 1.52.3 Oil, gas & coal 2.5 2.5 1.6 3.00.7 Drilling 6.6 -2.7 -11.0 5.01.2 Other mining 0.8 2.4 3.7 3.02.4 Steel & metal fabricating 1.5 0.2 -0.4 2.4
10.7 Manufacturing 2.4 -0.6 0.2 2.12.1 Food & beverages 1.3 -1.2 -0.6 1.01.9 Motor vehicles & parts 4.2 -5.7 -3.5 0.90.7 Aerospace-transp. equip. 0.6 10.5 3.3 4.21.2 Machinery 1.0 3.5 2.4 4.01.3 Telecom/computer equip. 2.9 1.3 2.6 4.02.7 Chemicals & refineries 3.3 -1.1 1.0 2.00.8 Other manufacturing -0.5 -2.7 -2.0 0.4
6.0 Construction 1.3 7.4 1.9 2.5
2.6 Utilities 1.1 -1.6 -1.1 0.6
* Includes computer sales outlets.

11
Global Economic Research Global Outlook May 2007
The new record in overall commodity prices this spring also reflects the recent rejuvenation in wheat, barley and canola prices — a welcome development for Prairie farmers — linked to the development of wheat and corn-based ethanol for gasoline and canola for biodiesel (particularly in Europe).
Only the Forest Products Index has retreated, with lumber and oriented strandboard prices falling alongside the sharp correction in U.S. housing starts. While prices are approaching a cyclical bottom, a sustained recovery is unlikely until the U.S. housing market begins to recover in 2008. In the meantime, Canadian producers are shifting their market development efforts overseas, especially to Europe. The increased use of wood fibre for power generation has dramatically raised wood costs in Europe, increasing the competitiveness of Canadian products in both Asia and Europe.
British Columbia is also expanding its wood pellet production and exports to Europe (partially based on beetle-kill timber). Output is expected to climb from 690,000 tonnes in 2006 to 3.25 million by 2010. Ontario Retains North American Auto Production Supremacy, But Suppliers Lose Share Vehicle purchases in the emerging markets of Asia and Latin America remain in the fast lane in 2007. However, slowing economic growth has started to undercut sales in mature markets — especially the United States. U.S. passenger vehicle sales have declined by 3% so far this year and are expected to fall below 16 million units in 2007 — the lowest level since 1998, and down from 16.5 million in 2006.
The Scotiabank Leading Indicator of U.S. Vehicle Sales — a proxy for consumer fundamentals — recently slumped to the lowest level since the early 1990s, suggesting that sales will likely weaken further in coming months. The recent increase in gasoline prices to US$3.00 per gallon — the highest level since September 2005, in the aftermath of Hurricane Katrina — will also dampen purchases during the key ‘spring selling season’. Fleet volumes are also under pressure, as automakers reduce sales to daily rental companies.
In Canada, car & light truck sales are expected to edge down to 1.60 million units in 2007 from 1.61 million last year. Volumes in Central and Atlantic Canada are being undercut by slowing growth south of the border. In contrast, sales continue to post double-digit gains in Alberta alongside the strongest employment conditions since the late 1970s. Purchases are also revving up in Saskatchewan, as rising grain prices buoy farm incomes. Volumes will climb to a record high in resource-rich Western Canada.
Vehicle production across North America declined by 3% last year and a similar drop is likely in 2007 alongside weaker sales and capacity closures — mostly in the United States. Output will also move lower in Canada. However, rising assemblies of new crossover utility vehicles and higher production at Japanese-owned plants will enable Ontario to retain North American vehicle production supremacy for the fourth consecutive year. In contrast, Canadian parts suppliers are losing market share. Each North American-built vehicle now contains only $1,869 of Canadian-made parts, down from a 2004 peak of $2,019.
Some of the loss in supplier share reflects reduced competitiveness due to Canadian dollar appreciation as well as growing competition from low-wage countries such as Mexico, China and India. However, Canadian suppliers have also lagged in investment spending and it is vital that they increase research and development to develop proprietary technologies and enable a shift to higher value-added parts. Canadian suppliers invest only 3% of sales on new machinery and equipment, nearly a percentage point less than their U.S. counterparts.
Nickel Prices Soar
0
10
20
30
40
50
60
70
80
80 85 90 95 00 05 10
US$/bbl
West Texas Intermediate Oil
IranianRevolution Gulf
WarIraqWar
Data to May 2007.
Oil Prices Remain Lucrative At About US$60
02468
101214161820222426
80 84 88 92 96 00 04 0802468101214161820222426
US$ per pound
Previous Peak US$10.84 in March 1988
Record US$24.27May 11, 2007
LME Nickel Prices
12
13
14
15
16
17
18
95 96 98 00 02 04 061.2
1.4
1.6
1.8
2.0
2.2
2.4
Ontario's Share of North American Vehicle Output (LHS)
C$ Content Per North American-Built Vehicle (RHS)
C$ 000sper cent
Steady Vehicle Assemblies, But Suppliers Lose Share

12
Global Economic Research Global Outlook May 2007
THE PROVINCES Construction-Led Growth David Hamilton
B ritish Columbia should remain near the top of the pack this year and next, led by activity in the construction sector. In addition to ongoing preparations
for the 2010 Winter Olympics, several major infrastructure projects are underway, including large port expansions along the Pacific coast. Although the forestry sector remains weak, increased harvesting due to the pine beetle infestation is lifting volumes. As well, several new mines are scheduled to open this year, boosting output amid strong global demand and high commodity prices.
Large-scale expansion in the oil sands will continue to spur growth in Alberta through 2008. As the construction boom spills over into the non-resource and service sectors and the Province ramps up infrastructure outlays to meet growth, cost pressures and labour shortages have led to delays for some projects. A slowdown in natural gas drilling in Western Canada is expected to reduce Canadian gas export volumes. A number of pipeline projects are also slated to begin construction this year, while several major office tower and large retail developments are underway.
Saskatchewan’s economy is expected to grow by close to 3% this year and next, benefitting in part from strong support from the mining sector, mainly potash and uranium. Increased biofuel production is supportive of grain and oilseed prices. Manitoba should also witness steady growth through 2008 mainly due to public investment in infrastructure, as well as expansion of hydroelectric and wind power capacity. The prospective lifting of a U.S. import ban on older cattle would be positive news.
Ontario’s expansion is expected to lag the national average in both 2007 and 2008, as the beleaguered manufacturing sector continues to weigh on production. On a positive note, automakers have planned several large expansions, while a stronger Canadian dollar is encouraging companies to import machinery and equipment, boosting longer-term productivity prospects. Public infrastructure investment will also remain brisk. On the private non-residential front, a number of major office tower projects are currently underway. Continued service sector employment strength is positive for household spending.
Much like Ontario, Quebec’s manufacturing sector is expected to keep growth trends relatively moderate. Nevertheless, significant pay-equity adjustments from the provincial government to its employees will help to sustain household purchasing power. A number of public infrastructure projects and mining and aluminium refinery expansions will boost construction, alongside continuing hydroelectric power investments. Although the forestry sector remains weak, aerospace is reviving from last year’s slump.
New Brunswick’s growth will be maintained by several capital projects currently underway, including the refurbishing of the Point Lepreau nuclear station and the new Canaport LNG terminal. The mining sector will be buoyed by strong global demand and high commodity prices. Nova Scotia will also benefit from increased offshore natural gas and metal mining production. Public and private construction activity remains positive, while a number of technical support centre openings are lifting service sector employment. Strength in aerospace, shipbuilding and tire manufacturing should continue.
Prince Edward Island will likely lag the other Atlantic provinces, due in part to a lack of major construction projects. An acreage cap should help to support potato prices, while food and aerospace manufacturing will continue to expand. Newfoundland and Labrador should rival Alberta for the top growth spot in 2007 as mining output rebounds from last year’s disappointing output in the offshore oil and metal mining sectors. Growth is expected to ease in 2008 as oil production gains moderate and due to a lack of major construction projects.
0 3 6 9 12
Ontario
Quebec
Atlantic
B.C.
Alberta
2007ytd2002-06
Retail Sales
annual % change
Man./ Sask.
0 2 4 6
Ontario
Atlantic
Quebec
B.C.
Alberta
2007ytd2002-06
Employment
annual % change
Man./ Sask.
0 1 2 3 4 5 6
Ontario
Quebec
Atlantic
B.C.
Alberta
2007-08f2002-06
annual% change
Real GDPMan./ Sask.
Provincial Performance

13
Global Economic Research Global Outlook May 2007
Regional Performance
1990-2005 2006 2007f 2008f 1990-2005 2006e 2007f 2008f
Real GDP Budget Balance, FY March 31(annual % change) (after special account transfers, $ mn)
Canada 2.6 2.7 2.3 2.7 -11,256 13,218 9,200 3,300 Newfoundland and Labrador 2.5 2.8 4.0 1.5 -329 199 76 261 Prince Edward Island 2.5 2.0 1.8 2.1 -30 1 1 2 Nova Scotia 1.9 1.1 2.0 2.3 -228 228 99 118 New Brunswick 2.2 2.6 2.3 2.4 -69 244 35 37
Quebec 2.1 1.7 1.8 2.4 -2,206 37 592 446 Ontario 2.6 1.9 1.7 2.3 -4,580 298 310 -400
Manitoba 1.9 3.3 2.8 3.0 na 375 166 175 Saskatchewan 2.4 0.4 2.9 2.9 -81 400 70 75 Alberta 3.6 6.8 4.0 3.6 1,136 * 8,551 * 7,388 * 2,183 * British Columbia 2.7 3.6 3.2 3.5 -495 3,060 2,850 400
*Net revenue.
Employment Unemployment Rate(annual % change) (annual average %)
Canada 1.4 1.9 2.0 1.2 8.7 6.3 6.2 6.3 Newfoundland and Labrador 0.2 0.7 1.4 1.0 17.6 14.8 14.6 14.6 Prince Edward Island 1.4 0.6 2.0 0.8 14.0 11.0 10.8 10.8 Nova Scotia 0.9 -0.3 1.8 0.8 11.0 7.9 7.9 7.9 New Brunswick 1.0 1.4 1.1 0.8 11.4 8.8 8.2 8.4
Quebec 1.1 1.3 1.5 1.0 10.4 8.0 7.9 8.0 Ontario 1.3 1.5 1.4 1.0 7.9 6.3 6.4 6.6
Manitoba 0.8 1.2 1.1 1.0 6.6 4.3 4.2 4.1 Saskatchewan 0.4 1.7 2.5 0.8 6.3 4.7 4.2 4.1 Alberta 2.2 4.8 4.2 2.2 6.5 3.4 3.2 3.0 British Columbia 2.2 3.1 3.0 2.0 8.4 4.8 4.3 4.2
Housing Starts Motor Vehicle Sales(annual, thousands of units) (annual, thousands of units)
Canada 168 227 200 185 1,391 1,614 1,600 1,610 Atlantic 11 12 10 10 100 110 109 110
Quebec 36 48 40 35 356 396 380 382 Ontario 62 73 65 60 544 601 574 578
Manitoba 3 5 5 4 40 44 44 45 Saskatchewan 2 4 4 3 35 38 41 41 Alberta 25 49 43 42 156 236 260 261 British Columbia 29 36 33 31 160 189 192 193

Warren Jestin, Senior Vice-President & Chief Economist [email protected] Aron Gampel, Vice-President & Deputy Chief Economist [email protected] CANADIAN & U.S. ECONOMIC RESEARCH Adrienne Warren, Canadian and U.S. Analysis [email protected] Meny Grauman, U.S. Analysis [email protected] David Hamilton, Provincial Analysis [email protected] CAPITAL MARKETS & FUNDAMENTAL RESEARCH Mary Webb, Fiscal Analysis [email protected] Basil Chan, Research [email protected] Karen Cordes, Research [email protected] Raffi Ghazarian, Research [email protected] Neil Tisdall, Research [email protected] INDUSTRY & COMMODITY RESEARCH Patricia Mohr, Vice-President [email protected] Carlos Gomes, Auto & Chemical Industry Analysis [email protected] Gorica Djeric, Telecom, Media & Steel Industry Analysis [email protected] INTERNATIONAL RESEARCH Pablo Bréard, Vice-President [email protected] Erik Nilsson, Asian and European Economies [email protected] Tuuli McCully, Research [email protected] Estela Ramírez, Research [email protected] ADMINISTRATION & PRODUCTION Nancy Kerr, [email protected] Wanda Wen, [email protected] Doreen Albrecht, [email protected] Rosa DiPalma, [email protected] This Report is prepared by Scotia Economics as a resource for the clients of Scotiabank and Scotia Capital. While the information is from sources believed reliable, neither the information nor the forecast shall be taken as a representation for which The Bank of Nova Scotia or Scotia Capital Inc. or any of their employees incur any responsibility. Scotia Economics Scotia Plaza 40 King Street West, 63rd Floor Toronto, Ontario Canada M5H 1H1 Tel: (416) 866-6253 Fax: (416) 866-2829 Email: [email protected] Ce rapport est également disponible en français.
Scotia Economics Staff and Publications GLOBAL Forecast Update* Economic and financial market forecasts for Canada, the U.S. & other major global economies Foreign Exchange Outlook* Monthly report highlighting investment strategy and factors shaping developments in global currency markets Global Outlook* Flagship report on the global economy International Views* Quarterly regional economic outlook for North America, Europe, Asia/Pacific and Latin America Weekly Trends* A weekly snapshot of economic, industrial and financial trends in the advanced economies NORTH AMERICA Calendar of Economic Release Dates* Economic release dates for Canada and other key OECD countries Canada and U.S. Best Guesstimates A snapshot of the week ahead in the Canadian and U.S. economies Canadian Indicator Preview Estimates for Canadian economic indicators to be released in the week ahead Canadian Indicator Review Analysis of a recently released indicator — trend to date and outlook for the future Economic Commentary* A perspective on economic, financial and public policy developments Economic Directions* Chief Economist’s insights into emerging financial and economic trends Fiscal Pulse* Analysis of fiscal developments in Canada and the U.S. NAFTA Quarterly* An up-close look at the economic factors driving the Canadian, U.S. and Mexican economies Provincial Forecast Update* Economic and fiscal forecasts for the Canadian provinces Provincial Trends* An in-depth analysis of provincial economic trends in Canada Real Estate Trends* A review of current developments in Canadian and U.S. real estate markets Regional Trends* A topical discussion of emerging regional developments in Canada U.S. Indicator Preview Estimates for Canadian economic indicators to be released in the week ahead U.S. Indicator Review Analysis of a recently released indicator — trend to date and outlook for the future ASIA, EUROPE & LATIN AMERICA International Weekly Outlook Reports* Fundamental and capital market developments in Asia/Oceania, Europe and Latin America Sovereign Ratings Monitor Analytical view of sovereign credit ratings actions INDUSTRY & COMMODITY Auto News Flash* Monthly review of the latest Canadian and U.S. vehicle sales Global Auto Report* Monthly review of developments in the auto industry Scotiabank Commodity Price Index* Monthly round-up of commodity price developments LOOK FOR SCOTIA ECONOMICS REPORTS ON: *Internet @ www.scotiabank.com, Bloomberg @ SCOE and Reuters @ SM1C