global oil market outlook - prism.pttgrp.com (7)_2.pdf · chapter 1: global economic growth key...
TRANSCRIPT

1
9th March 2018
Global Oil Market Outlook

2
Agenda
Oil Demand
Oil Supply
Conclusions

3
Agenda
Oil Demand
Oil Supply
Conclusions

4
Global economic growth
Technology & Environmental Policy
Chapter 2:
Chapter 3:
Chapter 1:
Refinery Overview
Oil Demand

Advanced Economies Developing Economies
3.9%
GDP Growth
2.0% +0.2 MMBDDemand Growth GDP Growth
4.9%
Global GDP Growth
+1.2 MMBD
Demand Growth
Sources: IEA, EIA, OPEC (Jul’17), IMF (Jan’18)
2018 GLOBAL ECONOMY DRIVEN BY DEVELOPING ECONOMIES
CHAPTER 1: GLOBAL ECONOMIC GROWTH
5

CHAPTER 1: GLOBAL ECONOMIC GROWTH
KEY PLAYERS TAKE UP HALF OF DEMAND
4 MAJORPLAYERS
U.S.
Europe
China
India
Developing Economies
Advanced Economies
47%% Share of 2018 Demand
6
53%

CHAPTER 1: GLOBAL ECONOMIC GROWTH
U.S. ECONOMY AND DEMAND GROWTH IN 2018
123210 223
1.5%
2.3%
2.7%
0.0%
0.5%
1.0%
1.5%
2.0%
2.5%
3.0%
0
200
400
600
800
1000
1200
2016 2017 2018Demand Growth GDP
Sources: IEA, EIA, OPEC (Jul’17), IMF (Jan’18)
GDP & Demand Growth
2008 2011 2014 2017
(KBD) (%YoY)2008 2011 2014 2017
2016-2017 (6 M)+1-2%
Miles traveled
Trump’s tax cut plan
35%
21%
Corporations
39.6%37%
Individual
TrumpProposal
Current
4.2% (16-year low in Sep’17)
Unemployment rate
fallen to FACTORS TO WATCH
Solid demand propelling robust economic recovery
7
The next FED chair?Jerome Powell
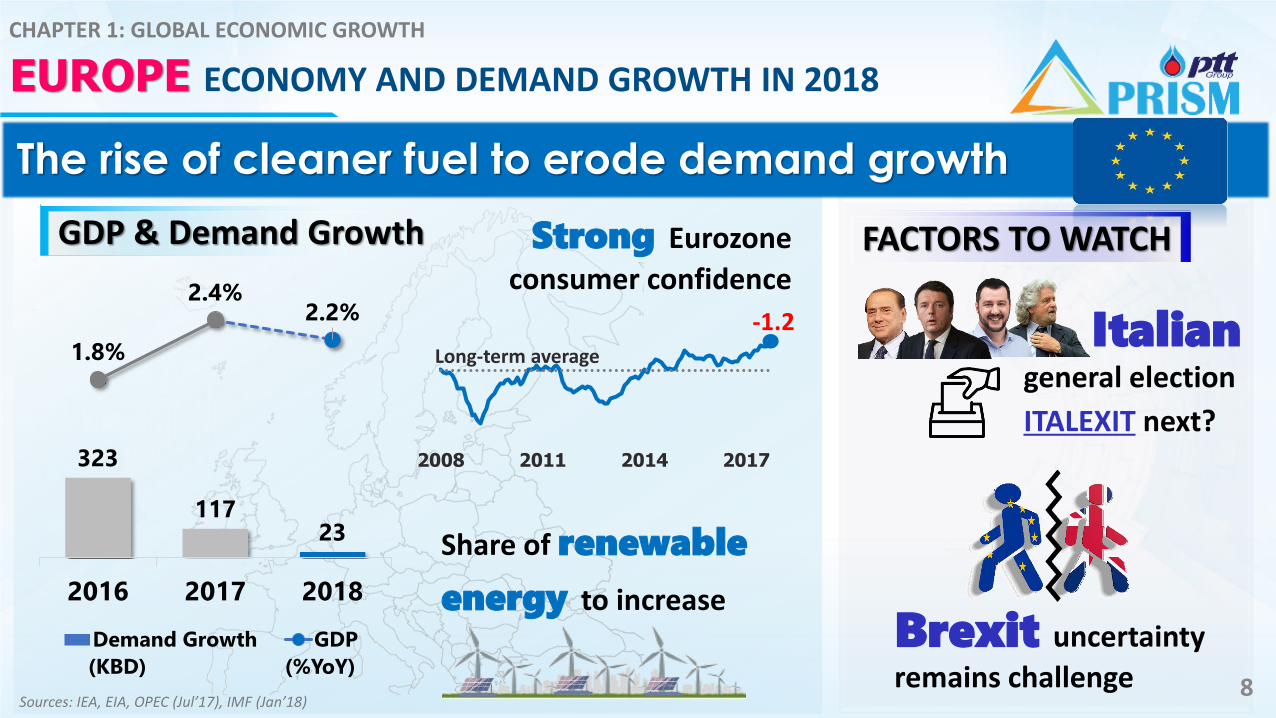
EUROPE ECONOMY AND DEMAND GROWTH IN 2018
Sources: IEA, EIA, OPEC (Jul’17), IMF (Jan’18)
(KBD) (%YoY)
323
11723
1.8%
2.4%2.2%
0.0%
0.5%
1.0%
1.5%
2.0%
2.5%
3.0%
0
200
400
600
800
1000
1200
2016 2017 2018
Demand Growth GDP
2008 2011 2014 2017
-1.2Long-term average
Strong Eurozone
consumer confidence
Brexit uncertainty
remains challenge
general election
ITALEXIT next?
GDP & Demand Growth FACTORS TO WATCH
The rise of cleaner fuel to erode demand growth
Italian
Share of renewable
energy to increase
8
CHAPTER 1: GLOBAL ECONOMIC GROWTH

CHINA ECONOMY AND DEMAND GROWTH IN 2018
Sources: IEA, EIA, OPEC (Jul’17), IMF (Jan ’18)
(KBD) (%YoY)
463350 333
6.7% 6.9% 6.6%
0.0%
1.0%
2.0%
3.0%
4.0%
5.0%
6.0%
7.0%
8.0%
0
200
400
600
800
1000
1200
2016 2017 2018
Demand Growth GDP
Shift in China’s economy
from manufacturing to service
Car sales growth by 4-5% in 2017
mainly driven by
SUVsSource: CAAM (Oct’17)
China’s debt
Growth in
“BELT ROAD
INITIATIVE”
30%
40%
50%
60%
2006 2008 2010 2012 2014 2016
Service
Manufacturing
% of GDP
FACTORS TO WATCH
Economic transition towards the
GDP & Demand Growth
“New Normal”
China Globalization Policy
9
CHAPTER 1: GLOBAL ECONOMIC GROWTH

CHAPTER 1: GLOBAL ECONOMIC GROWTH
INDIA ECONOMY AND DEMAND GROWTH IN 2018
Sources: IEA, EIA, OPEC (Jul’17), IMF (Oct’17)
(KBD) (%YoY)
317173 227
7.1%6.7%
7.4%
0.0%
1.0%
2.0%
3.0%
4.0%
5.0%
6.0%
7.0%
8.0%
0
200
400
600
800
1000
1200
2016 2017 2018
Demand Growth GDPExpanding in
middle class
“Make In India”
Transforming India
into a manufacturing magnet
Robust car sales +7% YoY
2018
Strong government
spending, aiming toconstruct
40 km of highway roads per day
FACTORS TO WATCH
2017
Continuous economic growth to drive demand
GDP & Demand Growth
10

Europe : Better-than-
Expected Growth Continued, but Political Risks Persist
China : Slow Down
but Enters New Chapter of “Quality” Growth
India : The Fastest
Growing Country among Emerging Economies.
11
53%
1.5
2.32.7
2016A 2017E 2018F US : Strong Economic
Fundamentals will be Key Growth Drivers in 2018
1.8
2.42.2
2016A 2017A 2018F
7.1
6.7
7.4
2016A 2017E 2018F
6.7 6.96.6
2016A 2017E 2018F3.9%
Global GDP Growth
STRONG ECONOMIC GROWTH GLOBALLY!
CHAPTER 1: GLOBAL ECONOMIC GROWTH

CHAPTER 2: TECHNOLOGY & ENVIRONMENTAL
DISRUPTIVE TECHNOLOGY TO RESHAPE OIL MARKET
Internal Combustion Engines (ICE)
Battery-Powered Cars
2016 Car Fleet
2 Million 0.2 %
% Market Share2016 Car Fleet
1,000 Million 99.8 %
% Market Share
Sources: IEA (Jun’17) and Bloomberg (Jul’17)12

IMPLICATIONS OF THE PARIS AGREEMENT
CHAPTER 3: ENVIRONMENTAL POLICY
Risks over bailing on the Paris climate deal as
No defined “Punishment“ for breaking it
No clear “Detail” on how these countries should do
“WELL BELOW 2⁰C”
195 Nations Agreed to Fight CO2
Keep Global Temperature Increase
By 2100
13

CHAPTER 3: REFINERY OVERVIEW
14Sources: FGE Energy Semi Annual Reports, Fall 2017, Reuters (Feb’18) , IEA Medium Term Outlook (Mar’17)
Asia Pacific and Middle East Refinery Addition
454562
5
474 565
1207
-1000
0
1000
2000
2015 2016 2017 2018 2019 2020
KBD
AP & ME Demand Growth Middle East China
Other AP Japan India
Vietnam Teapot Net Addition
Demand surge + refinery cancellations/deferrals/closures tighten balance.
Global refinery capacity additions UNDER OIL DEMAND

GDP 3.9 %driven by developing economies
Small impactdue to little EVs adoption and uncertainty in policy
OutpaceGlobal oil demand outstrip refinery addition
CONCLUSION: GLOBAL OIL DEMAND
CONCLUSION : OIL DEMAND GROWTH
15
16
Agenda
Oil Demand
Oil Supply
Conclusions

17
“OPEC POWERFULIN THE PAST”

18
OPEC POWER IN THE PAST
85.488.4 89.0 90.6 91.9 93.2 95.0
0
10
20
30
40
50
60
70
80
90
100
2009 2010 2011 2012 2013 2014 2015
Other OPEC Saudi Other non-OPEC Russia U.S. Global Demand
Note: OPEC: Organization of Petroleum Exporting CountrySources: IEA
GLOBAL OIL SUPPLY = OPEC + NON-OPEC
Non-OPEC supply
60%
OPEC supply
40%
GLOBAL OIL SUPPLY AND DEMAND
World’s Major Exporters!
Saudi Arabia
U.S.
Russia
MMBD

19
WHY OPEC IS IMPORTANT?
0
20
40
60
80
100
120
140
160
1990 1993 1996 1999 2002 2005 2008 2011 2014
USD/bbl
1990 : 1st gulf war
2003 : 2nd gulf war
2008 : “Financial Crisis”
OPEC Cut 2 MMBD
1997 : “Asian Crisis”
OPEC Cut 1.2 MMBD2014 : Price War
“EVERY OPEC’S ACTION MOVES OIL PRICE”

20
2
3
4
5
6
7
8
9
10
11
12
2014 2015 2016
MMBD
Saudi’s flooding strategy
S h o c k !Iran sanction was lifted
and unlock 0.8-1.0 MMBD to market
Iraq kept increasing production
KEY OPEC CRUDE OIL PRODUCTION
PRICE WAR STARTED!

21
PRICE WAR LED BLEEDING
50
52
54
56
58
60
26
28
30
32
34
36
2012 2013 2014 2015 2016
MMBD MMBD
Sources: IEA, IMF
“Long period of low oil price hurts oil producing countries”
-30-25-20-15-10
-50
Ira
n
Qa
tar
Nig
eri
a
An
go
la
UA
E
Sa
ud
i A
rab
.
Ku
wa
it
Alg
eri
a
Om
an
Ve
ne
zu
ela
% o
f G
DP
MAJOR OIL EXPORTER BUDGET DEFICIT
-15%
USD/bbl
10
50
90
130
2014 2015 2016
Painful
CRUDE OIL PRICES OPEC & NON-OPEC PRODUCTION
Non-OPEC (RHS)
OPEC (LHS)

22
OUTCOME OF PRICE WAR CREATES “OIL GLUT”
O I L G L U T2,200
2,500
2,800
3,100
3,400
1999 2002 2005 2008 2011 2014
200
300
400
500
600
1999 2002 2005 2008 2011 2014
MMB
MMB
Note: US Commercial Crude oil stock Sources: EIA, Reuters, Bloomberg
U.S. CRUDE OIL INVENTORY
OECD LIQUID FUELS INVENTORY
350
485
2,500
3,000

23
RUSSIA BECAME THE LARGEST OIL PRODUCER
in October 2016High record at 11.2 MMBD
RUSSIA OIL OUTPUT (MMBD) NEW PROJECTS START UP PIPELINE
“RUSSIA was Non-OPEC leader to join
in joint production curb and called on other oil exporters to do the same.”

24
OPEC/RUSSIA AIMED TO CUT AND PUSHED PRICE HIGHER
0
20
40
60
80
100
120
Jan-12 Jan-13 Jan-14 Jan-15 Jan-16 Jan-17
Nov. 2014: OPEC UNCUT
Nov. 2016: OPEC CUT
Oil price (USD/BBL)
2015-2016: Oil Oversupply
2008: Shale Oil Developed
2014: Shale Boom
Jan-18
Price Recovery
TIME TO STOP
BLEEDING !

25
OPEC & NON-OPEC COMMITS TO “CUT THE GLUT”
Source: OPEC Monthly Report, Oct. 2017
2,500
2,600
2,700
2,800
2,900
3,000
3,100
3,200
Jan Feb Mar Apr May Jun Jul Aug Sep Oct Nov Dec
5yr-range 2017 2017F (Nov'17) 5-yr Average
OECD Oil Inventories MMB
Target Level

26
HIGH COMPLIANCE FROM PRODUCERS
Sources: OPEC (Jan’18) and IEA (Jan’18)
0
20
40
60
80
100
120
140
160
Jan-17 Mar-17 May-17 Jul-17 Sep-17 Nov-17
OPEC Cut Non-OPEC Cut
%
Compliance Rates of Output Cut

27
OPEC WILDCARDS FROM LIBYA, NIGERIA & VENEZUELA
Libya and Nigeria Output Changes*MMBD
Venezuela Production forecast
Govt. Unrest
Kurdish Independent

28
“NEW ERA OF U.S. POWER”

29
POWER OF U.S. SHALE AND ITS OWN DESTINY
1970 1977 1985 1993 2001 2009 2014
1970s : Witnessed advances in horizontal drilling technologies
1980 : Govt. sponsored research to make hydraulic
fracturing economic
1980s-1990sCommercial success of Shale gas production in Texas
Mid-2000sApplying to oil deposits in Bakken shale
Crude oil price*USD/bbl
2014 : Shale Boom!
*Nominal Oil Price

30
SHALE IS PRODUCED DIFFERENTLY FROM OLD WAY
SHALE OIL WAY:TIRAMISU
OLD WAY: JELLY DONUT
Sources: James Scherrer
VERTICAL DRILLING HORIZONTAL DRILLING

31
NEW TECHNOLOGY INCREASING PRODUCTIVITY
IranMORE LAYERS
Source: EIA
LONGER
0
400
800
1,200
2010 2012 2014 2016
Barrel Per Day
Permian Bakken Eagle Ford Niobrara
OIL PRODUCTION PER RIG IN NEW WELLS
Higher Productivity (2010-2016)
3-4 Times

32
OPEC LOST MARKET SHARES AFTER SHALE BOOM
21%40% 35%
19%
27%15%
60%33% 50%
1973 2011 2015
Others OPEC U.S. Crude
0
2
4
6
8
10
12
1965 1975 1985 1995 2005 2015
MMBD
Sources: EIA
U.S. CRUDE OIL PRODUCTION
U.S. CRUDE SUPPLY BY SOURCE
SHALE BOOM

33
OPEC & US SHALE – TUG OF WAR
0
20
40
60
80
100
120
140
160
1983 1986 1989 1992 1995 1998 2001 2004 2007 2010 2013 2016
USD/bbl Oversupply (Shale Oil)
“PRICE WAR”
1985 Oversupply (North Sea)
“PRICE WAR”
34
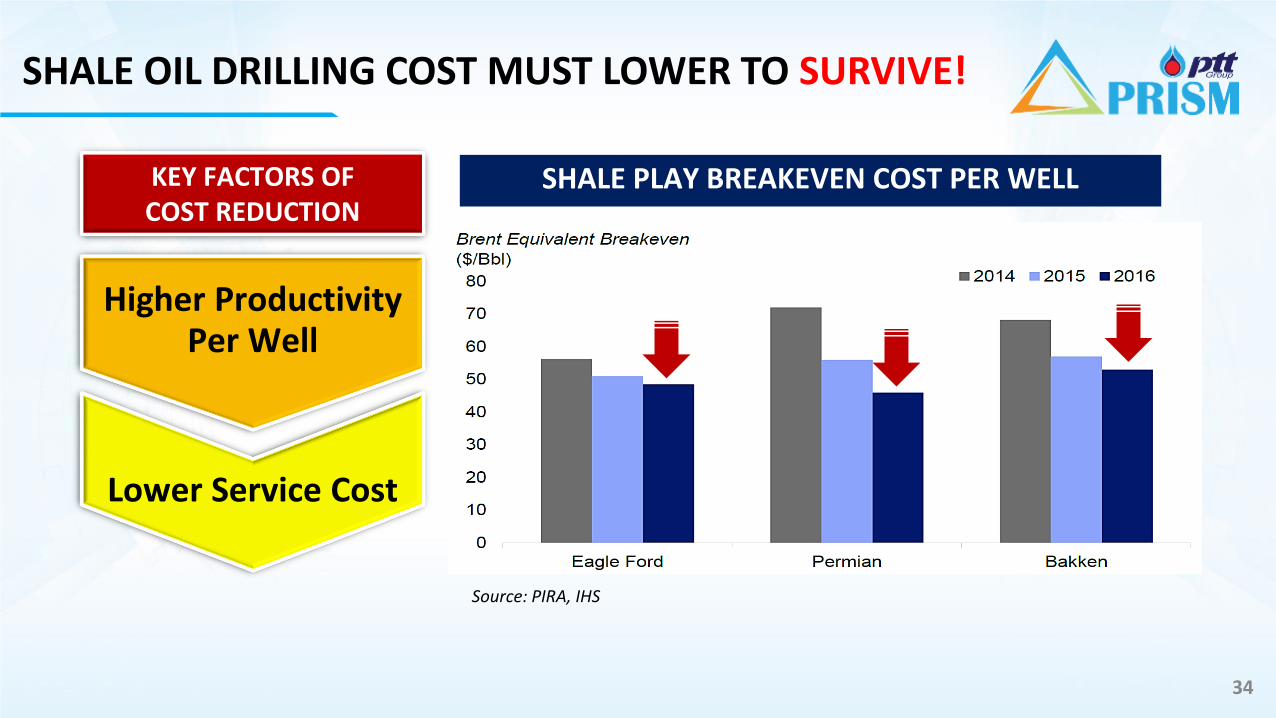
SHALE OIL DRILLING COST MUST LOWER TO SURVIVE!
Source: PIRA, IHS
SHALE PLAY BREAKEVEN COST PER WELLKEY FACTORS OFCOST REDUCTION
Higher Productivity Per Well
Lower Service Cost

35
U.S. SHALE OIL QUICKLY RESPONDS TO THE CUT
0
20
40
60
80
100
120
140
4
5
6
7
8
9
10
11
12
Jan-12 Jan-13 Jan-14 Jan-15 Jan-16 Jan-17
US Crude Oil Production (LHS) WTI (RHS)
MMBD USD/BBLUS oil production
Source: EIA (Aug. 2017)
“Pump up faster when oil price’s UP”

36
SUPPLY CONCLUSION
• Respond very quickly to increased oil prices
• At oil price $55/bbl, up to 70% of shale producers can survive
OPEC
NON-OPEC
U.S.
Outlooks
• Become a major spring producer• SOON become the largest oil producers in the
world!
• Lost power of swing producer • Suffered by price war due to countries’
budget deficit • Production cut mainly from disruptions in
Venezuela, Nigeria, and Libya
Recent• Disruptions still carry on, especially in Venezuela,
while others likely to increase• Saudi Arabia is diversifying roles to play more in
refinery business
• Russia became Non-OPEC leader for joint production cut with OPEC
• New projects are queuing to the market
• If without joint production cut, oil output will glut

37
Agenda
Oil Demand
Oil Supply
Conclusions

GLOBAL OIL MARKET
38
CHAPTER 1 : THE PRESENT MARKET & OUTLOOK
CHAPTER 2 : LOOKING FORWARD

GLOBAL OIL MARKET
39
CHAPTER 1 : THE PRESENT MARKET & OUTLOOK
CHAPTER 2 : LOOKING FORWARD

OIL STILL DOMINATES IN ENERGY SECTOR
40
Demand in 2018
• Global economic growth : 3.9%
• Global oil demand growth : 1.4-1.6 MMBD
Alternative Energy
• Keep growing with minor effect in 2018
CHAPTER 1 : THE PRESENT MARKET

41
36%
44%
18%
2%
Petroleum Products Natural Gas
Coal and Lignite Hydro & Imported Elec.
2.05 MMBoED
Thailand Primary Energy Consumption by Type of Energy in 2014
World Primary Energy Consumption by Type of Energy in 2014
31%
29%
21%
10%
5%2% 1%
Oil
Coal
Gas
Bioenergy
Nuclear
Hydro
Other Renewable
273.6MMBoED
FOSSIL FUEL CONTRIBUTE 80% OF WORLD ENERGYCHAPTER 1 : THE PRESENT MARKET

BATTLE OF INFLUENCER : OPEC, RUSSIA AND U.S. SHALE OIL
0
40
80
120US Output Revolution
UNIT : USD/BBL
OPECNo-Ceiling &
Increase Production
< 50
< 30
OIL PRICE WAR
OPEC & Non-OPECOutput Cut Deal
1.8 MMBD until June 17
Output CutExtensionto March 18
> 50
OUTPUT CUT DEAL
Second extensionto end of 2018
3
CHAPTER 1 : THE PRESENT MARKET

OIL SUPPLY GROWTH
+1.1-1.4
Come back to make profit at high prices
Grow from the legacy projects with lower cost
Maintain production cuts through 2018
+0.6
OPECNON-OPECU.S.
0.0
OIL SUPPLY GROWTH
1.7-2.0 MMBD
2018
43
CHAPTER 1 : THE PRESENT MARKET

PRISM PRICE OUTLOOK : DUBAI PROJECTION
44
20
25
30
35
40
45
50
55
60
65
70
Dubai Price : USD/BBL
20162017
2018
65 $
60 $
CHAPTER 1 : THE PRESENT MARKET

45
CHAPTER 1 : THE PRESENT MARKET
STIRRING UP GLOBAL POLICY…

EXAMPLE RISKS ON A SUPPLY DISRUPTION
46
CHAPTER 1 : THE PRESENT MARKET
Unplanned Outage:North Sea’s Forties Pipeline System (FPS)
leakage
Natural DisasterHurricane Harvey hit U.S. Gulf of Mexico, the critical region for both crude production and
refinery. Armed-Force Attacks: Libya’s oil terminals and fields shutdown

PRISM PRICE OUTLOOK : DUBAI PROJECTION
47
20
25
30
35
40
45
50
55
60
65
70
Dubai Price : USD/BBL
2018
20162017
65 $
60 $
CHAPTER 1 : THE PRESENT MARKET
2018 FACTORS TO WATCH
• Geopolitical Tensions • Compliance Concerns
• Global Policy • Financial Tightening
• Shale Oil Production • Technology and
Competitiveness

GLOBAL OIL MARKET
48
CHAPTER 1 : THE PRESENT MARKET & OUTLOOK
CHAPTER 2 : LOOKING FORWARD

49
THE OIL KILLER? - ELECTRIC VEHICLES
New Player From Other SectorAccelerator
Market Owner
“The sound is a very crucially important characteristic of a Ferrari”
Conservationist
Sources: Company’s logo
CHAPTER 2 : LOOKING FORWARD
Ferrari will make a battery-powered supercar to challenge Tesla Inc. at the high end of the electric-auto market, Chief Executive Officer Sergio Marchionne said.

WHY EVs MATTER?
11
Oil Demand Breakdown by Sector
4%Other
17% Process Heating
6%Power
11%Petrochemical
55%Transportation
Transportation holds a large share of oil demand.
39%Automotive
9%Shipping and Rail
32%Trucks
7% 2-Wheelers and Buses
13%Aviation
Sources: Barclays, BP, International Energy Agency (IEA)
Road transportation holds a large share of oil demand
CHAPTER 2 : LOOKING FORWARD

51
Purchase Price
25%
Charging Availability
13%
Note: the rest of 20% are maintenance costs, reliability, and etc.
MANY BARRIERS…
Source: McKinsey & Company (Jan’17)
Brand Availability
18%Driving Range
24%
However, two major challenges await!
Purchase Price
25%
Charging Availability
13%
HAVE BEEN OVERCOMECHAPTER 2 : LOOKING FORWARD
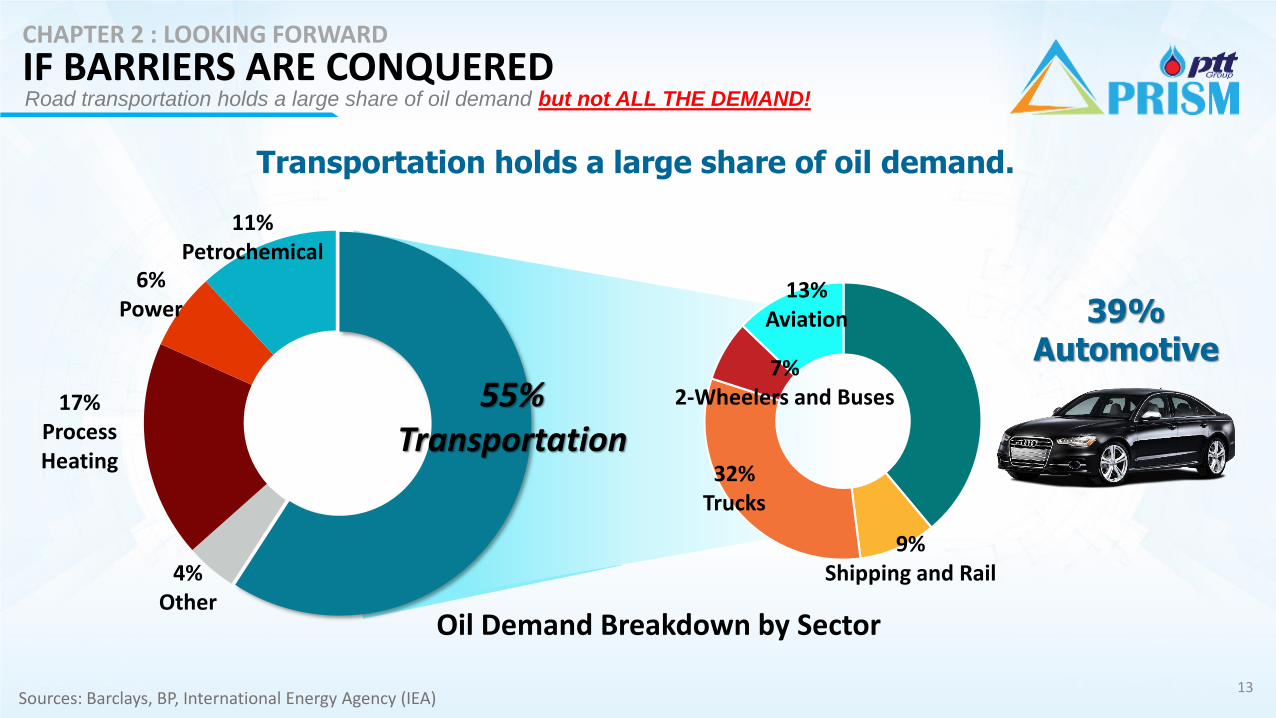
IF BARRIERS ARE CONQUERED
13
Oil Demand Breakdown by Sector
4%Other
17% Process Heating
6%Power
11%Petrochemical
55%Transportation
Transportation holds a large share of oil demand.
39%Automotive
9%Shipping and Rail
32%Trucks
7% 2-Wheelers and Buses
13%Aviation
Sources: Barclays, BP, International Energy Agency (IEA)
Road transportation holds a large share of oil demand but not ALL THE DEMAND!
CHAPTER 2 : LOOKING FORWARD

53
CONCLUSION
This year, crude fundamental is considering less tight than 2017 as surging shale
production will cap an extreme price hike.
For the upside, the “Declare of Corporation” between OPEC & Non-OPEC (Russia)
producers and robust demand resulting from improved global economies will prevent a
price collapse as experienced earlier.
In addition, unexpected “Supply Disruption” from geopolitical risks and emergency
shutdown of producing fields/ refineries remain an upside risk to our price forecast.
While short term bearish impact can be attributed to the increasing production of U.S.
shale oil, in medium to long term, Electric Vehicles penetration will be a factor to watch
for future oil demand disruption.

Q&A