global meat complex: the china series the need for feed · global meat complex: the china series...
TRANSCRIPT

By: Shefali SharmaInstitute for Agriculture and Trade PolicyFebruary 2014
Global Meat Complex: The China Series
The Need for FeedChina’s Demand for Industrialized Meat and Its Impacts

Global Meat Complex: The China Series The Need for Feed: China’s Demand for Industrialized Meat and Its Impacts
By Shefali Sharma
Published February 2014
The Institute for Agriculture and Trade Policy works locally and globally at the intersection of policy and practice to ensure fair and sustainable food, farm and trade systems.
More at iatp.org

ACK NOW LEDGEMEN TSWhen we embarked on this project to examine China’s role in the Global Industrial Meat Complex, we had intended to produce only one report. Fairly quickly into the research, we realized—given the complexity of China, the scale and scope of production and the rapid rate at which different meat segments in China are evolving—individual sectors such as feed, pork, dairy and poultry merited their own stories. This large endeavor could not have been achieved without the help of numerous people that were involved from the conception, research, drafting, translation and editing phases of the project.
First, we’d like to thank Jim Harkness, IATP’s president for 7 years (2006–2013) as the person who conceived this project as a critical contribution to the debate on the expansion of industrial meat production, its increasing concentration and its implications for social and environmental justice. Our interviews, conducted in May 2013, in China would not have been as rich without Jim’s excellent contacts, his Chinese language skills and his 16 years of experience living and working in China. His editorial input, suggestions and revisions throughout the process have been invaluable.
IATP is also grateful to Mindi Schneider for being the lead author of our report: China’s Pork Miracle? Agribusiness and Development in China’s Pork Industry. We are indebted to her for being generous with her knowledge, in-depth research and analysis on China’s “pork miracle,” the role of government policies and the emergence of Chinese corporations in the meat and feed industries.
Several other people contributed with hours of research and writing that helped shape these reports. We thank Sophia Murphy, Sarah Martin and Sarah Horowitz who contributed heavily in the early stages of the project and whose research contributed to the content of the final reports. Assistance with translations of documents and interviews was adeptly provided by Jiang Tuo and Yuan Miaozhu.
Lastly, but definitely not least in the writing process, Zhang Rou and Chendong Pi spent numerous hours researching, writing and revising various drafts of the dairy and poultry reports, respectively. We are grateful for their hard work and efforts. Ben Lilliston also provided important editorial input throughout the process and IATP’s communications team worked around the clock to deliver a beautiful final product.
In addition, we thank experts like Fred Gale, Mia MacDonald (Brighter Green), Susanne Gura, Kees Kodde (Greenpeace China) and Third World Network who generously shared their research and analysis of China’s meat revolution with us. We also thank the researchers, academics, representatives of the industry and Chinese policymakers who were interviewed anonymously in China as part of this research. Any factual errors are our own responsibility and not of these individuals. We especially thank the Grace Foundation for supporting this project and understanding the importance of researching the global dimensions of the industrial meat complex and why China was a good place to start.
A final caveat: The project has been an enormously enriching process of learning about how China is grappling with its choices to consume and produce more meat and what this means for social and environmental issues within and outside China. It is by no means intended to be a definitive account—an impossible task for a country as complex and vast as China. We hope however, that it will be an important contribution to an evolving debate and process.
–Shefali Sharma

4 INSTITUTE FOR AGRICULTURE AND TRADE POLICY

THE NEED FOR FEED: CHINA’S DEMAND FOR INDUSTRIALIZED MEAT AND ITS IMPACTS 5
TA BLE OF CON TEN TS
The global Industrial meat complex: Understanding China’s meat revolution...................................................... 5
Executive summary ............................................................................................................................................................ 7
Introduction ....................................................................................................................................................................... 10
Background .............................................................................................................................................................................. 10
The “need” that is driving feed ........................................................................................................................................11
I. Grains that feed ............................................................................................................................................................. 12
The soy factor .......................................................................................................................................................... 12Chinese soy crushing capacity and protein meal ........................................................................................ 13History of soy production and trade in China .............................................................................................. 14Transnational presence ..................................................................................................................................... 14
Corn: the next soybean? ....................................................................................................................................... 15China’s feed sector ................................................................................................................................................. 18
Feedmill structure .............................................................................................................................................. 18Conclusion ...............................................................................................................................................................20
II. Diversification as a national security strategy: China “goes out” for Feed ........................................................20
The China-Brazil soy commodity complex ....................................................................................................... 21Transnational control over the Brazil-China feed grain trade ................................................................... 21
Impacts of the China-Latin America soy complex ..........................................................................................23Land use impacts ...............................................................................................................................................23Soy expansion through intensification ..........................................................................................................25Food sovereignty implications .........................................................................................................................25Argentina: the soy boom’s socio-ecological impacts ...............................................................................26
III. The changing agricultural landscape in China ...................................................................................................... 27
Impacts on farmers and cropping patterns .......................................................................................................28Degradation of China’s soils and water ..............................................................................................................29Feed versus meat imports .....................................................................................................................................29
Conclusion .........................................................................................................................................................................30
Endnotes ............................................................................................................................................................................ 31

6 INSTITUTE FOR AGRICULTURE AND TRADE POLICY
THE NEED FOR FEED: CHINA’S DEMAND FOR INDUSTRIALIZED MEAT AND ITS IMPACTS 7
THE GLOBA L INDUSTRI A L ME AT COMPLEX:
UNDERSTA NDING CHINA’S ME AT RE VOLU TION
When the Chinese company Shuanghui International Holdings announced its intention to purchase Smithfield Foods, it got the attention of the U.S. Congress and the media. The idea of a foreign firm owning a giant U.S. pork producer, and an influential player in the U.S. food system, raised a government debate about the links between food security and national security.1 The purchase was just the latest in the growing consolidation in the global indus-trial meat complex—where long supply chains include feed production, genetics and breeding span the globe and blur national identity. Shuanghui’s recent name change to WH Group Limited exemplifies this global branding and reach.2
Aside from operating in the U.S., the global meat industry is increasingly interlinked with emerging economies. China and Brazil are now not only big agricultural producers and consumers, they have spawned a new set of agribusinesses, shaping the global meat complex. Their governments have embraced the factory-style meat production promoted by U.S. agribusiness companies. They are also adopting Western diets, including rising meat consumption.
In 2013, the U.S. was the top global importer of beef, and top exporter of pork; Brazil was the top exporter of beef and poultry. China is the world’s largest producer and consumer of pork, the second largest producer of poultry and the world’s largest soybean (for animal feed) importer. Brazil is increasingly filling the global need for meat, while the U.S. and Brazil compete for China’s soy market. With the purchase of Smithfield, Shuanghui/WH Group becomes the largest pork enterprise in the world. Brazilian based JBS is now the world’s largest meat company. U.S.-based Tyson remains one of the world’s largest poultry companies, competing with JBS’s acquisi-tions in the poultry industry. In short, industrialized meat production, processing and consumption has truly become a global phenomenon with global implications.
U.S.-based corporations, and their model of industrial animal production, have certainly been a major catalyst in the growth of industrial meat production around the world. Over the last 50 years, the rise of industrial meat produc-tion in the U.S. has been nothing short of astounding.
Animal production has shifted from a decentralized family farm system to a more concentrated system with fewer companies producing and large numbers of animals in confined spaces. These operations standardized feed for weight gain, genetic selection and the mechanization of feeding and watering.
Six years ago, a commission sponsored by the Pew Founda-tion examined the industrial meat production in the United States The Pew Commission issued a series of recommen-dations, including the phase out of non-therapeutic use of antibiotics in animal production, stronger regulations to manage waste, the shift away from intensive confinement toward more humane treatment, vigorous enforcement of antitrust laws and increased funding for public research on alternative approaches for animal production. “Failure to address these issues will only result in a further lack of confidence in the animal agriculture industry, increased environmental damage, worsening public health, dismal animal welfare, and a grave outlook for rural communi-ties,” concluded the commission.3
For the U.S. farm economy, the industrial meat system has pushed out nearly all independent poultry and pork producers, while independent beef producers continue to hang on against all odds. Over 13 years ago, IATP docu-mented the transformation of U.S. hog production in The Price We Pay for Corporate Hogs. In a period of 30 years (1950–1980), the number of U.S. hog farms declined by nearly 80 percent, while the average farm size increased six-fold. By 1999, 50 percent or more of the farmers were under some sort of contractual arrangement and four companies (including Smithfield) controlled 20 percent of the production. In the last decade, this process has only further intensified. By 2007, four companies controlled 66 percent of the production—at a great cost to U.S. farmers, consumers, the environment and public health. Further, working conditions at industrial meat processing facilities are considered some of the most dangerous in the U.S.4
In response to the numerous problems associated with industrial meat production in the U.S., rural communi-ties, farm groups, environmental and public health orga-nizations around the country have opposed the industrial meat system on a number of different fronts, in many cases winning important battles. But while U.S. meat consumption per capita has declined over the last four years,5 U.S. meat production continues to rise, linked to increasing U.S. meat exports. There are clear lessons to be learned from the U.S. experience.

8 INSTITUTE FOR AGRICULTURE AND TRADE POLICY
Like most agricultural commodities, the meat industry is not local, regional or national—it is global. And the multi-national companies that dominate this industry, from production to feed to processing and distribution, are set on exporting this industrial model of production around the globe. The industry is aided by trade agreements that threaten to lower worker safety, health and environmental standards while further empowering the legal standing of corporations to challenge national regulations.
It is becoming increasingly clear that addressing the economic, environmental and health downsides of the global industrial meat system will have to include an international dimension. Certainly, the health threats associated with industrial meat production—avian influ-enza, Mad Cow disease, H1N1 (swine flu), antibiotic-resistant bacteria, melamine poisoning—do not recognize national boundaries.
Will countries such as China, Brazil and India continue down the same path of the U.S. on industrializing their meat production? Or, is a different path possible?
In this first phase of our research on the global industrial meat complex, we examine the role of China. We look in depth at four sectors within China associated with animal production: feed, pork, dairy and poultry. It is an endeavor to understand and share how China’s transformation towards a U.S. agribusiness model is both a common story of industrial meat production anywhere but is also specific to China. Further, it is an attempt to show how China’s story, like the U.S.’s, is a global one, with global links and global impacts.
Understanding how Chinese companies are “going out” to develop their supply chains and how major U.S. and other international livestock and dairy companies are “going in” to China better prepares us to address the global nature of this industrial complex and its impacts—domestic and global. It can help us to get beyond big headlines in the paper about China’s growing meat consumption and dig deeper into how and why it is taking place and imagine a different pathway towards fairness, nutrition, public health, environmental protection in food production—lessons that are readily available from the U.S. experience.
The global trend points to ever greater consolidation of fewer and more powerful corporations controlling scarcer water and land resources to feed millions of animals in confined spaces to produce more cheap meat. How citizens and governments deal with the externalities of this sector
and its endemic global ramifications merit careful thought. China—as the largest producer of pork, the second largest producer of poultry, the largest feed importer in the world and the fourth largest dairy producer—is a critical piece of this global puzzle.
Endnotes1. IATP, Food and national security: The Shuanhui-Smithfield merger
revisited, September 12, 2013, http://www.iatp.org/blog/201309/food-and-national-security-the-shuanghui-smithfield-merger-revisited.
2. Wattagnet, 2014. Shuanghui International changes name to WH Group: New corporate name manifests company’s emerging global reach and aspirations as a world-leading brand, http://www.wattagnet.com/166126.html (accessed January 24, 2014).
3. Pew Commission on Industrial Farm Animal Production, http://www.ncifap.org.
4. Human Rights Watch “Abuses Against Workers Taint U.S. Meat and Poultry,” January 25, 2005, http://www.hrw.org/news/2005/01/24/
abuses-against-workers-taint-us-meat-and-poultry.
5. Elaine Watson, “Is the decline in US meat consumption terminal?”, April 12, 2013, FoodNavigator-USA, http://www.foodnavigator-usa.com/Markets/Is-the-decline-in-US-meat-consumption-terminal.

THE NEED FOR FEED: CHINA’S DEMAND FOR INDUSTRIALIZED MEAT AND ITS IMPACTS 9
EX ECU TI V E SUMM A RYChina’s need for feed and the globalized supply chain of the industrial livestock industry is contributing to land use change in China and abroad. It is transforming the government’s approach to grain self-sufficiency, land-based investments abroad and its policies on trade in meat versus feed. The Shuanghui (now called the WH Group) acquisition of Smithfield is an example of one clear way in which global meat companies are responding to and seeking to profit from China’s exploding demand. This paper presents an overview of China’s feed “needs” and its feed sector. It also examines the critical linkage between China and the Americas in procurement of feed and high-lights the impacts that a growing Chinese demand for meat (and hence feed) are having in Latin America and increasingly in other parts of the world. How Chinese policy makers address industrial livestock production and situate meat in their definition of food security has and will continue to have a critical impact on global land use, global agricultural trade, rural livelihoods and food secu-rity issues.
Only 12 percent of total cereals produced are globally traded, of which a large proportion is feed—particularly corn, oilseeds and soybean meal. The FAO projects that per capita global meat consumption will reach 52 kg by 2050 for over 9 billion people. That’s 480 million tons of meat compared to 293 million tons in 2010. Today, China produces and consumes half of the world’s pork, produces nearly 20 percent of the world’s poultry, 10 percent of the world’s beef and is the fourth largest milk producer of the world.
Water, land and labor shortages make grain production expensive in China relative to the global market. Twelve percent of China’s land is arable. And rapid urbanization has created a massive exodus of rural labor into cities with agriculture now employing 37 percent of the popula-tion. These factors create real limits on China’s ability to expand meat production and raise critical questions about the ecological and social tradeoffs involved given that urban Chinese are now consuming much more meat than their rural counterparts.
With increasing food and feed imports, the government and Chinese experts are revisiting their definition of grain self-sufficiency in wheat, rice and corn. Such debates have thus far largely focused on whether China should import
meat or feed from a national security point of view, rather than question China’s meat demand and health problems associated with overconsumption.
China liberalized soy for feed production in the 90s. China’s soy imports increased by 253 percent from 03-04 from nearly 17 million tons to nearly 60 million tons (mt) by 2011-2012. The next largest buyer of soy, the EU 27, bought a little less than 12 mt. Brazil and the U.S. alone accounted for 84 percent of total soy exports to China in 2011-2012. While foreign transnationals controlled more than 70 percent of the soy crushing market in the mid-2000s, new laws enacted in 2007 have scaled back foreign control. Foreign TNCs including Wilmar (working with ADM), Cargill, Bunge, Noble and Louis Dreyfus today control less than 40 percent of the soy crushing market in China.
In 2011, China used approximately 70 percent of its total corn production for feed, 20 percent for industrial use and only 5 percent for food. The total global trade in corn is much less than China’s entire corn feed demand. Further consolidation and “modernization” of Chinese livestock farms is only increasing the demand for corn (and other grains such as wheat). Though China has seen phenom-enal growth in domestic corn production in the last ten years, corn imports have risen sharply in recent years. The U.S. Grains Council predicts that China will incur a deficit of 19-32 million tons of corn by 2022. Thirty-two million is nearly a third of the entire world trade in corn today. This has huge implications for the world price of corn. China has also begun importing dried distillers grains (DDGs), primarily from the U.S. and grains such as barley, wheat and sorghum for feed from several countries. Unlike soy, however, where TNCs are deeply embedded, Chinese domestic agribusiness firms like the New Hope Group are poised to become the key corn traders.
Eight Chinese companies are listed in the top 20 feed companies worldwide (by volume). Already in 2010, 16 companies were producing 33 percent of total feed in China--each with an individual output greater than one million tons annually. The high return on investment combined with thin margins incentivizes these compa-nies to vertically integrate into other parts of the livestock supply chain for greater profit margins.
In 2008, China’s state planning agency issued a direc-tive that sought direct investment in Brazil and other countries. The “going out” was part of a broader national security strategy to diversify sources of imports from

10 INSTITUTE FOR AGRICULTURE AND TRADE POLICY
different countries for food generally, but particularly for feed and meat. Chinese private companies are indeed “going out” to source feed and fodder in Africa, Southeast Asia and Eastern Europe. Though, Latin America still remains one of the primary regions of interest and invest-ment—particularly for soy. Chinese state-owned and private companies are investing directly in Brazil’s soy supply chain, competing with the oligopolistic might of foreign transnational corporations through direct access to soy and by mimicking their methods of vertical and horizontal integration of the commodity chain including through contracts and storage.
Producing “cheap” feed grains has come at a great ecolog-ical and social cost in Latin America. Twenty-seven million hectares of Brazilian land are being used to culti-vate soy (large tracts of it forest, previously). Efforts to reduce deforestation rates in the Amazon have resulted in the intensification of soy production, 75 percent of which is GM--further increasing pesticide and herbicide use, flowing into major tributaries of the Amazon. As in Brazil, the soy boom in Argentina has also led to land use change and land and environmental conflicts (almost all Argen-tine whole soy exports go to China) associated with wide-spread use of GM crops, herbicides and toxic chemicals.
In April 2012, China authorized GM corn imports from Argentina, creating competition for U.S. GM corn. In June, China also approved three varieties of GM soy, all grown in Brazil, for processing.
Sky-rocketing meat production has already changed the grain production landscape in China as well. Many soy farmers have switched to planting corn as they have not been able to compete with much cheaper U.S. and Brazilian soy. The government has invested in the intensification of corn--largely for feed needs, but also for manufacturing. The intensification has brought about monoculture plan-tations, rapidly declining biodiversity and like Argen-tina, increased use of strong agro-chemicals and hybrid seeds. From 1998-2003, a massive shift occurred from the traditional grain producing areas of central, south and east regions to the north and northeast. High yields have resulted in high degrees of environmental stress including high levels of soil salinity and acute water shortages. In addition, the shift northward to fragile ecosystems that are even more water-scarce may actually add to chal-lenges. Grain is therefore ironically migrating to areas that are even more susceptible to environmental degradation.
China’s agriculture policy makers face a number of chal-lenges: There is a growing demand for meat aided by the government’s prioritization for abundant and cheap meat (see IATP’s China’s Pork Miracle? Agribusiness and Develop-ment in China’s Pork Industry for a detailed analysis) and grain self-sufficiency; while the government tries to raise rural living standards even as rural labor migrates to cities and agriculture faces ever more degraded and scarce land and water resources. Which issues should take priority, and how can competing goals be balanced? Increasingly intransigent environmental, health and food safety problems associated with the livestock industry are beginning to make some Chinese experts, government authorities and consumers question the current approach to meat production and consumption. The debate has thus far largely centered on whether to import feed or meat. (Though some are also beginning to raise critical ques-tions about China’s seemingly unquenchable appetite for meat, its massive industrialization and whether, in fact, China has reached “peak meat.”)
Proponents of meat imports believe that livestock imports will alleviate China’s livestock-related environmental, health and food safety problems--thereby externalizing its worse effects. While other Chinese experts believe quite the opposite. They, along with other foreign experts, believe that if China started depending on the world market for meat imports—it would be hard-pressed to find the supply and thus encourage feed imports to support the large investments that have established the Chinese meat industry. On the other hand, state-led support for large scale meat production over the last two decades has created a powerful and increasingly globalized domestic constituency of companies vested in the supply chain (meat processing, feed, vaccines) and financiers—creating strong incentives to import both “cheap” meat and feed and/or exporting them--depending on the bottom line and agreements between them and other global entities along the supply chain.
While the FAO, the OECD and other investment banks take the appetite for industrial meat for granted—much of it projected to come from China and India--they fail to address the natural resource intensive, climatic, social and public health impacts of this unquestioned appetite in OECD countries (which still far exceed all healthy norms of meat consumption) and in developing countries. This paper shows the evolution of China’s feed-related supply chain and the policies that have helped shape it. It demon-strates the increasingly global and domestic impacts of

THE NEED FOR FEED: CHINA’S DEMAND FOR INDUSTRIALIZED MEAT AND ITS IMPACTS 11
this evolution and the domestic challenges this forces on China: How much more meat production and consump-tion? By and for Whom? What production model? The paper has tried to provide a picture of the ecological and social challenges that Chinese and policy makers in exporting countries must confront in order to assess the future direction and model of industrial meat production, distribution and consumption. It is hoped that the findings and analysis in this report help catalyze a more holistic debate about these deliberate policy choices.

12 INSTITUTE FOR AGRICULTURE AND TRADE POLICY

THE NEED FOR FEED: CHINA’S DEMAND FOR INDUSTRIALIZED MEAT AND ITS IMPACTS 13
IN TRODUCTIONIn 2009, the FAO forecasted the need to increase global food production by 70 percent in order to feed 9 billion people by 2050. This assumption that all can be fed by growing more food has been rigorously challenged by various food and agriculture experts.1 Land, water and energy constraints in an era of climate change compel us to examine what we eat and how we produce, distribute and consume food. Globalized, large-scale industrial meat production and unsustainable levels of meat consump-tion drive massive conversion of land to cereal and oilseed production explicitly for animal feed. Feed for industrial meat therefore forms a critical part of the equation of how much and what to feed the world by 2050 and who makes these decisions.
The industrial livestock chain is driven by “cycling great volumes of industrial grains and oilseeds through soaring populations of concentrated animals”2—a model perfected in North America. However, China—projected as the country with the largest meat demand and increasingly industrialized production—is essential to this global system. China’s need for feed and the globalized supply chain of the industrial livestock industry is contributing to land use–change in China and abroad. It is transforming the government’s approach to grain self-sufficiency, land-based investments abroad and its policies on trade in meat versus feed. The recent Shuanghui acquisition of Smith-field is an example of one clear way in which global meat companies are responding to and seeking to profit from China’s exploding demand.
This paper presents a historic and evolving overview of China’s feed “needs” and structure of its feed sector. It also examines the critical linkage between China and the Americas in procurement of feed and highlights the impacts that a growing Chinese demand for meat (and hence feed) are having in Latin America and increasingly in other parts of the world. How Chinese policymakers address industrial livestock production and situate meat in their definition of food security has and will continue to have a critical impact on global land use, global agricul-tural trade and rural livelihoods. This report is an attempt to contribute to that assessment and policy debate.
B ACKGROUND World Cereal Production in 2013-14 is expected to reach a record 2.46 billion tons.3 Remarkably, 34 percent of that (833 million tons) will be used for animal feed, a rise of nearly 5 percent compared to the previous year (see Figure 1).4 Only 12 percent of total cereals produced are globally traded,5 of which a large proportion is feed—particularly corn, oilseeds and soybean meal. More than half of the world’s corn and nearly 20 percent of its wheat production will go towards feed in 2013-14.6 Eighty-five percent of the world’s soy crop was already being used for meat produc-tion in 2007-08.7
Figure 1: World cereal market at a glance
2011/12 2012/13 ESTIMATE
2013/14 FORECAST
CHANGE: 2013/14 OVER
2012/13
MILLION TONNES %
WORLD BALANCE
Production 2,354.2 2,309.8 2,460.5 6.5%
Trade 317.2 306.1 306.2 0.0%
Total utilization
2,328.3 2,33.2 2,402.0 2.9%
Food 1,066.4 1,082.7 1,097.9 1.4%
Feed 794.1 795.5 833.0 4.7%
Other uses 467.7 455.0 471.1 3.5%
Ending stocks
521.5 510.9 568.8 11.3%
Oligopolies in global grain trade, meat processing and retail have enabled a globalized industry to deliver “cheap” meat products. The meat companies and the grain traders allied with them have tremendous power to control prices and shape government regulations in meat and feed producing countries such as the United States, Brazil and Argentina. Cheap feed has historically contributed to high profit margins for the livestock industry while catalyzing the conversion of large tracts of diverse forest and agro-ecosystems into feed monocultures. This industrial model has also forced farmers and workers in industrial animal -feeding operations toward the bottom of an exploit-ative industrial supply chain. This power has thus far also allowed the industrial meat-feed complex to eschew accounting for land and water pollution, greenhouse gas emissions and public health and food safety impacts, leaving it to governments and their dwindling coffers to deal with the mess created by factory farms.

14 INSTITUTE FOR AGRICULTURE AND TRADE POLICY
Since the turn of this century, several factors have converged to create higher and more volatile prices for feed (and food) grains: competition between cereal use for biofuels, feed and food; climate-related supply shocks; and excessive commodity speculation. China’s demand for feed and currency fluctuations have also shifted the U.S.’s dominant role as top corn and soy exporter, as Brazil and Argentina have rapidly expanded their soy production and soy-based exports. Brazil has become a major competitor to the U.S. for soy and corn exports and Argentina, a leader in soybean meal exports.
THE “NEED” TH AT IS DRI V ING FEED
The FAO projects that per capita global meat consumption will be 52 kg by 2050 for over 9 billion people.8 That’s 480 million tons of meat compared to 293 million tons in 2010.9 Most of this demand is expected to come from developing countries with China and India in the lead. However, OECD countries continue to consume far more meat than the rest of the planet. In 2009, the U.S. consumed 120 kg of meat per person, Australia and New Zealand (118 kg), Argentina (113 kg), Canada and Western Europe (102 kg) and (85 kg).10 This compares to China’s per capita of 59 kg.11 According to Rabobank International, global meat demand is projected to grow by 44 percent from 2010 to 2030, with poultry growing by 60 percent, pork by 43 percent and beef and sheep by 25 percent and 35 percent, respectively.12 The per capita figure, however, hides the growing disparity between diets of the richer and poor and the urban and rural in developing countries who compete for the land used for feed and the grains that are fed to animals for slaughter.
China produces and consumes half of the world’s pork, nearly 20 percent of the world’s poultry, 10 percent of the world’s beef and is the fourth largest milk producer of the world (see Figure 2 and China’s Dairy Dilemma: The Evolution and Future Trends of China’s Dairy Industry in this series).13 China’s meat production and consumption continues to rise. According to China’s National Statistics Bureau, overall meat production reached 82.2 million tons in 2012, 28.6 million tons of egg production and 37.4 million tons of dairy—an increase of 5.4 percent, 1.8 percent and 2.3 percent respectively from the previous year.14
Figure 2: Chinese domestic consumption of commodities and foods as a percent of world total
Share of world consumption (%)
Source: USDA, Morgan Stanley Commodity Research.
1975/1976
1979/1980
1983/1984
1987/1988
1991/1992
1995/1996
1999/2000
2003/2004
2007/2008
2011/2012e
Sugar
Beef
Chicken
Wheat
Soybeans
Rice
Co�on
Pork
60
50
40
30
10
0
20
Between 2001 and 2012, China’s import dependence doubled from 6.2 percent to 12.9 percent with a net deficit in agriculture and food totaling $31 billion USD in 2012.15 China’s targets for meat production growth are likely to add to that trend in the coming decade due to feed imports.
Water (see Figure 3), land and labor shortages are making grain production expensive in China relative to the global market. According to the World Bank’s global database on agriculture and rural development, 12 percent of China’s land is arable (compared to India’s nearly 53 percent).16 This calculates to .08 hectares per person. Moreover, rapid urbanization has created a massive exodus of rural labor into cities reducing the number of people employed by agriculture to 37 percent and increasing rural labor costs.17 All these factors create real limits on China’s ability to expand meat production and raise critical questions about the ecological and social tradeoffs involved.

THE NEED FOR FEED: CHINA’S DEMAND FOR INDUSTRIALIZED MEAT AND ITS IMPACTS 15
Figure 3: Available water supplies
meter cubed per person per year
Reproduced from TNC 2010, pg. 15.
0
5,000
10,000
15,000
20,000
25,000
30,000
BrazilU.S.WorldAverage
China
Box 1: Just how much does China consume?There are no definitive figures for China’s demand for meat. Chinese national statistics are seen largely as “indicative.” According to a U.S. grain industry associa-tion representative based in Beijing, China over-reports its meat production data (particularly of pork) and meat consumption data is under-reported given that household surveys only address consumption at home.18 An addi-tional 20 to 30 percent of meat consumption might be added to consumption calculations if eating out in cities is included. The resulting implications from the U.S. grain industry’s perspective: China will need to import more feed grains to meet growing demand that is currently underestimated.
The Chinese government’s goal of cheap and abundant meat for its population is forcing difficult choices regarding food sovereignty as well. The government has held a food
security policy of being 95 percent self-sufficient*1in food grains such as wheat, rice and corn. With increasing food and feed imports, the government and Chinese experts are revisiting the definition of self-sufficiency—which some say is now closer to 90 percent anyway.19 Such debates have thus far largely focused on whether China should import meat or feed from a national security point of view, rather than question China’s meat demand, rising urban obesity and health problems associated with overconsumption. At the same time, urban-rural disparity in consumption of meat and food in general is wide. According to one report, consumption of some food items in the highest income rural group was lower than that of the lowest income urban group.20
Given the drastic disparities between urban and rural intake and the singular focus on meat production, is the challenge in the coming decades re-distribution and nutritional balance, or simply more meat? China’s “need for feed” provides a window into these sets of challenges associated with China’s livestock sector and what it will take to reach “peak meat.” Part I of this report describes the evolution of China’s feed grain sector and the feed industry; Part II addresses impacts of China’s feed import decisions on other parts of the world and Part III concludes with the impacts within China, implications for feed versus meat imports and important choices the govern-ment must confront in the coming decade. It is hoped that the analysis sheds light on critical issues policymakers need to assess in evaluating the future direction of China’s industrial meat production and consumption.
I . GR A INS TH AT FEED
The soy factorWe must be in charge of maintaining a balance of
corn supply and demand; and resolutely prevent
Chinese corn from becoming the “second soybean.”
–Agriculture Minister Han Changfu, printed in People’s
Daily, May 26, 2012 (p. 6), translated by USDA FAS.21
Soy was the first crop to challenge China’s major geo-political objective of food self-sufficiency. Soy imports, almost exclusively for feed and edible oil, have grown
*Government definition of “self-sufficiency”in food grains is: 国内产量占国内
产量与净进口量之和的比率, meaning: domestic production/(domestic produc-tion + net import). Source: http://www.qstheory.cn/jj/jsshzyxnc/201204/t20120427_154479.htm

16 INSTITUTE FOR AGRICULTURE AND TRADE POLICY
steadily since the mid-90s, timed with China’s decade-long accession negotiations to the WTO.22 By 1996, China had switched from being an exporter to a net importer; and by 2005, the country was importing half of the world’s soybeans.23 Imports increased by 253 percent from 2003 to 2004 from nearly 17 million tons*2to nearly 60 million tons (mt) by 2011-12.24 By comparison, the next largest buyer of soy, the EU 27, bought a little less than 12 mt.25 The USDA projects a further increase of soy imports to China to 69 mts in 2013-14.26
Brazil, U.S. and Argentina account for 90 percent of the world’s soy exports with Paraguay as the fourth largest producer. Brazil and the U.S. alone accounted for 84 percent of total soy exports to China in 2011-12 (see Figure 4). Argentina has maintained a steady 13 to 14 percent of the export supply to China.
Certain domestic concerns will affect both imports and exports. For instance, the extent of soy import dependence is a concern to Chinese officials. Climate change–related supply shocks and currency fluctuations are keeping Brazil and the U.S. competing for the top spot for exports to China. The drought in the U.S. and subsequent rising soy prices on the global market in 2011-12 highlighted China’s vulnerability to import dependence and this vulnerability is playing a major factor in China’s evolving sourcing strategy that seeks greater control over the supply chain, as Part II describes. At the same time, exporters to China are also impacted by sudden shifts in demand brought on by food safety scares. The recent avian flu epidemic in China’s poultry industry reduced soy demand by nearly 4 mt in the first half of 2013 because poultry consumption (and hence production) decreased dramatically.27
Figure 4: China’s soybean imports by country of origin from MY10/11 to MY12/13
COUNTRY
MY10/11 MY11/12 MY12/13
MILLION TONS SHARE MILLION
TONS SHARE MILLION TONS SHARE
United States 24.98 48% 23.06 39% 9.52 68%
Brazil 18.3 35% 26.45 45% 1.6 11%
Argentina 7.4 14% 7.86 13% 1.68 12%
Others 1.6 3% 1.86 3% 1.27 9%
Total 52.3 100% 59.23 100% 14.08 100%
Source: World Trade Atlas; *MY12/13 data up to December 2012
*This paper uses “million tons” (mt) to denote “million metric tons” (mmt), as the data used from the United States Department of Agriculture (USDA) Foreign Agri-culture Service (FAS) switches from mmt to million tons (mt) in various sources. We assume that all their data was calculated in metric tons.
Chinese soy crushing capacity and protein meal
China’s massive investment over time in value addition of soy for feed and edible oil has resulted in overcapacity of soy crushing facilities. According to the government agency China National Grains and Oil Information Center (CNGOIC), China had the crushing capacity to process 125 million tons of soybean a year (China’s total oilseed consumption) in 2012, but plants were on average running at half the capacity.28 Most are located in the coastal regions, given the import-dependency of the sector.
Crushing has undergone restructuring in recent years because of government incentives to consolidate the sector—a policy the government has tried to replicate in all parts of the livestock value chain. The government believes these large plants have lower per-unit costs, more control of raw materials sourcing and better ability to withstand price fluctuations. This is forcing small and medium-sized players out of the market. The industry overall is still expanding, however, and industry experts are hopeful of high import volumes to feed into this still expanding crush capacity.29 Soybean consumption is expected to grow a further 43.8 percent between 2012 and 2017.30
Industry optimism seems to match feed production growth rates which are surpassing government targets. Many more farms are using industrialized feed (see feed section below). As a result, production of protein meal–one of the key components of animal feed–is forecast to reach 70.66 million tons and consumption 70.3 million tons in marketing year (MY) 13-14.31 Soybean meal (SBM) accounts for 75 percent of this, followed by rapeseed at 14 percent, cottonseed at 6 percent and a small proportion of
fishmeal.32 An additional 2.2 million tons of rapeseed meal and fishmeal are imported. The demand for SBM in particular is projected to grow by 3 percent in 2013-14 to a total of 52.7 million tons, the bulk of which is crushed and processed in China.33
USDA conservatively estimates an 18 percent “inclusion rate” of SBM (the proportion of soybean meal included in industrial feed for animals) in pork and poultry production in China. Based on that, China’s increased pork produc-
tion is expected to add another 1.6 million tons of SBM, and broiler feed another 1.8 million tons.34 This could be an
THE NEED FOR FEED: CHINA’S DEMAND FOR INDUSTRIALIZED MEAT AND ITS IMPACTS 17
underestimation of SBM needs as industry sites typically think that industrial pig feed has an inclusion rate of 20 to30 percent and chickens 25 to 40 percent, (proportions of SBM vary for pigs and chickens depending on whether they are piglets or chicks, sows or layer hens etc.). It is likely that many Chinese specialized farms do not adhere to these industry norms; however, as China continues to consolidate, standardize and scale-up its industry, this will change.
History of soy production and trade in China
Soybeans were first planted in China thousands of years ago. Farmers have developed over 6000 varieties with rich knowledge about their numerous uses.35 Soybeans were not traditionally used for animal feed. Instead, livestock grazed or ate household waste, as well as hay and corn. In the 1990s, the Chinese government made a deliberate deci-sion to liberalize soy imports as part of its plan to massively scale up and industrialize livestock production (see IATP and Schneider, 2011). China began importing SBM rather than soybeans in the mid-90s, but quickly realized that this was destroying their soy industry and reverted to importing soybeans. China’s accession to the WTO in 2001 and bilateral trade deals with the U.S. and Brazil also created incentives to lower tariffs on both soybeans and SBM to varying degrees.36 China began to make a clear distinction between protecting food security crops such as rice, wheat and corn and liberalizing soy to support the livestock industry.37 It even allowed for the import of genetically modified soy for the first time, despite restric-tions on GMOs for direct human consumption.
Transnational presence
Three companies—Bunge, Cargill and ADM (sometimes referred to as ABCDs with the addition of Louis-Dreyfus)—have traditionally dominated markets in each of the major soybean exporting countries. In the United States, these three, along with the firm Ag Processing Inc., process 85 percent of the crop.38 However, Singapore and Hong Kong-based “NOW” group of companies Noble, Olam and Wilmar are becoming major global contenders—Wilmar especially for oil refining. These seven companies control global grain trade today. ADM also owns 16 percent of Wilmar International and the two firms collaborate closely in their operations.39
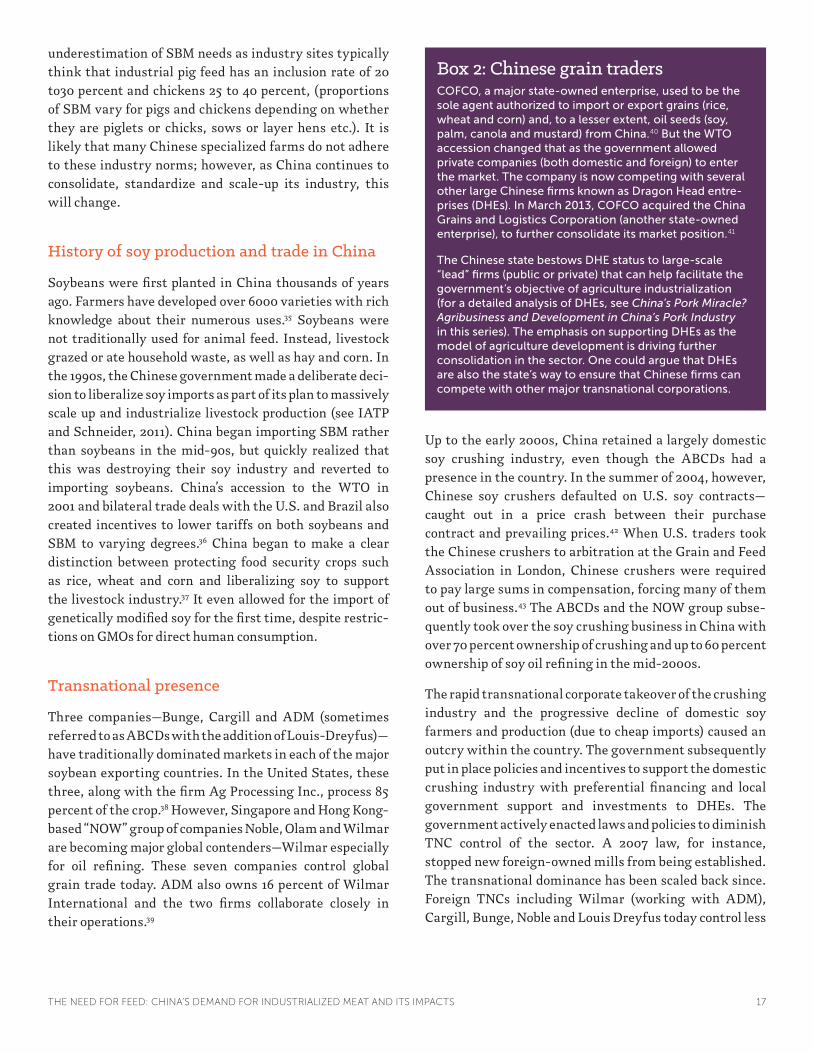
Box 2: Chinese grain tradersCOFCO, a major state-owned enterprise, used to be the sole agent authorized to import or export grains (rice, wheat and corn) and, to a lesser extent, oil seeds (soy, palm, canola and mustard) from China.40 But the WTO accession changed that as the government allowed private companies (both domestic and foreign) to enter the market. The company is now competing with several other large Chinese firms known as Dragon Head entre-prises (DHEs). In March 2013, COFCO acquired the China Grains and Logistics Corporation (another state-owned enterprise), to further consolidate its market position.41
The Chinese state bestows DHE status to large-scale “lead” firms (public or private) that can help facilitate the government’s objective of agriculture industrialization (for a detailed analysis of DHEs, see China’s Pork Miracle? Agribusiness and Development in China’s Pork Industry in this series). The emphasis on supporting DHEs as the model of agriculture development is driving further consolidation in the sector. One could argue that DHEs are also the state’s way to ensure that Chinese firms can compete with other major transnational corporations.
Up to the early 2000s, China retained a largely domestic soy crushing industry, even though the ABCDs had a presence in the country. In the summer of 2004, however, Chinese soy crushers defaulted on U.S. soy contracts—caught out in a price crash between their purchase contract and prevailing prices.42 When U.S. traders took the Chinese crushers to arbitration at the Grain and Feed Association in London, Chinese crushers were required to pay large sums in compensation, forcing many of them out of business.43 The ABCDs and the NOW group subse-quently took over the soy crushing business in China with over 70 percent ownership of crushing and up to 60 percent ownership of soy oil refining in the mid-2000s.
The rapid transnational corporate takeover of the crushing industry and the progressive decline of domestic soy farmers and production (due to cheap imports) caused an outcry within the country. The government subsequently put in place policies and incentives to support the domestic crushing industry with preferential financing and local government support and investments to DHEs. The government actively enacted laws and policies to diminish TNC control of the sector. A 2007 law, for instance, stopped new foreign-owned mills from being established. The transnational dominance has been scaled back since. Foreign TNCs including Wilmar (working with ADM), Cargill, Bunge, Noble and Louis Dreyfus today control less

18 INSTITUTE FOR AGRICULTURE AND TRADE POLICY
than 40 percent of the soy crushing market in China (see Figure 5). They work in collaboration with Chinese firms, both state- and privately owned.
Figure 5: Market shares as percentage of China’s soy crushing sector (installed capacity) (2010)44
Wilmar International 20China Agri-Industries (COFCO)12 Heilongjiang Jiusan Oil and Fat Co. Ltd
9
Chinatex (state owned) 9Cargill 7Noble 5 Bunge 4Hopefull Grain and Oil Group Co. Ltd 4 Shandong Bohai Industries 3Louis Dreyfus Commodities 2Others 25 Source: Reuters, ‘Company News: Movers and Shakers in China’s soy crushing sector,’ 7 April 2010, at http://mobile.reuters.com/article/companyNews/idUSSGE63502O20100407.
Corn: the next soybean?An important task to ensure national grain security
includes increasing corn potential productivity,
speeding up the development in corn, and
maintaining basic self-sufficiency in corn.
–Minister of Agriculture, Han Changfu (May 26, 2012)45
In the case of soy, China chose to rely on international markets as the best way to meet rapidly growing demand. So far, corn has been another story. The government continues to maintain a target of 95 percent domestic production to meet corn demand, but imports have jumped in recent years. A continuation of this trend will mean that China chooses to increase livestock production at home instead of importing meat.
A return to self-sufficiency will require continued growth in domestic crop productivity or a major shift in its feed mix. China’s decisions either way will have global implica-tions, because small percentages of Chinese feed or meat imports translate to large exports from other countries. Given the rapidly increasing global power of China’s feed companies (see Box 4), and the government’s desire to further scale-up industrialized meat production at home, corn may indeed become the “second soybean.” This is because the average pig raised in a Chinese factory farm eats around 350 kg of grain to grow to slaughter, while a pig
raised on a Chinese family farm eats only 150 kg because it also consumes household waste and other non-grain, local feed sources.46
Industrial feed typically has three components: energy (grains such as corn, barley, wheat etc), protein (SBM, fishmeal etc) and pre-mix (micro-nutrients and additives such as antibiotics).47 A mix usually has three-parts grain and one-part protein meal (including pre-mix)48 hence the tremendous need for energy grains like corn, wheat or rice bran.49 In 2012, China used nearly 52 percent corn, 22 percent “other energy sources” such as wheat, rice bran etc., and nearly 26 percent protein meal for its total feed mix, according to U.S. Grains Council data.
Figure 6: China’s Feed production and composition: 1993–2012 (mmt)
Source: U.S. Grains Council
Percent corn in 2003 is 55.9%
Percent corn in 2012 is 51.9%
50
100
150
200
250
300
01993 201120092007200520032001199919971995
Other meal
Soybean meal
Other energy
Wheat
Corn
Percent corn in 1993 is 56.3%
In 2011, Morgan Stanley estimated that China used 70 percent of its total corn production for feed, 20 percent for industrial use and only 5 percent for food.50 For marketing year 2013-14, China is forecasted to produce 211 million tons of corn.51 In comparison, the total global trade in corn this year is likely to be 97.5 million tons—much less than China’s entire corn feed demand of a 156 million tons.52
Further consolidation and “modernization” of Chinese livestock farms is only increasing the demand for corn (and other grains such as wheat) “as more farms switch from lower quality feeds and concentrates to compound feeds” considered to be of higher quality grain.53 Figures 6, 7 and 8 show the growth of feed production in general and the growth rate of compound feed. The growth rate of

THE NEED FOR FEED: CHINA’S DEMAND FOR INDUSTRIALIZED MEAT AND ITS IMPACTS 19
industrial compound feed at 11-12 percent a year in the last two years has been several order of magnitudes greater than meat production.54
Agriculture Minister Han Changfu described the consumption of corn-derived feed as having risen by 33 percent between 2003 and 2010, while production in meats increased by 23 percent, eggs (18.5%), milk (10.5%) and aquatic products (31.8%).55
Figure 7: China: Feed production by type(1,000 TONS) TOTAL COMPOUND CONCENTRATE PREMIX
2009 148,132 115,350 26,863 5,925
2010 162,000 129,742 26,480 5,793
2011 180,626 149,150 25,425 6,051
2012 202,000 171,700 24,000 6,300
% Growth 2011
11.50% 14.96% -3.98% 4.45%
% Growth 2012
12% 15.12% -5.60% 4.12%
USDA FAS, Report Number: 13015 (Beijing, March 29, 2013).
Figure 8: Production of industrialized feed and animal products
Reproduced from U.S. Department of Agriculture (USDA) Foreign Agriculture Service (FAS), GAIN Report: China PRC Oilseeds and Products Annual Report, Report # 13005 (Washington D.C, March 1, 2013).
2006 2007 2008 2009 2010 201120
40
60
80
100
120
140
160
180
200
million tons
2012
MilkTotal cultured aquatic products
Eggs
All meat
Industry feed production
The minister’s solution to staying self-sufficient in corn is further intensification: high-density planting, mono-culture, mechanization and technological breakthroughs. This resembles a U.S. “corn belt” type scenario of mono-cultures. Though China has resisted GM corn to date, it is becoming an appealing prospect as demand increases compared to domestic supply and as domestic prices become increasingly higher than international prices. According to one expert, China is likely to commercialize a domestic BT corn in the next 4 or 5 years because Chinese experts believe that it will increase yields by as much 20 mt.56 There is little evidence, however, that genetic modi-fication has led to such increases.57
By 2011, corn accounted for a third of China’s total grain output on 500 million mu (33.3 million hectares of land).58
The country increased its production by 55 percent in just seven years (2004–2011).59 According to U.S. Grains Council estimates, China’s corn demand will grow faster than overall feed demand in the coming ten years (See Figure 9). They estimate annual feed demand to have grown by 4.5 percent annually from 2002 to 2012 and that is expected to slow down to four percent from 2012 to 2017 and further decrease to 3.5 percent from 2017 to 2022. Corn demand, on the other hand, is expected to grow by 5.5 percent annually from 2012 to 2017 and 4.6 percent from 2017 to 2022.
Figure 9: China’s feed demand growth and composition, past and projected
Total meal 8.1% 6.8% 8.5% 4.0% 3.5%
Soybean meal 12.4% 9.0% 10.7% 5.4% 4.4%3.3% 3.3% 2.6%Other meal 0.0% 0.0%
Total energy 2.2% 1.4% 5.8% 4.0% 3.5%Bran and wheat 0.4% 0.0% 6.3% 0.0% 0.0%Corn 3.1% 2.0% 5.6% 5.5% 4.6%
Total feed 3.2% 2.5% 6.5% 4.0% 3.5%2022*2017*2012200720021997
050
100150200250300350400450
CornWheat
BranSoybean meal
Other meal
Source: U.S. Grains Council

20 INSTITUTE FOR AGRICULTURE AND TRADE POLICY
China has seen phenomenal growth in domestic corn production in the last ten years. However, the U.S. Grains Council (with clear and vested export interests of its own) estimates that growth in the next decade will not exceed 3 percent per year. If their projections prove to be accurate, by 2022, China would incur a deficit of anywhere between 19 and 32 million tons of corn which would have to be met through imports. Thirty-two million tons is nearly a third of the entire world trade in corn today. This has huge implications for the world price of corn and food security for import-dependent countries.
China is expected to import an unprecedented 7 million tons this year—just over 7 percent of the world trade in corn. Minister Han expected China’s overall corn demand to reach 220 million metric tons by the end of 2015 (the end of the 12th Five Year Plan). But if the USDA figures are correct, then China has almost reached 220 mt (211 mt domestic production plus 7 mt imports) this year.
The bulk of these corn imports have thus far come from the United States (see Figure 10). However, feed is competing with biofuels and U.S. meat production as a use for corn, making China’s dependence on U.S. corn more precarious. China, therefore, appears to be diversifying its imports and Argentina, Brazil and the Ukraine, among others, will compete for China’s corn market.
According to one Chinese feed expert, “Now the quantity of imported corn from Eastern Europe is about the same with that imported from the U.S. For example, Ukraine and Uzbekistan. The price of the corn from middle Europe is much lower than the price of corn from the U.S.”60
Figure 10: China corn imports by country
Reproduced from MS 2011 China Files
U.S.
20080
200
400
600
800
1,000
1,200
1,400
1,600
China corn imports (thousands metric tons)
2009 2010
Laos Burma Other
Figure 11: China’s corn supply and importsMARKETING YEAR (MY) MY IMPORTS PRODUCTION (MMT)
05/06 0.1 139.4
06/07 0.0 151.6
07/08 0.0 152.3
08/09 0.0 165.9
09/10 1.3 164
10/11 1.0 177.2
11/12 5.2 192.8
12/13 3.0 205.6
13/14 7.0 211
Source: USDA FAS: Grain: Markets and Trade, July 2013
This search for corn is also leading to land deals in other countries (see Part II). China has also begun importing grains such as barley, wheat and sorghum for feed from several countries (see Figure 12). In addition, China has started increasing imports of dried distillers grains (DDGs). DDGs are a major byproduct of corn-based ethanol production and since 30 to 40 percent of U.S. corn in the past decade has shifted towards ethanol production, DDGs have become another globally traded commodity used for feeding cattle or even swine. A surge of U.S. DDG exports to China began in 2009 and could further rise in the coming decade depending on U.S. supply, corn prices and Chinese policy.61 In fact, China’s imports of all forms of feed input seems to be increasing. For instance, China has also started importing alfalfa, including from the United

THE NEED FOR FEED: CHINA’S DEMAND FOR INDUSTRIALIZED MEAT AND ITS IMPACTS 21
States (see IATP’s China’s Dairy Dilemma: The Evolution and Future Trends of China’s Dairy Industry in this series for details on alfalfa imports).
Figure 12: Countries allowed to export grains to China (Updated April 2013)
Wheat Australia, Canada, France, Kazakhstan, Hungary, United Kingdom, United States, Serbia and Mongolia
Corn Thailand, United States, Peru, Laos, Argentina, Ukraine and Russia* (only for the experimental imports that are planted by Chinese contracted farms in Russia)
Barley Australia, Canada, Denmark, France and Argentina
Reproduced from USDA FAS, Report Number: 13029 (Beijing, June 28, 2013).
With its increasing role as an industrial and livestock feed crop, and massive increase in imports, corn appears to be falling out of strict government control.62 The state seems to be grappling with the liberalization of corn—in large part to feed more livestock and increase consump-tion—the effects of which would lead to displacing small-holder corn production and shifting food security policy to an even narrower range of only two primary crops. Unlike soy, however, where TNCs are deeply embedded, Chinese domestic agribusiness firms like the New Hope Group are poised to be the key corn traders.63
China’s feed sectorChina has 800 million farmers, of which 300–400
million are moving to cities[...]That will increase the
demand for agricultural products while decrease the
supply. This is positive to agricultural companies, like us.
–Liu Yonghao, president of New Hope, China’s
largest feed company, 201164
Feedmill structure
The feed industry landscape has gone from nearly complete state-collective ownership in 1992 to largely Chinese-owned private companies. In 2006, China had more than 15,000 feed companies scattered throughout the country (see Figure 13). As Chinese authorities incentivize scale, standardization and consolidation in the livestock and agriculture sector as a whole, industrialized feed opera-tions with traditional small scale operators who “self-mix” feed are gradually phasing out. Analysts differ in their estimation of how much commercial feed is being used.
Some say that 95 percent of farmers are using some form of commercial feed, while others maintain that backyard farmers still largely depend on non-commercial feed.65
Figure 13: Decline in number of feed companies 2006–2010
2006 2008 2010 % DECLINE IN FOUR YEARS
15,501 13,612 10,834 30%
Source: http://www.efeedlink.com/contents/08-20-2012/78965fc9-92d7-4907-af7a-aa8439861623-d001.html
China’s 12th Five Year Plan calls for an explicit consoli-dation of animal farms to “scale” (further reducing the number of backyard farmers) with a target of 92 percent or more of poultry farms, 50 percent of pig farms and 38 percent of dairy farms reaching that target by 2015. According to one Chinese expert, “scale” for poultry farms means raising 2,000 chickens or more; for pig farms, 50 or more pigs. Various Chinese documents refer to farms with a 100 or more cows as “scale.”66
The plan likewise sets a goal of consolidating feed compa-nies: 50 feed manufacturers producing 50 percent of the national feed output by 2015.67 This is more than likely to be achieved. Already in 2010, 16 companies were producing 33 percent of total feed in China—each with an individual output greater than 1 million tons, annually.68 By the end of this decade, China is slated to be the top compound feed producer in the world.69 According to an expert in the feed industry, ten companies today are already responsible for 50 percent of the production.70 A number of feed compa-nies also have their core business in aqua feed production (see Box 3).71
Box 3: Aquaculture in ChinaChina is the world’s largest producer of farm raised fish and other aquaculture species. According to the Food and Agriculture Organization (FAO) its aquaculture produc-tion in 2009 totaled about 36 MMT or about 65 percent of total global production. The main species produced are carp, but there is also growing production of catfish and many other marine species. Aquaculture requires anywhere between 40 and 60 percent protein meal, depending on the species.72 In China, fishmeal is used, but a high and growing percentage of species now receive some soybean meal in their diets. The volume of soybean meal used by the Chinese aquaculture sector is estimated at 5 MMT or 235 million bushels of soybeans.73
While thin profit margins are endemic to the industry due to price fluctuations of grains and increasingly higher grain

22 INSTITUTE FOR AGRICULTURE AND TRADE POLICY
prices, there is a high return on investment with high turn-over rates. Feed market analysts believe that the return on equity of the Chinese feed sector is highest compared to all other parts of the supply chain at 7, 6 and 4.5 times that of the seed, aquaculture and vaccine sectors, respectively.74
Figure 14: 2011 change in sales volume of listed feed producers
COMPANY VOLUME (THOU-SAND TONNES) GROWTH RATES (%)
New Hope 15,400 20.88%
Haid 3,390 42.21%
Da Bei Nong 1,810 44.49%
Tecon 700 -
Tong Wei 3,350 21.30%
Jinxinnong 380 28.85%
Zhenghong 590 11.89%
Kondarl 330 -
TRS 1,780 -
Wellhope* 1,580 14.00%
Total 33,080 29.71%
*Wellhope was applying for listing at the time of publishing
Reproduced from: http://www.efeedlink.com/contents/08-20-2012/78965fc9-92d7-4907-af7a-aa8439861623-d001.html
The high return on investment combined with thin margins incentivizes these companies to vertically inte-grate into other parts of the supply chain for greater profit margins. For instance, Zhengbang grew by nearly 48 percent in 2011 by moving into the livestock sector and increasing its feed sales.75 According to one feed manufacturer:76
In China, the development of feed industry is
stronger, because it is capital- and technology-
intensive. It is difficult for ordinary farmers to
purchase soybeans and corn from the U.S., but it
is not so difficult for the feed companies. But if a
factory or company only does feed business without
animal husbandry, the feed it produces will be sold
to individual farmers. So the development and profits
of the company will depend on farmers, which is
unstable. The feed companies need to integrate
into the industrial chain with the feed and animal
husbandry industry or to make animal husbandry part
of their own business. They need to make animal
husbandry flourish to ensure the stability of feed
sales. So, the companies in the feed industry now
start to enter the market of animal husbandry at a
large scale. Now the percentage of feed companies
that invest in animal husbandry is big, around 70
percent of them. Around 20 percent are investing
in other related industries, for example, veterinary
medicine, and slaughtering.
From 110 million tons in 2006, China’s feed output jumped almost 54 percent to 169 million tons in 2011 and a 196 million tons by 2012.77 This output rise was mostly driven by an increase in the number of large-scale feed mills. Poultry production absorbed nearly a third of that volume at 54.6 million tons.78 Year on year growth has been phenomenal at 11.5 percent between 2010 and 2011.79 Though China’s 12th Five Year Plan set a target of 200 million tons of feed production by 2015, it appears that China is set to reach and surpass that in 2013 (see Figure 15).
Figure 15: China’s 12th Five Year Plan: Animal and feed production target (million tons)
YEAR TOTAL MEAT EGGS MILK INDUSTRY
FEED
2015 85 29 40 200
2010 79.2 27.6 37.5 162
Average yearly growth
1.16 0.28 0.5 7.6
Reproduced from U.S. Department of Agriculture (USDA) Foreign Agriculture Service (FAS), GAIN Report: China PRC Oilseeds and Products Annual Report, Report # 13005 (Washington D.C, March 1, 2013).
Box 4: Feed companies: China’s growing global powerWattAgnet.com has produced a table of the top 100 feed companies in the world ranked by volume.80 Twenty-nine Chinese firms are included in this list with eight in the top 20. Private companies including New Hope Group, Wen’s Food Group and East Hope Group rank 3rd, 6th and 10th in the world, respectively; while COFCO ranks 9th—producing over 43 million tons of feed. Thailand’s CP group, Cargill, BRF (formerly Brasil Foods) and Tyson ranked 1st, 2nd, 5th and 7th, respectively. CP group has three subsidiaries in China (CPP China, Beijing Da Fa Chia Tai, Qinhuangdao Chia Tai) with over 80 feedmills and Tyson has one (Jiangsu Tyson Foods Co.). New Hope has holdings in Cambodia and Bangladesh while both East hope and New Hope have subsidiaries in Vietnam.

THE NEED FOR FEED: CHINA’S DEMAND FOR INDUSTRIALIZED MEAT AND ITS IMPACTS 23
Conclusion
Part I has looked at China’s growing demand for meat and animal feed, and at the policy choices that contributed and responded to this demand. One decision was to abandon self-sufficiency in soy production, and rely on international markets to meet the bulk of domestic demand. Another was to incentivize large-scale production and market concentration in all parts of the livestock supply chain, including feed production. This appears to be a key strategy by Chinese policymakers to increase output and efficiency of the livestock sector. The meat production targets (and consumption) are driving the appetite for feed.
As a result, Chinese feed companies are emerging as top players in the global livestock supply chain. Whether the government will loosen self-sufficiency targets for corn as it did for soy is a critical question and it will impact world prices of corn. The answer depends largely on China’s future meat demand and policymakers’ attitude towards greater domestic meat production versus imports and to some extent, the efficiency gains of producing domestic corn. It is clear however that China’s need for feed has created a rapid rise in corn imports in recent years and increasingly of other grains and even grasses. Part II and III address China’s diversification strategy to procure these grains abroad and its impacts in those regions; and of the impacts of intensification of production in China. These trends makes imperative a broader and more comprehen-sive debate on industrial meat and its relevance for food sovereignty, security and nutrition in China.
II . DI V ERSIFIC ATION A S A NATIONA L SECURIT Y
STR ATEGY: CHINA “GOES OU T ” FOR FEED
When China took steps to regulate foreign dominance of its soy crushing industry in 2007, China’s state planning agency, the National Development and Reform Commis-sion (NDRC), issued two directives in 2008: one that sought to strengthen domestic production of soybeans, and another that sought direct investment in Brazil and other countries.81
Advocating for greater investment in the international soybean supply chain, the directive guided enterprises “to ‘go out’ and develop international resources.”82 Among
other things, it encouraged “domestic enterprises to establish a stable soybean import system[…],target soybean-export countries to purchase soybean locally, and then rent port terminal, establish warehouse and trans-portation system, or purchase stakes of local agricultural enterprises and rent land to grow crops.”83 It also encour-aged domestic enterprises to “build soybean processing plants in foreign countries. Guide, arrange, organize and coordinate external purchases, while gradually improving domestic enterprises’ international influence and bargaining power and reduce the cost of purchasing.”84
The “going out” is part of a broader geopolitical decision and a national security strategy to diversify sources of imports so as to not be dependent on any one country for food generally, but particularly for feed and meat. Interviews with various Chinese experts and government officials confirmed this. For instance, according to one senior official:85
We can import through international companies.
We can encourage our companies to go abroad,
such as Brazil, to cooperate with local companies.
Zhonghuang has investment in Brazil. Such trade
relationship is vulnerable. So we should take the
diversified strategy. The diversified strategy means we
do not depend only on the soybeans of North and
South America, we can also import palm oil. We can
also import sunflower seeds from the Black Sea area.
They cannot grow soybeans because soybeans need
lots of water. But they are very suitable for growing
sunflower and rapeseed. They have great potential.
If we import from the Black Sea area, we can import
less soybeans.
We import 6.2 million tons of palm oil per year. Now
we can increase the amount to 10 million tons. Then
we can reduce the import of soy beans by 4 million
tons. This is a large number. If we import sunflower
and rapeseeds from the Black Sea area, we can
import one third less soy. If the substitution strategy
works, in the future 5 to 10 years, we can import
much less soy.
Chinese private companies are indeed “going out” to source feed and fodder in Africa, Southeast Asia and Eastern Europe (see Figure 16 and China’s Dairy Dilemma: The Evolution and Future Trends of China’s Dairy Industry for alfalfa). The South China Morning Post reported in September 2013 that two state-owned Chinese companies have signed the biggest land deal yet for a 100,000 hect-ares (nearly the size of Hong Kong) in the Ukraine for 50 years.86 The land will be used to grow crops and raise pigs

24 INSTITUTE FOR AGRICULTURE AND TRADE POLICY
and the output will be sold at preferential prices back to China. Over time, the deal will expand to 3 million hect-ares, according to the article—surpassing the 2 million hectares China is said to have acquired to date. This claim has been denied by the Ukraine government, illustrating the challenge of documenting landgrabs once backlash ensues following media publicity. According to an expert at an international governmental organization working on food policy, however, there is no “hard data” on China’s land-based investments abroad, though the organization is encouraging China to invest in technology, production and export capacity rather than land-based investments in regions such as Africa.87
Regardless, Latin America remains one of the primary regions of interest and investment, particularly for soy.
Figure 16: Geography of Chinese investment in livestock feed-related land deals
SOYBEAN INVESTMENTS
Brazil
Democratic Republic of Congo
Argentina
Sudan
Bolivia
Zambia
Kazakstan
Russia
CORN INVESTMENTS
Burma
Cameroon
Cambodia
Democratic Republic of Congo
Uganda
Sudan
Philippines
Tanzania
Bolivia
Zambia
Russia
Zimbabwe
Source: Smaller et al. (2012)88
The China-Brazil soy commodity complex
Brazilian soybean imports to China increased nine-fold from 2000 to 2010, dwarfing the European Union as top destination even though the EU’s own soy imports tripled in the decade.89 In 2011-12, nearly 82 percent of Brazilian soy exports went to China which constituted roughly 37 percent of Brazil’s total soy production.90 This demand has been a major driver behind the rapid conversion to large-scale soy farming from the natural ecosystems and pasture lands of the Mato Grosso region of Brazil, which now accounts for 30 to 40 percent of the country’s soy produc-tion. (This process is discussed in more detail in Peine 2012).
Figure 17: Brazil’s soybean export volume from 2000 to 2009
Reproduced from TNC 2010 An Overview of the Brazil-China Soybean trade and its strategic implications for conservation, Pg. 9; original source (SECEX)
Soybean Export Volumeto Other Destinations
Soybean Export Volumeto China
2000 2004 2006 2008
5
0
10
15
20
25
30
35Millions of metric tons
Transnational control over the Brazil-China feed grain trade
A Nature Conservancy report lists 144 soy exporters to China, but the majority of the exports are controlled by the ABCDs, all of which have extensive investments and operations in Brazil.91 These include grain elevators, crushing facilities, port terminals and other processing and distribution facilities. In 2009, the ABCDs accounted for over 40 percent of soybean crushing capacity in Brazil—all of them were involved in other segments of the

THE NEED FOR FEED: CHINA’S DEMAND FOR INDUSTRIALIZED MEAT AND ITS IMPACTS 25
Box 5: Chinese and Brazilian investments in the livestock sectorChinese investments in Brazil96
Chinese companies invested some $53 billion USD in Brazil from 2009 to 2012.97 Though most are related to energy, transport and mining infrastructure, finance is emerging as an important category. The Bank of China and the Industrial and Commercial Bank of China (ICBC is one of the largest banks in the world) are opening Brazilian branches, likely to prove useful in financing the soy sector.98 COFCO is also heavily invested in the “logistics” sector such as ports and shipping.
Deals involving Brazilian land acquisition for soy production are at various stages and Chinese companies are using a similar approach in Argentina (see Chongqing Grain Group below). Greenpeace China has documented four cases which remain unresolved as of now because the Brazilian government is pushing back on foreign land acquisitions:
One of China’s largest State-owned grain corporations, CHONGQING GRAIN GROUP (CGG) set aside $3.4 billion USD for an overseas expansion that included a 200,000 ha soybean farm in Brazil and a 130,000 ha soybean farm in Argentina’s Chaco province. CGG said it would invest $500 million to build a soybean industrial base in Brazil. Soybeans would be harvested and transferred at the Delta farm in Correntina, Brazil and a $100 million would be devoted to setting up a soybean crushing plant. CGG planned to invest 5.8 billion yuan ($914 million) to plant 600,000 tons of soybeans on 200,000 hectares in Brazil annually. It would be China’s largest overseas production base for cooking oil.99 Once operational, the facility was expected to harvest 10 million tons of soybeans per year and process two million tons of soybean oil annually by the end of China’s 12th Five Year Plan in 2015, selling to both Brazilian and the Chinese market.100
ZHEJIANG FUDI AGRICULTURE GROUP and the agricul-tural bureau of Heilongjiang province have also invested $158.4 million to form a joint soybean-growing venture with a Brazilian partner, according to the Zhejiang province commerce department. Two farms will be established in the north and south of Brazil.101
SANHE HOPEFUL (a private company) planned to invest $7.5 billion USD in the state of Goias to secure six million tons of soybeans per year. It also has a joint venture with Argentine businessman Francisco Macri to produce and ship soybeans from Argentina.
PENGXIN GROUP, a Shanghai real-estate company, was negotiating to buy 200,000 ha of land in Brazil for soybeans and cotton. Pengxin has extensive farming operations in China, focused on sheep breeding, wheat and soybean production. It is also the biggest shareholder in a 12,500 hectare soybean and corn growing enterprise in Bolivia.102
Brazilian investments in ChinaBrazil and its companies are also investing in the livestock sector in China and diversifying their livestock related imports to the country. They are also hoping to attract investment from the Chinese government to get it there.
MARFRIG
Marfrig is one of the global powerhouses in the livestock industry, the Brazilian TNC’s profitable wing is Asia and China in particular. It acquired Keystone Foods (one of the largest global food companies that supplies to fast food restaurants such as McDonalds in Asia and the U.S.).103 Its Chinese wing is particularly profitable:
In order to take advantage of the growing opportunities
in the Chinese market and expand our presence in that
country, which we consider one of the major drivers
of global protein demand growth, we established two
Chinese joint ventures through Keystone, one of which,
Keystone-Chinwhiz (60 percent Keystone – 40 percent
Chinwhiz), is building a vertically integrated poultry
production chain, which began processing around
200,000 birds per day in 2012. In addition, Marfrig was
the first Brazilian company authorized to export pork
products to China.”104
According to Marfrig, Keystone’s processing factory in China already served 2,600 restaurants in 2011, but the joint venture would increase meat supply to meet half of Keystone’s processing needs in China.105 Marfrig’s second joint-venture is with COFCO (45 percent Keystone and 55 percent COFCO) in food logistics and distribution services in China. The $300 million USD investment over ten years will open six major distribution centers across China’s major urban centers: Beijing, Shenzhen, Shanghai, Wuhan, Chengdu and Shenyang.106
The BRAZILIAN CONFEDERATION OF AGRICUL-TURE AND LIVESTOCK (CNA) opened its branch office in Beijing in November 2012.
The increasing consumption demand of food from the
middle class in China, with a total of around 30 million
people by 2015, will create opportunities for Brazil to
cooperate with China in the field of food. We can supply
more dairy products, meat products and other high-
value added agriculture and livestock products–Senator
Katia Abreu, president of the Brazilian Confederation of
Agriculture and Livestock.107
Brazil also exported 10,000 tons of meat (beef) between January and October 2012 before China halted imports due to a BSE scare. Russia, China and Hong Kong are the major destinations for Brazilian meat.108
Financiers to ensure that mergers, acquisitions and private equity transactions increase between China and Latin America are also on the rise. An example is SinoLatin. According to its spokesperson Gomez Cobo:
Latin America is the world’s farm. In terms of arable land
China has 0.11ha per capita… Latin America averages
twice as much at 0.25ha.
The firm made four acquisitions between 2005-2011 worth $347 million “in spite of regional drawbacks such as over-blown logistics costs and weak infrastructure.109

26 INSTITUTE FOR AGRICULTURE AND TRADE POLICY
grain industry including trading. In 2008-09, Bunge and Cargill ranked as 1st and 2nd place and ADM and Louis-Dreyfus as 6th and 7th in a list of the leading “Brazilian” agribusinesses.92
However, as in China, Wilmar and China’s COFCO and other companies are beginning to play a more powerful role in Brazil (see Figure 18). For instance, Wilmar’s Chinese subsidiary Yihai Kerry Investment Co. Ltd imports nearly 15 percent of Brazilian soybeans into China. Four Chinese companies controlled nearly 40 percent of the imports. COFCO imports 11 percent of that; Jiusan Oil & Fat Company Ltd controls another 11 percent and is part of a large state-supported and publicly-listed conglomerate called the Beidahuang group. The group owns other parts of the feed supply chain and is also engaged in “industry, transportation, construction and services.”93 The top 10 importers represent approximately 70 percent of the total soybean imports from Brazil.
Figure 18: Top 10 importers of Brazilian soybeans94
COMPANY VOLUME (TONNE) %
Yihai Kerry Investment Co.,Ltd 3,003,853 14.6%
Jiusan Oil & Fat Co. ,Ltd 2,352,398 11.4%
COFCO 2,241,234 10.9%
Shandong Chenxi Group Co., Ltd 1,866,563 9.0%
Shandong Bohi Industry Co.,Ltd 1,231,381 6.0%
Cargill 898,029 4.3%
Chinatex Co.Ltd 874,971 4.2%
Sanhe Hopeful Grain Oil Group 865,391 4.2%
United Food Holding Ltd 710,107 3.4%
Noble Group Ltd 524,984 2.5%
Others 6,052,211 29.5%
Total 20,621,122 100%
Source: Green Peace China calculation based on industry data.
In accordance with the government’s “go out” direc-tive, Chinese state-owned and private companies are also investing directly in Brazil’s soy supply chain, from financing, transport, logistics to ports with the aim of decreasing foreign transnational dependence for Chinese imports. This means that China—and increas-ingly its own TNCs—are competing with the oligopolistic might of foreign TNCs through direct access to soy and by mimicking their methods of vertical and horizontal integration of the commodity chain including through contracts and storage.95
Though both Brazil and China want greater South-South cooperation, given their mutually strong geo-political interests in countering American and EU dominance over global governance, their interests in the case of soy may not exactly align even if they would both like the power of the ABCDs curtailed. China wants more control of its supply chain within Brazil, including through land acqui-sition; Brazil, on the other hand, is regulating foreign ownership of land given its own considerable interests in livestock production and commensurate demand for soy and grazing land.
State-supported and non-state actors in both countries, nonetheless, are creating more integrated livestock supply chains, seeking profits in each other’s markets. For instance, Brazil—home to two of the world’s largest meat companies, JBS and Marfrig—is investing in China, who is focused more on livestock products and retail. Box 5 provides a snapshot of the types of investments China and Brazil are trying to make in each other’s countries.
Impacts of the China-Latin America soy complex
Land use impacts
Producing “cheap” feed grains has come at a great ecolog-ical and social cost in Latin America. Twenty-seven million hectares of Brazilian land are being used to cultivate soy.110 Brazil’s rapid rise of soy exports to China at the turn of this century accelerated the Amazonian deforestation that began in the 90s due to cattle ranching and soy produc-tion. In the North and western part of Brazil, the Amazon is home to 15 percent of the world’s known species and 180 different indigenous nations.111 One hectare of the forest can contain as many as 300 tree species.112 It also provides a critical cooling function for the Earth by pumping 7 tril-lion tons of water per year into the atmosphere.113
From 2003 to 2006, seven million hectares of the Amazon were destroyed in Brazil (one football pitch every 8 seconds, according to Greenpeace).114 According to Brazilian government data, over 8,500 people were used as slave labor to clear the forest.115 Over one million hectares of soy were planted in the region during that period. ADM, Bunge and Cargill were responsible for 60 percent of this soy expansion, the bulk of which went to livestock feed. Ninety percent of this soy was grown in the Amazonian state of Mato Grosso.
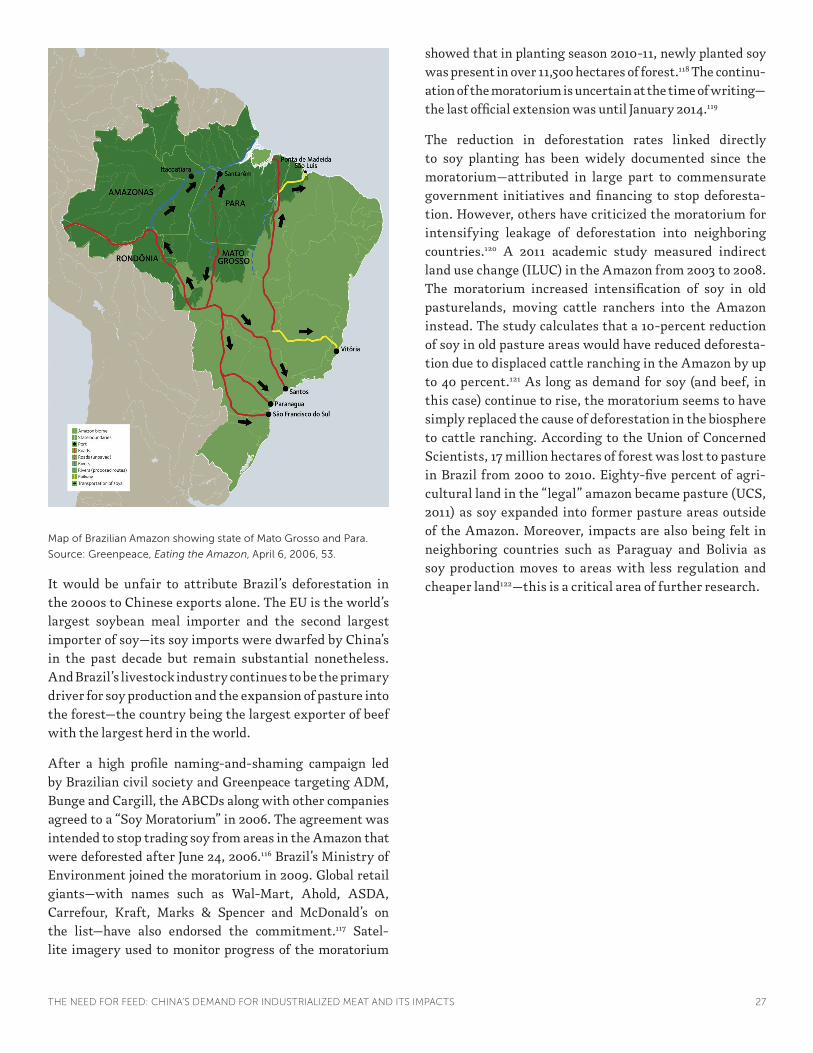
THE NEED FOR FEED: CHINA’S DEMAND FOR INDUSTRIALIZED MEAT AND ITS IMPACTS 27
Map of Brazilian Amazon showing state of Mato Grosso and Para.
Source: Greenpeace, Eating the Amazon, April 6, 2006, 53.
It would be unfair to attribute Brazil’s deforestation in the 2000s to Chinese exports alone. The EU is the world’s largest soybean meal importer and the second largest importer of soy—its soy imports were dwarfed by China’s in the past decade but remain substantial nonetheless. And Brazil’s livestock industry continues to be the primary driver for soy production and the expansion of pasture into the forest—the country being the largest exporter of beef with the largest herd in the world.
After a high profile naming-and-shaming campaign led by Brazilian civil society and Greenpeace targeting ADM, Bunge and Cargill, the ABCDs along with other companies agreed to a “Soy Moratorium” in 2006. The agreement was intended to stop trading soy from areas in the Amazon that were deforested after June 24, 2006.116 Brazil’s Ministry of Environment joined the moratorium in 2009. Global retail giants—with names such as Wal-Mart, Ahold, ASDA, Carrefour, Kraft, Marks & Spencer and McDonald’s on the list—have also endorsed the commitment.117 Satel-lite imagery used to monitor progress of the moratorium
showed that in planting season 2010-11, newly planted soy was present in over 11,500 hectares of forest.118 The continu-ation of the moratorium is uncertain at the time of writing—the last official extension was until January 2014.119
The reduction in deforestation rates linked directly to soy planting has been widely documented since the moratorium—attributed in large part to commensurate government initiatives and financing to stop deforesta-tion. However, others have criticized the moratorium for intensifying leakage of deforestation into neighboring countries.120 A 2011 academic study measured indirect land use change (ILUC) in the Amazon from 2003 to 2008. The moratorium increased intensification of soy in old pasturelands, moving cattle ranchers into the Amazon instead. The study calculates that a 10-percent reduction of soy in old pasture areas would have reduced deforesta-tion due to displaced cattle ranching in the Amazon by up to 40 percent.121 As long as demand for soy (and beef, in this case) continue to rise, the moratorium seems to have simply replaced the cause of deforestation in the biosphere to cattle ranching. According to the Union of Concerned Scientists, 17 million hectares of forest was lost to pasture in Brazil from 2000 to 2010. Eighty-five percent of agri-cultural land in the “legal” amazon became pasture (UCS, 2011) as soy expanded into former pasture areas outside of the Amazon. Moreover, impacts are also being felt in neighboring countries such as Paraguay and Bolivia as soy production moves to areas with less regulation and cheaper land122—this is a critical area of further research.

28 INSTITUTE FOR AGRICULTURE AND TRADE POLICY
Figure 19: Brazilian soybean production, harvested area and exports, 1990–2010
Reproduced from: Union of Concerned Scientists 2011: The Root of the Problem: What’s Driving Tropical Deforestation Today? Chapter 4, pg. 5.
Note: Crop years overlap two calendar years, from the middle of one year to the middle of the next, since soybeans are almost all produced in the Southern Hemisphere’s wet season (November to May).
Prod
uctio
n an
d ex
port
s
Are
a ha
rves
ted
million metric tonsmillion hectares
19900
10
20
30
0
10
5
20
15
25
30
40
50
60
70
80
1994 1998 2002 2006 2010
Total production Area harvested
Exports
Soy expansion through intensification
Reduction of deforestation rates in the Amazon has come with the intensification of soy production designed to increase yields per hectare. GM soybeans make up 75 percent of the production. Intensification has further increased Brazil’s pesticide and herbicide use, much of which flows into major tributaries of the Amazon. The country already has one of the highest agro-chemical usage rates in the world. In addition, resistance to glypho-sate (Roundup), the herbicide used with Monsanto’s GM soy, is becoming a major problem in Brazil and is also impacting the Amazon.123
Future projections of Brazilian soy involve more land use change. According to TNC 2010, 4 to 5 million new hectares will go towards soy production by 2020 with as many as 3.5 million hectares coming from the Mato Grosso, nearly all driven by exports.124 Even under the most conservative TNC scenario, 70 to 80 percent of these soy exports will go to China.125
Accessed from http://www.dw.de/brazil-to-take-soy-lead-with-
respect-for-rainforest/a-16547231 on Aug 6.
Food sovereignty implications
In addition to the drastic ecological and social impacts of soy exports, Brazilian-Chinese trade in whole soybeans has impacted economic choices and livelihoods of soy producers in both countries. Figure 20 shows how policy choices in both of these countries have created a symbiotic relation-ship whereby Brazil’s soybean production parallels China’s soybean crushing growth. As Brazil has come to rely on exporting whole soy, its crushing sector has declined and flattened out to match China’s soybean production. This has had negative consequences for the value Brazil can obtain from soy. It has also resulted in ever greater Chinese dependence on foreign soy with domestic soy acreage steadily diminishing. However given the growing power of China’s livestock and feed firms (increasingly the same), considerable vested interests maintain and accelerate the status quo of importing cheap soybeans from Brazil. It is good for the bottom line of meat processors and feed companies on both sides of the border.

THE NEED FOR FEED: CHINA’S DEMAND FOR INDUSTRIALIZED MEAT AND ITS IMPACTS 29
Figure 20: Soybrean production and crush
Reproduced from Peine,E 2013, p. 201
1980/1981
0
60,000
70,0001,00 metric tons
20,000
30,000
40,000
50,000
10,000
1984/1985
1988/1989
1992/1993
1996/1997
2000/2001
2004/2005
2003/2004
2008/2009
Brazil production
China production
Brazil crush
China crush
It is not good, however, for the farmers who produce soy on either continent (see section on China’s agricultural land-scape below). The farmers in Brazil are dependent on the ABCDs who exert control “over every stage of the process, from inputs and credit to drying, storage, processing, and shipping.”126 The loans are repaid in grain when harvest comes. How differently are Chinese TNCs treating Brazilian farmers in contract with them? This is an area of further research.
Argentina: the soy boom’s socio-ecological impacts
Seventy-five percent of Argentina’s soy is crushed in country. Nearly all of its whole soybean exports, however, go to China: an estimated 12 mt in 2013-14.127 The EU imports most of Argentina’s soy meal. Argentina is also the largest exporter of soy oil. In 1997-98, Argentina grew close to 19 million tons of soy. In 2013-14, that figure is expected to reach 56 mt, covering 20 million hectares of land.128 Introduced in the mid-1990s, GM soy comprised 90 percent of production by 2007.129
As in Brazil, the massive growth in production has led to land use change and land and environmental conflicts with soy moving from the Pampas of central Argentina to Northern regions. The widespread use of GM crops,
herbicides and toxic chemicals has led to several inci-dences of agrochemical drift that have destroyed peasant crops and livestock as well as contaminated potable water sources for rural small scale producers.130
The political might of agribusiness and large landowners, which only increased and consolidated during the soy boom, has also led to social conflict and murders of peasant activists in the past decade as they tried to reclaim land and livelihoods against industrial soy’s encroachment. An example is the 2011 murder of Cristian Ferreyra, a member of Movimiento Campesino de Santiago del Estero (MOCASE) in the Northern province of Santiago del Estero. In October of this year, another prominent activist and member of MOCASE, Miguel Galvan was killed because of the mounting resistance against forced evictions of peasants for soy expansion.
Lapegna 2013 details the consequences of the soy boom.131
Nearly 88,000 small farms (almost 21 percent) went out of business as agribusiness consolidated production; agrarian workers reduced by an estimated 25 percent from 1998 to 2002. Crop diversity loss (upwards of 20 percent) and staggering figures of forest loss in three provinces (118,000 hectares in Chaco Province; 116,000 in Salta Prov-ince; 223,000 in Santiago del Estero) have been reported.132
Also in October 2013, the Associated Press reported on dozens of cases of agro-chemical overuse associated with Monsanto’s GM soy that are resulting in an epidemic of cancers, birth defects and other debilitating health prob-lems due to chemicals contamination of water supplies of villages and schools.133
Soy field being fumigated in Argentina. Photo used under CC via
Flickr user santiago nicolau.

30 INSTITUTE FOR AGRICULTURE AND TRADE POLICY
III . THE CH A NGING AGRICULT UR A L
L A NDSC A PE IN CHINAThe massive drive for industrial livestock production and feed needs have also created commensurate changes in China’s countryside and agricultural policies. The govern-ment announced in early 2013 in its most recent strategic policy statement on agriculture, and rural development (known as “Document Number 1”) that agriculture subsi-dies will be continued for grain production, but the increase of minimum purchase prices were specified for rice and wheat only. China also planned to implement temporary reserves of corn, soybeans, rapeseeds, cotton and sugar “when necessary.”144 As noted in the section on corn, it appears as though China is on the verge of liberalizing the crop even as it does not want to repeat the mistake of near complete import dependence as in the case of soy.
Given this concern of ramping up production of strategic crops and reaching greater economies of scale, Document Number 1 stresses the need for “larger-scale household agriculture operations, such as family-run farms and farmer cooperatives” with the aim of such units operating on 6.7 hectares of land as opposed to the current average of 0.5 hectares per household. This means a continued reduc-tion of the total number of farming households. It works in tandem with the government’s policy of encouraging urbanization and raising farm incomes to encourage more young and able-bodied farmers to produce on larger units of land. For that to happen, China would have to reduce the current rural population of 250 million households to around 30 million, with each household operating an average of four hectares of farmland.145 The government appears to be putting in place policies that will encourage this type of shift over time. The document also explicitly states that such consolidation of farmland will not be controlled by corporate investment, nor through “indus-trial-scale field crop farms.”146
Box 6: Genetically modified feed grainIt is not coincidental that the major global feed crop growers are also those that produce the most transgenic crops. More than three-fourths of the area covered in genetically modified crops in the world is found in the U.S., Argentina and Brazil.134
In April 2012, China authorized corn imports from Argentina. Because they were a “test case” for importing Argentine GM corn for processing, they were held up for inspections for a few weeks before entering China in December 2012. Apparently satisfied with the test, China sanctioned the first major shipment of GM Argentine corn in August 2013. Sixty thousand tons was shipped from Bunge to COFCO, explicitly for feed.135 According to Bloomberg, New Hope Liuhe feed company bought 50 thousand tons of this. China also approved Ukraine as another corn supplier in November 2012.136 This creates competition for U.S. GM corn imports which have been the large majority of corn imports to date. China has approved different GM corn seeds for imports in the past, but never approved planting of GM corn.137 In June, China also approved three varieties of GM soy, all grown in Brazil, for processing.138
Because the Chinese public is generally skeptical about GM technology and the government has taken a very cautious attitude towards GM varieties of food crops, the imports and approvals have raised eyebrows. In September 2013, the government clarified its list of approved GM crops for imports. In addition to soy and corn, the government has issued import certificates for GM crops such as rape, cotton and sugar beets—note that all of these approvals
are for further processing for feed and oil. China has so far only approved the widespread planting of GM cotton and papaya—technologies developed within China. The planting of GM rice and corn remain highly controversial.
Lessons from the U.S. experience?The United States has been one of the largest exporters of corn to China in recent years. It was the first country to begin growing GM crops in the mid-90s. In 2013, 93 percent of soy grown in the U.S. was GM and 90 percent of all corn.139 While Monsanto and the seed industry frequently credit GM technology for bigger yields, a prominent study by the Union of Concerned Scientists found that in 13 years of GM use in the U.S., herbicide-resistant GM corn and soy did not increase yields any more than conventional seeds and that insect-resistant BT corn raised yields by 3 to 4 percent as compared to non-GM plant breeding techniques which raised yields by 13 to 25 percent.140 Because of near monopolistic control of Monstanto owned GM soy called Roundup Ready (GM RR), seed costs for U.S. farmers went up nearly 230 percent from 2000 to 2009.141 Made to tolerate the chemical glyphosate in the herbicide Roundup, the seed is supposed to survive while all other plants are killed in the field. However, glyphosate resistant “super weeds” have become a recurrent problem in soy fields, leading to increased costs and use of several herbicides, with some farmers having to abandon their fields altogether.142 The U.S. Food and Drug Administration has never approved GM foods as safe, but designated them “substantially equivalent” to non-GM foods thereby not requiring food safety testing. However, “substantially equivalent” has never been scientifi-cally or legally defined.143

THE NEED FOR FEED: CHINA’S DEMAND FOR INDUSTRIALIZED MEAT AND ITS IMPACTS 31
Impacts on farmers and cropping patterns
Sky-rocketing meat production has already changed the grain production landscape in China. Many soy farmers have switched to planting corn which is currently more protected as a food security crop and receives higher farm gate prices. This could change with increasing corn imports.
Chinese soy growers have not been able to compete with much cheaper U.S. and Brazilian soy with production steadily falling. Soybean acreage in 2012-13 dropped 14.4 percent from the previous year and another four percent for marketing year 2013-14, down to 12 million tons on 6.8 million hectares according to CNGOIC data.147 Domestic soy producers focus on the non-GM domestic food market and on niche food export markets such as Japan.
One soy farmer, associated with the National Soy Asso-ciation of China explained the impacts that opening up the soy sector had on soy producers over time. He describes how distribution of domestic soy became more and more limited to Northeast China as TNCs played a more promi-nent role of setting up crushing operations and importing cheap soy:
Before 1985, the soy yield was low because of bad
technology, old economic system. The opening-up
gave farmers more incentive to work hard. From
1985 to the beginning of 1990s, the yield tripled. The
price of production rose, too. Farmers made more
profit. Before 1996, the soybeans from Heihe, the
northernmost city in China, were sold to Guangdong,
the southernmost province. After 1996, China
prepared to join the WTO and the soy bean market
was not good. After 2005, Heihe soybeans could only
be sold down to the middle part of China, around
the Long River. In 2007, Heihe soybeans could only
be sold to the Yellow River area (further North). That
is because the big international companies arranged
their businesses and factories in southern China.
They have already occupied the market.
The farmers were excited about the factories
because they thought they could sell to the factories.
However, it is not the case. They just built factories
in China, but they do not buy soybeans from China.
They purchase soy beans from their own country.
They are driven by profit. In recent years, the
soybeans for oil are mostly sold within Heilongjiang
Province (Northeastern province of China) and only
the soy beans for food are sold outside Heilongjiang
Province. In the first few years after the opening-up,
the market shrank slowly, then the market shrank
really fast. Now the market in Heilongjiang is also in
danger. This will hurt the interests of Chinese farmers.
The government has invested in the intensification of corn, largely for feed needs, but also for manufacturing. The intensification has brought about monoculture plan-tations, rapidly declining biodiversity and like Argentina, increased use of strong agro-chemicals and hybrid seeds. The soy farmer describes the advent of Demeiya148 corn seed in the Northeast. Demeiya, a word that connotes a hybrid German, American and Asian seed, is a non-GMO hybrid corn variety developed by the German company KWS, the fifth largest seed company in the world. Several versions of this seed are supposed to be resistant to various pests and diseases. According to the farmer:
In 2010 and 2011, many farmers used Demeiya corn
to feed poultry, but now no one continues to do
that this year because many farmers said that it was
bad. But the yield of the corn is strong, and the local
government is very pleased…The corn is sold to the
poultry farming market, for example, Songyuan, the
biggest company in poultry market. Many people will
only purchase Demeiya corn, which is also the reason
that the planting area of Demeiya grows so rapidly.
Now that Demeiya corn has been planted in the north
part of China, the only original habitat of wild soy beans
will be destroyed and the wild soy beans will go extinct.
The herbicide of Demeiya corn kills the wild soy
beans…Ordinary herbicide works slowly. It takes several
days to see the effects of the ordinary herbicide. But
the herbicide for Demeiya corn is very strong.
He commented on the numerous varieties of soy in his region, Heihe, and how the pressure to produce higher yields is leading to monoculture and wiping out biodiver-sity, making farmers vulnerable to climate change:
There were drought resistant species in the past. But
now, because people pay too much attention to the
yield of crops, less and less drought resistant crops are
being planted. This is a mistake. Although the output
will increase a lot, if there are disasters, the yield will
drop. We should plant crops according to the local
conditions. Heihe is the original place of wild soy
beans. There are several thousand breeds of soybeans,
in the mountains and in the fields. There should be a
base of non-GM soy beans in Heilongjiang.

32 INSTITUTE FOR AGRICULTURE AND TRADE POLICY
Degradation of China’s soils and water
The efforts to intensify domestic production have come with an enormous ecological price in China too. Langzhi et al. 2011, using extensive county-level data, find that between 1998 and 2003, a massive shift occurred from the traditional grain producing areas of central, south and east regions to the north and northeast.149 Massive urbanization, scarcity of cheaply available cultivable land and state agriculture policies contributed to this shift. They find that high yields have resulted in high degrees of environmental stress, including high levels of soil salinity and acute water shortages.150 In addition, the shift north-ward to fragile ecosystems that are even more water-scarce may actually add to challenges. For example, water tables in the North China Plain fell by 61 percent from 2000 to 2006.151 Grain is therefore ironically migrating to areas that are even more susceptible to environmental degradation.
At the same time, extreme levels of land and water pollu-tion are resulting from the massive growth and scaling up of livestock production. China’s Ministry of Environ-mental Protection 2010 surveys revealed that livestock production was one of the largest contributors to water pollution, producing 42 percent of the country’s chemical oxygen demand (almost four times more than industrial sources) into water bodies.152 The livestock industry, combined with a growing problem of heavy metals and other contaminants in soils, associated with mining and manufacturing is posing real challenges to soil health and hence agriculture and food grain production as well. Chinese authorities have yet to reveal findings from a national level soil survey completed in 2010. Many conjec-ture that the findings are so disturbing that the govern-ment is trying to come up with an adequate series of measures before revealing them.153
Feed versus meat imports
China’s agriculture policy makers face a number of chal-lenges: There is a growing demand for meat aided by the government’s prioritization for abundant and cheap meat (see IATP’s China’s Pork Miracle? Agribusiness and Develop-ment in China’s Pork Industry for a detailed analysis) and grain self-sufficiency while the government tries to raise rural living standards even as rural labor migrates to cities and agriculture scarcer more degraded land and water resources. Which issues should take priority, and how can competing goals be balanced? Increasingly intransigent
environmental, health and food safety problems associ-ated with the livestock industry are beginning to make some Chinese experts, government authorities and consumers question the current approach to meat produc-tion and consumption. The debate has thus far largely centered on whether to import feed or meat. (Though some are also beginning to raise critical questions about China’s seemingly unquenchable appetite for meat, its massive industrialization and whether, in fact, China has reached “peak meat.”)
Proponents of meat imports believe that livestock imports will alleviate China’s livestock-related environmental, health and food safety problems, thereby externalizing its worse effects. They also see meat imports as beneficial to the nation’s food security in that China’s limited arable land and water resources can then be used to grow rice and wheat. There is one argument for such imports because of China’s extra meat processing capacity, allowing Chinese companies to add value at home while land, water, feed needs would be met through exporting countries. As one senior official put it:
The first benefit of importing meat is that we can
import less grains, animal feeds, and soy beans. Then
the interest of the soy bean farmers and grain farmers
will not be damaged. The second is the pressure of
environmental protection. I do not know whether
you have been to the villages in China. Many rivers
in the villages have been polluted, mainly by animal
husbandry. The pollution mainly come from pig and
chicken raising. Why do we have to keep polluting the
environment? So I think importing meat is better than
importing grains.
And in China, the mode of animal husbandry is
adopted from the United States. This is not good. We
used to use traditional methods for raising animals.
But in the recent 20 years, we have adopted the
feed recipe from the U.S. and also their breeds and
operation in large scale. In Liaoning (Northeast China),
there are huge pig farms with millions of pigs. It is
not suitable for China. The reason is that we do not
have the same resources as the U.S. The U.S. has
lots of corn and soybeans–energy feed and protein
feed. They have so much corn that they can use the
excessive corn to make ethanol. But China does not
have enough corn and soybeans, and energy feed
and protein feed. So American mode is not suitable
for China.

THE NEED FOR FEED: CHINA’S DEMAND FOR INDUSTRIALIZED MEAT AND ITS IMPACTS 33
While other Chinese experts believe quite the opposite. They, along with other foreign experts, believe that if China started depending on the world market for meat imports—it would be hard-pressed to find the supply:
It would be amazing to me if U.S. imports met even
5 percent of China’s demand. There are very small
margins in meat trade with high risks associated with
disease. So China could be an easy prey to price
shocks. It’s better to import a little, not a lot. Besides,
Chinese consumers prefer fresh not frozen meat.
Grain is not subject to the same price shock so it
is better to import 10 percent of the grain demand
than meat demand. The pollution problem can
be managed technically at home. For instance, it
would have been better to invest $7.1 billion at home
improving domestic meat production than investing
in Smithfield.
Another official suggested that China needs to recast its definition of food security (and food self-sufficiency) with less emphasis on grains:
China is likely to import 15 percent of its corn
demand (20 mts) in the next ten years, if they don’t
import a lot of wheat and rice. Some farmers have
started using rice for feed and processing…I cannot
predict what happens (in the future), but it’s not the
end of the world if China imports more corn. If you
import 20 percent of your total demand, what’s
wrong with that? Food security is also changing in
China. It’s not just grain, people eat much more meat,
vegetables and fruit, so the government needs to
start rethinking the definition (of food self-sufficiency).
On the other hand, state-led support for large scale meat production over the last two decades has created a powerful and increasingly globalized domestic constituency of companies vested in the supply chain (meat processing, feed, vaccines) and financiers—creating strong incentives to import both meat and feed and/or exporting them--depending on the bottom line and agreements between them and other global entities along the supply chain. The private-sector led Smithfield-Shuanghui merger exempli-fies these types of transactions which are likely to multiply in the coming decade as the global livestock industry itself consolidates and is increasingly financialized.
CONCLUSIONFeeding a growing global population in the next century will require a multi-faceted response that takes into account distribution and equity, ecological limits, climate change, nutrition, corporate power, rural livelihoods and social justice. This means that governments everywhere and not just in China must begin to address the global-ized socio-economic and ecological impacts of industrial agriculture production and meat production in particular. Feeding factory farm animals requires large volumes of food grains, land and water resources—resources that are increasingly precarious as populations rise and as agri-culture commodity supplies becomes more unpredictable with climate change.
While the FAO, the OECD and other investment banks take the appetite for industrial meat for granted—much of it projected to come from China and India—they fail to address the natural resource–intensive, climatic, social and public health impacts of this unquestioned appetite in OECD countries (which still far exceed all healthy norms of meat consumption) and in developing countries. They also fail to acknowledge that world trade remains a small part of how governments feed their populations. The recent food crises show that this is an even more precar-ious avenue for food security in an era of climate change.
This paper shows the evolution of China’s feed-related supply chain and the policies that have helped shape it. It demonstrates the increasingly global and domestic impacts of this evolution and the domestic challenges this forces on China: How much more meat production and consumption? By and for whom? What production model? What are the costs of this model for today’s and future generations—urban and rural? The paper has tried to provide a picture of the ecological and social challenges that Chinese and policy makers in exporting countries must confront in order to assess the future direction and model of industrial meat production, distribution and consumption. It is hoped that the findings and analysis in this report help catalyze a more holistic debate about these deliberate policy choices.

34 INSTITUTE FOR AGRICULTURE AND TRADE POLICY
ENDNOTES1. See for instance, Grethe, Harald et al., How to Feed the World’s Growing
Billions: Understanding FAO World Food Projections and their Implications (Berlin: Heinrich Boll Foundation and WWF Deutschland, 2011).
2. Tony Weis, “The Meat of the Global Food Crisis,” Journal of Peasant Studies 40 (2013): 65.
3. FAO, Food Outlook: Biannual Report on Global Food Markets 2013 (Rome: FAO, 2013): 1. http://www.fao.org/docrep/018/al999e/al999e.pdf.
4. Ibid.
5. Ibid.
6. Ibid.
7. Sophia Murphy, David Burch and Jennifer Clapp, Cereal Secrets: The World’s Largest Commodity Traders and Global Trends in Ariculture (Oxfam, 2012).
8. Tony Weis, 2013: 71.
9. Ibid.
10. Ibid.
11. Tony Weis, 2013: 68.
12. Rabobank Internationa,l 2010 Market Developments and Outlook (Rabo-bank, 2010).
13. Morgan Stanley, China Files: China’s Appetite for Protein Turns Global (Morgan Stanley, 2011)
14. U.S. Department of Agriculture (USDA) Foreign Agriculture Service (FAS), GAIN Report: China PRC Oilseeds and Products Annual Report, Report # 13005 (Washington D.C, March 1, 2013).
15. Organization for Economic Co-operation Development, OECD-FAO Agricultural Outlook 2011-2020 (Paris: OECD/FAO, 2011):11.
16. The World Bank, “Data of Agricultural Land,” The World Bank, http://data.worldbank.org/indicator/AG.LND.AGRI.ZS/countries (accessed January 27, 2014).
17. Ibid.
18. Interview, Representative from a U.S. grain industry association, Beijing, May 22, 2013.
19. Interview,Representative from a rural development research institute, Beijing, May 23, 2013.
20. Zhangyue Zhou et al., Food Consumption Trends in China. (Report Submitted to the Australian Government Department of Agriculture Fisheries and Forestry,2012).
21. English Translation of Minister Changfu’s article, May 26, 2012 in the People’s Daily, source: USDA FAS, Gain Report: China PRC Ministry of Agriculture’s Domestic Corn Policy, Report # CH 12039 (Beijing, July 30, 2012).
22. IATP and Mindi Schneider, Feeding China’s Pigs: Implications for the Environment, China’s Smallholder Farmers and Food Security Minneapolis: IATP, 2011. http://www.iatp.org/files/2011_04_25_FeedingChinasPigs_0.pdf.
23. Emelie K. Peine, “Trading on Pork and Beans: Agribusiness and the Construction of the Brazil-China-soy-pork Commodity Complex,” in The Ethics and Economics of Agrifood Competition, ed. Harvey S. James, Jr. (Dordrecht: Springer Science-Business Media Press,2013), 197.
24. USDA FAS, GAIN Report: China PRC Oilseeds and Products Annual Report, Report # 13005 (Beijing, March 1, 2013).
25. USDA FAS, “Table 07: Soybeans: World Supply and Distribution,” Fas.usda.com, (October 12, 2013), http://www.fas.usda.gov/psdonline/psdreport.aspx?hidReportRetrievalName=BVS&hidReportRetrievalID=706&hidReportRetrievalTemplateID=8. (accessed December 19, 2013).
26. Ibid.
27. USDA FAS, GAIN Report: China PRC Oilseeds and Products Update, Report # CH13024, (Beijing, May 28, 2013).
28. Ibid.
29. Business Monitor International, China Agribusiness Industry Update Quarter 2 (2012):30 Accessed at: http://www.reportlinker.com/p0175966/China-Agribusiness-Report-Q2.html.
30. Ibid.
31. Marketing years vary depending on the commodity in question. In this case, the marketing year is from October to September the following year. USDA FAS, GAIN Report: China PRC Oilseeds and Products Annual Report, Report # 13005 (Beijing, March 1, 2013).
32. Ibid.
33. Ibid.
34. Ibid.
35. IATP and Schneider, 2011.
36. Ibid.
37. Ibid.
38. Harvey S. James, Mary K. Hendrickson, and Philip H. Howard, “Networks, Power, and Dependency in the Agrifood Industry,” in The Ethics and Economics of Agrifood Competition, ed. Harvey S. James, Jr. (Dordrecht: Springer Science-Business Media Press,2013),99-126.
39. http://www.ft.com/intl/cms/s/0/baa9cb26-e6c1-11e1-af33-00144feab49a.html#axzz2EcAqOayy
40. Steve McCorriston and Donald MacLaren, “De-regulation as (Welfare Reducing) Trade Reform: The Case of the Australian Wheat Board,” American Journal of Agricultural Economics 89 (2007): 637-650. Until 2007, when the company legally changed its name to COFCO, the company’s full name was China National Cereals, Oils and Foodstuffs Corporation. In 2004, the company dropped the words “import” and “export” from its name.
41. Ibid.
42. See IATP and Schneider, 2011 for a detailed account.
43. Ibid.
44. Murphy, Burch & Clapp, 2012: 39.
45. English Translation of Minister Changfu’s article, May 26, 2012 in the People’s Daily, source: USDA FAS, Gain Report: China PRC Ministry of Agriculture’s Domestic Corn Policy, Report # CH 12039 (Beijing, July 30, 2012).
46. GRAIN — Home. “GRAIN — Who will feed China: Agribusiness or its own farmers? Decisions in Beijing echo around the world,” Grain.org,http://www.grain.org/article/entries/4546-who-will-feed-china-agribusiness-or-its-own-farmers-decisions-in-beijing-echo-around-the-world (accessed December 19, 2013).
47. Interview, Representative from a U.S. grain industry association, Beijing, May 22, 2013.
48. Pre-mix can comprise roughly 4-5% of a complete or “compound” feed mixture depending on the production process.
49. Interview, Representative from a U.S. grain industry association, Beijing, May 22, 2013.
50. Morgan Stanley, 2011.
51. Out of total world production of 959.8 million tons of grain. USDA FAS, Grain: World Markets and Trade, Circular Series: FG 07-13 (Washington, DC, July 2013).
52. USDA FAS, GAIN Report: China PRC Grain and Feed Update. Report Number: 13029 (Beijing, June 28, 2013).156 million tons is the demand for 2013-2014.
53. USDA FAS, GAIN Report: China-Grain and Feed Update – May 2012, Report # CH 12038 (Washington D.C.: June 1, 2012).
54. “Concentrate” feed is supplemental industrial feed in the form of protein or energy that farmers can buy to augment a home-based feed system. In China, farmers usually supplement with protein concentrate. “Compound feed” is a complete industrialized mix and can include premix or not.
55. English Translation of Minister Changfu’s article, May 26, 2012 in the People’s Daily, source: USDA FAS, Gain Report: China PRC Ministry of Agriculture’s Domestic Corn Policy, Report # CH 12039 (Beijing, July 30, 2012).
56. Interview, Representative from an international financial institution, Beijing, May 22, 2013.
57. Union of Concerned Scientists, Failure to Yield: Biotechnology’s Broken Promises. Issue Briefing, (UCS,2009).
58. English Translation of Minister Changfu’s article, May 26, 2012 in the People’s Daily, source: USDA FAS, Gain Report: China PRC Ministry of Agriculture’s Domestic Corn Policy, Report # CH 12039 (Beijing, July 30, 2012).
59. Ibid. With the area planted in corn increasing from 11.3% in 1950s to 20.4% by 1990s.
THE NEED FOR FEED: CHINA’S DEMAND FOR INDUSTRIALIZED MEAT AND ITS IMPACTS 35
60. Interview, Feed expert from a Chinese agricultural university, Beijing, June 5, 2013.
61. Michael Jewison and Fred Gale, China’s Market for Dried Distillers Grains and the Key Influences on its Longer Run Potential, (USDA ERS, 2012).
62. This analysis is based on Mindi Schneider’s research.
63. GRAIN — Home. “GRAIN — Who will feed China: Agribusiness or its own farmers? Decisions in Beijing echo around the world,” Grain.org,http://www.grain.org/article/entries/4546-who-will-feed-china-agribusiness-or-its-own-farmers-decisions-in-beijing-echo-around-the-world (accessed December 19, 2013).
64. Alison Leung, “China’s New Hope to set up overseas investment fund,” Reuters, Nov 16, 2011, http://www.reuters.com/article/2011/11/16/us-newhope-idUSTRE7AF0MN20111116 (accessed December 19, 2013).
65. Interview, Representative from a U.S. grain industry association and Interview, Representative from an international financial institution, Beijing, May 22, 2013.
66. See for instance, http://www.caaa.cn/show/newsarticle.php?ID=243905 and http://www.cav.net.cn/magzine/zhuanti/201309.
67. U.S. Department of Agriculture (USDA) Foreign Agriculture Service (FAS), GAIN Report: China PRC Oilseeds and Products Annual Report, Report # 13005 (Washington D.C, March 1, 2013).
68. Ina Enting, Berry Wang, Xiaoyong Zhang, and Gert V. Duinkerken. The Animal Feed Chain in China: Opportunities to Enhance Quality and Safety Arrangements. (Beijing: Embassy of the Kingdom of the Netherlands, 2010).
69. Ibid.
70. Interview,Representative from a rural development research institute, Beijing, May 23, 2013.
71. Enting et al., 2010.
72. Interview, Representative from a U.S. grain industry association, Beijing, May 22, 2013.
73. Iowa Soybean Association, “China: The World’s Largest Soybean Importer and Consumer,” Iasoybeans.com, March 13, 2012, http://www.iasoybeans.com/chinablog2012/?page_id=105(accessed December 19, 2013).
74. David Lin. China’s Feed Sector Consolidation. (August 2012) FEED Business Worldwide, accessed at: http://www.efeedlink.com/contents/08-20-2012/78965fc9-92d7-4907-af7a-aa8439861623-d001.html.
75. Ibid.
76. Interview,Representative from a rural development research institute, Beijing, May 23, 2013.
77. David Lin “China’s Feed Sector Consolidation.” (August 2012)FEED Business Worldwide, accessed at: http://www.efeedlink.com/contents/08-20-2012/78965fc9-92d7-4907-af7a-aa8439861623-d001.html and USDA FAS.
78. USDA FAS, GAIN Report: China PRC Grain and Feed Update, Report Number: 13029 (Beijing, June 28, 2013).
79. USDA FAS, GAIN Report: China PRC Grain and Feed Annual, Report Number: 13015 (Beijing, March 29, 2013).
80. WATT, “Leading Feed Producers Ranked by Volume, ” WATT, http://www.wattagnet.com/FeedTable.html.
81. Peine, 2013: 205.
82. Ibid.
83. Ibid.
84. Ibid.
85. Interview, Senior Official in China’s State Council, Beijing, May 31, 2013.
86. Mandy Zuo,”Ukraine to Become China’s Largest Overseas Farmer in 3m Hectare Deal,” Scmp.com, September 23, 2013. http://www.scmp.com/news/china/article/1314902/ukraine-become-chinas-largest-overseas-farmer-3m-hectare-deal (accessed December 19, 2013).
87. Interview with a representative from an international food policy agency, Beijing, May 23, 2013.
88. Carin Smaller, Qiu Wei and Liu Yalan, Farmland and Water: China Invests Abroad. (IISD, 2012) Accessed at: http://www.iisd.org/publications/pub.aspx?pno=1687.
89. Carrie Brown-Lima, Melissa Cooney and David Cleary, An Overview of the Brazil China Soybean Trade and Its Strategic Implications for Conservation. (TNC, 2010) Accessed at: http://www.nature.org/ourinitiatives/regions/southamerica/brazil/explore/brazil-china-soybean-trade.pdf.
90. Brazil exported 32.19 mmts of soy in 2011/2012 according to USDA FAS and produced a total of 71.07 mmts of soy the same year; source: USDA FAS 2013: Brasil Oilseeds and Products Update, GAIN Report, February 28 Accessed at:http://www.thefarmsite.com/reports/contents/bramar13.pdf; For soy exports to China, Figure 2 (USDA figures) shows 26.45 mmts of Brazilian soy.
91. Carrie Brown-Lima, Melissa Cooney and David Cleary, 2010: 16.
92. Economist Intelligence Unit, The Global Power of Brazilian Agribusi-ness: A Report from the Economist Intelligence Unit (The Economist, 2010), 9. Accessed at:http://www.slideshare.net/economistintelligenceunit/the-global-power-of-brazilian-agribusiness-eiu-report-dec-10.
93. Beidahuang Group, “Brief Introduction of Beidahuang Group,” Beidahuang Group, http://www.chinabdh.com/english/index_2.htm (accessed December 19, 2013).
94. Greenpeace China calculations based on industry data.
95. Peine, 2013: 205.
96. This section is based on research by Kees Kodde and Shuxuan Chen, Greenpeace China.
97. Quanlin Qiu, “Brazil looks to China for investment,” China Daily, October 18, 2012, http://www.chinadaily.com.cn/business/2012-10/18/content_15827895.htm (accessed December 19, 2013).
98. Jia Chen, “Companies keep eyes on market in Brazil,” China Daily, November 27, 2012, http://www.chinadaily.com.cn/business/overseas-cnep/2012-11/27/content_15963431.htm (accessed December 19, 2013).
99. Bao Chang “CGG is Setting up a Soybean Base in Brazil,” Farmlandgrab.org, November 24, 2011, http://farmlandgrab.org/post/view/19650(accessed December 19, 2013).
100. Li Xin, “Chongqing Grain Seeks State Firms to Back $2.47 bln Brazil Soybean Facility,” Farmlandgrab.org, March 1, 2011, http://farmlandgrab.org/post/view/18239(accessed December 19, 2013).
101. Bao Chang “CGG is Setting up a Soybean Base in Brazil,” Farmlandgrab.org, November 24, 2011, http://farmlandgrab.org/post/view/19650(accessed December 19, 2013).
102. Radio New Zealand, “New Bid to Buy Crafar Farms Expected This Week,” Farmlandgrab.org, April 12, 2011, http://farmlandgrab.org/post/view/18430(accessed December 19, 2013).
103. McDonalds, “Keystone Foods,” McDonalds, http://www.mcdonalds.com/us/en/food/food_quality/see_what_we_are_made_of/meet_our_suppliers/keystone_foods.html(accessed December 19, 2013).
104. Marfrig Group, “Corporate Profile and History,” MarfrigGroup, http://ir.marfrig.com.br/eng/grupomarfrig/perfil.asp(accessed December 19, 2013).
105. Marfrig Group, “Marfrig Announces Investment in China,” Marfrig Group, http://www.keystonefoods.com/Portals/23128/images/press-releases/marfrig-keystonechinajvs.pdf.
106. Ibid.
107. Shuo Huang, “Brazil eyes growing agribusiness in China,” China Daily, November 15, 2012,http://www.chinadaily.com.cn/world/2012-11/15/content_15933314.htm (accessed December 19, 2013).
108. Agence France-Presse,“Editor’s Choice, “ AFP,http://www.afp.com/en/node/759274/#.UMsQ7OhUwMY.gmail(accessed December 19, 2013).
109. Naomi Mapstone, “China Eyes Latin American Agribusiness,” Farmlandgrab.org, December 16, 2011, http://farmlandgrab.org/post/view/19830#sthash.bAd6fGrL.dpuf (accessed December 19, 2013).
110. Nadia Pontes, “Brazil to Take Soy Lead with Respect for Rainforest, ” Dw.de, http://www.dw.de/brazil-to-take-soy-lead-with-respect-for-rainforest/a-16547231(accessed December 19, 2013).
111. Green Peace, Cargill-Eating up the Amazon (Green Peace, 2006).
112. Ibid.
113. Ibid., 21.
114. Ibid.
115. Ibid.

36 INSTITUTE FOR AGRICULTURE AND TRADE POLICY
116. Cargill, Responsible Soy Production, Cargill, http:// http://www.cargill.com/corporate-responsibility/pov/soy-production/responsible-soy-production-amazon/index.jsp (accessed December 19, 2013).
117. Aboive, “The Soy Moratorium Will be Renewed for Another Year,” Abiove,http://www.abiove.com.br/english/sustent/abiove_release_moratoria_13out11_us.pdf (accessed December 19, 2013).
118. Soy Task Force, Soy Moratorium: Mapping and Monitoring Soybean in the Amazon Biome - 5th Year. Soy Task Force, 2012.
119. Aboive, “The Soy Moratorium Will be Renewed for Another Year,” Abiove,http://www.abiove.com.br/english/sustent/abiove_release_moratoria_13out11_us.pdf (accessed December 19, 2013).
120. LDPI, “Shifting the Debate about Responsible Soy Production in Paraguay: A Critical Analysis of Five Claims about Environmental, Economic and Social Sustainability”(Working Paper 23,2013).
121. Arima, Eugenio Y et al Statistical confirmation of indirect land use change in the Brazilian Amazon Environ. Res. Letters 6 (April-June 2011), http://iopscience.iop.org/1748-9326/6/2/024010/fulltext/.
122. See LDPI 2013. Shifting the Debate about Responsible Soy Production in Paraguay: A Critical Analysis of Five Claims about Environmental, Economic and Social Sustainability, Working Paper 23.
123. Soybean And Corn Advisor, “Herbicide Resistant Weeds Becoming Bigger Problem in Brazil,” Soybeanandcorn.com,November 19, 2012. http://www.soybeansandcorn.com/news/Nov19_12-Herbicide-Resistant-Weeds-Becoming-Bigger-Problem-in-Brazil, (accessed December 19, 2013).
124. Carrie Brown-Lima, Melissa Cooney and David Cleary,2010:26.
125. Ibid., p.27.
126. Peine, 2013: 195.
127. USDA FAS, Gain Report. Argentina: Oilseeds and Products Annual, (Buenos Aires, March 25, 2013).
128. Ibid.
129. Pablo Lapegna, “Notes from the Field: The Expansion of Transgenic Soybeans and the Killing of Indigenous Peasants in Argentina,” Societies Without Border 8 (September 2013): 291-308. Accessed at: http://societieswithoutborders.com/
130. Ibid.
131. Ibid.
132. Ibid.
133. Warren, Michael and Natacha Pisarenko, “As Argentina’s Pesticide Use Increases, Many Worry About Growing Link to Health Problems,” Huffingtonpost.com, October 20, 2013, http://www.huffingtonpost.com/2013/10/20/argentina-pesticides-health-problems_n_4131825.html(accessed October 27, 2013).
134. Pablo Lapegna, “(Forthcoming) Global Ethnography and Genetically Modified Crops in Argentina: On Adoptions, Resistances, and Adaptations,” Journal of Contemporary Ethnography, Special issue on “Global Ethnography and Transnationalism.
135. Hugh Bronstein, “Exclusive: China approves genetically modified Argentine corn shipment”, Reuters, August 6, 2013, http://www.reuters.com/article/2013/08/06/us-argentina-china-corn-idUSBRE97515E20130806 (accessed January 27, 2014).
136. Bloomberg News, “China COFCO Said to Buy First Argentine Corn Cargo after Accord,” Bloonberg.com, June 4 2013,http://www.bloomberg.com/news/2013-06-04/china-cofco-said-to-buy-first-argentine-corn-cargo-after-accord.html (accessed January 27, 2014).
137. Agrimoney.com, “China turns to GM corn in battle to raise output”, agrim-oney.com, September 29, 2011, http://www.agrimoney.com/news/china-turns-to-gm-corn-in-battle-to-raise-output--3658.html (accessed January 27, 2014).
138. Jonathan Benson, “China approves three new GMO seed varieties for import”, Natural News, June 22, 2013, http://www.naturalnews.com/040895_china_gm_seed_gmo_food.html (accessed January 27, 2014).
139. USDA ERS 2013. Genetically engineered varieties of corn, upland cotton, and soybeans, by State and for the Unites States, 2000-13 (Data set) Accessed at: http://www.ers.usda.gov/data-products/adoption-of-genetically-engineered-crops-in-the-us.aspx#.UpQOleLvadk.
140. UCS, 2009.
141. Michael Antoniou, et al., GM Soy—Sustainable? Responsible? (Vienna: GLS Gemeinschaftsbank eG and ARGE Gentechnik-frei, 2010).
142. Ibid.
143. Ibid.
144. Melinda Meador and Bugang Wu. GAIN Report: China-No.1 Document 2013. Beijing: USDA FAS, 2013.
145. Ibid.
146. Ibid.
147. Michael Riedel, GAIN Report: China-Oil Seeds and Product Update – June 2013. Washington D.C.: USDA FAS, 2013.
148. “De” comes from the Chinese word for Germany “Deguo”, “Mei” from the Chinese word for the US, “Meiguo” and “Ya” from the Chinese word for Asia “Yaguo”. It is marketed in China by KenFeng Seeds, a Heilongjiang Province-based company. See http://www.kwschina.com/go/id/ekuq.
149. Langzhi et al., “Land Use Change and Environmental Stress of Wheat, Rice and Corn Production in China,” China Economic Review 22 (2011):461–473.
150. Ibid.
151. Ibid.
152. Fred Gale, “Livestock Pollution: Women Worried”, dimsums.blogspot.com, January 30, 2013, http://dimsums.blogspot.com/search?q=water+pollution (accessed January 27, 2014).
153. Fred Gale, “China Flour: Leaded or Unleaded”, dimsums.blogspot.com, December 13, 2013,http://dimsums.blogspot.com/search/label/pollution (accessed January 27, 2014).


