global market outlook - anz · 2017 2015 2013 2011 2009 2007 2005 2003 2001 1999 1997 1995 1993...
TRANSCRIPT

GLOBAL MARKET
OUTLOOK
2020

ANZ 2020 GLOBAL MARKET OUTLOOK
PAGE B
CONTENTS
Overview 1
Economic Outlook 5
Investment Themes 11
Investment Strategy 13

Investment returns for 2019 through to November have been stellar. In Australia and abroad, equity returns have typically been in the 20–30% range with bond markets posting high single-digit gains (Table 1). 2019’s strong returns followed a weak end to 2018 and a U-turn on monetary policy by the US Federal Reserve (US Fed), which was quickly joined by many central banks around the world. Share markets rallied on the expectation of better economic growth and by the closing months of 2019, the first glimmers of a recovery have appeared.
A base now appears to be forming in the global industrial and trade cycle after slowing for most of the past two years (charts 1 and 2). The base in the industrial cycle is not a direct result of developments on US-China trade relations, but more due to progress made in working off excess inventory. By removing excess inventory, global industrial production growth could lift from 1% to 3% in 2020.
A full recovery also relies on the resilience of the consumer and the services sector to continue being a vital backstop as the recovery in the industrial cycle takes hold.
However, while the industrial cycle looks to be basing, the growth outlook remains modest. Earnings downgrades continue across many markets and sectors in the lead up to year-end. More positively however, earnings downgrades have ceased in the markets most exposed to the industrial cycle, such as Japan, the European Union (EU) and emerging markets (EM).
We think the monetary policy measures undertaken by the US Fed and other central banks to date have been effective in staving off a recession. In early 2019, markets had factored in excessive US rate cuts, but these expectations have now been revised down. We now expect the US Fed to keep rates on hold in 2020. By comparison, we expect the Reserve Bank of Australia (RBA) to provide two more 0.25% cuts by mid-2020.
Central bank support and early signs of a recovery in global manufacturing mean risk assets should perform modestly well in 2020 but a repeat of 2019 is unlikely.
Source: Macquarie Research. As at October 2019.
%
1210
86420
-2-4-6 2019
2017
2015
2013
2011
2009
2007
2005
2003
2001
1999
1997
1995
1993
Industrial production growth
GDP growth
CHART 1: GLOBAL INDUSTRIAL PRODUCTION LEADS THE SLOWDOWN
Source: Refinitive, ANZ Chief Investment Office (CIO). As at October 2019.
2
1
0
-1
-2
-3
-4
615957555351494745434139
JPM Global PMI (LHS)
JPM Global PMI orders/Inventory advanced 3 months (RHS)
2019
2017
2015
2013
2011
2009
2007
2005
2003
2001
Index points
Stan
dard
ised
leve
l
CHART 2: INVENTORIES POINT TO A TURN
OVERVIEW RECESSION AVOIDED; EQUITY OUTLOOK IMPROVES
ANZ 2020 GLOBAL MARKET OUTLOOK
PAGE 1

While our Investment Cycle Clock remains firmly in late cycle territory, supportive financial conditions argue that monetary policy easing should gain traction and likely extend the investment cycle for some time yet (see page 14). However, risks still remain from uncertainty around the US-China trade conflict, even though a partial deal has been reached.
It is also important to note that cost pressures (rising wages and unit labour costs) have been gradually lifting across labour markets, and corporate margins have been declining in most sectors. These are normal at this stage of the investment cycle, but will likely be a drag on profit growth.
With some signs of stabilisation in the economic cycle, better earnings outcomes, a reduction in tail risks and neutral investor sentiment, the case for growth assets is improving. If our base case plays out – moderate economic growth, restrained inflation, accommodative central banks and range trading bond markets – the return outlook is moderately tilted in favour of equity markets.
Our lead indicators suggest modest single-digit returns for equities, with current earnings growth of around 8% likely to be downgraded to low single digits in the months ahead. Bond market returns, after a strong 2019, will likely struggle to return much more than 1%.
In November 2019, we took growth assets back to benchmark from a small underweight but did not move further. While a recovery looks likely to play out, equity and bond markets have moved ahead of a turn in the economic cycle.
Risks still remain around trade tensions and the pace and duration of a re-acceleration in global growth. Better visibility on these would argue for a more risk-on positioning.
Riskier assets (the Australian dollar, emerging market and value equities) are around the bottom of our fair value range, and would gain traction if the budding recovery were to strengthen. In contrast, rate sensitive and defensive assets such as real assets are more expensive and could come under downward pressure. Australian equities, given the high yield, are vulnerable as well.
Our benchmark allocation to growth assets has a bias to international over Australian equities given better relative valuations and expected earnings. EM equities, while relatively attractive, may continue to lag given the modest global growth environment and the absence of a decisive depreciation of the US dollar (USD).
With expectations of (at best) a modest recovery in growth, bond yields are likely to remain low for an extended period, and as such Australian and international bonds are held at benchmark. The overall allocation to Australian dollar assets is below benchmark position. The currency is caught between emerging signs of an industrial recovery and continued signs of domestic weakness, and for now we believe the latter dominates.
CHART 4: AUSTRALIA AND THE GLOBAL CYCLE
65
60
55
50
45
40
35
30
20
10
0
-10
-20
-30 2018
2016
2014
2012
2010
2008
2006
2004
2002
2000
1998
Index
Net
bal
ance
Source: Refinitive, ANZ CIO. As at October 2019.
JPM global manufacturing PMI (RHS)
NAB survey business confidence (LHS)
ANZ 2020 GLOBAL MARKET OUTLOOK
PAGE 2
Major developed markets industrial production
Source: Refinitive, ANZ CIO. As at October 2019.
China industrial production
Major emerging markets ex China industrial production
CHART 3: INDUSTRIAL PRODUCTION BY REGION
2020
2018
2016
2014
2012
2010
1816141210
86420
-2-4
%

Asset class 2009–2017 annualised return
2018–2019* (per annum)
2019* 2009–2019* annualised return
Australian shares 10.3% 11.2% 26.3% 10.5%
International shares (hedged) 14.6% 7.4% 24.0% 13.3%
International shares (unhedged) 10.5% 15.2% 29.1% 11.3%
Emerging market shares 9.5% 4.4% 14.7% 8.6%
International property 13.9% 8.1% 21.4% 12.9%
Infrastructure 14.3% 9.3% 20.9% 13.4%
Australian fixed income 5.3% 7.1% 9.1% 5.6%
International fixed income 6.9% 4.7% 7.5% 6.5%
Cash 3.2% 1.8% 1.4% 2.9%
TABLE 1: INVESTMENT RETURNS
Index information: * To 30 November 2019. International shares hedged – MSCI World ex Australia Net Index (hedged to AUD) | International shares unhedged – MSCI World ex Aust (Net) | Emerging market shares – MSCI Emerging Markets (Net) in AUD | Australian Shares – S&P / ASX 300 Accumulation | International fixed income – Bloomberg Barclays Capital Global Aggregate (hedged to AUD) | Australian fixed income – Bloomberg AusBond Composite 0+ Yr Index | International property – FTSE EPRA/NAREIT Developed Rental Index ex Australia (hedged) | Infrastructure – FTSE Developed Core infrastructure 50/50 Net Hedged to AUD | Cash – Bloomberg Barclays Bank Bill Index. Source: Factset, ANZ CIO.
ANZ 2020 GLOBAL MARKET OUTLOOK
PAGE 3

PAGE 4
ANZ 2020 GLOBAL MARKET OUTLOOK

After slowing for the past couple of years, a modest global recovery seems likely in 2020. A U-turn by the US Fed on monetary policy looks to have orchestrated a soft landing for the US economy with China and Europe providing incremental
support. Importantly, the prospects for a global recession have now eased.
More supportive monetary policy from central banks has likely limited the fallout from the US-China trade dispute and headed off a global recession. Throughout this adjustment, labour markets and the services sector have remained resilient and this has propped up consumer spending and global growth more broadly. The spillover into financial markets from easier monetary policy has been a positive for risk assets and this has in turn supported household wealth and spending, particularly in the US.
The downturn in manufacturing and trade has hurt the US, Europe and emerging markets more than the domestic Chinese economy, so monetary policy has needed to work a little harder in those jurisdictions. Nonetheless, monetary policy has also eased in China, but in our view, it is only enough to prevent a sharp slowdown and not enough to drive a meaningful rebound.
To be clear, China continues to be on a longer-term structural slowdown path. It is transitioning away from being an emerging economy built on a platform of manufacturing and industrial production towards a more services-oriented economy underpinned by consumer spending. Nevertheless the overall pace of growth still remains high relative to most other economies.
In many parts of the world, forces driving structural slowdown are also at play. In many advanced economies the population is ageing and tilting the savings-investment balance increasingly towards savers. Potential growth is very low, in some cases only around 1%. This is forcing down global interest rates to a point where monetary policy has run out of its traditional ammunition, and policy tools that were used during the financial crisis are becoming the norm more than 10 years later.
In response, central bankers are leaning on government finance ministers to lift spending to drive stronger growth. However, in most cases, this request by central banks is being ignored (for now).
The structural and cyclical policy backdrop means we are unlikely to see above-trend growth in 2020, but importantly recession seems unlikely. Also, 2020 is a US presidential election year and a supportive policy backdrop seems locked in for most of the year. A trade deal between the US and China is at hand and the US Fed seems set for a lengthy pause.
ECONOMIC OUTLOOK BETTER BUT SUBDUED
ANZ 2020 GLOBAL MARKET OUTLOOK
PAGE 5
Source: ANZ Research. As at December 2019.
7
6
5
4
3
2
1
0
Global Australia China United States
2019 2020 2021
3.0 3.1 3.2
1.8 1.81.92.2
2.52.3
6.2
5.85.6
CHART 5: GLOBAL GDP GROWTH
%

In the US, the fundamental backdrop is solid with the consumer in good shape, underpinned by a strong balance sheet and favourable income growth. Interest rate sensitive parts of the economy are responding to rate cuts by the US Fed. Business investment has slowed mainly due to uncertainties about trade policy, although corporate profitability is under pressure from late-cycle cost pressures (charts 6 and 13). However, recent data suggests the downturn may have run its course for now and the US Fed seems set for a lengthy pause. Indeed, the median Federal Open Market Committee (FOMC) participant is not projecting any cut in rates in 2020. US Fed Chair Powell has said that it will require a material change to the outlook for the central bank to consider another rate cut. Nevertheless, the market is still pricing one more cut to come in 2020.
We don’t expect 2020’s presidential election to have any implications for fiscal policy and thus growth. This is because President Trump is working with a divided Congress. This virtually rules out the possibility of fiscal policy being used as a sweetener for growth ahead of the election.
Our outlook for US growth in 2020 is slightly above a trend pace of 1.9%, with activity being supported by mildly stimulatory monetary policy and a central bank prepared to do what it can to extend an already lengthy expansion. Inflation is expected to rise to 2.1% with low unemployment putting upward pressure on prices. Key themes for 2020 will be the presidential election and ongoing geopolitical uncertainties related to trade policy frictions.
UNITED STATES
The Japanese economy has been expanding moderately, underpinned by growth in both income and spending. Unsurprisingly, sectors exposed to the slowing global economy have been faring poorly, including exporters and manufacturers. By contrast, domestically-focussed businesses are doing well. Investment spending by these latter firms is ensuring that overall capital expenditure continues to contribute to growth. Private consumption continues to rise at a modest pace, supported by a favourable employment and income situation.
We think the economy can expand at a slightly above-trend pace of around 0.7% over the coming year, supported by the 2020 Olympics and fiscal stimulus.
An improvement in the external environment should see net exports supporting growth, at least in the short term. In particular, there appears to be an upturn in the technology cycle following a sizable inventory correction. In addition, the outlook for global trade has improved as trade tensions between the US and China have thawed somewhat. Measures of core inflation remain stubbornly low and well below the price stability target of 2%. However, the underlying fundamentals suggest price pressures should eventually pick up on the back of the output gap remaining positive and a gradual evolution of a lift in inflation expectations.
The European Central Bank (ECB) has responded to extended weakness in growth and inflation by easing monetary policy yet again and indicating that policy will be eased further if necessary. In September 2019, the interest rate on bank reserves was cut by 0.1% to -0.5%. Inflation remains below target although wages growth is rising on the sustained fall in unemployment (chart 6). Furthermore, the ECB has started buying €20 billion-worth of bonds a month. Much of the euro area’s economic underperformance is a result of external developments (chart 7).
We expect the economy to stabilise in 2020 at a growth rate of 1.1% that will provide headwinds to inflation and reinforce the easing bias at the ECB. The scope for a meaningful fiscal boost to euro area GDP in 2020 is limited. We estimate that fiscal policy will become moderately more expansive, but only to the tune of about 0.25% of GDP.
A positive resolution to global trade tensions and Brexit would be encouraging, while the corollary also holds true. In the UK, the economy has faltered amid the global slowdown and Brexit uncertainty. We expect only modest growth of 1.3% in 2020 despite supportive monetary and fiscal policies.
JAPAN
EUROPE
ANZ 2020 GLOBAL MARKET OUTLOOK
PAGE 6

CHART 6: US AND EUROPEAN WAGES PICK UP
CHART 7: CHINESE CREDIT IMPULSE AND GERMAN IFO
Source: Refinitive, ANZ CIO. As at October 2019.
German IFO expectations (RHS)
Chinese credit impulse (15 mths advance, LHS)
Source: Refinitive, ANZ CIO. As at October 2019.
US average hourly earnings
EU wages
4.5
4.0
3.5
3.0
2.5
2.0
1.5
1.0
0.5
0.0 Q2 2018
Q2 2016
Q2 2014
Q2 2012
Q2 2010
Q2 2008
Q2 2006
Q2 2004
Q2 2002
Q2 2000
%
2020
2008
2010
2012
2014
2016
2018
500 3
2
1
0
-1
-2
-3
200
250
300
350
400
450
150
100
50
0
Inde
x
Standardised level
ANZ 2020 GLOBAL MARKET OUTLOOK
PAGE 7

The recent national accounts show the Australian economy grew in the September quarter by just 0.4% q/q, and 1.7% over the year. While annual growth has edged higher, it can only be described as the gentlest of turning points. The private sector economy weakness has become more entrenched with housing construction (-1.7% q/q) and business investment (-2.0% q/q) falling. Consumer spending was particularly weak, rising just 0.1% q/q despite the fact that around two thirds of the $7.2 billion tax cuts look to have been paid out.
The RBA’s 0.75% interest rate cuts have been sufficient to stop house prices falling in both Sydney and Melbourne. However, there have been no signs that consumer spending or credit demand is responding. The lack of traction from the monetary and fiscal stimulus measures implemented thus far has created speculation that more needs to be done. The RBA has made it clear they will cut interest rates a further two times if necessary and will move to quantitative easing by purchasing government bonds if more stimulus is required. The federal government is also considering bringing forward tax cuts planned for the 2021 financial year, and infrastructure spending has lifted. Indeed, fiscal policy appears to have a role in resetting the outlook for consumer spending. Personal income tax was growing at about 8% before the recent cuts due to bracket creep and other factors, while consumer spending has only increased by 3% (chart 8). Similar periods were also evident in 2012 and 2015.
Weak wages growth is the main problem and broader business investment has been softening, working against the stimulus measures. The slowdown in employment over the past six months has meant that the downward pressure on the unemployment rate has eased, making stronger wages growth a more difficult goal to achieve. With unemployment stuck above 5% and rising, we expect the pick up in wages growth to stall over the remainder of 2019, and staying there through 2020. In 2021, we expect to see a small improvement consistent with our forecast reduction in the unemployment rate. This suggests that inflation is likely to remain below the RBA’s 2–3% target band until at least mid-2021 (chart 9).
Overall, Australia’s economic growth is set to improve gradually through 2020 (2.2%) and 2021 (2.5%). As growth improves, we expect a rotation of drivers away from the public and external sectors, and towards the private domestic economy.
With growth so narrowly based, the outlook for the economy remains very uncertain. There are few reasons to hope for a short-term recovery given that investment plans have been cut, housing approvals are still trending lower and consumer confidence remains in the doldrums. It seems inevitable that the economy will require further policy stimulus to lift it out of its current funk, and we continue to anticipate a further two 0.25% rate cuts from the RBA in 2020. A lack of recovery in the global economy raises the risk of quantitative easing by the RBA notwithstanding its reluctance.
q/q = quarter on quarter
AUSTRALIA
CHART 8: INCOME TAX IS A DRAG ON CONSUMPTION
CHART 9: WEAK INFLATIONARY PRESSURES
Private sector wages
Trimmed mean inflation
5.0
4.5
4.0
3.5
3.0
2.5
2.0
1.5
1.0 2022
2018
2014
2010
2006
2002
1998
1994
%
15
12
9
6
3
0
-3
-6 2021
2019
2017
2015
2013
2011
2009
2007
%
Source: Australian Bureau of Statistics. As at November 2019.
Consumer spending
Personal income tax
Source: Australian Bureau of Statistics. As at November 2019.
ANZ 2020 GLOBAL MARKET OUTLOOK
PAGE 8

China’s overall growth momentum has headed southwards in the second half of 2019. But with full-year GDP growth of 6.2% still within the range of 6.0–6.5% for 2019, these figures have not warranted a massive stimulus package. We expect China’s GDP growth to slow further in 2020 to 5.8%. While growth is weaker, President Xi Jinping is also targeting the quality of growth and this means rebalancing the economy so that growth is driven more by domestic factors and less by net exports. China will rely on domestic consumption to sustain growth going forward, as investment may play a reduced role due to lingering concerns about a debt pile-up. China’s savings rate remains high at 46% of GDP in 2018, so there is room to frontload some future spending in order to stabilise the current growth rate. The good news is more domestic-oriented growth suits the US who has been pressing China on its persistent trade surplus.
It also creates some common ground for a trade deal even though technology ownership likely remains an ongoing point of difference over the longer term.
President Xi Jinping’s ideology is to transform China’s economy into a globally competitive one backed by technology and innovation. A reform-oriented mindset implies that Chinese policymakers are prepared to accept GDP growth that is slightly below target as they will be more inclined to employ industrial policy as a driver of economic growth rather than conventional monetary and fiscal policy. China’s new economic strategy will be deflationary so should prompt the central bank to maintain an easing bias. China’s monetary policy will thus continue to be prudent but the appetite for monetary easing should be limited.
Growth in the emerging market economies excluding China has slowed in 2019 on the back of weaker exports. Looking out into 2020, tentative signs have recently begun to emerge that the pace of decline in export volumes is finally starting to ease, which should provide a positive impetus to growth. Nonetheless, a full bodied recovery is still elusive, likely impeded by slower growth in China and the US in 2020 and a weak pick up in the technology cycle. Our long-standing view is that monetary policy is losing its effectiveness and becoming increasingly incapable of sparking a credit cycle although fiscal policy can be more effective at this stage if appropriately designed.
Growth in this region is expected to be around 4% in 2020, a pick up from 3% in 2019. Emerging Asia excluding China is forecast to only modestly accelerate as investment remains under pressure from weak profitability. The trade conflict has admittedly resulted in greater interest in relocating segments of global supply chains and production facilities into countries such as Malaysia and Thailand, but actual realisations have been muted.
CHINA
EMERGING MARKETS
EXCLUDING CHINA
CHART 10: CHINESE STRUCTURAL SLOWDOWN
CHART 11: EMERGING ECONOMY GDP: INDIA, BRAZIL AND RUSSIA
Source: Refinitive, ANZ CIO. As at October 2019.
China industrial production
China GDP
201816141210
86420 2019
2018
2017
2016
2015
2014
2013
2012
2011
2010
2009
2008
2007
2006
2005
%
Source: Refinitive, ANZ CIO. As at October 2019.
RussiaIndia Brazil
15
10
5
0
-5
-10 2019
2018
2017
2016
2015
2014
2013
2012
2011
2010
2009
2008
2007
2006
2005
%
ANZ 2020 GLOBAL MARKET OUTLOOK
PAGE 9

ANZ 2020 GLOBAL MARKET OUTLOOK
PAGE 10

As markets navigate the late stage of the investment cycle, much focus will be on wages, profits and credit growth
to identify an approaching end to the cycle.
CHINA STIMULUS – THE IMPACT BEYOND ITS SHORES
China posted solid, but slowing GDP in 2019 of around 6.2%, which is at the bottom end of the Chinese authorities’ 6.0% to 6.5% growth range for the year. The result for Q3 showed both deteriorating domestic demand and falling net exports. However, the Chinese authorities have been active in providing supportive financial conditions by reducing lending rates, easing credit restrictions and lowering the exchange rate. They have also been providing some fiscal stimulus to further prop up growth.
The impact of these policies has been to limit the pace of growth slowdown and to manage the fallout from the trade war with the US. Headline inflation has been rising due to constraints in the supply of pork, but excluding food and energy, inflation is around 1.5% and no threat to economic stability. In our view, this clearly gives the Chinese authorities room to ease further if required.
The Chinese credit data leads economic indicators by at least 12 months and thus far it suggests policy has been adjusted accurately enough to limit the fallout from the trade dispute with the US, but it hasn’t been strong enough to cause a meaningful lift in growth prospects.
We expect the role played by policy in 2019 will be repeated in 2020, with the implication that Chinese growth is likely to continue to slow steadily and in line with the structural slowdown that has been underway for the past decade. Growth is unlikely to accelerate meaningfully. It merely maintains the current status quo and means there is limited downside risk to growth within the boundaries of the slowdown the Chinese authorities are trying to engineer.
It is worth keeping in mind that the impact of China’s policy decisions reaches well beyond its own shores. Since the global financial crisis, the extraordinary swings in monetary policy, as captured by the Chinese credit impulse measure (chart 12), have also held the global economic cycle hostage. Looking out into 2020 it suggests a base in global activity but not much re-acceleration.
Source: Refinitive, ANZ CIO. As at October 2019.
500
450
400
350
300
250
200
150
100
50
0
60
55
50
45
JPM global manufacturing PMI (RHS)
Chinese credit impulse (12 mths advance, LHS)
2020
2019
2018
2017
2016
2015
2014
2013
2012
2011
2010
2009
IndexInde
x
CHART 12: CHINESE CREDIT AND GLOBAL MANUFACTURING
INVESTMENT THEMES WHAT TO WATCH IN 2020
ANZ 2020 GLOBAL MARKET OUTLOOK
PAGE 11
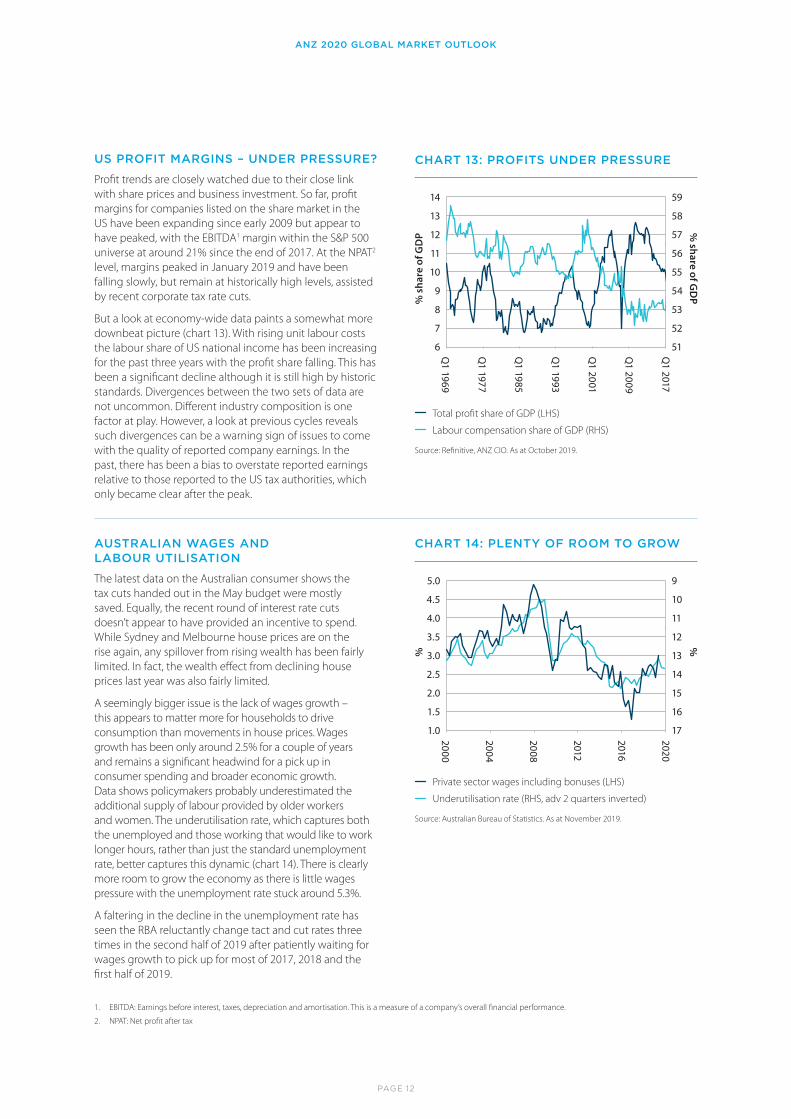
US PROFIT MARGINS – UNDER PRESSURE?
Profit trends are closely watched due to their close link with share prices and business investment. So far, profit margins for companies listed on the share market in the US have been expanding since early 2009 but appear to have peaked, with the EBITDA1 margin within the S&P 500 universe at around 21% since the end of 2017. At the NPAT2 level, margins peaked in January 2019 and have been falling slowly, but remain at historically high levels, assisted by recent corporate tax rate cuts.
But a look at economy-wide data paints a somewhat more downbeat picture (chart 13). With rising unit labour costs the labour share of US national income has been increasing for the past three years with the profit share falling. This has been a significant decline although it is still high by historic standards. Divergences between the two sets of data are not uncommon. Different industry composition is one factor at play. However, a look at previous cycles reveals such divergences can be a warning sign of issues to come with the quality of reported company earnings. In the past, there has been a bias to overstate reported earnings relative to those reported to the US tax authorities, which only became clear after the peak.
AUSTRALIAN WAGES AND LABOUR UTILISATION
The latest data on the Australian consumer shows the tax cuts handed out in the May budget were mostly saved. Equally, the recent round of interest rate cuts doesn’t appear to have provided an incentive to spend. While Sydney and Melbourne house prices are on the rise again, any spillover from rising wealth has been fairly limited. In fact, the wealth effect from declining house prices last year was also fairly limited.
A seemingly bigger issue is the lack of wages growth – this appears to matter more for households to drive consumption than movements in house prices. Wages growth has been only around 2.5% for a couple of years and remains a significant headwind for a pick up in consumer spending and broader economic growth. Data shows policymakers probably underestimated the additional supply of labour provided by older workers and women. The underutilisation rate, which captures both the unemployed and those working that would like to work longer hours, rather than just the standard unemployment rate, better captures this dynamic (chart 14). There is clearly more room to grow the economy as there is little wages pressure with the unemployment rate stuck around 5.3%.
A faltering in the decline in the unemployment rate has seen the RBA reluctantly change tact and cut rates three times in the second half of 2019 after patiently waiting for wages growth to pick up for most of 2017, 2018 and the first half of 2019.
Source: Refinitive, ANZ CIO. As at October 2019.
14
13
12
11
10
9
8
7
6
59
58
57
56
55
54
53
52
51
Labour compensation share of GDP (RHS)
Total profit share of GDP (LHS)
Q1 2017
Q1 2009
Q1 2001
Q1 1993
Q1 1985
Q1 1977
Q1 1969
% share of G
DP%
sha
re o
f GD
P
CHART 13: PROFITS UNDER PRESSURE
Source: Australian Bureau of Statistics. As at November 2019.
5.0
4.5
4.0
3.5
3.0
2.5
2.0
1.5
1.0
9
10
11
12
13
14
15
16
17
Underutilisation rate (RHS, adv 2 quarters inverted)
Private sector wages including bonuses (LHS)
2020
2016
2012
2008
2004
2000
%
%
CHART 14: PLENTY OF ROOM TO GROW
1. EBITDA: Earnings before interest, taxes, depreciation and amortisation. This is a measure of a company’s overall financial performance.
2. NPAT: Net profit after tax
ANZ 2020 GLOBAL MARKET OUTLOOK
PAGE 12

With some signs of stabilisation in the economic cycle, better earnings outcomes, a reduction in tail risks and neutral investor sentiment, the case for growth assets is improving. If our base case plays out – moderate economic growth, restrained inflation, accommodative central banks and range trading bond markets – the return outlook is moderately tilted in favour of equity markets. While we are comfortable that the downside risks to growth have been removed, we are not convinced the global economy is going to respond strongly to the improvement in financial conditions from US Fed rate cuts, easier policy from the ECB and the Chinese monetary authorities.
In November 2019, we took growth assets back to benchmark from a small underweight but did not move further. While a recovery looks likely to play out, equity and bond markets have moved ahead of a turn in the economic cycle. Risks still remain around trade tensions and the pace and duration of a re-acceleration in global growth. Better visibility on these would argue for a more risk-on positioning. Within the neutral growth asset position we have a preference for developed market shares relative to Australian shares and real assets due to better relative valuations. The Australian market’s key sectors (Financials and Resources) have a fairly subdued outlook. Banks are struggling with the impact of low interest rates on net interest margins, weak credit demand, regulatory scrutiny and remediation costs stemming from the Banking Royal Commission.
Meanwhile, Resources are struggling from weaker global demand affecting commodity prices, although steel inputs (iron ore and met coal) are still seeing solid Chinese demand.
Emerging market, Japanese and European equities seem to offer better return prospects, given the scope for improved earnings from global manufacturing. Earnings in each of these markets have been affected by the US-China trade war and Europe has also had to deal with the fallout from Brexit uncertainty. While relatively expensive, the US in the current uncertain environment is attractive given its mixed characteristics (quality, structural growth and defensiveness).
With expectations of a modest recovery in growth, bond yields are likely to remain low for an extended period, and as such we have kept Australian and international bonds at benchmark. The RBA also added to the bias we have for Australian bonds by signalling that it is willing to provide more monetary support to achieve its full-employment and 2–3% inflation target. In this instance it would be difficult to argue for an underweight position in Australian government bonds.
Other defensive assets such as global unlisted property and infrastructure are pushing up against valuation ceilings and are likely to correct if we are too pessimistic about the growth outlook.
INVESTMENT STRATEGY EQUITY MARKET OUTLOOK IMPROVES
CHART 15: MACRO ECONOMIC INDICATOR FINDS A BASE
Source: Refinitive, ANZ CIO. As at October 2019.
Macro Indicator – current economic and financial conditions
Macro Indicator – current conditions
2
1
0
-1
-2
-3
2018
2016
2014
2012
2010
2008
2006
2004
2002
2000
1998
1996
1994
Stan
dard
ised
gro
wth
Current 12 months
Growth assets B O
Developed market shares O O
Australian shares U U
Emerging market shares B O
Real assets U U
Defensive assets B U
Australian fixed income B B
International fixed income B U
AUD U B
TABLE 2: ASSET CLASS STRATEGY
Source: ANZ CIO. As at December 2019.
Underweight Benchmark OverweightBU O
ANZ 2020 GLOBAL MARKET OUTLOOK
PAGE 13

The Investment Cycle Clock (chart 16) is a longer-term indicator that incorporates the stage of the economic cycle (inflation and unemployment) and the risk premia attached to equities, credit and sovereign bonds (charts 17 and 18). This framework takes a whole cycle perspective and therefore tends to take a longer-term view than our shorter-term tactical asset allocation indicators (6 to 12 months).
For the US, this indicator suggests we are well past mid-cycle and close to transitioning from peak-growth to slowdown. Indeed, the US cycle is the most advanced of the major economies and certainly when measured against Australia. By comparison, the Australian investment cycle clock is suggesting we are around mid-cycle, with growth yet to peak. Unlike the US cycle that has progressed from recession to boom over the past decade, the Australian investment cycle clock has tracked sideways as the economy navigated the shock of a collapse in commodity prices and mining investment.
Our overall assessment is that the investment cycle, while advanced, is not yet approaching end cycle. US Fed rate cuts are returning US policy to neutral while in China, Europe, Japan and emerging markets, more easing is likely in 2020. Australia continues to struggle to progress from mid-cycle but is activating monetary, fiscal and macro-prudential policy to support growth.
Shifts in financial conditions are the key to determining when the end of the cycle is getting closer. Indeed, an increasing price of credit (interest rates) or falling credit availability are the factors that have typically led to the end of previous business cycles.
CHART 16: US & AUSTRALIA INVESTMENT CYCLE CLOCK
1.250.750.25
-0.25-0.75-1.25-1.75 2018
2014
2010
2006
2002
1998
1994
1990
1986
1982
1978
1974
1970
1966
1962
Dev
iati
on fr
om
long
-ter
m tr
end
US cycle clock
Source: Refinitive, Bloomberg, ANZ CIO. As at October 2019.
Australia cycle clock
1.501.000.500.00
-0.50-1.00-1.50-2.00
CHART 17: US ECONOMIC CYCLE AND RISK PREMIUM
Dev
iati
on fr
om
long
-ter
m tr
end
Economic cycle
201820142010200620021998199419901986198219781974197019661962
Source: Refinitive, Bloomberg, ANZ CIO. As at October 2019.
Risk premium
1.501.000.500.00
-0.50-1.00-1.50-2.00
CHART 18: AUSTRALIA ECONOMIC CYCLE AND RISK PREMIUM
Source: Refinitive, Bloomberg, ANZ CIO. As at October 2019.
Risk premiumEconomic cycle
2018
2014
2010
2006
2002
1998
1994
1990
1986
1982
1978
Dev
iati
on fr
om
long
-ter
m tr
end
THE INVESTMENT CYCLE LATE BUT NOT END CYCLE
ANZ 2020 GLOBAL MARKET OUTLOOK
PAGE 14

AUSTRALIAN SHARES
Current
12 months
U
U
Our current preference is to be underweight Australia shares.
Australian macro lead indicators have softened. Valuations are beginning to look stretched and are now close to the top of our fair value range as the market has factored in policy support from tax cuts, lower interest rates and some easing in lending restrictions (chart 19). Earnings indicators were beginning to stabilise but have softened again. Resources are benefiting from rising commodity prices due to supply constraints, particularly in iron ore (although prices have fallen sharply recently), and a lower Australian dollar.
The Australian market’s key sectors (Financials and Resources) have a fairly subdued outlook. Banks are struggling with the impact of low interest rates on net interest margins, weak credit demand, regulatory scrutiny and remediation costs stemming from the Banking Royal Commission. Resources, on the other hand, are struggling from weaker global demand affecting commodity prices. However, steel inputs (iron ore and met coal) are still seeing solid Chinese demand, even though the prices of both commodities are now lower than they were in the first half of 2019.
The valuation problem in Australia doesn’t seem to reflect bullish sentiment for the market in aggregate. It has been caused by the relatively large concentration the market has in both Banks and Resources. In other words, investors not wanting an exposure to either Banks or Resources are forced to buy a relatively small number of stocks, particularly in the Industrials, Healthcare and Tech sectors. The Industrials ex Financials PE ratio is trading at over 24 times, and above its average of a little below 16 times.
The Australian market also tends to do well relative to other markets during periods of risk aversion or when global bond yields are falling. The global bond market sell-off during October 2019, which ran into early November, saw Australia underperform markets such as Japan and emerging markets. If bond yields continue to push higher with an improvement in the global manufacturing cycle then Australia may struggle.
Conversely, if risk aversion and lower bond yields come back into vogue then the Australian market should perform relatively well. Risks seem biased towards a modest recovery in global manufacturing, but this may not be enough to see Australia outperform, especially with its valuation headwinds.
CHART 19: AUSTRALIAN SHARES — TOP OF FAIR VALUE RANGE
CHART 20: DEVELOPED MARKET SHARES – CLOSE TO FAIR VALUE RANGE
20192018201720162015201420132012201120102009200820062005200420032002
8
7
6
5
4
3
2
Pric
e in
dex
(’000
)
Source: Refinitive, Bloomberg, ANZ CIO. As at November 2019.
20192018201720162015201420132012201120102009200820062005200420032002
2.0
1.8
1.6
1.4
1.2
0.8
0.4
0.6
Pric
e in
dex
(’000
)
Source: Refinitive, Bloomberg, ANZ CIO. As at November 2019.
S&P/ASX 300 Index Fair value Fair value range MSCI World Index Fair value Fair value range
ASSET CLASSES CURRENT STRATEGY AND OUTLOOK
ANZ 2020 GLOBAL MARKET OUTLOOK
PAGE 15

Our current preference is to be overweight developed market shares.
Macro lead indicators point to below-trend growth in the global industrial cycle. However, signs are building that the global industrial cycle is basing. This development has been supported by rate cuts and progress on a US-China trade deal. Valuations are towards the upper end of fair value overall for global shares, with Europe and Japan relatively attractive versus the US range. Relative to bonds, equities remain attractive versus much of the past 40 years (chart 22). Technical and sentiment factors are stretched for rate sensitive sectors, but overall they are neutral for equities.
We think it’s too early to take on significant risk and for the market to continue rallying, earnings momentum will need to keep up.
However, with some signs of stabilisation in the economic cycle and a reduction in tail risks, we hold developed market equities overweight given better relative value and earnings outlook to Australian equities and listed real assets.
Relative value and the relative earnings outlook between markets are likely to be important for performance in this asset class. Laggards over the past five years such as Europe, the UK and Japan could outperform the US given their leverage to improving US-China trade relations and Brexit, and better valuation. We have seen signs of improving relative performance in these markets against the US in the last few months of 2019 and this may continue if Brexit can be resolved and a trade deal between the US and China can be reached. While the US is relatively expensive in the current uncertain environment it is attractive given its mixed characteristics (quality, structural growth and defensiveness).
Our current preference is to be benchmark emerging market shares.
Macro lead indicators for the region and the earnings-per-share (EPS) growth are still weak, although signs of a base in the global industrial cycle are supportive. Valuations remain generally more attractive than developed markets. However, more sustained outperformance will depend upon the US dollar (USD) weakening. Inflation remains under control and is likely to stay around historically low levels as well as below central bank targets.
The US-China trade war remains a key downside risk, which means that the earnings outlook would continue to be trimmed, albeit at a slower pace for the year ahead. Our indicator of EPS growth suggests consensus expectations of around 10%, which look too optimistic. However, a weaker USD could clearly be supportive for returns. To this end, the US Fed’s decision to cut rates assists, but broad USD weakness would depend on regions outside the US doing more heavy lifting on global growth.
DEVELOPED MARKET SHARES
EMERGING MARKET SHARES
7570656055504540353025
80
60
40
20
0
-20
-40
-60
2018
2015
2012
2009
2006
2003
2000
1997
1994
1991
1988
1985
1982
%
Inde
x
Current
12 months
O
O
Current
12 monthsO
B
ANZ 2020 GLOBAL MARKET OUTLOOK
PAGE 16
CHART 21: EARNINGS GROWTHCHART 22: EQUITIES ATTRACTIVE VERSUS BONDS
Source: Refinitive, ANZ CIO. As at October 2019.
ISM & China orders and prices – advanced 6 months (LHS)
Global trailing EPS USD (RHS) Source: Refinitive, ANZ CIO. As at October 2019.
US S&P 500 trail earning vs 10-year bond yields
2018201620132010200720052002199919961994199119881985198319801977197419721969196619631961
%
20
15
10
5
0
-5

Our current preference is to be underweight listed real assets.
Valuations in global listed property and infrastructure are now expensive in absolute terms and relative to core equities. Investors have rotated into defensive sectors, but this has now become a crowded trade. Real assets generally do well in periods of uncertainty while bond yields are low given attractive dividend yields, and the low cyclicality around much of the sector’s earnings. In fact, relative to bonds, this asset class is trading broadly in line with its own historical experience, excluding recent periods of extreme over (2006–07) and under (2008) valuation (chart 23).
The direction of bond yields going forward is important for this asset class. Rising rates usually lead to underperformance versus equities. If the recovery in global growth is stronger than we anticipate then listed infrastructure and property will likely be susceptible.
LISTED REAL ASSETS
Current
12 months
U
U
ANZ 2020 GLOBAL MARKET OUTLOOK
PAGE 17
CHART 23: GLOBAL PROPERTY AND INTEREST RATES
CHART 24: BOND YIELDS AND THE CYCLE
Source: Refinitive, Bloomberg, ANZ CIO. As at October 2019.
12 months change in US 10-year bond yield (RHS)
12 months change in ISM new orders (LHS)
2019
20022003200420052006200720082009201020112012201320142015201620172018
30 2.0
1.0
1.5
0.5
0
-0.5
-1.0
-1.5
-2.0
10
20
0
-10
-20
-30
Inde
x po
int c
hang
e
%
Source: Refinitive, Bloomberg, ANZ CIO. As at October 2019.
Yiel
d sp
read
to b
ond
20
15
10
5
0
-5-2 -1 0 1 2 3 4 5
Real US 10-year bond yield
2008
Current observation
2006 –2007
Our current preference is to be benchmark international fixed income.
Yields are expected to be lower for longer. The slowdown in global growth and subdued inflation has supported a solid rally in fixed income. Signs that growth is likely levelling out have been a headwind with yields rising as further central bank easing has been scaled back (chart 24). Technical and sentiment factors are also stretched and some repositioning is likely. Nevertheless, we expect subdued inflation and modest growth to continue to support yields at low levels.
In the near term, central banks are expected to deliver on market expectations which are now moderate given cuts were delivered or priced out.
The US Fed is in a wait and assess mode. We do not expect hikes to be priced in any time soon. The US Fed’s current bias is to ensure inflation moves back to at least 2%, skewing the outlook for US yields towards lower levels. Credit is expensive but euro spreads in particular are likely to be supported by the ECB’s asset buying program along with at least some stabilisation in the economic environment.
US 10-year yields are around fair value according to our modelling following the sell-off in October/November 2019. Progress in trade negotiations will be important for the direction of bond yields in the short term. Indeed, a material trade deal between the US and China could push yields beyond 2% relatively quickly. Equally, if trade talks collapse then yields can quickly fall to around 1.5%.
INTERNATIONAL FIXED INCOME
Current
12 monthsU
B

Our current preference is to be benchmark Australian fixed income.
Australian fixed income has rallied strongly and signals remain neutral on subdued inflation and expectations that the RBA would ease further in 2020. Inflation expectations are subdued compared to the rest of the world, and in conjunction with an improved fiscal outlook, should anchor yields below the US (chart 25). However, in line with global yields, the improved growth outlook has lifted local bond yields.
The fragility of the domestic economy creates the bull case for Australian bonds. The unemployment rate has been stuck around 5.3% for a few years now and wages growth remains soft. The RBA has indicated a willingness to cut the cash rate by a further 0.50% if required. It is also open to implement a quantitative easing program if the economy weakens sufficiently further.
Valuations are stretched, but domestic factors could easily cause yields to track lower. The case for an underweight position in the asset class looks weak at this stage.
Our current preference is to be underweight the Australian dollar.
The headwind from interest rate differential to the US is partly offset by rising bulk prices (chart 26). While easing global lead indicators have driven base metal prices lower, China’s supply side reform and supply disruptions in Brazil mean that iron ore has good support at relatively high prices. We need firmer signs to emerge that the current base moves to a recovery to become more positive on the Australian dollar.
Weakness in the domestic economy is the main downside risk to the currency from its current levels, with upside risks from a weaker US dollar and more US Fed rate cuts next year than the market anticipates (currently the expectation is another 0.25% cut).
The net of this is that there are downside risks to the Australian dollar from current levels in the first half of 2020.
AUSTRALIAN FIXED INCOME
CURRENCY
Current
Current
12 months
12 monthsB
U
B
B
ANZ 2020 GLOBAL MARKET OUTLOOK
PAGE 18
CHART 25: AUSTRALIAN RATES ARE STUCK BELOW THE US
CHART 26: COPPER SWINGS WITH THE CYCLE
200320042005200620072008200920102011201220132014201520162017
20192018
20 45
2535
155-5-15-25-35-45
10
15
5
0
-5
-10
%
%
Major economy industrial production (6 months seasonally adjusted, LHS)
Source: Bloomberg, ANZ CIO. As at October 2019.Copper % change 6 months (RHS)
Source: Refinitive, Bloomberg, ANZ CIO. As at October 2019.
32.5
21.5
10.5
0-0.5
-1-1.5
201920182017201620152014201320122011201020092008200720062005200420032002
%
Australian 10-year bond yield less US 10-year bond yield

Commodity markets face stagnant economic growth coupled with shifting consumption patterns over the coming 12 months. This is complicated by ongoing trade tensions. An uncertain backdrop is the ultimate result.
Supply-side issues cannot be ignored. Investment in new capacity remains stagnant in many commodities. This raises the spectre of supply growth receding below historically low levels of demand. Even so, such risks are likely to remain in the background as the market focuses on economic fundamentals.
Supply constraints in Brazil are likely to continue well beyond the end of 2019 and we expect the iron ore price to remain around $US80 per tonne well into 2020. Weaker coal demand from China and India has pushed prices from $US200 per tonne earlier in the year to around $165 per tonne. Thermal coal has also been under pressure. We don’t see much upside risk to current prices given the slowdown in global growth. But supply constraints and a seasonal pickup in demand could push up prices in the months ahead.
Precious metals have performed well during periods of deteriorating trade negotiations and we expect this to remain the case in 2020. Negative bond yields in many parts of Europe and Japan have also assisted in pushing up the price of gold. We expect gold to push towards $US1,600 per ounce over the coming year.
The outlook for industrial metals depends on the prospects for global growth. With some firming in global growth, copper and aluminium prices are likely to move modestly higher over the course of 2020.
The oil market faces a multitude of challenges in 2020, of which weakened growth amid a trade war is possibly the greatest. However, geopolitical risks remain high, while the impact of environmental issues should also come to the fore. OPEC has reaffirmed its support of current oil prices by increasing production cuts, thereby limiting the downside price. However, lingering doubts about demand should cap the upside as well. We expect Brent crude to be in the $65–70 per barrel range in the coming year.
COMMODITIES
We monitor commodities closely due to their close correlation to the Australia dollar however we do not have a preference for this asset class.
MARK RIDER CHIEF INVESTMENT OFFICER
Mark is responsible for the overarching investment philosophy, investment strategy and asset allocation of ANZ Private Banking and Advice model portfolios and approved product list. Mark has been at ANZ for the past seven years and has over 30 years of investment market experience having previously worked at UBS and the Reserve Bank of Australia.
ANZ 2020 GLOBAL MARKET OUTLOOK
PAGE 19

DISCLAIMER
This ANZ 2020 Global Market Outlook (this “document”) is current as at 16 December 2019 and has been prepared by Australia and New Zealand Banking Group Limited ABN 11 005 357 522 or its affiliates (“ANZ”).
This document contains factual information and may also contain professional opinions which are given in good faith and based on information and assumptions believed to be reliable as at the date of this document. The views expressed in this document accurately reflect the authors’ personal views, however the authors make no representation as to its accuracy or completeness and the information should not be relied upon as such. Any opinions, estimates and forecasts herein reflect the authors’ judgments on the date of this document and are subject to change without notice.
Any prices or values herein are as of the date indicated and no representation whatsoever is made that any transaction can be effected at such prices or values or that any prices or values may be provided at a later date. The value and income of any of the securities or financial instruments mentioned in this document may fall as well as rise and an investor may get back less than invested. Foreign-currency denominated securities and financial instruments are subject to fluctuation in exchange rates that could have a positive or adverse effect on the value, price or income of such securities and financial instruments.
In preparing this document ANZ may have also relied on information supplied by third parties and whilst ANZ has no reason to doubt the accuracy of information used to prepare this document, ANZ makes no representation and gives no warranty as to the accuracy, timeliness or completeness of any information contained in this document or its relevance to the recipient.
Copyright in materials created by third parties and the rights under copyright of such parties are hereby acknowledged.
This document is issued on the basis that it is only for the information of the particular person to whom it is provided. This document contains confidential information and it is not to be reproduced, distributed or published by any recipient for any purpose without the prior written consent of ANZ.
Nothing in this document constitutes a representation that any investment strategy or recommendation contained herein is suitable or appropriate to a recipient’s individual circumstances or otherwise constitutes a personal recommendation and it does not take into account the specific investment objectives, requirements, personal needs or financial circumstances or tax position of any recipient. This document does not contain and should not be relied upon as containing investment recommendations or advice and does not constitute an offer or an invitation to deal in, or a recommendation to acquire or sell any product or subscribe to any service. The recipient should seek its own independent financial, legal, credit, tax and other relevant professional advice and should independently verify the accuracy and appropriateness of the information contained in this document having regard to its objectives, financial situation and needs.
Changes may be made to products and services at any time without prior notice to you.
While the information in this document is based on sources believed to be reliable, ANZ (together with its directors and employees) makes no representations or warranties, express or implied, as to the accuracy, completeness or timeliness of any of such information. ANZ shall not be liable for any loss, damage, claim, liability, proceedings, cost or expense (“Liability”) arising directly or indirectly (and whether in tort (including negligence), contract, equity or otherwise) out of or in connection with the recipient relying on, in any way, the contents of and/or any statements, representations or omissions made in this document (including any error, omission or misstatement herein, negligent or otherwise) or further communication thereof except where a Liability is made non excludable by relevant legislation.
Past performance is not indicative of future performance. The value of investments may rise or fall and the repayment of subscribed capital is not guaranteed.
ANZ 2020 GLOBAL MARKET OUTLOOK
PAGE 20

ANZ 2020 GLOBAL MARKET OUTLOOK
PAGE 21

Australia and N
ew Zealand Banking G
roup Limited (A
NZ) A
BN 11 005 357 522. A
5784/1219 12/19 23127
anz.com