industrial growth in kerala : trends and …dic.kerala.gov.in/web/pdffiles/industgrowth.pdf ·...
TRANSCRIPT

November 2000
INDUSTRIAL GROWTH IN KERALA : TRENDS AND EXPLANATIONS
K. K. Subrahmanian E. Abdul Azeez
Working Paper No. 310

INDUSTRIAL GROWTH IN KERALA : TRENDS AND EXPLANATIONS
K. K. SubrahmanianE. Abdul Azeez
Centre for Development Studies
Thiruvananthapuram
November 2000
The authors express thanks to Mr. Suresh Babu for his comments. Theyare also grateful to the participants, particularly Prof. K.N Raj and Dr.K.P Kannan, who offered critical comments on an earlier version of thispaper presented at an open seminar on 27th October 2000 at the Centrefor Development Studies. The usual disclaimers follow.

ABSTRACT
The study traces the trends in industrial growth against the backdrop
of the overall economic growth in Kerala under the influence of the
ongoing economic reforms and evaluates it against the performance of
Karnataka, Tamilnadu and all-India. The analysis reveals that a phase of
growth revival has set in the overall economy since the late eighties.
Though the manufacturing industry has improved its growth performance
over time, the growth rates recorded during the nineties are not higher
than the corresponding figures for the eighties. The relatively low growth
profile of the manufacturing industry, when the general economy is
growing remarkably well, appears a riddle of the recent growth trends
under the reform process in Kerala. It is argued that inadequate growth
of investment has constrained the pace of modernisation of old units and
establishment of new units based on ‘state-of-art’ technology needed for
the survival and growth of industries in a globally competitive
environment. The study suggests that the lack of a clear and pragmatic
approach of the state in its response to the reform process and a positive
attitude in its own policies for encouraging private investment makes
Kerala a less investor friendly location for manufacturing industry. It
underlines the need for a new vision and strategy, which could fully
utilise Kerala’s comparative advantage in human resources, and place
greater emphasis on developing knowledge-based and service industries,
for accelerating the growth of income and employment in industry.
JEL Classification: R11, O47
Key words: India, Kerala economy, industrial stagnation, manufac-turing growth, economic reforms, service industry.

4
Introduction
Although Kerala is a small state-region in a large multi-regional
economy its remarkable experience in development has received an
enviously large space in the literature. This is not due to Kerala’s
achievement in economic growth but to wit, due to lack of it! A thought
provoking finding1 of a pioneering study on Kerala’s development policy
conducted more than two decades ago by the Centre for Development
Studies stimulated studies on various issues on Kerala’s development
including the ‘discovery’ of the much acclaimed “Kerala model” of
development. The central theme implicit in Kerala’s experience and the
“Kerala model”, of development is the capability of a society with
relatively low income to achieve high quality of living levels. This has
been subjected to severe scrutiny and the debates and discussions are
still alive in the literate2 . An important aspect of the debate has been the
limit to development arising from the relatively poor growth rates in the
productive sectors of the economy.
The critics of Kerala’s experience and “Kerala model” of
development have highlighted that the poor growth performance of
commodity producing sectors like agriculture and industry has resulted
in the slow down in the rate of growth in employment and income

5
generation within the state. It also has reduced the rate of growth in
government revenue and thereby investment in economic sectors and
expenditure on welfare programs. All these have tended to threaten the
sustenance of the achievements already made in health, education and
other human development spheres and the further efforts to improve the
quality of life and capability of the people. Thus viewed, there is a
development crisis in the state. And a view is gaining ground that the
accelerated growth of industry is one of the effective ways of resolving
the crisis.
In validating the relevance of this view, a number of intriguing
questions come up for scrutiny. Has there, in fact, been a prolonged
performance-crisis in the economy and its major commodity producing
sectors? What factors have led to the performance crisis? What is the
growth potential particularly, in the industrial sector? What should be
the vision on the type, pattern and direction of industrial development in
the state? On pragmatic consideration, answers to these questions have
to be sought within the framework of the recent paradigm drift in the
development policy of Central government. This paper is an attempt to
review the recent growth trends in the industrial sector operating under
the influence of the ongoing economic reforms to provide a perspective
for seeking answers to some questions relating to Kerala’s development.
As the theoretical literature3 gives stress on the upward shift of
manufacturing in the process of economic development, the scope of
our study is limited to the analysis of growth trends in income generation
(value-added) by manufacturing activities in the industrial sector. The
analysis is carried out in a comparative framework in the sense that growth
trends in Kerala are traced over time and evaluated against the
performance of neighbouring states (Karnataka and Tamilnadu) and
all-India average.

6
The period of analysis is chosen in such a way that it would capture
growth trends of the manufacturing industry operating under the policy
framework of liberalisation and globalisation introduced since 1991.
Indeed, there is a time lag in the reflection of the growth-effect of
economic reforms and hence, the analysis ideally should cover the period
after say, mid-nineties. However, that option is not open to us, as the
period will be too short to avoid distorted estimates due to short-run
fluctuations. The study period should also enable tracing the trend in
industrial growth under the earlier policy of regulations for comparative
purpose. Besides, the period should be long enough to indicate the secular
trend to provide a perspective for assessing potential growth. Keeping
all these considerations in view, we have selected a 17-year period from
1981-82 to 1997-98 dividing it into two sub-periods (phases) viz. (a)
1981-82 to 1990-91 and (b) 1991-92 to 1997-98 for the analysis. The
choice of the terminal year is constrained by the fact that the relevant
data with 1980-81 as the base year are not available beyond 1997-98.
The analysis of the growth behaviour of industrial income
apparently seems to be a simple and straightforward issue. However,
there is no unique way of examining the matter. For, there are different
sources of data and hence there could be different rates of growth of the
same phenomenon leading to somewhat different conclusions on the
growth behaviour. The problem assumes complexity as different scholars
use different types of growth rates varying from mean of year-to-year
percentage changes to exponential growth rate. As our interest is on the
secular behaviour, the preferred choice is on the annual growth rates
estimated by fitting a semi-log (ln Yt = a + bt + e) trend4 for the total
period. And for the sub-period growth rates we use a kinked exponential
fit5 (a+b1 (D1t+D2k) + b2 (D2t-D2k)+ et). In cases where the problem
of auto-correlation is present, we use the Cochrane-Orcutt method to
make our results more robust.

7
The analysis is not confined to portray the macro profile of growth
but it also traces growth trends at micro levels of 2-digit industry-groups.
Thus, the study situates the relative growth trends in income generation
by Kerala’s manufacturing industry at macro as well as micro levels
operating under the influence of the ongoing economic reforms.
MACRO LEVEL GROWTH TRENDS
The literature on economic growth has generally postulated a close
correspondence between industrial growth and overall growth of an
economy. A very recent cross-country analysis6 has established that
industrial performance correlates with the overall performance of an
economy and therefore is the key sector in explaining the sustainability
of different regional patterns in overall productivity and employment
growth. We, therefore, trace the growth profiles of income generation
by manufacturing in Kerala against the backdrop of the trends in the
state’s overall economic growth.
Growth trends in net state domestic product (NSDP)
The analytical description of growth behaviour of the overall
economy of Kerala is given by showing the trends in the net state domestic
product (NSDP). A caveat needs to be added here. The estimates of net
domestic product do not account for the income received from the
emigrants’ remittances and to that extent do not correctly reflect the actual
economic position of the state-regions. This has serious implication in
respect of Kerala, which receives substantial inflow of remittances from
its emigrants working in other states and outside the country, especially
in the Gulf countries. To get a realistic picture of the economic prosperity
of Kerala, therefore, the estimates of NSDP have to be blown up by a
factor representing the emigrants’ remittances in each year. In the absence
of reliable year-to-year estimates of emigrants’ remittances to Kerala
and the neighbouring states, we are forced to proceed the analysis on the

8
basis of the conventional NSDP estimates provided by the CSO despite
their inherent limitation to reflect the actual economic status of the state-
regions especially that of Kerala.
We have traced the comparative picture of the movement in the
index of net domestic product at 1980-81 prices for Kerala and all-India
in graph A. It is seen that Kerala has moved along with all-India on a
stagnant path in the seventies. The all-India average picked up momentum
in growth and moved up at a faster rate relative to Kerala since the
mid-eighties. The acceleration in the growth movement in Kerala took
place later. Incidentally, the movement trend in the net domestic product
as depicted in the graph provides some empirical support to the a-priori
division of the total period into two distinct phases with the break in
19917 . It also endorses the finding of earlier studies8 on economic
stagnation in Kerala since the seventies.
Annual growth rates in NSDP in different periods are shown in
table 1. The secular growth rate in net domestic product of Kerala has
been far below the national average. However, the growth record of 6
per cent per annum in NSDP for the period since 1991-92 is an
encouraging sign. There is clear evidence of growth revival in Kerala
economy during the post-reforms era. It is also evident from the table
that in terms of secular trend, Kerala has a low growth profile as compared
to neighbouring states of Karnataka and Tamilnadu. However, its growth
achievement since 1991-92 is comparable. This is a promising sign of
Kerala’s potential for economic growth under the liberalisation policy
The rate of growth in absolute value of net state domestic product
has a limitation to measure the economic progress of a state-region, as it
is not adjusted for the size of population. The growth behaviour in per
capita income is a more appropriate criterion.

9
Growth trends in per-capita income
Estimates of annual growth rates in per capita net domestic product
(income) of Kerala are compared with the corresponding figures for
Karnataka, Tamilnadu and all-India in table 2. The secular trend in the
growth behaviour of Kerala is more or less same as that of all-India and
neighbouring states. Kerala’s economic progress measured in terms of
growth in per-capita net state domestic product since 1991-92 is more
impressive than that of neighbouring states and all-India average.
However, it must be noted that even then in 1996-97 the level of real per
capita income (at 1980-81 prices) in Kerala (Rs.2363) stands below that
of Karnataka (Rs.2641), Tamilnadu (Rs.2880) and all-India (Rs.2761).
Needless to say, the real picture may be more promising if the migrants’
remittance is also accounted for in the estimates of per capita income in
Kerala.
Table 1. Annual growth rates of Net Domestic Product
Period Kerala Karna- Tamil Alltaka nadu India
1971-2 to 1980-1 3.43 - - 3.44
1981-2 to 1990-1 4.83 5.39 5.35 5.36
1991-2 to 1997-8 6.05 5.46 6.26 5.64
1971-2 to 1990-1 2.88 - - 4.30
1981-2 to 1997-8 4.90 5.41 5.65 5.38
Note: All are statistically significant at 5 per cent level.
Source: Calculated using CSO data on National Accounts Statistics
collected from EPW Research Foundation and RBI Handbook
of Statistics.

10
Table 2. Annual growth rates of per-capita Net Domestic Product
Period Kerala Karna- Tamil Alltaka nadu India
1981-2 to 1990-1 3.39 3.51 4.37 3.23
1991-2 to 1996-7 5.10 4.02 4.90 3.80
1981-2 to 1996-7 3.57 3.65 4.58 3.36
Notes and Source as in table 1
On the whole, the analysis of growth trends in net state domestic
product indicates that the phase of stagnation is over and a phase of
revival in economic growth has set in Kerala now9 . In terms of a general
conclusion, the post-reforms era is witnessing the revival of economic
growth in Kerala. Here, an interesting question comes up. Which
economic sectors have contributed relatively more towards the growth-
revival of Kerala economy? To shed some light on this question, we
examine growth rates of NSDP by economic activity.
Growth behaviour of NSDP by economic activity
For the analytical purpose in view, we have divided the state
economy into three sectors, namely, (1) agriculture (2) industry and (3)
services and estimated the annual growth rates recorded by each (see
table 3). It may be noted here that construction activity is included in
the service sector.
Table 3 Annual Growth rates in Net Domestic Product by
economic activity
Period Kerala All India Agriculture Industry Service Agriculture Industry Service
& allied & allied
1981-2 to 1990-1 3.67 4.55 4.35 3.21 6.71 6.381991-2 to 1996-7 5.86 5.04 7.91 3.17 6.85 6.47
1981-2 to 1996-7 4.45 4.52 5.53 3.29 6.77 6.64
Notes and Source as in table 1

11
It is seen that the service sector has recorded the highest average
annual growth rate for the period since 1991-92. It is higher than the
average for Karnataka and Tamilnadu also10 . It stands to reason that the
revival in economic growth in the nineties, as reflected in the growth
rate of NSDP, is largely accounted by the service sector11 . It is seen that
though the service sector is growing at a significant rate for all-India
also, it is accompanied by a significant growth rate of industry.
The role of service sector in the growth of Kerala economy is
further evident from the table 4 wherein we have decomposed the total
growth rates into the contribution of individual sectors. This is
accomplished using the methodology suggested by Chenery and Syrquin
(1986)12 .
Table 4. Sectoral contribution to total NDP growth, Kerala
Period Agriculture Industry Servicesand allied
1981-2 to 1990-1 31.87 17.43 50.70
1991-2 to 1996-7 29.27 11.68 59.05
1981-2 to 1996-7 31.32 14.30 54.38
Source as in table 1
It is observed that the contribution of service sector to total growth
has increased significantly in the nineties. The contribution of industry
is relatively marginal. It may be noted that the tertiary sector even when
defined in the conventional way (i.e. excluding construction) occupies
the largest share (45 per cent) in net domestic product in 1997-98 in
Kerala. This is higher than the average (42 per cent) at all-India. In
variance with the conventional growth theory, the tertiary (service) sector
is expanding fast without the secondary sector (industry) achieving
remarkable improvement in growth and size in Kerala.

12
Growth trends in manufacturing
Against the backdrop of the foregoing growth trends in the overall
economy, we analyse the growth behaviour of Kerala’s manufacturing
sector. There are many ways of looking at growth trends in income
generation by manufacturing in an Indian state. The easiest one is to
look into the data on the manufacturing component of the net state
domestic product. The secular trends in the movement of net domestic
product by manufacture in Kerala and all-India are depicted in graph B.
It is seen that the movement has been on a stagnant growth-path till the
mid-eighties both in Kerala and all-India. In the case of all-India, we
see acceleration in the movement thereafter. However, the acceleration
has taken place only towards the close of the eighties in Kerala.
We have recorded annual growth rates in net domestic product by
manufacture at 1980-81 prices in table.5. The emerging picture is one of
stagnation in growth rate of the manufacturing sector in Kerala in the
seventies. The growth performance has improved overtime though the
nineties has not seen the growth rate significantly higher than what it
was in the eighties. The strikingly disappointing trend is the fact that the
growth rates have been below the all-India averages for all the periods
under review.
Table 5. Annual Growth rates in Net Domestic Product by
Manufacture
Period Kerala Karnataka Tamilnadu All India
1971-2 to 1980-1 2.77 - - 4.37*
1981-2 to 1990-1 4.25* 15.1* 3.78* 6.52*
1991-2 to 1996-7 4.91* 12.31* 5.34* 7.15*
1981-2 to 1996-7 4.42* 14.4* 4.21 * 6.50*
1971-2 to 1996-7 3.78* - - 5.91*
Note: * indicates significance at 5 percent level.Other notes and Source as in table 1
13
The table also gives a comparative picture of the growth trends in
Kerala relative to Karnataka and Tamilnadu since 1981-82. It is observed
that the secular growth trend of income generation in Kerala does not
compare well with Karnataka though it matches with Tamilnadu. And,
the growth rate recorded in the nineties is far behind that of Karnataka
and all-India. This is not a promising sign of the growth performance of
the manufacturing industry in Kerala
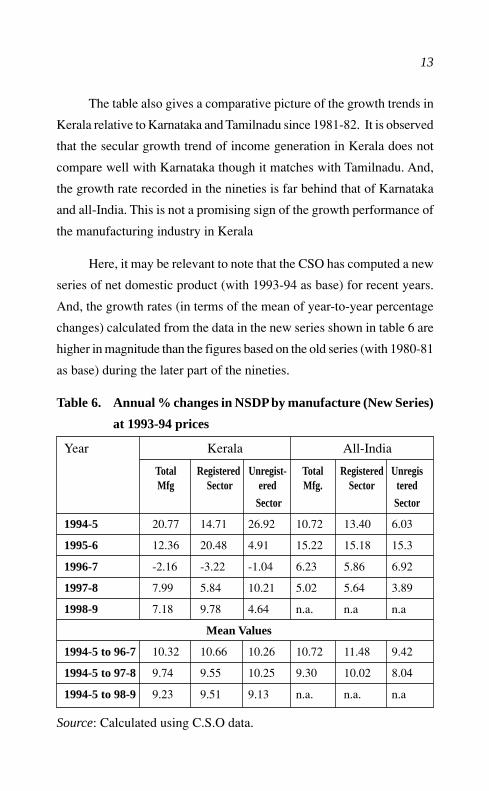
Here, it may be relevant to note that the CSO has computed a new
series of net domestic product (with 1993-94 as base) for recent years.
And, the growth rates (in terms of the mean of year-to-year percentage
changes) calculated from the data in the new series shown in table 6 are
higher in magnitude than the figures based on the old series (with 1980-81
as base) during the later part of the nineties.
Table 6. Annual % changes in NSDP by manufacture (New Series)
at 1993-94 prices
Year Kerala All-India
Total Registered Unregist- Total Registered UnregisMfg Sector ered Mfg. Sector tered
Sector Sector
1994-5 20.77 14.71 26.92 10.72 13.40 6.03
1995-6 12.36 20.48 4.91 15.22 15.18 15.3
1996-7 -2.16 -3.22 -1.04 6.23 5.86 6.92
1997-8 7.99 5.84 10.21 5.02 5.64 3.89
1998-9 7.18 9.78 4.64 n.a. n.a n.a
Mean Values
1994-5 to 96-7 10.32 10.66 10.26 10.72 11.48 9.42
1994-5 to 97-8 9.74 9.55 10.25 9.30 10.02 8.04
1994-5 to 98-9 9.23 9.51 9.13 n.a. n.a. n.a
Source: Calculated using C.S.O data.

14
It seems that Kerala’s growth rate in NSDP by manufacture looks
highly impressive in the recent years when the new series of NSDP data
is used for calculation13 . A word of caution is, however, warranted. The
observations are too few to draw a firm conclusion on the growth-trend.
The mean value of year-to-year percent changes for the total manufactures
in Kerala appears only equals to and not significantly higher than, the
national average. And in the registered sector the average growth rate in
Kerala is slightly lower than all-India. In short, the growth record of
Kerala’s manufacturing industry in the more recent years is indeed
impressive when the estimation is made on the basis of CSO’s new series
of NSDP and yet it is not high enough to vouch for a remarkable growth
performance under the ongoing economic reforms14 .
Thus far, the analysis has been based on the data on net state
domestic product by manufacturing sector as a whole. As manufacturing
activity is carried out both in the registered (formal) and unregistered
(informal) sectors, and the major chunk of output must have come from
the former, a detailed look into the growth behaviour of the registered
manufacturing sector is warranted. This is done by analysing growth
rates in net value added (NVA) by manufacturing in the factory sector
based on the data from the Annual Survey of Industries (ASI).
Growth behaviour of manufacturing in factory sector
The data in the Annual Survey of Industries relate to the industrial
units registered under the Factory Act, 1948. It covers factory units
engaged in manufacturing, electricity, gas, and water supply,
warehousing, repair services etc. spread over 25 two-digit
industry-groups. Strictly speaking, manufacturing in the factory sector
is to be defined to refer to activities confined to first 18 two-digit industry
groups of ASI-factory sector. We have re-constructed the ASI data for
the manufacturing industry as defined above for our analysis. It must be

15
noted that there would be differences in the growth rates estimated on
the basis of NSDP data for the registered manufacturing sector and ASI
data on value-added by manufacturing in the factory-sector because of
the differences in the definitions used by the two data sources15 .
We compare in table 7 the annual average growth rates in net
value-added by the manufacturing industry and note some disturbing
features. In particular, we note that the secular growth rate of Kerala is
lower than that of Karnataka, Tamilnadu and all-India when we consider
the registered segment (factory sector) of manufacturing. More
significantly, its record of growth rate even in the second phase (1991-92
to 1997-98) representing the post-reforms era is lower than that of
Karnataka and all-India. The lack of growth buoyancy in value-addition
(income) by manufacture in Kerala in the nineties is clearer when we
compare it with its own growth performance in the eighties. The relevant
growth rate during 1991-92 to 1997-98 is not higher than what it was
during 1981-82 to 1990-91. Interestingly, the growth rate in
value-addition during the nineties is not higher than the eighties in
Karnataka and Tamilnadu also.
Table 7. Annual growth of NVA by manufacturing in factory sector.
1981-2 to 1990-1 1991-2 to1997-8 1981-2 to 1997-8
Kerala 5.77 5.39 5.65
Karnataka 7.71 7.24 7.55
Tamilnadu 7.94 7.08 7.66
All India 6.51 9.06 7.79
Notes as in table 1
Source: Calculated using data from various issues of Annual Survey of
Industries.

16
Here, there is no intention to draw a general conclusion that
economic reforms based on the logic of liberalisation and globalisation
are not growth promoting in the manufacturing sector. However, it must
be said that there are regional variations in the growth-promoting impact
of the ongoing economic reforms. We would also like to underline the
inadequate empirical evidence to support the generally presumed
growth-stimulating effect of the ongoing economic reforms in the
manufacturing industry at-least in the case of Kerala.
Having found the relatively low growth profile of income
generation by the manufacturing industry at macro level in Kerala and
that too at a time when the general economy is growing fast relative to
neighbouring states and all-India, the immediate temptation is to traverse
the tough terrain of an explanation. This is but a task of tall order and
requires an understanding of the growth dynamics at micro-level
industries. We therefore turn to trace the growth trends in specific
industries that constitute the core of manufacturing in the factory sector.
INDUSTRY-WISE GROWTH TRENDS
This is done by estimating the growth rates of net value added by
the 2-diigit industry-groups engaged in manufacturing in ASI factory
sector. Here, it is useful to have in mind a picture of the relative shares
of specific industries in the aggregate industrial income. Therefore, we
first highlight the salient features of the industrial structure of Kerala as
compared to neighbouring states and all-India.
Structure of manufacturing industry
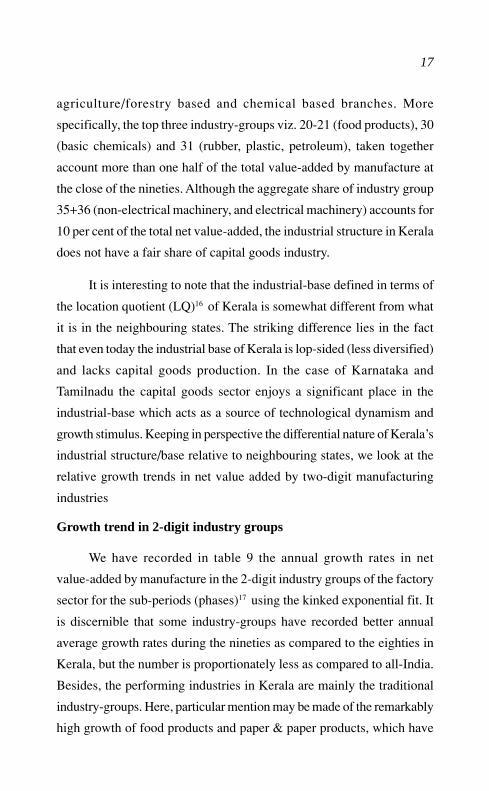
We have shown in table 8 the share of each 2-digit industry-group
in the aggregate value-added by manufacture in the factory sector of
Kerala, its neighbouring states and all-India in 1997-98. It is seen that
dominant industry-groups in Kerala even today belong mainly to
17
agriculture/forestry based and chemical based branches. More
specifically, the top three industry-groups viz. 20-21 (food products), 30
(basic chemicals) and 31 (rubber, plastic, petroleum), taken together
account more than one half of the total value-added by manufacture at
the close of the nineties. Although the aggregate share of industry group
35+36 (non-electrical machinery, and electrical machinery) accounts for
10 per cent of the total net value-added, the industrial structure in Kerala
does not have a fair share of capital goods industry.
It is interesting to note that the industrial-base defined in terms of
the location quotient (LQ)16 of Kerala is somewhat different from what
it is in the neighbouring states. The striking difference lies in the fact
that even today the industrial base of Kerala is lop-sided (less diversified)
and lacks capital goods production. In the case of Karnataka and
Tamilnadu the capital goods sector enjoys a significant place in the
industrial-base which acts as a source of technological dynamism and
growth stimulus. Keeping in perspective the differential nature of Kerala’s
industrial structure/base relative to neighbouring states, we look at the
relative growth trends in net value added by two-digit manufacturing
industries
Growth trend in 2-digit industry groups
We have recorded in table 9 the annual growth rates in net
value-added by manufacture in the 2-digit industry groups of the factory
sector for the sub-periods (phases)17 using the kinked exponential fit. It
is discernible that some industry-groups have recorded better annual
average growth rates during the nineties as compared to the eighties in
Kerala, but the number is proportionately less as compared to all-India.
Besides, the performing industries in Kerala are mainly the traditional
industry-groups. Here, particular mention may be made of the remarkably
high growth of food products and paper & paper products, which have
18
achieved growth rates higher than the eighties and also higher than
all-India averages.
However, the growth rates of the capital goods and modern
manufacturing industries both in the eighties and the nineties are relatively
low as compared to all-India. In addition, most of the industry-groups,
which have been doing better at all-India level in the nineties, are growing
slow in Kerala. The decline in the rate of growth of industry groups 31
(rubber, plastic etc), 35+36 (machinery) and 38 (other manufactures)
illustrates this point.
As for the relative growth performance compared to neighbouring
states in the post-reforms era, the top performing industries in Kerala
are different from the ones in Karnataka and Tamilnadu. There is another
striking shade in the comparative picture. This is Kerala’s relatively poor
performance in the capital goods and modern manufactures as compared
Note: Industry codes are given in brackets. LQ = Location Quotient.
Source as in table 7
Table 8. Industrial Structure/ Base of manufacturing in 1997-8
Shares in total value added by manufacture at current prices

19
to neighbouring states. It is also significant to note that Kerala has
recorded sharp decline in the growth rate in respect of industry-groups
30 (basic chemicals) and 31 (rubber, plastic etc.) in the nineties as
compared to the eighties. The impact of this deterioration must have
been damaging to overall growth performance in Kerala, as these are
major constituents of its industrial structure.
On the whole, the analysis of growth trends of 2-digit
industry-groups gives us an insight into the relatively low growth rates
observed at the macro-level. It seems that the relatively low growth rate
during the post-reforms period is the net outcome of the remarkably
high growth rates in a few and depressingly low growth rates in a large
number, of manufacturing industries in Kerala. In striking contrast, the
Table 9. Annual growth rates (exponential) of Net Value Added in2-digit industry-groups of factory manufacturing in
Kerala and All India
Note: X=negligible. * indicates significance at 5% level. For decodingindustrial classification see table 8.
Source as in table 7

20
relatively better macro growth performance of the manufacturing industry
in Karnataka and Tamilnadu is accounted by the good performance record
of a wider set of industries including capital goods and modern
manufactures.
The findings on the recent growth-trends of 2-digit industry groups
lend support to draw a general conclusion. The growth-effect of the
on-going economic reforms based on liberalisation and globalisation
varies across the industries and how the macro growth profile of a
particular region get shaped will depend upon the types of industries in
its industrial structure. Here there is an implicit indication of the
approaches (e.g. the relevance of industry-structure) for explaining the
observed growth-trends in income generation by the manufacturing
industry in Kerala.
Indeed, it is beyond the scope of this paper to provide a detailed
examination of the factors responsible for the relatively slow growth of
the industrial sector in Kerala. However, it may not be fully meaningful
for policy to leave here the descriptive analysis of the growth trends in
isolation. We may, therefore, seek an approach towards explaining the
relative lag in industrial growth rate observed in Kerala at a time when
its general economy is witnessing remarkable growth as compared to
the neighbouring states and all-India during the post-reforms period.
LAGGING INDUSTRIAL GROWTH: AN EXPLANATION
In this regard we first examine a-priori relationship between
economic reforms and industrial growth in a regional economy. One of
the ingredients of the reform process is external liberalisation
(globalisation). This is the shift from a restrictive and inward-oriented
to a liberal and outward-oriented foreign-trade regime. The liberal trade
regime implies unrestricted import and sharp reduction in the customs-

21
tariff of commodities. Therefore, there is the potential danger of dumping
and unfair competition from MNCs adversely affecting the survival and
growth of domestic industries. This may lead to a process of “de-
industrialisation” in some state-regions. The gravity of this “negative”
effect of the reforms on a specific region-state will depend upon the
commodity composition and reduced tariff structure of the imports and
the product-structure of the industrial structure of the state-region. If
the given region’s industrial structure is composed of products that are
“freely” importable under the reform-process, it runs the risk of a falling
into a crisis of de-industrialisation. The resolution of the crisis lies partly
in increased investment on plant modernisation, product diversification
and technological innovation to make local industries globally
competitive.
Viewed in the above perspective, Kerala is placed in a
disadvantageous position because of the nature of its industrial structure.
For, the products of its many industries (e.g. chemical and rubber based
industries), are unable to meet the stiff competition from the imports on
reduced tariff resulting into financial losses and sometimes even lock-
out of local production. It is interesting to note here that proportionately
a large number of 2-digit product-groups in Kerala recorded relatively
slow growth rate as compared to neighbouring states in the post-reforms
period (see table 9). Most of these industries are the ones set up earlier
under the protective umbrella of import-substitution trade–regime. With
the removal of protection under the reform-process, they may have been
made non-competitive to survive and grow under the globalisation. This
may be particularly true in those industries which miss to make
investment for plant-modernisation, technology up-gradation and product
diversification. Detailed case study of specific industries is needed to
assess the full dimension of the problem. In the absence of such micro-
level studies, we may analyse the relative growth- rates in the fixed capital

22
investment of 2-digit industries in Kerala as compared to all-India to
shed some light on the issue.
Growth trends in fixed capital
The estimate of annual growth rates in fixed capital in 2-digit
industry-groups in Kerala and all-India are traced in table 10. It appears
that the rate of growth in fixed capital in Kerala’s manufacturing sector
as a whole is far less than all-India average particularly during the post-
reforms period. And interestingly, only one industry-group viz. 20-21
has had the benefit of significantly higher growth in fixed capital in
Kerala. This industry group (food products), as said earlier, has also
recorded higher secular annual growth rate in NVA as compared to all
India average. It is also instructive that the growth rate in fixed capital
has been significantly lower than all-India average in the cases of capital
goods and modern manufacturing industries, where the growth rate in
value-added by manufacture has been much below the all-India average.
To generalise, there is symmetry by and large between the growth
performance of fixed capital and value-addition. The industry-groups,
which recorded higher growth rate in fixed capital, have shown better
growth performance in value-addition in the nineties as compared to the
eighties. And the industry-groups, which recorded poor growth
performance in value-addition, are mainly the ones, which have exhibited
lower annual growth rate in fixed capital during the nineties as compared
to the eighties. The available pieces of evidence thus suggest a positive
causal relationship, at least association, between the growth-rates of fixed
capital and income generation in the manufacturing industries.
In the case of Kerala it is plausible that the inadequate capital
investment for modernising the old industrial units and setting up new
industries based on modern technology could be one of the important

23
Table 10. Annual growth rates (exponential) of Fixed Capital in 2-
digit industry-groups Manufacturing industries in Kerala
and All-India
Ind. Code Kerala All India
1981-2 to 1991-2 to 1981-2 to 1991-2 to
1990-1 1997-8 1990-1 1997-8
20-21 10.25* 21.78* 8.30* 13.65*
22 7.16* 11.85* 11.99* 15.29*
23 2.67 16.76* 23.7 19.73*
24 X X 9.48* 17.31*
25 X X 7.79* 2.65
26 -10.3 25.46 13.57* 24.72*
27 -4.79 12.07 3.85* 15.57*
28 -8.89 11.68* 3.49* 14.86*
29 X X 10.06* 13.97*
30 9.73* 2.62 21.36* 17.01*
31 4.02* 9.30 -3.27 13.79*
32 11.82* 8.69 11.65* 9.89*
33 9.20 10.09* 8.07* 10.80*
34 3.87 1.30 9.62* 17.49*
35-36 3.21* 4.41 8.01* 10.00*
37 7.47* -4.55* 4.10* 13.01*
38 8.52 -18.70 11.74* 15.77*
Mfg. 3.19* 8.78* 7.84* 13.69*
Notes and source as in table 9

24
causes for the relatively slow growth rates of manufacturing industries
in the post-reforms period. And, the relatively low growth rates of fixed
capital imply the shyness of capital-investment to flow into Kerala’s
manufacturing sector.
Shyness of Capital-flow
The table 11, showing Kerala’s share relative to Karnataka and
Tamilnadu in all-India industrial investment proposals etc. in the nineties,
gives evidence of the shyness of capital to flow into Kerala’s industry.
The relative shares of Kerala in the investment proposals and FDI
approvals are very insignificant as compared to that of neighbouring
states. Here it is relevant to note that the recent CII study on “How the
States Are Doing?” has placed Kerala at a very low rank (13th among 18
states) in terms of investment climate. It stands to reason that some
region-specific factors make Kerala less investor-friendly and inhibit
the flow of capital from within and outside the state for industrial
investment. The inadequate capital-investment in turn makes the industry
lag in growth-rate even when its general economy is growing remarkably
well in Kerala relative to neighbouring states and all-India. Then a
question comes up for inquiry. What are these region-specific factors
that make Kerala a less-investor friendly location for industrial
investment? Obviously, a detailed study of the supply constraints in the
markets for inputs like land, labour, fuel and infrastructure and above all
the state policies is needed to identify the major region-specific factors
limiting the inflow of industrial investment into Kerala. We may however
make here some general observations on the behaviour of two important
factors only viz., labour and state policy that influence the nature of
investment climate.

25
Table 11. States’ Share (%) in all-India industrial investment
proposals (Aug. 1991 to Apr. 2000)
Region IEM LoI Total FDI* investment proposal
Kerala 0.90 2.39 1.07 0.30
Karnataka 4.61 8.83 5.10 7.55
Tamilnadu 6.34 10.10 6.77 5.27
Andhra Pradesh 7.12 9.67 7.41 4.14
Others 81.03 69.0 79.6 82.6
Note: * = Figures from August 1991 to December 1999. IEM= IndustrialEntrepreneur Memorandum, LoI = Letter of Intent, and FDI= ForeignDirect investment.
Source: Government of India, SIA Statistics
Labour problem
In the popular perception and even in some academic discussions
the labour problem is more often seen as the major factor responsible for
the shyness of capital-investment to move into industry in Kerala. It has
been argued in some circles18 that the labour, unionised under political
patronage, is militant in behaviour and is successful in bargaining for
higher wages and opposing modernisation by using pressure-tactics. The
labour militancy results in industrial unrest and high wage-cost with
low productivity. To the entrepreneur, the production cost is made higher
and the rate of return on investment is reduced as compared to other
competing regions. Besides, there is the high “psychic” cost of managing
the labour relations in an environment of multiple unions with rivalries
for short-run gains. The entrepreneur tends to form the perception of
Kerala as a “labour-problem state” and attaches high risk-premium to it

26
as a location for industrial investment. This perception, when spreads
among entrepreneur class, projects a less investor-friendly climate
(environment) and limits industrial investment in Kerala.
Indeed, there is a forceful logic in the above argument, which has
been scrutinised in the literature though without leading to a consensus
view. Without entering into this debate we may put on board some facts
on wages and industrial disputes in the recent years in the organised
manufacturing sector in Kerala. On the basis of the data from the ASI,
we have worked out in the table 12 wages per man-day paid to the workers
in the manufacturing sector as a whole since 1980-81.
Table 12. Wage rates in registered Manufacturing sector (in Rs.)
Note: Wage rates are obtained by dividing the total wages to workers by
total mandays workers
Source as in table 7

27
It appears, nominal wage paid to workers in Kerala is not higher
than what it is in the neighbouring state of Karnataka and all-India in
almost all the years. Interestingly, Kerala is not favourably placed vis-à-
vis Tamilnadu in terms of wage-cost for industrial location. Perhaps, the
product-wage rate is a more reliable indicator than money-wage rate to
reflect upon the comparative labour-cost advantage of the regions. We
have also given in table 12 the information on product wage obtained by
deflating money wage by output prices. Here again, the relative position
of Kerala is not much different from that of nominal wage. The popular
notion of relatively higher wage in Kerala does not have clear empirical
support as far as the manufacturing sector as a whole is concerned.
A more refined way of assessing the relative competitiveness of a
region for industrial location lies in tracing the movement of “efficiency
wage”. On the lines suggested by Kaldor19 the index of money wages is
divided by the index of labour productivity to arrive at the efficiency
wage and the resultant ratios are shown in table 13. The movement in
the ratio does not present Kerala as a location whose location-advantage
is eroded by increasing wage with unmatched (low) productivity. The
trend indicates increasing competitiveness of Kerala for industrial
location though the neighbouring states are placed relatively better at
margin in this regard20 .
It must be noted that the foregoing observations on wage relatives
are based on the macro-level data for the registered manufacturing sector.
Of-course, there may be variations across industries. And the macro
picture of lower wage scenario in Kerala may be due to the dominance
of low-wage labour-intensive traditional industries in its industrial
structure. It is plausible that wages are relatively higher in such industries
as capital goods which have low shares in the aggregate output in Kerala
as compared to Karnataka and Tamilnadu. Without a detailed study of

28
the relative wages occupation-wise and product-group wise, no firm
conclusion on the relative labour-cost disadvantage due to labour-
militancy in Kerala can be drawn.
With regard to the popular perception of labour militancy disturbing
industrial peace in Kerala, the incidence of industrial strike/lock-out and
the consequent mandays lost need to be examined. Here it suffices to
say that the data on the number of strike/lockout, mandays lost and other
Table 13. Efficiency Wages (Workers) in registered Manufacturing
Year Kerala Karnataka Tamilnadu
1981-2 1.00 1.00 1.00
1982-3 0.88 1.07 0.93
1983-4 0.90 0.90 0.97
1984-5 0.82 1.09 0.86
1985-6 0.95 0.95 0.93
1986-7 0.91 0.97 0.92
1987-8 0.83 0.96 0.97
1988-9 0.84 0.96 0.87
1989-90 0.66 0.78 0.80
1990-1 0.88 0.76 0.72
1991-2 0.80 0.68 0.75
1992-3 0.75 0.75 0.76
1993-4 0.89 0.72 0.64
1994-5 0.93 0.65 0.65
1995-6 0.80 0.70 0.67
1996-7 0.85 0.61 0.67
1997-8 0.89 0.64 0.78
Note: Efficiency wages are obtained by dividing the index of moneywages by the index of labour productivity.
Source as in table 7

29
relevant variables as reported in the Labour Year Book no longer present
Kerala as location with high incidence of industrial unrest21 . It is also
relevant to note that Kerala has scored 8th rank among 18 states and is
placed much above Karnataka (11th rank) in terms of labour factor
performance in a very recent CII study. There is no intention to assert
here that there are no labour problems in Kerala. Indeed there are complex
cases of strikes and other forms of labour struggles in particular industries
and at particular times. In particular, the rough behaviour of head-load
workers (“attimari”), the struggle of construction workers at the
construction-sites for regular jobs in the factory, organised pressures for
job-reservation for the locals etc. are problematic to the entrepreneurs.
This unpleasant situation is but manifestation of the acute unemployment
and not necessarily the reflection of “militancy” as an attribute of labour-
class in Kerala.
In the light of the above general observations on the relative
incidence of industrial wages and strikes in Kerala it does not appear
realistic to continue perceiving Kerala as a labour-problem state. It seems
that labour-unions and political parties giving patronage to them have
relaxed their rigid views and have become more pragmatic than dogmatic
in their approaches to capital-labour relations. As pointed out by Heller
Patrick, “the collective power of the working class has been incorporated
within the state and militant mobilisation has been given way to mediated
coporatist arrangements” in Kerala22 . If a holistic view is taken, there
are no clear empirical evidence to assert that the labour-militancy is the
major factor that continues to inhibit entrepreneurs, existing and potential
to make capital investment in Kerala industry. What then is the main
factor that makes an inclement investment climate in Kerala industry?
Perhaps, a critical scrutiny of the policy-approach of the state and
the attitude of the bureaucracy towards market-liberalisation and private

30
sector investment including multinational corporations in Kerala industry
may provide an answer. We may make some general observations in this
regard23 .
State’s policy and bureaucracy
One of the important ingredients of the reform-process is the
internal liberalisation, which means removal of government controls and
regulations and leaving the entry and operation of private sector
enterprises into industry on the logic of market forces. Thus, the
entrepreneurs do not now require most licenses and permits, which were
mandatory prior to the reform-process, from the central government.
However, this process of liberalisation has not fully percolated down
into the administrative systems of the state and local-self governments
in many states. Kerala can be regarded as one such state. This view may
be elaborated below.
The state’s industrial policy has been saddled with instability and
discontinuity in the basic thrust, as the governance of the state has been
alternating between two groups (coalition) of political parties led by the
Congress and the Marxists. The lack of continuity in the basic thrust has
created a sense of uncertainty among investors leading to a cautious
approach towards investing in Kerala industry.
The policy thrust in any given period has reflected not only the
ideological stance of the ruling political parties but also how it has
manipulated region-specific factors to the benefit of certain class in the
context of industrialisation. To illustrate, 1991 UDF’s industrial policy
has set aside the strategy of public sector led industrialisation and
preferred the liquidation and privatisation of the public sector
undertakings. In contrast, 1998 LDF policy adopted a pro-public sector
thrust and stressed the conversion of loss-making public sector

31
undertakings into performing assets and revival of sick units. To illustrate
the differential approach on region-specific factors, 1991 policy took
note of the entrepreneurs’ perception on labour militancy and declared
restrictive labour practices including “attimari” as criminal offences.
On the other hand, the 1998 LDF policy did not consider the labour-
problems adversely affecting the industrial growth and did not come in
the way of the rights to strike and class struggle of the labour.
The state policy in all the periods, irrespective of the political colour
of the ruling parties, offered fiscal incentives, tax concessions and other
assistance of the types and levels available in the neighbouring states.
However, the response of the investors has been relatively poor in Kerala
because of the administrative inefficiency and delayed delivery of the
benefits. More often than not the policy promises were never fulfilled in
time and creditability of the government was put to stake.
The last point takes us to comment upon the bureaucracy.
Notwithstanding the liberalisation policy of the reform-process, at present
a number of different “clearances” are to be secured and a number of
different agencies are to be approached for this at the state and local
self-government levels. In general, the bureaucracy treats anyone
approaching for “clearance” or “assistance” with suspicion and puts
forward procedural blockades instead of resolving investors’ problems
with a constructive approach.
In short, there is no co-ordinated commitment by the political
parties and there are no clear-cut and consistent state-policies on the
role of market-liberalisation, competition and the private sector
investment including foreign investment in accelerating industrial growth
in Kerala. Added to this is the inertia of bureaucracy resulting in a negative
attitude. The lack of pragmatism in state policies and credibility of the
bureaucracy creates the crisis of confidence in the investors-existing and

32
potential, from within and outside – and leads them to consider Kerala
as a less-friendly location for industrial investment relative to the
neighbouring competing regions.
It seems, the resolution after a detailed review, to solve the problems
in the state’s response to the reform-process and in its own policies and
practices relating to private sector is urgent. Perhaps that is more critical
than the “labour problems” for improving the investment climate and
the consequent flow of capital-investment to stimulate industrial growth,
in Kerala. With this observation we have reached a stage to conclude
the discussions in this paper by giving a brief summary of the main
findings.
SUMMARY AND CONCLUSIONS
The aim of summarising the main findings is to provide a holistic
perspective against which the growth potential of industry in Kerala could
be assessed. In the perspective, we emphasise that the stagnation in
growth-rate observed in the seventies is over and a new phase of growth
revival has already set in Kerala economy during the post-reforms period.
This is an encouraging sign indicating the potential for industrial growth.
However, we note that the growth rates recorded in the manufacturing-
industry at macro level as well as in a large proportion of two-digit
industry-groups during the nineties are not higher than the corresponding
figures during the eighties. Clearly, Kerala experience does not provide
empirical support to the growth stimulating effect in the industrial sector
generally expected of the ongoing reform-process. In fact, the relatively
low growth profile in the manufacturing sector at a time when its general
economy is showing remarkable growth performance in Kerala as
compared to neighbouring states and all-India is a riddle of the recent
growth trends under the reform process. Indeed, the liberalisation of
imports, reduction of customs tariff and other free-market characteristics

33
of globalisation integral to the ongoing reform-process must have
adversely affected the growth profile of local industrial production. The
problem has become more complex due to the lop-sided (less diversified)
product-structure and inadequate growth rates in fixed capital investment
in the industries. The findings of the study also suggest the shyness of
capital from within and outside the state to flow into industrial investment.
The inadequate capital investment has constrained the pace of
modernisation of old units and establishment of new units and product-
lines based on state-of-the art technology needed for the survival and
growth of industries in a globally competitive business environment
created by the Central government policies pursued during the post-
reforms period.
There is an implicit conclusion emerging from the study. A less-
investor friendly climate in Kerala limits industrial investment flow into
the state. The latter in turn has led to a lag in the relative growth rate of
manufacturing income at a time when the general economy is going
through remarkable growth buoyancy. What makes Kerala a less-investor
friendly location for industrial investment? This emerges as the crucial
question needing detailed investigation. There is a suggestion in the
study that the popular notion of labour militancy, which leads to high
wage-cost and industrial unrest, as the critical factor is not fully based
on clear empirical evidence. And, there are indications of an
improvement over time of the competitiveness of Kerala in terms of
labour cost though the neighbouring states have still an advantage at
margin over Kerala in this regard. The study therefore points towards
the lack of a clear and pragmatic approach of the state in its response to
reform-process and a positive approach in its own policies for
encouraging private investment in the industry. These are the more potent
problems for review and resolution to improve upon the investment
climate and the resultant inflow of capital-investment in Kerala industry.
34
. Another implicit suggestion is the need for a new vision on
industrialising Kerala. If the overall economy is performing well despite
the lag in manufacturing growth on the basis of the remarkable growth
rate of the service sector, it is logical to re-read the old paradigm of
industrialisation based on manufacturing and form a new vision on the
direction and pattern of industrial development of Kerala. The new vision
could be able to take full advantage of Kerala’s comparative advantage
in knowledge generation and human resources development and on that
basis promote knowledge-based and service industries. The new vision
could be to transform Kerala as a value-added service provider in a
globally competitive environment.
Finally, there is no intention to conclude that Kerala has limited
potential for accelerated industrial growth. What is stressed is a change
in the very concept of industrialisation to refer widely to growth-
acceleration not only in conventional manufacturing industries but also
service industries. And, the priority has to be on accelerating the new
processes of, what is called, “servitisation”! The new vision should take
Kerala deep into “new economy” industries. If a broad consensus is
reached on the new vision, region-specific measures need to be identified
and implemented to make Kerala more investor-friendly and attract
investment from within and outside the state including foreign investment
for accelerated growth of income and employment in the “industry”.

35

36
Notes
1. The CDS study highlighted that Kerala, a relatively poor statejudged by the conventional per-capita income norm has made
fairly impressive advances in the spheres of health and education
and hence brought out improvements that had made a percepti-ble difference to the quality of life -- so also to the acquisition of
attitudes and skills that could help to accelerate development at
the next stage. (See CDS 1979).
2. See for example the series of articles recently appeared in the
Bulletin of Concerned Asian Scholars, Vol.30.
3. For example, Kuznets (1966) showed that the process of eco-
nomic development was always accompanied by a shift in the
labour force from low productivity agriculture to high productiv-ity manufacturing.
4. Mean values of yearly changes are also calculated and are pre-
sented in Appendix when dealing with the macro growth behav-iour for readers’ information. For obvious reasons there would
be difference in the magnitudes of the two types of ratios.
5. Estimated sub period growth rates by running two separate re-
gressions, reported in Appendix, also show a similar direction of
change. However, as the number of observations for the secondperiod is very few for a robust regression such growth rates can
be misleading. Boyce (1986) has suggested a kinked exponential
for removing such inconsistency in the case of exponential trendfunction. The major advantage of this method is that the sample
size and the degrees of freedom can be increased as result of
combining the sub periods. The increase in the sample size isdefinitely an advantage when the sub period estimation is based
on a very small sample size.
6. See Pieper (2000).

37
7. We have tested for the structural break in nineties using a Chow
test. The estimated F value (6.21) is significant at 5 percent levelshowing a structural change in NSDP.
8. For example, see State Planning Board (1989), Kannan andPushpangadan (1988) and Subrahmanian and Pillai (1987). For
a review of the literature on Kerala’s industrialisation, see Pillai
and Shanta (1997).
9. An earlier study has also noted the revival in Kerala economy in
the recent years. See Harilal and Joseph (2000).
10. The corresponding figures for Karnataka and Tamilnadu are 5.79
and 7.60 respectively.
11. Our analysis based on the Chow test also shows a significantstructural break in the service sector in nineties. The estimated F
value is 15.2 which is significant at 1- percent level.
12. Chenery and Syrquin (1986) had shown that the relation between
the aggregate and the sectoral growth can be derived by differen-
tiating with respect to time the definition of total output (the sumof sectoral output) V = ∑Vi, and expressing the result in growth
rate terms, gv=∑pigvi, where gvi and gv are the growth rates of
Vi and V respectively and the weights are sectoral output shares,pi=Vi/V.
13. The increase in the rate of growth in new series is attributable,
inter alia, to the inclusion of a few activities, which were hith-erto not covered under the purview of industrial production bound-
ary.
14. It is relevant to note here that a recent econometric analysis on
Kerala economy shows that there is no significant structural break
in the growth of industrial sector under liberalisation. SeePushpangadan (2000).

38
15. On this point see Appendix I of Ahluwalia (1991).
16. This is an economic base study concept and is a measure of the
relative concentration of a given industry in a given region as
compared to national aggregate of income (value-added) or em-ployment or any other relevant variable. It is defined as LQ =
[(vij/v
j)/(V
i/VN)] where v = value-added (income), i = ith indus-
try, j = jth region and N = nation(all-India). Industries with valueof location quotient greater than unity (LQ>1) constitute the in-
dustrial base of the state.
17. The sub period growth rates estimated using separate regressionsfor individual industries are also given in appendix.
18. See for example, State Planning Board (1984) and Kannan (1998).
19. See Kaldor (1970).
20. This is evidently not because of a high nominal wage in Keralabut due to the low capital intensity resulting in an underestima-
tion of labour productivity. Capital intensity in Kerala is found to
be growing at an insignificant rate.
21. The number of industrial disputes in Kerala has decreased from
68 in 1983 to 35 in 1997, while that of Karnataka and Tamilnadu
decreased from 59 to 26 and 242 to 232 respectively. Also themandays lost ratio (mandays lost as a percentage of total work-
able mandays) has declined from 0.72 to 0.36 in Kerala during
the same period, while in Karnataka and Tamilnadu it decreasedfrom 2.70 to 1.09 and 1.26 to 0.90 respectively.
22. Heller Pattrick (1995)
23. For a detailed discussion see Subrahmanian (2000).

39
References
Ahluwalia I.J (1991) ‘Productivity and growth in Indian Manufactur-
ing’, Oxford University Press, New Delhi.
Ahluwalia M.S (2000) ‘Economic Performance of States in Post-reforms
Period’, Economic and Political Weekly, May 6.
Boyce J.K (1986), ‘Kinked exponential models for growth rate estima-tion’, Oxford Bulletin of Economics and Statistics, 48 (4).
Centre for Development Studies (1975) ‘Unemployment and Develop-
ment Policy: A Case Study of selected Issues with reference to
Kerala’, United Nations, New York.
George K.K (1993) ‘Limits to Kerala Model of Development’, Centre
for Development Studies, Thiruvananthapuram.
Harilal K.N and Joseph K.J (2000), ‘Stagnation and Revival of Kerala
Economy: An Open Economy Perspective’, working paper No.
305, Centre for Development Studies, Thiruvananthapuram.
Heller P (1995) ‘From class struggle to class compromise: Redistribu-
tion and growth in a south Indian state’, The Journal of Develop-
ment Studies, 31(5), June.
Kaldor N (1970) ‘The case for regional policies’, Scottish Journal of
Political Economy, Nov.
Kannan K.P (1998) ‘Political economy of labour and development inKerala’, Economic and Political Weekly, 33(52), Dec. 26.
Kannan K.P and Pushpangadan K (1988) ‘Agricultural Stagnation and
Economic Growth in Kerala: An Exploratory Analysis’, Work-
ing Paper No.227, Centre for Development Studies,Thiruvananthapuram.
Kerala State Planning Board (1984) ‘Report of the High Level Commit-
tee on Industry, Trade and Power’, Vol. I and II, Government ofKerala, Thiruvananthapuram

40
Kerala State Planning Board (1989) ‘Towards an Approach to Kerala’s
8th Five Year Plan’, Government of Kerala, Thiruvananthapuram.
Kuznet S (1960) ‘Modern Economic Growth’, Yale University Press,
New Haven.
Pieper U (2000), ‘Deindustrialization and the social and economic
sustainability nexus in developing countries: Cross-country evi-
dence on productivity and employment’, The Journal of Devel-
opment Studies, 36 (4).
Pillai P.M and Shanta N (1997), ‘Industrialisation in Kerala: Status of
Current Research and Future Issues’ Centre for Development
Studies, Thiruvananthapuram.
Pushpangadan, K (2000), ‘Liberalization and structural change in Kerala:An econometric analysis’, Paper presented in the seminar on
“Economic Liberalization and Industrial Development in Kerala’
on 18th August at Cochin University of Science and Technology.
Rammohan K.T (2000) ‘Assessing Reassessment of Kerala Model’,
Economic and Political Weekly, April 8.
Subrahmanian K.K and Pillai P.M (1987) ‘Kerala’s Industrial Backward-
ness, Exploration of Alternative Hypothesis’, Economic and Po-
litical Weekly, April 5
Subrahmanian K.K (2000) ‘An investor friendly Kerala’,
Business@Kerala, part I and II, June 1, May 16.
Subrahmanian K.K (1990), ‘Development paradox in Kerala: Analysis
of industrial stagnation’, Economic and Political Weekly, Sept
15.
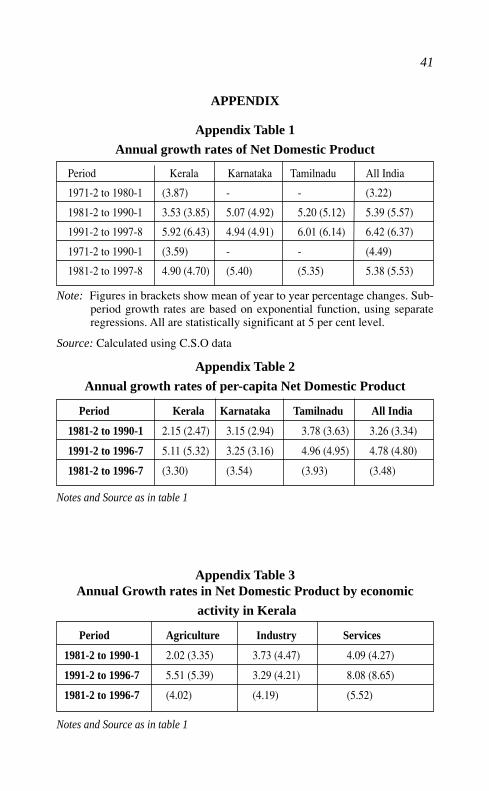
41
APPENDIX
Appendix Table 1
Annual growth rates of Net Domestic Product
Period Kerala Karnataka Tamilnadu All India
1971-2 to 1980-1 (3.87) - - (3.22)
1981-2 to 1990-1 3.53 (3.85) 5.07 (4.92) 5.20 (5.12) 5.39 (5.57)
1991-2 to 1997-8 5.92 (6.43) 4.94 (4.91) 6.01 (6.14) 6.42 (6.37)
1971-2 to 1990-1 (3.59) - - (4.49)
1981-2 to 1997-8 4.90 (4.70) (5.40) (5.35) 5.38 (5.53)
Note: Figures in brackets show mean of year to year percentage changes. Sub-period growth rates are based on exponential function, using separateregressions. All are statistically significant at 5 per cent level.
Appendix Table 2
Annual growth rates of per-capita Net Domestic Product
Period Kerala Karnataka Tamilnadu All India
1981-2 to 1990-1 2.15 (2.47) 3.15 (2.94) 3.78 (3.63) 3.26 (3.34)
1991-2 to 1996-7 5.11 (5.32) 3.25 (3.16) 4.96 (4.95) 4.78 (4.80)
1981-2 to 1996-7 (3.30) (3.54) (3.93) (3.48)
Notes and Source as in table 1
Appendix Table 3Annual Growth rates in Net Domestic Product by economic
activity in Kerala
Period Agriculture Industry Services
1981-2 to 1990-1 2.02 (3.35) 3.73 (4.47) 4.09 (4.27)
1991-2 to 1996-7 5.51 (5.39) 3.29 (4.21) 8.08 (8.65)
1981-2 to 1996-7 (4.02) (4.19) (5.52)
Notes and Source as in table 1
Source: Calculated using C.S.O data

42
Appendix Table 4Annual Growth rates in Net Domestic Product by Manufacture
Period Kerala Karnataka Tamilnadu India
1971-2 to 1980-1 2.47 (2.79) - - 4.57 (4.08)
1981-2 to 1990-1 3.42 (4.24) 14.63 (16.1) 4.40 (5.13) 7.29 (7.70)
1991-2 to 1996-7 3.34 (3.32) 11.37(11.6) 6.66 (6.82) 9.37 (9.07)
1981-2 to 1996-7 (4.20) (15.3) (4.85) (7.27)
1971-2 to 1996-7 (3.82) - - (6.16)
Notes and Source as in table 1
Appendix Table 5
Annual growth of NVA by manufacturing in factory sector.
1981-2 to 1990-1 1991-2 to1997-8 1981-2 to 1997-8
Kerala 6.40 (7.10) 6.41 (4.19) (7.15)
Karnataka 8.90 (11.71) 9.17 (7.54) (10.30)
Tamilnadu 7.43 (9.40) 6.25 (5.61) (7.30)
All India 6.74 (7.92) 9.83 (9.66) (7.85)
Notes as in table 1Source: Calculation based on data from various issues of ASI
Appendix Table 6Annual Growth rates (exponential) of Net Value Added in 2-digitindustry-groups of factory manufacturing inKerala and All India
Note: X=negligible. For decoding industrial classification see table 8. * indicatessignificance at 5 per cent level. Other Notes as in table 1.
Source as in table 5
*

43
CENTRE FOR DEVELOPMENT STUDIES
LIST OF WORKING PAPERS
(From 1991 onwards)
MRIDUL EAPEN Hantex: An Economic Appraisal.September, 1991, W.P.242
SUNIL MANI Government Intervention in Commercial Crop Development:A Case of Flue Cured Virginia Tobacco.November, 1991, W.P.243
K. PUSHPANGADAN Wage Determination in a Casual Labour Market: TheCase Study of Paddy Field Labour in Kerala.January, 1992, W.P.244
K.N. NAIR & S.P. PADHI Dynamics of Land Distribution: An AlternativeApproach and Analysis with Reference to Kerala.January, 1992, W.P.245
THOMAS ISAAC Estimates of External Trade Flows of Kerala - 1975-76 and1980-81.March, 1992, W.P.246
THOMAS ISAAC, RAM MANOHAR REDDY, NATA DUVVURRY Re-gional Terms of Trade for the State of Kerala.March, 1992, W.P.247
P. MOHANAN PILLAI Constraints on the Diffusion of Innovations in Kerala:A Case Study of Smokeless Chulas.March, 1992, W.P.248
R. ANANDRAJ Cyclicality in Industrial Growth in India: An ExploratoryAnalysis.April, 1992, W.P.249
T.M. THOMAS ISAAC, RAM MANOHAR REDDY, NATA DUVVURYBalance of Trade, Remittance and Net Capital Flows: An Analysis ofEconomic Development in Kerala since independence.October, 1992, W.P.250
M. KABIR, T.N. KRISHNAN Social Intermediation and Health Transition:Lessons from Kerala,October, 1992, W.P.251

44
SUNIL MANI, P. NANDAKUMAR Aggregate Net Financial Flows to India:The Relative Importance of Private Loan vis-a-vis Foreign Direct In-vestments.August, 1993, W.P.252
PULAPRE BALAKRISHNAN Rationale and the Result of the CurrentStabilisation Programme.November, 1993, W.P.253
K.K. SUBRAHMANIAN, P. MOHANAN PILLAI Modern Small Industryin Kerala: A Review of Structural Change and Growth Performance.January, 1994, W.P.254
DILIP M.MENON Becoming Hindu and Muslim : Identity and Conflict inMalabar 1900-1936.January, 1994, W.P.255
D. NARAYANA Government Intervention in Commodity Trade: An Analysisof the Coffee Trade in India.January, 1994, W.P.256
K.J. JOSEPH, P. NANDAKUMAR On the Determinants of Current AccountDeficits: A Comparative Analysis of India, China and South Korea.January, 1994, W.P.257
K.K. SUBRAHMANIAN, K.J. JOSEPH Foreign Control and Export Inten-sity of Firms in Indian Industry.February, 1994, W.P.258
PULAPRE BALAKRISHNAN, K. PUSHPANGADAN Total Factor Produc-tivity Growth in Indian Manufacturing - A Fresh Look.April 1994, W.P.259
D. NARAYANA, K.N. NAIR Role of the Leading Input in Shaping Institu-tions: Tendency in the Context of Irrigation Uncertainty.May, 1994, W.P.260
G. MURUGAN, K. PUSHPANGADAN Pricing of Drinking Water: An Ap-plication of Coase Two-part Tariff.December, 1994 W.P.261
MOHANAN PILLAI On the Mexican Crisis.December, 1995, W.P.262
SUNIL MANI Financing Domestic Technology Development through the Ven-ture Capital Route.December, 1995, W.P.263

45
T.T. SREEKUMAR Peasants and Formal Credit in Thiruvithamcore: TheState Institutions and Social Structure 1914-1940.December, 1995 W.P.264
AMITABH Estimation of the Affordability of Land for Housing Purposes inLucknow City, Uttar Pradesh (India): 1970-1990.March, 1996. W.P.265
K. PUSHPANGADAN, G. MURUGAN, K. NAVANEETHAM Travel Time,User Rate & Cost of Supply: Drinking Water in Kerala, India:June 1996. W.P.266
K.J. JOSEPH Structural Adjustment in India: A Survey of Recent Studies &Issues for Further Research,June 1996 W.P.267
D. NARAYANA Asian Fertility Transition: Is Gender Equity in Formal Occu-pations an Explanatory Factor?October, 1996 W.P.268
D. NARAYANA, SAIKAT SINHAROY Import and Domestic Production ofCapital Goods from Substitution to Complementarity,October 1996. W.P.269
NEW SERIES
W.P. 270 ACHIN CHAKRABORTY On the Possibility of a Weighting Sys-tem for Functionings December 1996
W.P. 271 SRIJIT MISHRA Production and Grain Drain in two inland Re-gions of Orissa December 1996
W.P. 272 SUNIL MANI Divestment and Public Sector Enterprise Reforms,Indian Experience Since 1991 February 1997
W.P. 273 ROBERT E. EVENSON, K.J. JOSEPH Foreign Technology Li-censing in Indian Industry : An econometric analysis of the choiceof partners, terms of contract and the effect on licensees’ perform-ance March 1997
W.P. 274 K. PUSHPANGADAN, G. MURUGAN User Financing & Col-lective action: Relevance sustainable Rural water supply in India.March 1997.
W.P. 275 G. OMKARNATH Capabilities and the process of DevelopmentMarch 1997
W. P. 276 V. SANTHAKUMAR Institutional Lock-in in Natural ResourceManagement: The Case of Water Resources in Kerala, April 1997.
46
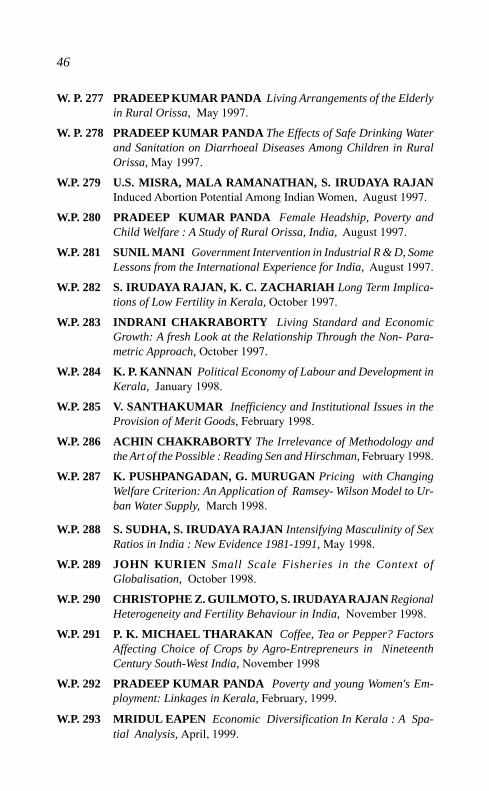
W. P. 277 PRADEEP KUMAR PANDA Living Arrangements of the Elderlyin Rural Orissa, May 1997.
W. P. 278 PRADEEP KUMAR PANDA The Effects of Safe Drinking Waterand Sanitation on Diarrhoeal Diseases Among Children in RuralOrissa, May 1997.
W.P. 279 U.S. MISRA, MALA RAMANATHAN, S. IRUDAYA RAJANInduced Abortion Potential Among Indian Women, August 1997.
W.P. 280 PRADEEP KUMAR PANDA Female Headship, Poverty andChild Welfare : A Study of Rural Orissa, India, August 1997.
W.P. 281 SUNIL MANI Government Intervention in Industrial R & D, SomeLessons from the International Experience for India, August 1997.
W.P. 282 S. IRUDAYA RAJAN, K. C. ZACHARIAH Long Term Implica-tions of Low Fertility in Kerala, October 1997.
W.P. 283 INDRANI CHAKRABORTY Living Standard and EconomicGrowth: A fresh Look at the Relationship Through the Non- Para-metric Approach, October 1997.
W.P. 284 K. P. KANNAN Political Economy of Labour and Development inKerala, January 1998.
W.P. 285 V. SANTHAKUMAR Inefficiency and Institutional Issues in theProvision of Merit Goods, February 1998.
W.P. 286 ACHIN CHAKRABORTY The Irrelevance of Methodology andthe Art of the Possible : Reading Sen and Hirschman, February 1998.
W.P. 287 K. PUSHPANGADAN, G. MURUGAN Pricing with ChangingWelfare Criterion: An Application of Ramsey- Wilson Model to Ur-ban Water Supply, March 1998.
W.P. 288 S. SUDHA, S. IRUDAYA RAJAN Intensifying Masculinity of SexRatios in India : New Evidence 1981-1991, May 1998.
W.P. 289 JOHN KURIEN Small Scale Fisheries in the Context ofGlobalisation, October 1998.
W.P. 290 CHRISTOPHE Z. GUILMOTO, S. IRUDAYA RAJAN RegionalHeterogeneity and Fertility Behaviour in India, November 1998.
W.P. 291 P. K. MICHAEL THARAKAN Coffee, Tea or Pepper? FactorsAffecting Choice of Crops by Agro-Entrepreneurs in NineteenthCentury South-West India, November 1998
W.P. 292 PRADEEP KUMAR PANDA Poverty and young Women's Em-ployment: Linkages in Kerala, February, 1999.
W.P. 293 MRIDUL EAPEN Economic Diversification In Kerala : A Spa-tial Analysis, April, 1999.

47
W.P. 294 K. P. KANNAN Poverty Alleviation as Advancing Basic HumanCapabilities: Kerala's Achievements Compared, May, 1999.
W.P. 295 N. SHANTA AND J. DENNIS RAJA KUMAR Corporate Statis-tics: The Missing Numbers, May, 1999.
W.P. 296 P.K. MICHAEL THARAKAN AND K. NAVANEETHAMPopulation Projection and Policy Implications for Education:ADiscussion with Reference to Kerala, July, 1999.
W.P. 297 K.C. ZACHARIAH, E. T. MATHEW, S. IRUDAYA RAJANImpact of Migration on Kerala's Economy and Society, July, 1999.
W.P. 298 D. NARAYANA, K. K. HARI KURUP, Decentralisation of theHealth Care Sector in Kerala : Some Issues, January, 2000.
W.P. 299 JOHN KURIEN Factoring Social and Cultural Dimensions intoFood and Livelihood Security Issues of Marine Fisheries; A CaseStudy of Kerala State, India, February, 2000.
W.P. 300 D. NARAYANA Banking Sector Reforms and the EmergingInequalities in Commercial Credit Deployment in India, March, 2000.
W.P. 301 P. L. BEENA An Analysis of Mergers in the Private CorporateSector in India, March, 2000.
W.P. 302 K. PUSHPANGADAN, G. MURUGAN, Gender Bias in aMarginalised Community: A Study of Fisherfolk in Coastal Kerala,May 2000.
W.P. 303 K. C. ZACHARIAH, E. T. MATHEW, S. IRUDAYA RAJAN ,Socio-Economic and Demographic Consequenes of Migration inKerala, May 2000.
W.P. 304 K. P. KANNAN, Food Security in a Regional Perspective; A Viewfrom 'Food Deficit' Kerala, July 2000.
W.P. 305 K. N. HARILAL, K.J. JOSEPH, Stagnation and Revival of KeralaEconomy: An Open Economy Perspective, August 2000.
W.P. 306 S. IRUDAYA RAJAN, Home Away From Home: A Survey of OldageHomes and inmates in Kerala, August 2000.
W.P. 307 K. NAVANEETHAM, A. DHARMALINGAM, Utilization ofMaternal Health Care Services in South India, October 2000.
W.P. 308 K. P. KANNAN, N . VIJAYAMOHANAN PILLAI, Plight of thePower Sector in India : SEBs and their Saga of InefficiencyNovember 2000.
W.P. 309 V. SANTHAKUMAR AND ACHIN CHAKRABORTY,Environmental Valuation and its Implications on the Costs andBenefits of a Hydroelectric Project in Kerala, India, November 2000.