global industry outlook report - gulfood 2020 · the gulfood global industry outlook report is an...
TRANSCRIPT

2019
GLOBAL INDUSTRY OUTLOOK REPORT


Contents6
12
24
47
35
48
INTRODUCTION
EXECUTIVE SUMMARY
GLOBAL SOCIAL AND ECONOMIC OUTLOOK
DECOMPOSITION OF F&B INDUSTRIES
GLOBAL FOOD AND BEVERAGES SECTOR
BEVERAGES INDUSTRY
INDUSTRY GROWTH .........................................................................................................................................................................................14
MARKET DRIVERS AND TRENDS ................................................................................................................................................................18
MARKET CHALLENGES AND OPPORTUNITIES ....................................................................................................................................19
VOICE OF THE INDUSTRY ........................................................................................................................................................................... 20
GLOBAL DYNAMICS OF DEMOGRAPHICS - OVERVIEW ................................................................................................................25
GLOBAL DYNAMICS OF DEMOGRAPHICS – DEVELOPED VS EMERGING MARKETS .......................................................26
GLOBAL DYNAMICS OF DEMOGRAPHICS – URBANISATION VS POPULATION GROWTH ............................................27
GLOBAL ECONOMIC OUTLOOK - OVERVIEW .....................................................................................................................................29
GLOBAL ECONOMIC OUTLOOK – GDP IN DEVELOPED VS EMERGING MARKETS .......................................................... 30
GLOBAL INCOME AND CONSUMER EXPENDITURE ..........................................................................................................................31
VOICE OF THE INDUSTRY ............................................................................................................................................................................ 33
GLOBAL F&B INDUSTRY OVERVIEW .......................................................................................................................................................36
GLOBAL F&B TRENDS .....................................................................................................................................................................................38
GLOBAL F&B DISTRIBUTION ........................................................................................................................................................................39
FUTURE OF RETAIL ......................................................................................................................................................................................... 40
GLOBAL PRIVATE LABEL FOOTPRINT ....................................................................................................................................................43
VOICE OF THE INDUSTRY ........................................................................................................................................................................... 45
BEVERAGES INDUSTRY – AT A GLANCE ............................................................................................................................48
MARKET SIZE AND POTENTIAL ..............................................................................................................................................49
MARKET TRENDS & DRIVERS ....................................................................................................................................................51
COMPETITIVE LANDSCAPE .......................................................................................................................................................52
DISTRIBUTION LANDSCAPE .....................................................................................................................................................53
CHALLENGES AND OPPORTUNITIES ...................................................................................................................................55
VOICE OF THE INDUSTRY ......................................................................................................................................................... 58
3

73
85
97
MEAT & POULTRY INDUSTRY
SEAFOOD INDUSTRY
PULSES, GRAINS & CEREALS
MEAT & POULTRY INDUSTRY – AT A GLANCE .................................................................................................................74
MARKET SIZE AND POTENTIAL ..............................................................................................................................................75
MARKET TRENDS & DRIVERS ...................................................................................................................................................77
COMPETITIVE LANDSCAPE .......................................................................................................................................................79
DISTRIBUTION LANDSCAPE .................................................................................................................................................... 80
CHALLENGES AND OPPORTUNITIES ....................................................................................................................................81
VOICE OF THE INDUSTRY ......................................................................................................................................................... 82
Seafood INDUSTRY – AT A GLANCE ......................................................................................................................................86
MARKET SIZE AND POTENTIAL ..............................................................................................................................................87
MARKET TRENDS & DRIVERS ................................................................................................................................................. 90
COMPETITIVE LANDSCAPE ....................................................................................................................................................... 91
DISTRIBUTION LANDSCAPE .....................................................................................................................................................92
CHALLENGES AND OPPORTUNITIES ...................................................................................................................................93
VOICE OF THE INDUSTRY ........................................................................................................................................................ 94
PULSES, GRAINS & CEREALS - AT A GLANCE .................................................................................................................98
MARKET SIZE AND POTENTIAL ..............................................................................................................................................99
MARKET TRENDS & DRIVERS .................................................................................................................................................. 101
COMPETITIVE LANDSCAPE ..................................................................................................................................................... 102
DISTRIBUTION LANDSCAPE ................................................................................................................................................... 103
CHALLENGES AND OPPORTUNITIES .................................................................................................................................104
VOICE OF THE INDUSTRY ....................................................................................................................................................... 106
61 DAIRY INDUSTRY
DAIRY INDUSTRY – AT A GLANCE .........................................................................................................................................62
MARKET SIZE AND POTENTIAL ..............................................................................................................................................63
MARKET TRENDS AND DRIVERS ............................................................................................................................................65
COMPETITIVE LANDSCAPE .......................................................................................................................................................66
DISTRIBUTION LANDSCAPE .....................................................................................................................................................67
CHALLENGES AND OPPORTUNITIES ...................................................................................................................................68
VOICE OF THE INDUSTRY ........................................................................................................................................................ 70

109 FATS & OILS
FATS & OILS - AT A GLANCE ................................................................................................................................................... 110
MARKET SIZE AND POTENTIAL ............................................................................................................................................. 111
MARKET TRENDS & DRIVERS ...................................................................................................................................................113
COMPETITIVE LANDSCAPE ...................................................................................................................................................... 114
DISTRIBUTION LANDSCAPE .....................................................................................................................................................115
CHALLENGES AND OPPORTUNITIES .................................................................................................................................. 116
VOICE OF THE INDUSTRY ........................................................................................................................................................ 118
121
133
COOKING INGREDIENTS INDUSTRY
CONFECTIONERY, SNACKS & READY-TO-EAT INDUSTRY
COOKING INGREDIENTS INDUSTRY – AT A GLANCE .................................................................................................... 122
MARKET SIZE AND POTENTIAL ............................................................................................................................................... 123
MARKET TRENDS & DRIVERS .................................................................................................................................................... 126
COMPETITIVE LANDSCAPE ........................................................................................................................................................ 127
DISTRIBUTION LANDSCAPE ...................................................................................................................................................... 128
CHALLENGES AND OPPORTUNITIES .................................................................................................................................... 129
VOICE OF THE INDUSTRY ....................................................................................................................................................... 130
CONFECTIONERY, SNACKS & READY-TO-EAT INDUSTRY – AT A GLANCE ........................................................ 134
MARKET SIZE AND POTENTIAL ............................................................................................................................................... 135
MARKET TRENDS & DRIVERS .................................................................................................................................................... 138
COMPETITIVE LANDSCAPE ........................................................................................................................................................ 139
DISTRIBUTION LANDSCAPE ......................................................................................................................................................140
CHALLENGES AND OPPORTUNITIES .....................................................................................................................................141
VOICE OF THE INDUSTRY ....................................................................................................................................................... 143
146
149
APPENDICES
REGIONAL DEFINITIONS
5

The Gulfood Global Industry Outlook Report is an in-depth market research study commissioned by the Dubai World Trade Centre to the agencies Euromonitor International and GRS Research and Strategy.
Euromonitor InternationalEuromonitor International is an independent provider of strategic market research. We create data and analysis on thousands of products and services around the world. As independent market researchers, we provide unbiased historic trends and forecasts for every region, country, category, channel and consumer. Euromonitor’s research includes qualitative and quantitative-based trade surveying and analysis to support market, competitor and customer intelligence. Euromonitor was established in 1972 in London and has clients ranging from leading manufacturers and investment banks to governments and universities.
Introduction
Research MethodologyThe research methodology of Passport, the key source used for this Report, is based on a core set of research techniques that include desk research (national statistics, national and international trade press, national and international trade associations, industry study groups and other semi-official sources, company financials and annual reports, broker reports an online databases), store audits and trade survey with key stakeholders across the value chain. Forecast data provided represents many of the essential conclusions reached about the current state of the market, how it works and how it behaves under different macro and micro conditions.
In addition to Passport, information and prospects set out in this report have also been sourced from desk research (such as company websites, trade press) and trade opinion surveys conducted by Euromonitor.

5 MACRO-CATEGORIES:
GRS Research and StrategyThe Gulfood Voice of The Industry survey was carried out by GRS Research & Strategy Middle East, an international research company that operates primarily in the Exhibition Industry, with offices in Dubai (UAE), London (UK), and Venice (Italy)
Research Methodology- Data has been collected between Jan 6th and January 26th 2019 in
CAWI (Computer Assisted Web Interviewing) mode
- 1,634 senior F&B professionals based in 109 different countries across the world responded to a 10-minute survey, sharing their experience, providing information about the current performance of the companies they represent, sharing their personal views about the industry as a whole, as well as their expectations for the future
Wholesalers, Traders & Distributors
o Importer / Trader / Wholesaler
o Distributor
Manufacturers
Hospitality & Foodservice
o Bar / Café / Restaurant
o Bakery
o Hotel o Caterer
Retailers
o Retail / Supermarket / Grocery
o Fishmongers
Others
o Education / Training
o Government / Association
o Other
Region Activity
Wholesalers, Traders & Distributors
Manufacturers Retailers
Hospitality & Foodservice Others
MENA APAC Europe
Sub-Saharan Africa Americas
IN
TRO
DU
CTI
ON
7

Sector
Annual Turnover
Confectionery, Snacks & Ready-to-Eat Pulses, Grains & Cereals Beverages
Premium, Gourmet & Fine Foods Ingredients Meat & poultry
Dairy Seafood Fats & Oils
100+ Million USD 50-100 Million USD 21-50 Million USD 11-20 Million USD
1-10 Million USD < 1 Million USD


Asia Pacific
Australasia
Europe
Latin America
Middle East and North Africa
North America
Sub-Saharan Africa
NorthAmerica
LatinAmerica
Europe
Regional Definitions

Regional Definitions
Asia Pacific
Australasia
Middle Eastand Africa
Sub-Saharan Africa
IN
TRO
DU
CTI
ON
11

SummaryExecutive

Executive Summary
Driven by the rise in population, demand for packaged food and beverages is set to see further growth over the forecast period. Moreover, urbanised population growth is projected to grow at a CAGR of 1.7% between 2018 and 2023, outpacing total population growth of 1.0% over the same period. This will only drive more demand for packaged food and beverages (F&B).
Additionally, with GDP growing at a faster rate than total population with a CAGR of 2.8% between 2018-2030, overall consumer spending on F&B is set to rise in value from 8.5% to 8.9% of GDP by 2030, coinciding with consumer trends such as more convenience-seeking lifestyles.
Demographic shifts such as urbanisation, migration, and the rise of the middle class are reshaping consumer lifestyles and purchasing decisionsThe unprecedented shift from rural to urban living is a major population change impacting global consumption habits. A portrait of tomorrow’s consumer would look young, likely below the age of 30, urbanised and potentially living in sub-Saharan Africa, Asia Pacific or Latin America. This demographic group is the fastest growing and largest contributor to value sales growth of F&B with their increasing purchasing power and affinity towards Westernised, convenient and easy-to-prepare food and beverages.
On the other hand, growing middle class consumers with rising income, specifically in emerging markets like China, are creating their own ripple in consumption trends by encouraging premiumisation, i.e. driving demand for high-quality packaged food that includes organic and locally produced products.
PopulationWorldGDPWorld
Exhibit 1 - Global Population and GDP (US$)
Source: Euromonitor International analysis from Passport
Global population expected toexceed 8.4 bil lion by 2030
7.5bn8.4bn2030
2018
CAGR 1.0%
82.7tn115.3tn2030
2018
CAGR 2.8%
IN
TRO
DU
CTI
ON
13

The colour of the industries indicates growth rate Above global average Global average Below global average
Asia Pacific is set to become the world’s biggest consumer of F&B by 2030Packaged food and beverage markets witnessed a shift in pattern, from developed regions to developing ones. With rising disposable incomes and shifting consumer preferences in developing markets, industry players have turned their attention to these markets where favourable factors are at play.
Although Asia Pacific offers a sizable consumer base as well as considerable consumption growth, the Middle East and Africa region has also emerged with high levels of potential, with greater distribution of wealth and rapidly developing infrastructure, consumers have greater access to a wider range of foods and beverages.
Exhibit 2 - Industry Growth per Region by Category, CAGR 2018-2023
Industry Growth
........................................................................ 1.9%
........................................................................ 1.0%
....................................................................... 0.3%
........................................................................ 0.8%
........................................................................ 1.1%
........................................................................ 1 . 5%
........................................................................ 1.3%
........................................................................ 1.4%
........................................................................ 3.6%
........................................................................ 2.9%
....................................................................... 5.2%
........................................................................ 3.8%
........................................................................ 3.4%
........................................................................ 5.2%
........................................................................ 3.2%
........................................................................ 3.3%
........................................................................ 0.5%
........................................................................ 0.0%
....................................................................... 0.7%
........................................................................ -0.2%
........................................................................ -0.5%
........................................................................ 1.1%
........................................................................ 1.2%
........................................................................ 1.7%
........................................................................ 2.7%
........................................................................ 2.6%
....................................................................... 2.9%
........................................................................ 2.0%
........................................................................ 2.4%
........................................................................ 2.5%
........................................................................ 3.5%
........................................................................ 2.5%
Europe North America
Latin AmericaMiddle East & North Africa
Beverages Dairy Poultry Pulses, Grains & Cereals Fats & Oils Seafood
Cooking Ingredients Confectionery, Snacks and Ready-to-eat

15
Europe accounts for a significant share of the world’s packaged food and beverages markets, powered by high per capita consumption markets in Germany, France and the UK.
Despite this established base in Europe and unsaturated market in Middle East and Africa, Asia Pacific still promises to be the go-to region of the future for packaged F&B players. Countries such as China and India play an eminent role in terms of demand and consumption, with the rapid urbanisation, evolving lifestyle and rising number of working women resulting in a greater demand prospects and favourable growth projections. The expansion of discounters in Asia Pacific markets too is allowing availability of packaged food in rural areas, further adding to growth potential.
As for Latin America, the packaged food market is forecast to grow at a CAGR of 2.6% over 2018-2023, with Brazil predicted to add around USD31 million to the total market by 2023, as the economy continues to recover, and the F&B industry sees strong growth in dairy and Fats & Oils, especially in alternative ingredients and single portion dairy drinks and dairy alternatives.
Snacking has penetrated all areas of packaged food, not only in traditional snacking categories like confectionery and chips/crisps but also in dairy sub-categories, such as cheese and yoghurt products. With confectionery growth prospects diminished by the pushback on sugar, snack varieties seem to be immune to this trend, with confectionary snacks and ready to eat being amongst the fastest growing categories across all regions.
While brick & mortar grocery retailers continue to be the primary channel for packaged food sales, there has been an immersion of e-commerce players penetrating the F&B market. Online retailing is set to be the most dynamic channel globally leading up to 2023, driven by millennial and Gen Z consumers, who are making fewer grocery trips in favour of online shopping platforms.
Source: Euromonitor International analysis from Passport
........................................................................ 4.7%
........................................................................ 3.3%
....................................................................... 2.5%
........................................................................ 5.1%
........................................................................ 3.4%
........................................................................ 3.0%
........................................................................ 4.2%
........................................................................ 3.7%
........................................................................ 2.7%
........................................................................ 4.4%
....................................................................... 2. 3%
........................................................................ 3.7%
........................................................................ 8.3%
........................................................................ -1 . 2%
........................................................................ 3.3%
........................................................................ 3.5%
........................................................................ 2.7%
........................................................................ 1.9%
....................................................................... 0. 2%
........................................................................ 1.1%
........................................................................ 2.3%
........................................................................ 2. 1%
........................................................................ 0.6%
........................................................................ 2.4%
Sub-Saharan Africa
Asia Pacific
Australasia
EXEC
UTI
VE
SUM
MA
RY
15
Asia Pacific Australasia Europe Latin AmericaMiddle
East & North Africa
North America
Sub-Saharan Africa
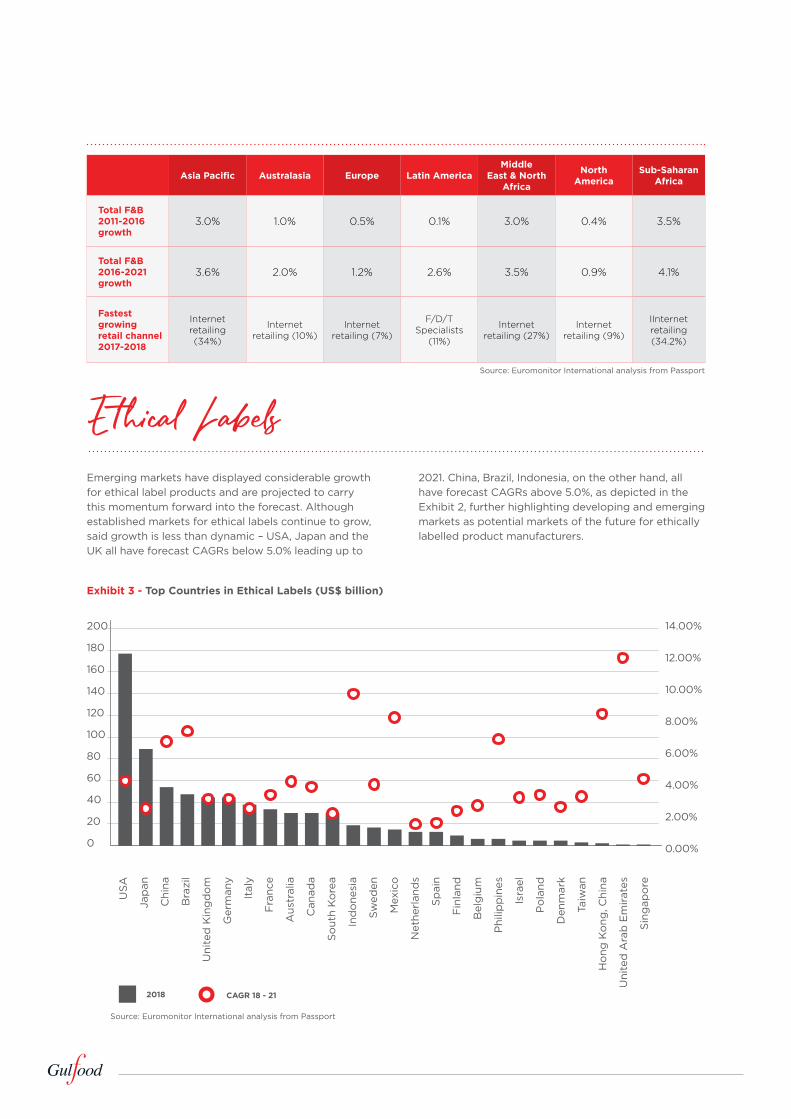
Total F&B 2011-2016 growth
3.0% 1.0% 0.5% 0.1% 3.0% 0.4% 3.5%
Total F&B 2016-2021 growth
3.6% 2.0% 1.2% 2.6% 3.5% 0.9% 4.1%
Fastest growing retail channel 2017-2018
Internet retailing (34%)
Internet retailing (10%)
Internet retailing (7%)
F/D/T Specialists
(11%)
Internet retailing (27%)
Internet retailing (9%)
IInternet retailing (34.2%)
Source: Euromonitor International analysis from Passport
Source: Euromonitor International analysis from Passport
E thical LabelsEmerging markets have displayed considerable growth for ethical label products and are projected to carry this momentum forward into the forecast. Although established markets for ethical labels continue to grow, said growth is less than dynamic – USA, Japan and the UK all have forecast CAGRs below 5.0% leading up to
200
180
160
140
120
100
80
60
40
20
0
14.00%
12.00%
10.00%
8.00%
6.00%
4.00%
2.00%
0.00%
USA
Jap
an
Chi
na
Bra
zil
Uni
ted
Kin
gd
om
Ger
man
y
Ital
y
Fra
nce
Aus
tral
ia
Can
ada
So
uth
Ko
rea
Ind
one
sia
Sw
eden
Mex
ico
Net
herl
and
s
Sp
ain
Fin
land
Bel
giu
m
Phi
lipp
ines
Isra
el
Po
land
Den
mar
k
Taiw
an
Ho
ng K
ong
, Chi
na
Uni
ted
Ara
b E
mir
ates
Sin
gap
ore
2021. China, Brazil, Indonesia, on the other hand, all have forecast CAGRs above 5.0%, as depicted in the Exhibit 2, further highlighting developing and emerging markets as potential markets of the future for ethically labelled product manufacturers.
2018 CAGR 18 - 21
Exhibit 3 - Top Countries in Ethical Labels (US$ billion)

Health and Wellness in Packaged Food by Region
Similarly to ethical labels, the majority of established markets for health and wellness packaged food products are located in developed regions, i.e. North America, Europe and parts of Asia Pacific. These markets, as illustrated in the map below, all have sizable market sizes for this category in 2018, with Asia Pacific retaining the largest market value of $134.8bn. However, relatively higher growth rates for the 2018-
2023 period are forecasted for developing regions, primarily the Middle East and North Africa (9.9%), Sub-Saharan Africa (8.8%) and Latin America (7.4%). These forecasts are in part driven by the global trends previously described, such as the expansion of the middle class who, with a higher income, are more likely to spend on H&W products that are often priced higher than more conventional packaged food SKUs.
North America
Latin America
Europe
Middle East &North Africa
Asia Pacific
AustralasiaSub-Saharan Africa
3.4% $141.9bn
$120.3bn 4.4% $142.8bn
$115.1bn
7.4% $57.2bn
$40.1bn
8.8% $10.7bn
$7.0bn
9.9% $31.5bn
$19.6bn
6.7% $186.6bn
$134.8bn
4.3% $12.0bn
$9.7bn
Key: Inner circle indicates the market size in RSP $US bn in 2018, outer circle indicates the same indicator in 2023
The distance between the inner and outer circles indicates the size of absolute growth which is included next to the region’s name
The colour of the circles indicates the growth rate: Fast Moderate Slow
Source: Euromonitor International analysis from Passport
Exhibit 4 - Global F&B Consumption 2018, 2023 & CAGR 2018-2023
Andy Holman , CEO , Eat hos (United Arab Emirate s)
One country to invest in 2019?
Egypt, because of the growing disposable income of
its middle & upper middle classes
EXEC
UTI
VE
SUM
MA
RY
17

Natural ingredients, sugar reduction and free-from labels remain the F&B industry’s main priorities
Rising health awareness is not a new trend, but its impact continues to become more pronounced as it shifts today’s consumer preferences towards a high nutritional value, and, as a result, driving consumption of healthier variants such as reduced fat food products. The packaged food industry is witnessing a marked growth in free-from products and organic food
adoption. The future will see a re-invention of health-based claims and marketing strategies, with emphasis shifting from functionality and similar benefits to clean ingredients, clear packaging and “clean” labels.
Other key consumer and industry trends, along with their relative impact levels on a global scale, are detailed in the heat map below.
Market drivers and trends
High Impact Low Impact
Sustainability – Locally produced ingredients
Improved F&B food safety and hygienic preparation
Flavour diversification, both Westernisation and Ethnic
Single serve, smaller packaging reflecting smaller
households, on-the-go consumption and health
concerns
Increased label scrutiny regulations
Rising unit prices, raw material and VAT
Increasing importance of ethical positioning, such as Halal, recycled, eco-friendly
or organic
Growing interest in plant-based F&B substitutes in ingredients, flavourings, sweeteners and protein
sources
Scaling up of leading F&B companies through M&A
activity to offset challenge of online giants and current
consumer trends

Value-adding ingredients and features are driving change in global consumption landscape, while convenience is dictating a new way for consumers to shop for food and beverage
Changing consumer preference for food and beverage demand has created more opportunities for innovation within the industry with a focus on premiumisation and value-adding features and/or ingredients. Similarly to rising health awareness, premiumisation is also not a new trend, but it is increasingly being embraced by a larger consumer base, fuelled by an expanding middle class with higher disposable incomes and an increasing appetite for quality and unique flavours. For packaged F&B players, investing in innovating premium products has led to improved profitability prospects, with consumers displaying an improved willingness to pay higher prices for products that offer their perception of value.
Furthermore, consumers’ search for value-adding elements not only influences what they shop for, but also how they shop for it. E-commerce has already
Source: Euromonitor International analysis from Passport, trade interviews and desk researchNote: Trends listed above are a consolidation of challenges within the different industries covered in this report. Level of opportunity and challenge is extrapolated by Euromonitor International based on its market understanding.
disrupted the shopping landscape despite, gradually usurping share and foot traffic from supermarkets, hypermarkets and other brick & mortar formats. With cutting edge technologies changing how E-com retailers interact with their customers – such as artificial intelligence algorithms aiding product searches, virtual reality (VR) and augmented reality (AR) capabilities offering an immersive experience to consumers with the products – this trend is expected to maintain its dynamic growth across global markets.
Other overarching challenges and opportunities can be derived from some of the most impactful trends previously discussed. The chart below illustrates how industries can pivot their perspectives on these market developments and view both the challenges and opportunities residing in each, several of which are further discussed by category, on a country level and through numerous analytical lenses in the following sections of the report.
Market chal lenges and opportunities
Exhibit 6 - Opportunities and Challenges Matrix
10
9
8
7
6
5
4
3
2
1
0
0 1 2 3 4 5 6 7 8 9 10
Probiotics growing in popularity
Growth in internet retailing Premiumisation
Rise of lactosefree and Dairy alternatives
Growing popularity of international cuisines
Saturation in developed markets
EXEC
UTI
VE
SUM
MA
RY
19

In your opinion, how much will the following factors impact consumer’s purchasing decision in 2019?
Consumer attention
Quality is considered to be the most impactful variable in consumer’s purchasing decision, slightly more than price, and significantly more than all other aspects. The only sectors for which price is considered to have a more important role than quality are “Dairy”, “Fats & Oils”, and “Meat & Poultry”.
Interestingly, aspects such as Halal and Organic Certifications, Sustainability, and Free-from are not in the top 3 consumer priorities, even though these are considered to be key trends right now. Core elements of quality, price, brand, and packaging are still leading purchasing decisions, according to the survey respondents.
Quality is more important than price, and brand is more relevant than packaging across all regions, except for Sub-Saharan Africa.
6%
9%
12%
13%
15%
14%
20%
19%
21%
42%
45%
16%
25%
26%
26%
25%
29%
25%
37%
38%
33%
35%
0% 10% 20% 30% 40% 50% 60% 70% 80% 90%
Vegan
Premium/gourmet
Free-from
Private label
Organic Certified
Sustainability
Halal Certified
Packaging
Brand
Price
Quality
Consumer attention
Extreme impact Significant impact
Voice of the Industry

Key Trends
What are the 3 most important trends in the F&B industry?
More than 50% of senior F&B professionals who took part in this research consider “Organic & Free-from” as one of the 3 most important trends in the industry. Regarding other key trends, besides for “Private Label” in second place, 3 of the top 5 have to do with “ethics”: the concepts of being eco-friendly, conscious of the effect of plastic on the environment, concerned of fair trade, and practicing honest advertising are considered to be key factors today and for the years to come.
54.20%
30.10%
28.30%
24.80%
24.60%
21.90%
21.40%
17.00%
15.40%
10.40%
10.10%
4.10%
1.60%
Organic & Free-from
Private Label
Ethical living: Eco-friendly, Halal and Fair trade
Honest advertising and labeling
Plastic bans on packaging, retail and foodservice
Premium & Gourmet
Food waste prevention
Farm to fork sustainability
Elevated convenience, ‘grab-and-go’
Westernization & diversification of diet
Fortified & Functional
Animal welfare
Other
0% 10% 20% 30% 40% 50% 60%
Phil Henwood, CEO, Limwood Gourmet (Singapore)
This year, private label will see a race for the best marketing
strategies, looking to penetrate the largest market segments.
EXEC
UTI
VE
SUM
MA
RY
Voice of the Industry
2121

Main challenge
In your opinion, what’s the main challenge / threat for the food and beverage industry?
There are significant differences depending on the regions in which respondents operate. Growing competition from private label is considered as the #1 challenge by relatively more companies in MENA (17.3%) and Europe (14.2%), whereas “higher regulatory control & production costs” was mentioned by 26.3% of respondents in the Americas. In the Sub-Saharan Africa, adapting to new retail and distribution models is the main challenge for 16.7% of companies, second only to volatile commodity prices (21.9%).
Which of the following will affect your product portfolio and strategy the most in the next 12 months?
Product portfolio and strategy Vs Type of business
Wholesalers, Traders &
DistributorsManufacturer
Hospitality & Foodservice
Retailers
Direct Sales to customer 45.2% 37.6% 34.7% 46.6%
Private Label 24.6% 25.4% 17.6% 34.2%
Research & Development 12.9% 37.0% 27.8% 16.4%
Contract Manufacturing 19.8% 26.9% 12.0% 11.0%
Current Channels 20.2% 16.6% 14.8% 11.0%
Third-party ecommerce 14.8% 10.7% 16.2% 13.7%
Mergers & Acquisitions 11.5% 14.5% 13.0% 6.8%
Own ecommerce 12.5% 9.5% 17.6% 19.2%
Omni-channel retailing 6.9% 7.7% 3.2% 19.2%
Other 2.1% 3.0% 4.2% 5.5%
Volatile commodity prices
Higher regulatory control & production costs
Growing competition from Private Label products
Adapting to new retail and distribution models
Demand for traceability and sourcing transparency
Negative publicity of processed foods and beverages
Increased demand for ethically-farmed ingredients
Slow product innovation cycles
Technology/Automation integrations
Growing sustainable production pressures
The free-from movement
Consolidations and vertical integrations
0% 5% 10% 15% 20% 25%
20.20%
13.90%
13.70%
10.90%
9.90%
7.60%
5.60%
4.80%
4.50%
3.20%
2.80%
2.80%
Voice of the Industry
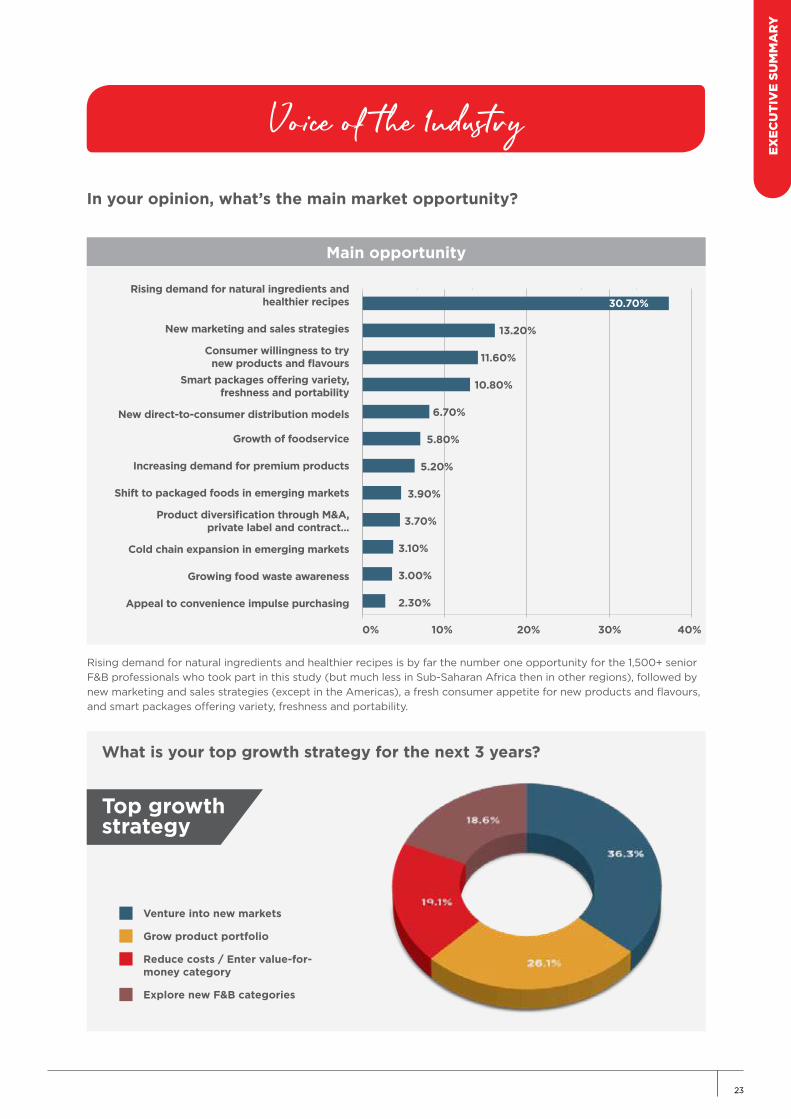
Main opportunity
In your opinion, what’s the main market opportunity?
What is your top growth strategy for the next 3 years?
Rising demand for natural ingredients and healthier recipes is by far the number one opportunity for the 1,500+ senior F&B professionals who took part in this study (but much less in Sub-Saharan Africa then in other regions), followed by new marketing and sales strategies (except in the Americas), a fresh consumer appetite for new products and flavours, and smart packages offering variety, freshness and portability.
Rising demand for natural ingredients and healthier recipes
New marketing and sales strategies
Consumer willingness to try new products and flavours
Smart packages offering variety, freshness and portability
New direct-to-consumer distribution models
Growth of foodservice
Increasing demand for premium products
Shift to packaged foods in emerging markets
Product diversification through M&A, private label and contract...
Cold chain expansion in emerging markets
Growing food waste awareness
Appeal to convenience impulse purchasing
0% 10% 20% 30% 40%
30.70%
13.20%
11.60%
10.80%
6.70%
5.80%
5.20%
3.90%
3.70%
3.10%
3.00%
2.30%
Top growth strategy
Venture into new markets
Grow product portfolio
Reduce costs / Enter value-for-money category
Explore new F&B categories
EXEC
UTI
VE
SUM
MA
RY
Voice of the Industry
2323

Economic OutlookGlobal Social

The world population in 2018 stood at 7.6 billion, up from 7.1 billion in 2013. Year-on year growth is expected to slow slightly, but remain around 1% until 2030, leading to a world population of close to 8.0 billion in 2023 and 8.5 billion by 2030. In actual terms, population growth in Asia Pacific will be the most significant over this time period, even though the region already features the highest population density. The region continues to account for over half of the world’s population. Sub-Saharan Africa on the other hand is projected to remain the fastest growing region until 2030 in percentage terms. Its share of the world population will increase from 14% in 2018 to 17% in 2030. In both regions, population growth stems from high birth rates, as net migration remains negative. Rapid urbanisation, the development of better supply chains, increasingly busy lifestyles and a comparably low median age are therefore expected to support demand for packaged food products over unpackaged ones, driven by convenient, portable and single-serve products. Depending on the level
Global Dynamics of Demogrpahics
Overview
of development, similar trends are expected in developing countries in Latin America and Middle East and North Africa.
Positive net migration to Europe, meanwhile, remains insufficient compensation for the region’s low birth rates. Europe is the only region expected to witness slightly negative population growth towards 2030. In the face of stagnant population numbers and mature markets, increasing demand within food and beverages will mainly be achieved through value-added products. With an aging population and growing incidences of obesity, diabetes and cardiovascular diseases as well as increasingly busy lifestyles, there are good opportunities for innovative products in the health and wellness spectrum. Similar trends are expected in North America and Australasia, as societies there are facing similar problems in terms of aging and health. The latter regions will, however, see their populations grow between 2018 and 2030 due to sufficient net migration.
Exhibit 7 - Regional Population in 2018, 2030 & CAGR 2018-2030
North America
Latin America
Europe
Middle East &North Africa
Asia Pacific
AustralasiaSub-Saharan Africa
0.6% 392.8mm
364.7mm 0.0% 748mm
747.5mm
0.8% 708.5mm
646.0mm
2.5% 1.4bn
1.0bn
1.5% 677.3mm
568.8mm
0.7% 4.5bn
4.1bn
1.4% 35.3mm
29.8mm
Note: Inner circles indicate population in 2018, outer circles indicate population in 2030. The distance between inner and outer circles indicates size of absolute growth.
Colour of circles indicates growth rate: Fast Moderate Slow Static
Source: Euromonitor International analysis from Passport
GLO
BA
L SO
CIA
L &
EC
ON
OM
IC O
UTL
OO
K
25

Source:Euromonitor International
Global Dynamics of Demogrpahics
Developed Vs Emerging Markets
Emerging and developing markets, mainly found in Asia Pacific, Middle East and North Africa, Latin America and Sub-Saharan Africa accounted for 86% of the world population in 2018. This number is expected to increase slightly to 87% in 2030, as population growth in these markets continues to outpace that of developed countries. Developments in consumer expenditure on the other hand are set to be more dynamic thanks to China and India. China, the market with the highest consumer expenditure on food and beverages globally, as well as within emerging and developing markets in 2018, is also expected to see the strongest growth in actual terms. Consumer spending on food and beverages in the USA was the largest among developed countries in 2018 and is set to hold this position until 2030. On a global scale, India is projected to overtake the USA, securing second place after China in terms of food and beverage expenditure in 2029. This will have a lasting effect on the consumer spending landscape in terms of developed vs. emerging countries for food and beverages. The two Asian heavyweights will boost the impact of emerging countries from 61% of worldwide spending on food and beverages in 2018 to 69% in 2030. Without the impact of China and India, this shift would be significantly less noticeable, as other emerging countries will only increase their share from 47% in 2018 to 51% in 2030.
Major changes in emerging and developing countries between 2018 and 2030 include urbanisation and a continuous development of cold chain systems and general supply chain networks. The most important demographic change in developed markets is aging societies, as most countries are already urbanised and home to an established middle class.
Exhibit 8 - Impact of India and China on Developing Markets (1990, 2018, 2030)
9,000,000
8,000,000
7,000,000
6,000,000
5,000,000
4,000,000
3,000,000
2,000,000
1,000,000
8,000,000
7,000,000
6,000,000
5,000,000
4,000,000
3,000,000
2,000,000
1,000,000
1990 19902018 20182030 2030
Tota
l Po
pul
atio
n (.
00
0)
Total Population
Emerging and Developing Countries Developed Countries Emerging and Developing
Countries Developed Countries
Total Population (excl. China and India)
Tota
l Po
pul
atio
n (.
00
0)

By 2030, 60% of the total world population will be living in urban areas.
Global Dynamics of Demogrpahics
Urbanisation Vs Population Growth
Growth in urbanisation is expected to surpass overall population growth in all regions, resulting in an increase in the number of people living in urban environments from 55% in 2018 to 60% in 2030.
The fastest growth in terms of population as well as urban population is expected in Sub-Saharan Africa. The region is home to an increasing number of women of childbearing age and is witnessing comparatively high birth rates and fertility, easily outpacing a negative net migration rate. Urban population growth is supported through migrants from rural areas in search of better job opportunities as well as reclassification/upgrading of former slums into urban areas. Nevertheless, Sub-Saharan Africa will remain the least urbanised region, with only 46% of the overall population living in cities in 2030.
The second highest growth in population and urban population, between 2018 and 2030, will be seen in Middle East and North Africa. The region is growing due to high birth rates as well as positive net migration between 2018 and 2030. Cities in the gulf region will remain important destinations for migrant workers, especially from Asia, while the
end of the conflict in most of Syria and Iraq is not only expected to limit further emigration outside of the region, but could also lead to large numbers of returnees.
Urban and total population growth in Asia Pacific is expected to be only the third strongest despite high birth rates. The region traditionally suffers from negative net migration rates, especially in India and China. Asia Pacific is still of great importance, as population growth in actual terms exceeds all other regions combined. The transformation to urban environments in this part of the world is therefore of significant importance and has a lasting impact on the global food and beverage market.
The fourth strongest growth rates in terms of urban and total population are expected in Australasia. The region’s urban population will increase to 91% in 2030, thereby retaining its top position in this regard.
In line with its stagnating population numbers, Europe is expected to witness the lowest growth in urban population of all regions. Birth rates as well as immigration rates are projected to remain
GLO
BA
L SO
CIA
L &
EC
ON
OM
IC O
UTL
OO
K
27

URBAN POPULATION GROWTH, 2017 - 2030
Europe
Sub SaharanAfrica
North America
Australasia
Asia Pacific Middle East & North Africa
Latin America
1 . 0 %0 . 5 % 1 . 5 % 2 . 0 % 2 . 5 % 3 . 0 %
insufficient in maintain the region’s population at current levels over 2018 to 2030 and migration towards cities is limited as most countries are already highly urbanised.
Urbanisation always offers a dense, concentrated market and opportunities for retail infrastructure and products tailored to different income bands. Most trends supported by urbanisation can be found across regions. Key developments however often differ and are usually connected to the country’s economic situation and disposable income structure. The greatest impact of urbanisation in Sub-Saharan Africa, the region with the fastest urbanisation rate between 2018 and 2030, for example, is expected to be on staples, as disposable incomes are relatively low. Meanwhile, consumers in Nigeria simply migrate from loose to packaged food products due to better availability in the urban retail environment. Packaged rice for example is expected to see major gains, as consumers move away from unpackaged or bulk-broken products, commonly found in rural areas.
In Asia Pacific, on the other hand, urbanisation is boosting demand for higher-priced convenience categories, considered to represent a more modern, premium and western lifestyle and a good way to decrease food preparation time. In China, products such as RTE breakfast cereals, chilled processed meat or baked goods are projected to see strong growth due to their convenience, luxurious western image and short preparation times supporting the increasingly busy lifestyle of many Chinese consumers.
In highly urbanised societies in Europe, strong health and wellness concerns combined with demand for convenience are drivers for growth. In Germany, for example, high demand is predicted for organic snacking-related categories. Organic ingredients usually do not impact the taste of the product but are seen as a more healthy way to indulge.
Exhibit 9 - Urban population growth vs total population growth across regions (2018-2030)
Source: Euromonitor International analysis from PassportNote: Bubble size represents the urban population over total population in 2030
4.5%
4.0%
3.5%
3.0%
2.5%
2.0%
1.5%
1.0%
0.5%
0.0%
77%
83%
85%
55% 68%
46%
91%
0 . 0 %
Voice of the Industry
Differently than all other regions, MENA senior F&B
professionals claimed their top growth strategy for the next 3
years is product portfolio growth (37.8%)

Exhibit 10 - Regional GDP in 2018, 2030 & CAGR 2018-2030
Asia Pacific, Sub-Saharan Africa and Middle East & North Africa top GDP growth to 2030.
Global Economic Outlook
OVERVIEW
Global GDP totalled US$83.3 trillion in 2018, up from US$70.0 trillion in 2013. World GDP is expected to reach US$99.0 trillion in 2023 and US$124.7 trillion in 2030, as year-on-year growth rates remains stagnant at 3%-4% between 2018 and 2030.
Asia Pacific is forecast to achieve the fastest GDP growth in actual and percentage terms, driven by the strong manufacturing and export-led economies of China and India as well as overall growth in private consumption. In such a positive economic environment, the food and beverage industry is expected to flourish as well. Increasingly busy lifestyles and growing disposable incomes are expected to strengthen demand for convenient, portable and healthy packaged food items and beverages.
GDP growth in Europe is more muted and expected to remain the lowest among all regions in percentage terms. In actual terms however growth is significantly higher than in most other regions due to the sheer size of markets like the UK or Germany. The food and
beverage market in Europe is mature and saturated, and growth is therefore mainly found in value-added products appealing to an ever-increasing, health-conscious consumer segment. Products designed specifically for the elderly could therefore benefit, as the median age in Europe is expected to increase further, reaching 43 in 2030, up from 41 in 2018.
Australasia remains the lowest GDP in actual terms due to the small size of the region, representing only Australia and New Zealand. Growth within food and beverages is modest in both countries, due to the mature nature of both markets. Key drivers of growth are improvements in quality and convenience.
Coming from a low base, GDP growth in Sub-Saharan Africa will remain high between 2018 and 2030, strongly supported by Ethiopia. The country is expected to see the highest GDP growth in the region between 2018 and 2030, as well as the second highest increase in actual terms. As the government has launched initiatives to eradicate food poverty,
North America
Latin America
Europe
Middle East &North Africa
Asia Pacific
AustralasiaSub-Saharan Africa
1.7% 26.5tn
21.7tn 1.5% 24.7tn
20.7tn
2.7% 7.8tn
5.7tn
4.0% 2.6tn
1.6tn
2.8% 5.8tn
4.2tn
4.4% 45.8tn
27.3tn
2.5% 2.2tn
1.6tn
Source: Euromonitor International analysis from Passport
Note: Inner circles indicate GDP in 2018, outer circles indicate GDP in 2030. The distance between the inner and outer circles indicates the size of the absolute growth. The colour of circle indicates growth rate: Fast Moderate Slow Static
GLO
BA
L SO
CIA
L &
EC
ON
OM
IC O
UTL
OO
K
29

demand for food and beverages is expected to benefit significantly from this development.
Brazil is the main driver behind Latin America’s GDP growth. The largest economy in Latin America has started to recover from recession, with expected year-on year GDP growth rates of 2% between 2018 and 2030. In the face of economic improvements, a return to strong demand for convenient options is therefore expected.
Positive GDP growth in North America, as currently projected, is dependent on the US economy, which is significantly larger than the Canadian economy. As both countries are mature and saturated food and beverage markets, innovation is seen as key to success. Convenient products following a healthy theme are
specifically of interest and often a key to growth in many categories.
The Middle East encompasses a set of countries at widely different levels of economic development and dependencies, with oil revenues, agriculture and tourism all being important economic drivers. A similarly diverse picture in terms of growth drivers is evident in the region’s food and beverage market. A shift from artisanal towards packaged products, for example, is a major driver of packaged food growth in the region’s largest economy Turkey. In the region’s second largest economy, Saudi Arabia such a shift is not visible and growth is mainly based on greater demand for convenient options in line with a general trend towards healthy eating.
GDP IN DEVELOPED VS EMERGING MARKETSDeveloping countries will be the major driver of global GDP growth between 2018 and 2030, expected to increase their GDP from US$33.5 trillion in 2018 to US$56.0 trillion in 2030. Mature and saturated developed markets, on the other hand, are projected to witness a significantly lower increase from US$49.3 trillion in 2018 to US$59.2 trillion in 2030. Population growth, rapidly rising consumption based on urbanisation and better infrastructure as well as expanding middle classes in emerging markets are just some of the major reasons for this difference.
They are also seen as important drivers of growth in the food and beverage industry. Consumers in many emerging markets have started to shift from artisanal produce to packaged products as urbanisation and expansion of modern retailing increases availability of these products. The growing number of women entering the workforce as well as a general shift towards busy urban lifestyles are set to boost growth of convenient and on-the-go options, designed to decrease food preparation times. Rising levels of obesity combined with growing health awareness is strengthening demand for products perceived as healthier, one of the few categories with good growth potential even in developed markets.
Exhibit 11 - Total GDP developed vs. emerging and developing countries (US$ trillion, 1990 – 2030)
199
019
91
199
219
93
199
419
95
199
619
97
199
819
99
200
020
01
200
220
03
200
420
05
200
620
07
200
820
09
2010
2011
2012
2013
2014
2015
2016
2017
2018
2019
2020
2021
2022
2023
2024
2025
2026
2027
2028
2029
2030
70,000
60,000
50,000
40,000
30,000
20,000
10,000
GD
P (
US
$ t
rilli
on)
Emerging and Developing Countries Developed Countries
Global Economic Outlook
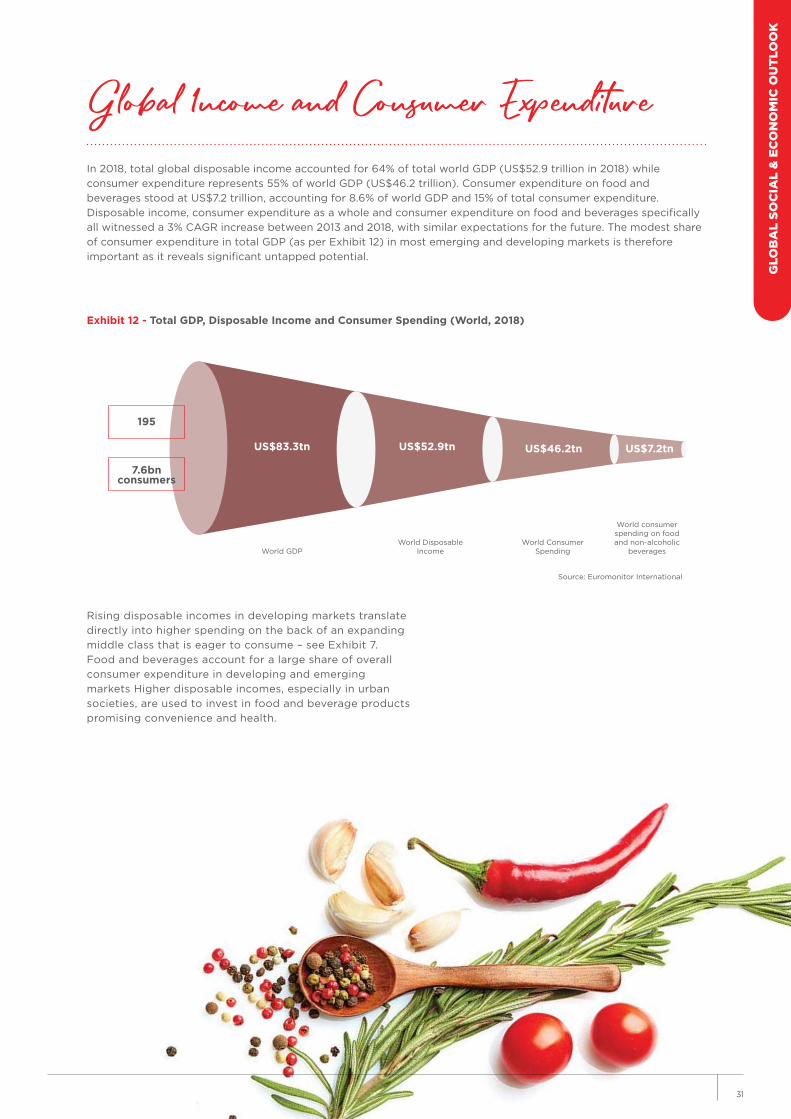
Exhibit 12 - Total GDP, Disposable Income and Consumer Spending (World, 2018)
Global Income and Consumer ExpenditureIn 2018, total global disposable income accounted for 64% of total world GDP (US$52.9 trillion in 2018) while consumer expenditure represents 55% of world GDP (US$46.2 trillion). Consumer expenditure on food and beverages stood at US$7.2 trillion, accounting for 8.6% of world GDP and 15% of total consumer expenditure. Disposable income, consumer expenditure as a whole and consumer expenditure on food and beverages specifically all witnessed a 3% CAGR increase between 2013 and 2018, with similar expectations for the future. The modest share of consumer expenditure in total GDP (as per Exhibit 12) in most emerging and developing markets is therefore important as it reveals significant untapped potential.
195
7.6bnconsumers
World GDP World Disposable
IncomeWorld Consumer
Spending
Source: Euromonitor International
World consumer spending on food and non-alcoholic
beverages
US$83.3tn US$52.9tn US$46.2tn US$7.2tn
Rising disposable incomes in developing markets translate directly into higher spending on the back of an expanding middle class that is eager to consume – see Exhibit 7. Food and beverages account for a large share of overall consumer expenditure in developing and emerging markets Higher disposable incomes, especially in urban societies, are used to invest in food and beverage products promising convenience and health.
GLO
BA
L SO
CIA
L &
EC
ON
OM
IC O
UTL
OO
K
31

Spending on food and beverages in comparison to overall consumption is significantly higher in emerging and developing countries than in developed countries, which explains the high ratios in Sub-Saharan Africa, Asia Pacific, Middle East and North Africa as well as Latin America compared to North America, Europe and Australasia. In Sub-Saharan Africa, where a large consumer base has to spend the majority of its disposable income to ensure food security, the ratio is especially high. In regions like Asia Pacific, Latin America and Middle East and North Africa the ratio is lower, but still reflects good growth opportunities. In developed markets, mainly found in Europe, North America and Australasia, food security and limited access to products are rarely a problem anymore. An increase in disposable income is therefore mostly used to increase spending on healthcare or communications.
Expansion of the middle class usually boosts consumer spending on food and beverages and is mainly found in emerging and developing countries. Countries with large populations and high growth in middle-class household formation therefore offer
varied opportunities to the industry. Packaged food sales in India and China for example are growing, as disposable incomes increase alongside an expansion of the middle class. Based on insights from the China chamber of commerce this has opened up good opportunities for companies importing products from within the cereals, pulses and grains category as well as dairy, meat and poultry and seafood. Good opportunities for imports to India on the other hand can be found within soft drinks, including concentrates, carbonates and juices as well as confectionary, snacks and ready-to-eat products, including dried fruits and nuts. China’s most important exported food and beverage commodity on the other hand is tea, while rice is the most important one in India.
Growth opportunities in most developed countries with an already established middle class are limited due to the saturated nature of such markets. Growing demand is therefore mainly found in value-added products catering to increasing health concerns and an aging society.
So
urce
: Eur
om
oni
tor
Inte
rnat
iona
l
3.50%
3.00%
2.50%
2.00%
1.50%
1.00%
0.50%
0.00%
-0.50%
-1.00%
-1.50%
-1.00% 0.00% 1.00% 2.00% 3.00% 4.00% 5.00% 6.00% 7.00% 8.00%
Japan
Germany
Spain
Italy
United Kingdom
France Canada
Nigeria
China
Indonesia
India
Philippines
Pakistan
South KoreaBrazil
USA
Russia
Consumer Expenditure on F&B, Growth, 2018 - 2030
Mid
dle
Cla
ss H
ous
eho
lds
Gro
wth
, 20
18 -
20
30
Exhibit 13 - Consumer expenditure on F&B growth and middle-class household growth for Top 20 F&B spending countries
Country Consumer Exp. CAGR Growth
China 4.70%USA 1.40%India 6.40%Japan 0.50%Russia 1.60%Brazil 2.40%Germany 0.70%Indonesia 4.70%France 1.40%Mexico 2.70%
Country Consumer Exp. CAGR Growth
Nigeria 2.20%Italy 0.70%United Kingdom 1.20%Argentina 2.60%Turkey 2.70%Spain 1.20%Pakistan 4.30%Philippines 6.40%South Korea 1.80%Bangladesh 7.10%

Overall, how satisfied are you with the current performance of your company?
In your opinion, the performance of your company in the future will be:
Satisfaction - current performance Vs Region
Confidence - Over the next 12 months Vs Region
Confidence - Over the next 3 years Vs Region
Business seems to be positive for a significant percentage of senior F&B professionals who participated in this research. From a geographical perspective, mature markets seem to be performing better than emerging ones, as highlighted by the following chart:
If the satisfaction about the current performance of the business is a clear indicator of a positive scenario, the expectations of senior F&B professionals regarding the future of their own business brings even better news for the industry.
Europe
Americas
APAC
MENA
Sub-Saharan Africa
55.8%
50.8%
47.6%
46.2%
39.6%
37.8%
45.8%
42.3%
43.6%
53.1%
6.4%
3.4%
10.1%
10.3%
7.3%
Americas
Europe
APAC
Sub-Saharan Africa
MENA
Europe
Americas
Sub-Saharan Africa
APAC
MENA
77.60%
74.00%
66.40%
59.60%
56.50%
77.60%
74.00%
66.40%
59.60%
56.50%
20.70%
22.50%
29.40%
35.10%
36.60%
20.70%
22.50%
29.40%
35.10%
36.60%
Negative Neutral Positive
Negative Neutral Positive
Negative Neutral Positive
1.70%
3.60%
4.20%
5.30%
6.90%
1.70%
3.60%
4.20%
5.30%
6.90%
88.20%
84.50%
81.90%
81.40%
77.40%
4.10%
1.70%
3.20%
3.60%
4.50%
7.70%
13.80%
14.90%
15.00%
18.10%
GLO
BA
L SO
CIA
L &
EC
ON
OM
IC O
UTL
OO
K
Voice of the Industry
3333

Main risk Vs Region APAC Europe MENASub-Saharan Africa
Americas
Volatile commodity prices 25.1% 21.6% 17.7% 21.9% 21.1%
Higher regulatory control & production costs 11.3% 10.8% 14.5% 15.6% 26.3%
Growing competition from Private Label products 7.8% 14.2% 17.3% 9.4% 1.8%
Adapting to new retail and distribution models 8.7% 9.7% 11.7% 16.7% 7.0%
Demand for traceability and sourcing transparency 10.4% 9.1% 10.5% 6.3% 7.0%
Negative publicity of processed foods and beverages 9.9% 4.0% 7.0% 12.5% 5.3%
Increased demand for ethically-farmed ingredients 8.1% 3.4% 5.0% 5.2% 7.0%
Slow product innovation cycles 4.2% 8.0% 4.6% 3.1% 5.3%
Technology/Automation integrations 6.0% 7.4% 3.8% 3.1% 0.0%
Growing sustainable production pressures 4.2% 6.3% 2.1% 0.0% 8.8%
The free-from movement 0.9% 3.4% 3.4% 2.1% 5.3%
Consolidations and vertical integrations 3.6% 2.3% 2.3% 4.2% 5.3%
Main risk Vs Region APAC Europe MENASub-Saharan Africa
Americas
Rising demand for natural ingredients and healthier recipes
31.2% 34.9% 30.4% 20.4% 37.3%
New marketing and sales strategies 9.6% 16.0% 14.5% 13.3% 6.8%
Consumer willingness to try new products and flavours 14.0% 8.0% 11.8% 8.2% 10.2%Smart packages offering variety, freshness and portability
9.9% 6.9% 12.3% 12.2% 5.1%
New direct-to-consumer distribution models 7.9% 5.1% 6.3% 9.2% 6.8%
Growth of foodservice 4.7% 6.9% 6.6% 4.1% 1.7%
Increasing demand for premium products 6.4% 7.4% 3.9% 5.1% 10.2%
Shift to packaged foods in emerging markets 4.4% 2.9% 3.3% 9.2% 5.1%
Product diversification through M&A, private label and contract manufacturing 3.8% 2.9% 3.6% 5.1% 5.1%
Cold chain expansion in emerging markets 3.2% 2.3% 3.0% 4.1% 3.4%
Growing food waste awareness 2.9% 3.4% 2.8% 2.0% 6.8%
Appeal to convenience impulse purchasing 2.0% 3.4% 1.7% 7.1% 1.7%
Main challenge / threat for the food and beverage industry by region:
Main market opportunity by region:
Top growth strategy for the next 3 years by region:
Top growth strategy Vs Region
Voice of the Industry

Global Food and Beverages Sector

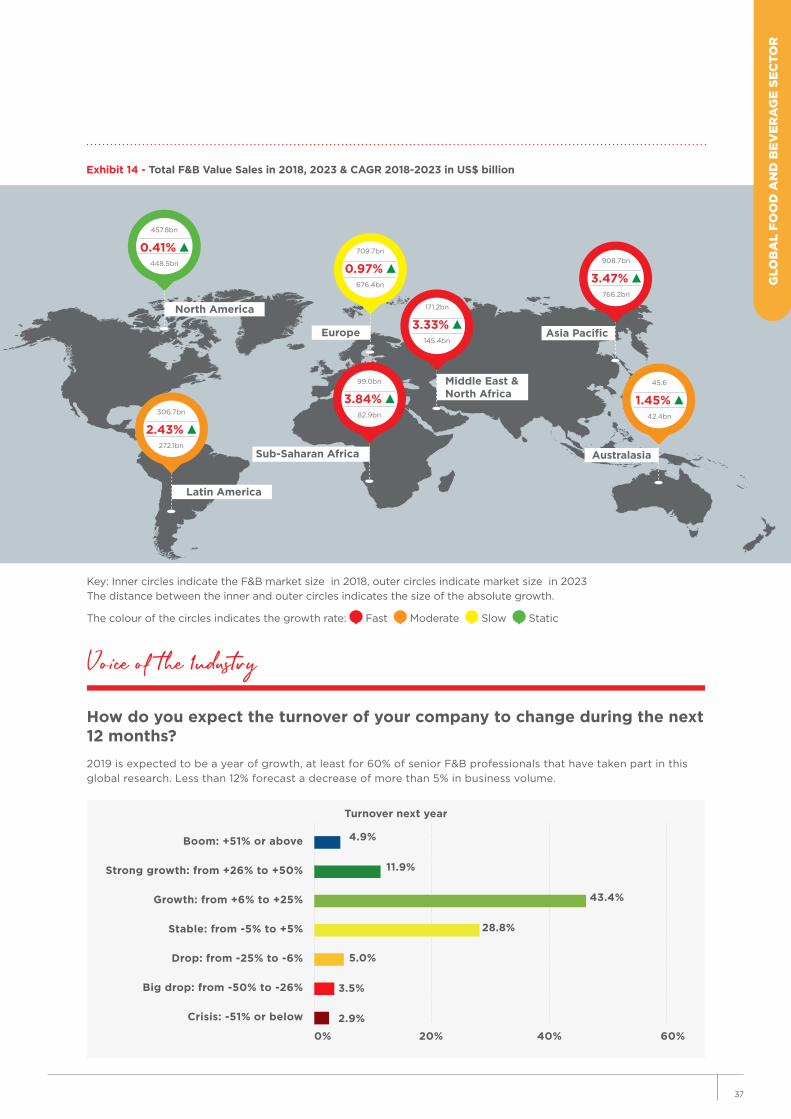
The most important supporter of growth within food and beverages in Sub-Saharan Africa is Nigeria. The country’s food industry is benefiting from strong population growth and an economic recovery process. Good growth in the coming five years will also be seen in the Middle East and North Africa. In more mature markets, like Turkey or the Gulf countries premiumization, high disposable incomes and a growing number of young urbanized professionals interested in global food trends and brands are expected to shape the food and beverage market. In other countries such as Iran, Morocco or Egypt demand is driven by a further shift towards packaged products and the spread of modern retailing. The expansion of supermarkets/hypermarkets is making a broader variety of packaged food and beverages available to consumers. An additional boost is the strong population growth expected throughout the region.
The slowest growth of food and beverage sales over the coming five years is expected in North America. Canada and the USA are saturated and mature markets with an increasing urban population and a growing number of single households. Both is benefiting foodservice sales rather than retail sales. Growth opportunities are therefore mainly found within innovative health and wellness as well as speciality products, as increasing rates of obesity, diabetes and cardiovascular diseases force many to reconsider unhealthy eating habits. Similar developments can be seen in Europe, where health and wellness is often seen as a key driver. The region is additionally benefiting from growth in less mature markets in Easter Europe, such as Russia, Poland and the Ukraine.
OverviewOverall retail value of food and beverage sales across the world in 2018 reached US$2,43 trillion, up from US$2.27 trillion in 2013. Based on an expected forecast CAGR of 2.1%, the industry is projected to reach US$2.73 trillion in 2023. While beverages alone are projected to see a slightly better performance with a CAGR of 2.2% between 2018 and 2023, they also account for a significantly lower portion of the market. Value sales of soft drinks and hot drinks alone stand at US$0.69 trillion in 2018. They are expected to reach US$0.77 trillion in 2018.
Coming from a low per capita base, Sub-Saharan Africa will be the most rapidly expanding food and beverage market between 2018 and 2023, forecasted to witness a CAGR of 3.84%. In actual terms however, Asia Pacific is set to be significantly more important. With a CAGR of 3.47% in the same timeframe, the region will see value sales increase by US$143 billion, compared to merely US$17 billion in Sub-Saharan Africa. In both regions, sales are benefiting from burgeoning populations, rapid urbanization and better access to packaged food and beverage items on the back of an on-going modern trade expansion. The star performer in Asia Pacific is thereby India. The country is expected to see the highest percentage growth between 2018 and 2023, as well as the second highest increase in actuals. Economic expansion, rising incomes and a rapidly expanding middle class has led to increased spending in the last five years and has also supported a shift from unpackaged to packaged foods.
Similar developments are also expected to boost growth in the two most important markets in Latin America: Brazil and Mexico. Brazil is additionally benefiting from an economic recovery process after the country’s worst recession took place in 2014.
Global F B Industry
North America
Latin America
Europe
Middle East &North Africa
Asia Pacific
AustralasiaSub-Saharan Africa
0.41% 457.8bn
448.5bn 0.97% 709.7bn
676.4bn
2.43% 306.7bn
272.1bn
3.84% 99.0bn
82.9bn
3.33% 171.2bn
145.4bn
3.47% 908.7bn
766.2bn
1.45% 45.6
42.4bn
2019 is expected to be a year of growth, at least for 60% of senior F&B professionals that have taken part in this global research. Less than 12% forecast a decrease of more than 5% in business volume.
Turnover next year
Exhibit 14 - Total F&B Value Sales in 2018, 2023 & CAGR 2018-2023 in US$ billion
Key: Inner circles indicate the F&B market size in 2018, outer circles indicate market size in 2023 The distance between the inner and outer circles indicates the size of the absolute growth.
The colour of the circles indicates the growth rate: Fast Moderate Slow Static
How do you expect the turnover of your company to change during the next 12 months?
Boom: +51% or above
Strong growth: from +26% to +50%
Growth: from +6% to +25%
Stable: from -5% to +5%
Drop: from -25% to -6%
Big drop: from -50% to -26%
Crisis: -51% or below
0% 20% 40% 60%
4.9%
11.9%
43.4%
28.8%
5.0%
3.5%
2.9%
G
LOB
AL
FOO
D A
ND
BEV
ERA
GE
SEC
TOR
37
Voice of the Industry

Technology
Global F B TrendsHealth and Wellness as the key to innovation around the globeFaced with increasing rates of obesity, diabetes and cardiovascular diseases consumers all over the world are trying to adapt healthier eating habits. Especially in Europe, North America and Australasia consumers are thereby trying to eat in a more natural way. This has boosted demand for organic, free from products and local produce as well as products with low amounts of additives and preservatives. This trend is thereby accompanied with a shift towards smaller players and private label brands, as many consumers show distrust in established food companies. Opportunities therefore often lie in an acquisition of smaller brands through known internationals. One such example is Enjoy Life Foods, which was acquired by Mondelez in 2015. The snacking company is a market leading brand within the free from segment, offering a broad portfolio of gluten-free and allergy friendly snacks.
The demand for healthier options in regions like Asia Pacific, Middle East and North Africa as well as Sub-Saharan Africa on the other hand is benefiting fortified/functional as well as better for you foods, a key area for international brands. Especially probiotic yoghurt, fortified milk formula and reduced fat dairy products remain successful in these regions. Micronutrient fortification as a way to fight malnutrition could thereby become an important field of innovation in these regions. A pioneer in this space is Nestlé. In India, the company added micronutrients to some of its mass consumption products, introducing iron-fortified Maggi Masala Noodles, fortified milk under Nestlé a+ and minerals as well as vitamin fortified ready-to-drink malt beverage Milo.
Ethical living is an evolving consumer stanceIn developed markets in Europe, North America and Australasia on the other hand changing ethics and environmental topics are expected to become increasingly important. Consumers started to evaluate brands’ ethical credentials, sourcing and sustainability policies with increasingly effective, vocal, pressure group influence. Key components of an ethical standpoint are environmental consciousness throughout the production process in regard to human and animal welfare, resource usage and sustainability and transportation impact through to processing, production inputs and outputs and recyclability. One example of an innovative product development due to ethical pressure through consumers are the Respeggt-Free range eggs in Germany. The product is based on a new technique, which allows hatcheries to identify the sex of chickens before they hatch, thereby avoiding the mass killing of male chicks. The innovation comes after news about shredded and gassed male chicks had shocked consumers.
Global Flavour evolutionWestern food trends and eating habits have entered markets in Asia Pacific, the Middle East and North Africa as well as Sub-Saharan Africa and Latin America with great success, while flavours from said regions are increasingly incorporated into cuisines in North America, Europe and Australasia. Western eating habits usually offer a more convenient way of eating, perfect for increasingly busy lifestyles. Spices like turmeric, or ingredients like hummus and olive oil on the other hand are seen as exciting, delicious and naturally healthy and nutritious additions to ones’ diet and therefore a perfect fit with current developments in most developed markets. Consumers also appreciate the variation and new flavours of other cuisines. Incorporating tastes, ingredients, products and flavours from all around the world is therefore an important trend throughout the globe.
According to the 1,600+ senior F&B professionals who have participated to this research, Internet of Things and Digital Infrastructure are the 2 technologies that will impact the industry the most in 2019. There is a global consensus on this, with barely any difference across the regions, from America to Asia.
Voice of the Industry
6.00%
5.70%
10.70%
14.00%
14.90%
17.30%
17.00%
15.90%
15.80%
28.60%
29.10%
28.60%
29.60%
31.00%
29.40%
33.10%
32.20%
27.30%
31.30%
26.60%
27.60%
31.30%
33.20%
22.00%
22.50%
18.60%
20.00%
16.80%
17.40%
12.30%
6.50%
7.00%
6.60%
6.50%
7.70%
0% 10% 20% 30% 40% 50% 60% 70% 80% 90% 100%
Internet of Things
Digital Infrastructure
Human Augmentation
Advanced Robotics
Blockchain
Artificial Intelligence
3D Printing
Technology
No impact at all Limited impact Noticeable impact Significant impact Extreme impact

Global F B Distributionhouseholds. They also replace traditional grocers, functioning as small corner stores or neighbourhood stores in developing countries. Convenient stores and forecourt retailers usually offer long opening hours, convenient locations and a modern shopping environment with air condition, Wi-Fi and dine-in foodservice as well as a relatively large product assortment.
Many established supermarket/hypermarket chains have therefore branched out into this segment, while also introducing convenient online shopping options. Digital expansion and an increasing network of convenience stores for example is the main focus point of Walmart, the largest grocery retailer in Latin America and North America as well as Woolworths, the leader in Australasia. Similar developments can be seen in Middle East and North Africa, where the convenience stores Carrefour Market and Carrefour Express are strengthening the position of Carrefour as the leading grocery retailer even further. Seven & i holdings co ltd on the other hand, leading grocery sales in Asia Pacific, is already a key driver of the convenience store expansion globally, due to the growing success of its’ 7-Eleven brand.
Convenience stores and internet retailing are also the fastest growing channels in Europe. This development however is not supported by the leading player within modern grocery retailing; Lidl. The discounter continued its expansion of stores, while maintaining a low online presence and is not expected establish a presence within the convenience store business.
Super/hypermarkets now control 51% of total packaged food value sales, down from 54% in 2013. In beverages, the channel represents 39% of soft drink volume sales in 2018, down from 41% in 2013 and 44% of hot drink volume sales, down from 47%. This drop reflects a shift in many countries towards internet retailing, convenience stores and discounters.
While many retail trends appear on a global scale, there are still significant differences in the overall landscape. In Sub-Saharan Africa, Middle East and North Africa and Latin America traditional grocers are the most important channel for packaged food value sales. In beverage volume sales however they dominate Sub-Saharan Africa, Asia Pacific and within soft drinks Latin America. In all other regions, supermarkets/hypermarkets are already established as the leading retail channel within foods and beverages.
The fastest growing on a global scale was internet retailing, benefiting from its ever-increasing convenience and security. The channel was boosted by the spread of smartphones and tablets as well as an increasing number of shopping apps in combination with improved payment methods. Digital marketing as well as sophisticated shopping options are therefore a focus point for many retailers all over the world.
Convenience stores and forecourt retailers were another channel witnessing growing importance in many countries, mainly within the beverage categories. Especially convenience stores cater to the demand of growing urbanized societies and single-person
G
LOB
AL
FOO
D A
ND
BEV
ERA
GE
SEC
TOR
39

Future of RetailGrocery remains the lynchpin of retail where the consumer shopping journey has been evolving over the recent years, driven by technological advancements and shifts in purchasing priorities.
While consumer values and priorities are shifting, value given to products has come to equate more than just a price point. Value now includes elements of price, convenience, quality, sustainability and exclusivity. Taking these elements into consideration has become key in helping brands and retailers connects with their customers and keeping their loyalty.
Omnichannel engagement is key to connect each phase of the purchasing journeyThe most successful companies engage their customers — and promote the brand — along all points of the shopper journey. Increasingly, brand engagement must occur online. With a steady rise in global smartphone ownership, engaging consumers where they are and where they prefer to operate means engaging them through digital channels as well as an ins-store experience.
Pre-purchase • Brand promotion
• Engagement on social media, digital and mobile channels
Purchase • In-store experience
• Engagement at the point-of-sale
• Modern payment methods via mobile apps and social media
Post-purchase • Loyalty and rewards
programmes
• Exclusive offers
• Personalisation
• Customer satisfaction surveys
Exhibit 15 - The New Purchase Journey
Exhibit 16 - Engagement Across the Shopper Journey
Pre- Purchase
PurchasePurchase
Post- Purchase
Source: Euromonitor International – Megatrend Analysis
Source: Euromonitor International – Megatrend Analysis
Voice of the Industry
Direct sales to
consumers (D2C) will affect
the product portfolio and
strategies of all types of
business, from manufacturers
to retailers.

Technological innovations are addressing the need for convenienceWithin grocery retailing specifically, convenience is a trend that has become increasingly important for consumers. As convenience becomes a necessity rather than a luxury, it has also become a key driver for creating opportunities for many players in terms of creating products that speak to the consumers’ busy lifestyles and tech savviness.
Before making purchases, consumers are looking for ways to search for the products they need, compare prices and ensure availability in nearby local stores. An example of a player that has made use of such a need is Pointy, an app first launched in Ireland, which allows consumers to quickly and easily search for the availability of products in their local store. This app links directly to retailers’ stock through their barcode system and allows local retailers to “be found online, sell offline”.
After consumers choose the products they want to purchase, checkout is often seen as a loss of time, regardless of channel. Long tedious payment processes, whether in-store or online, cause friction and spoil the customer experience. Within grocery retailing, where in-store visits are still the main mode of purchase, long lines and checkout times are a common complaint heard by retailers. Grocery retail chains have therefore focused efforts to reduce this friction. For example, in China, Shanghai Owitho Internet Technology Co Ltd launched an unmanned convenience store format under the brand Xing Bian Li. This format allows self-checkout and makes the
whole purchase transaction faster.
Check-out free technologies are also emerging in the USA and Europe with Amazon Go and Øline from Everseen respectively. These technologies are built using Artificial Intelligence (AI), computer vision, biometrics and a network of interconnected smart devices. All consumers need to do is to register and link their payment details to the apps.
In the UAE specifically, Carrefour has introduced Scan & Go where consumers only need scan their Carrefour Club loyalty cards, and then use a device to scan and bag products while they shop. The final process is to visit a dedicated Scan & Go checkout counters to process payments quickly.
Discounters undercut the competitionSearching for value has become an underlying driver of making purchase decisions for consumers especially after the global economic crisis of 2007-2008. Despite economic recovery, growth has been slow and consumer confidence has not improved too pre-crisis level in both developed and developing markets. Within grocery retailing, searching for value ultimately leads to looking for lower priced items, which has led to the growth of discounters. The discounter channel in grocery retailing will the fastest growing channel despite being heavily concentrated in a few countries. While discounters account for 5% of global grocery retailing in 2018, their share is expected to grow to 5.7% in 2023.
Globally, Aldi and Lidl are 2 of the largest discounters that make use of private labels to undercut prices without compromising on quality.
Voice of the Industry
Growing
competitionfrom private label
products has been ranked
the no.1 challenge for retailers
today (19%)
G
LOB
AL
FOO
D A
ND
BEV
ERA
GE
SEC
TOR
41

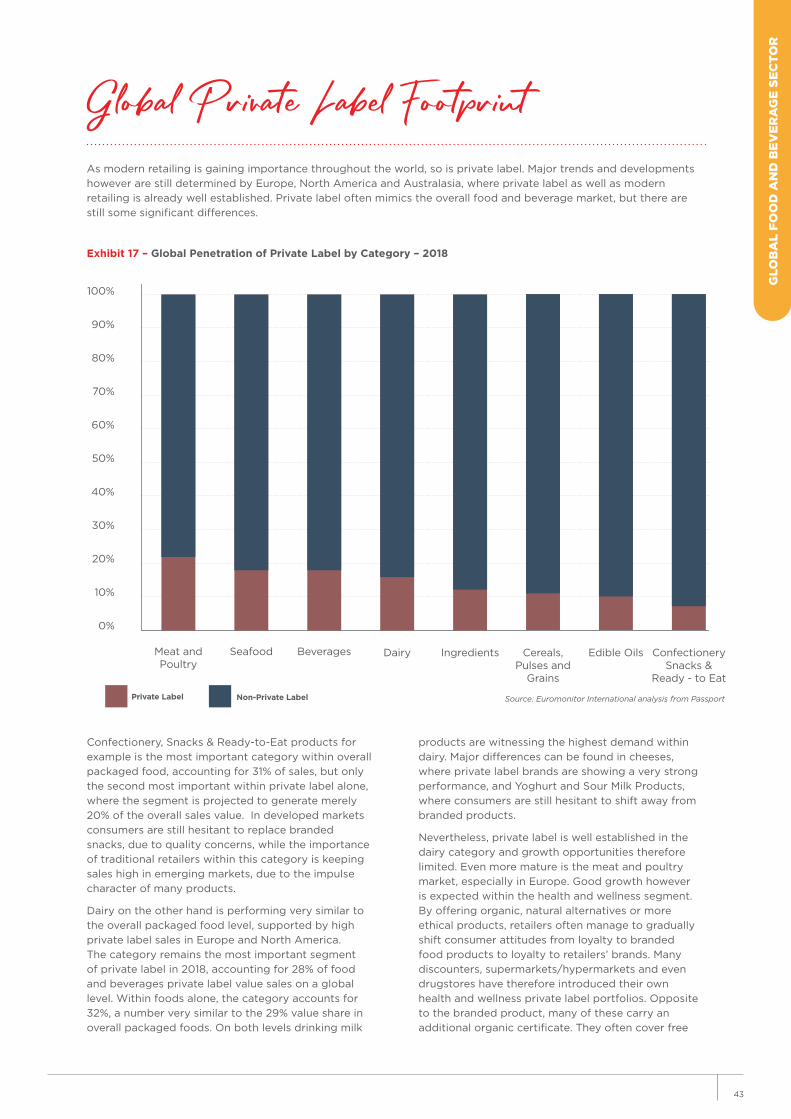
Global Private Label Footprint
Confectionery, Snacks & Ready-to-Eat products for example is the most important category within overall packaged food, accounting for 31% of sales, but only the second most important within private label alone, where the segment is projected to generate merely 20% of the overall sales value. In developed markets consumers are still hesitant to replace branded snacks, due to quality concerns, while the importance of traditional retailers within this category is keeping sales high in emerging markets, due to the impulse character of many products.
Dairy on the other hand is performing very similar to the overall packaged food level, supported by high private label sales in Europe and North America. The category remains the most important segment of private label in 2018, accounting for 28% of food and beverages private label value sales on a global level. Within foods alone, the category accounts for 32%, a number very similar to the 29% value share in overall packaged foods. On both levels drinking milk
As modern retailing is gaining importance throughout the world, so is private label. Major trends and developments however are still determined by Europe, North America and Australasia, where private label as well as modern retailing is already well established. Private label often mimics the overall food and beverage market, but there are still some significant differences.
Exhibit 17 – Global Penetration of Private Label by Category – 2018
100%
90%
80%
70%
60%
50%
40%
30%
20%
10%
0%
Private Label Non-Private Label
Meat and Poultry
Seafood Beverages Dairy Ingredients Cereals, Pulses and
Grains
Confectionery Snacks &
Ready - to Eat
Edible Oils
Source: Euromonitor International analysis from Passport
products are witnessing the highest demand within dairy. Major differences can be found in cheeses, where private label brands are showing a very strong performance, and Yoghurt and Sour Milk Products, where consumers are still hesitant to shift away from branded products.
Nevertheless, private label is well established in the dairy category and growth opportunities therefore limited. Even more mature is the meat and poultry market, especially in Europe. Good growth however is expected within the health and wellness segment. By offering organic, natural alternatives or more ethical products, retailers often manage to gradually shift consumer attitudes from loyalty to branded food products to loyalty to retailers’ brands. Many discounters, supermarkets/hypermarkets and even drugstores have therefore introduced their own health and wellness private label portfolios. Opposite to the branded product, many of these carry an additional organic certificate. They often cover free
G
LOB
AL
FOO
D A
ND
BEV
ERA
GE
SEC
TOR
43
from products, especially dairy alternatives as well as naturally healthy products such as honey or cereal bars and an increasing number of meat alternatives. Consumers interested in such products are already health-conscious and thereby easily tempted to choose the organic and often cheaper private label alternative.
As a whole, private label accounts for 10% of global food and beverage sales in 2018, with a significantly lower ratio within beverages (5%) in comparison to packaged foods (12%). Major differences can also be found between regions, as the retail landscape usually dictates the level of private label penetration. Modern trade is a must for private label and sales are therefore naturally higher in developed markets with a strong presence of chained supermarkets/hypermarkets, convenience stores and of course discounters. The highest private label sales can be found in Europe, where they account for 22% of overall food and beverage sales in 2018. Europe is followed closely by Australasia with 16% and North America with 14%. Asia Pacific, Middle East and North Africa, Latin America and Sub-Saharan Africa all register significantly lower shares of private label sales, with numbers between 2-3%.
Especially among the emerging middle class in developing markets, private label still has an image of being a cheap and low quality alternative to established international brands. Furthermore, setting up a viable private label business requires an extensive network of stores, which is not feasible in many emerging markets, as traditional grocers remain dominant.
Middle East FocusThe continuous growth of modern retailing is strengthening sales of private label in many countries in the Middle East and North Africa. Especially the expansion of Turkey’s discounter Bim has had a positive impact on the category. The largest market for Private Label in the region is Turkey, where Bim is leading grocery retailing and the strongest growth for private label was seen in Morocco, where the category witnessed a CAGR of 59% between 2013 and 2018 on the back of the discounter’s massive expansion in terms of outlets. Private Label sales in the GCC remained limited over the years, even though the strong network of modern retailing would have supplied a perfect base for strong penetration. Recent developments however suggest a rapid change in the coming years.
Hypermarkets in the GCC started to invest into private label premium lines to address growing demand for more budget-friendly healthy foods. Carrefour Bio for example received a strong boost through the development of a “Healthy Kitchen section” in several of its’ UAE outlets. The brand offers affordable
organic options of various packaged food items and is appreciated by the growing number of health conscious consumers.
Private Label in the GCC is also expected to highly benefit from the introduction of the discounter concept in the region. Dukan, the first and sole discounter in Saudi Arabia was introduced in 2014 and has since gained strong market share. In 2018, Landmark group opened a discounter called Viva in the UAE, which is expected to expand its store count rapidly over the coming years. The discounter concept appears during a time that consumers throughout the GCC re-think their spending habits, as they face austerity measures, economic restructuring processes and the implementation of additional taxes and costs. This will give discounters and private label portfolios an opportunity to prove their superiority over branded products in terms of value and could lay the foundation for a long-term private label boom in the region.
Developed Markets FocusA very different picture and level of private label acceptance can be found in Europe, explaining the success of the concept there. Discounters like Lidl and Aldi have created a business model based on private label, which has shaped the view and acceptance of the whole industry in the region. Most discounters offer a diverse range of economy, midrange and premium products for very competitive prices. This has raised the bar on consumers’ quality versus value for money perceptions. Furthermore, many premium products, such as organic ranges thereby became affordable to a broader consumer segment.
Similar developments can be seen in Australasia and even North America, where private label is already established in leading supermarket/hypermarket chains. Both regions are expected to see an additional boost through the expansion of discounters like Aldi and Lidl in the coming years.

Manufacturers are the category with highest expectations: two thirds forecast a growth in their revenues by more than 5% in the next 12 months, with only 5% who expect, on the other hand, a drop.
Turnover next year Vs Activity
Turnover next year Vs Turnover
Turnover next year Vs Category
Professionals in the Ingredients business are the most positive for the future ahead:
Interestingly, the analysis by turnover show a more polarized outcome: companies with higher turnover expect less relevant variations in the total volume of business, with the lowest share of respondents who expect a drop in revenues (7.4%), and the highest of stable (34.2%) and growth up to 25% (51.1%). The smaller the business, the highest the share of companies who expect a contraction in their revenues, as well as - on the opposite - an increase of more than 25%.
0% 10% 20% 30% 40% 50% 60% 70% 80% 90% 100%
Manufacturer
Wholesalers, Traders & Distributors
Retailers
Hospitality & Foodservice
Turnover next year Vs Category
BoomStrong growthGrowthStableDropBig dropCrisis
0% 10% 20% 30% 40% 50% 60% 70% 80% 90% 100%
Ingredients
Meat & poultry
Pulses, Grains & Cereals
Premium, Gourmet & Fine Foods
Confectionery, Snacks & Ready-to-Eat
Beverages
Seafood
Dairy
Fats & Oils
Turnover next year Vs Activity
Crisis Big drop Drop Stable Growth Strong growth Boom
0% 10% 20% 30% 40% 50% 60% 70% 80% 90% 100%
50+ Million USD
11-50 Million USD
1-10 Million USD
< 1 Million USD
Turnover next year Vs Turnover
Crisis Big drop Drop Stable Growth Strong growth Boom
G
LOB
AL
FOO
D A
ND
BEV
ERA
GE
SEC
TOR
Voice of the Industry
4545

How do you expect your company will perform across the following channels in 2019 (vs 2018)?
Channels performance - Manufacturer
Channels performance - Wholesalers, Traders & Distributors
0% 10% 20% 30% 40% 50% 60% 70% 80% 90% 100%
Supermarkets & Hypermarkets
Internet, E-commerce
Food Service & HORECA
Convenience Stores &Forecourt Retailers
Traditional Grocery Retailers
Discounters
Channels performance - Manufacturer
Crisis: -51% or below Big drop: from -50% to -26% Drop: from -25% to -6%
Stable: from -5% to +5% Growth: from +6% to +25% Strong growth: from +26% to +50%
Boom: +51% or above
0% 10% 20% 30% 40% 50% 60% 70% 80% 90% 100%
Food Service & HORECA
Supermarkets & Hypermarkets
Internet, E-commerce
Convenience Stores &Forecourt Retailers
Traditional Grocery Retailers
Discounters
Channels performance - Wholesalers, Traders & Distributors
Crisis: -51% or below Big drop: from -50% to -26% Drop: from -25% to -6%
Stable: from -5% to +5% Growth: from +6% to +25% Strong growth: from +26% to +50%
Boom: +51% or above
Voice of the Industry

Beverage Sector

Beverages Industry - At a Glance
Asia Pacific Australasia Europe Latin AmericaMiddle
East & North Africa
North America
Sub-Saharan Africa
Consumer spending on beverages as % of total F&B
7% 11% 10% 13% 9% 4% 36%
Key Growth Markets (2013-2018)
UzbekistanPakistanVietnamTajikistan
Laos
New ZealandAustralia
HungaryBelarusSwedenRomaniaBulgaria
VenezuelaParaguayArgentinaGuatemala
Peru
LibyaQatar
MauritaniaDjiboutiLebanon
CanadaUSA
CameroonSenegalUgandaBeninMali
Key Sub-categories*
Soft Drinks (78%)
Hot Drinks (22%)
Soft Drinks (82%)
Hot Drinks (18%)
Soft Drinks (70%)
Hot Drinks (30%)
Soft Drinks (82%)
Hot Drinks (18%)
Soft Drinks (73%)
Hot Drinks (27%)
Soft Drinks (86%)
Hot Drinks (14%)
Soft Drinks (79%)
Hot Drinks (21%)
Key Channels**
Traditional Grocery Re-tailers (56%)Supermar-
kets/Hyper-markets (31%)
Supermar-kets/Hy-
permarkets (89%)
Traditional Grocery Re-tailers (4%)
Supermar-kets/Hyper-
markets (59%)Discounters
(15%)
Supermar-kets/Hyper-
markets (61%)Traditional
Grocery Re-tailers (30%)
Supermar-kets/Hy-
permarkets (43%)
Traditional Grocery Re-tailers (42%)
Supermar-kets/Hyper-
markets (56%)Traditional
Grocery Re-tailers (27%)
Traditional Grocery Re-tailers (69%)Supermar-kets/Hy-
permarkets (26%)
Hot drinksFastest growth channels (CAGR 2011-16)
DiscountersInternet retail-
ing (34%)
Internet retail-ing (9%)
Discounters (3%)
Internet retail-ing (7%)
Convenience Stores & Fore-court Retailers
(1%)
Others (7%)Internet retail-
ing (5%)
Internet retail-ing (26%)
Discounters (11%)
Internet retail-ing (9%)
Discounters (1%)
Internet re-tail-ing (34%)
Supermar-kets/
Hypermar-kets (2%)
Hot drinksSlowest growth channels(CAGR 2011-16)
Others (-3%)Traditional
Grocery Re-tailers (2%)
others(1%)
Supermar-kets/
Hypermarkets (0%)
Traditional Grocery Re-tailers (-2%)Supermar-
kets/Hypermarkets
(-1%)
Supermar-kets/
Hypermarkets (0%)
Traditional Grocery Re-
tailers (1%)
Traditional Grocery Re-
tailers (1%)
Others (5%)
Convenience Stores & Fore-court Retailers
(-4%) Supermar-
kets/Hypermarkets (-2%) (0.5%)
Discounters (-2)
Traditional Grocery Retailers
(1%)
Soft drinks Key Channels**
Traditional Grocery Re-
tailers (44%)
Supermar-kets/
Hypermarkets (34%)
Supermar-kets/
Hypermarkets (70%)
Convenience Stores and Forecourt
Retailers (21%)
Supermar-kets/
Hypermarkets (47%)
Traditional Grocery Re-
tailers (21%)
Traditional Grocery Re-
tailers (48%)
Supermar-kets/Hyper-
markets (36%)
Supermar-kets/
Hypermarkets (42%) (42%)Traditional
Grocery Re-tailers (41%)
Supermar-kets/
Hypermarkets (54%)
Convenience Stores and
Forecourt Re-tailers (18%)
Traditional Grocery Re-tailers (74%)Supermar-kets/Hy-
permarkets (12%)
Soft drinksFastest growth channels (CAGR 2013-18)
Internet retail-ing (19%)
Convenience Stores and
Forecourt Re-tailers (8%)
Internet Re-tailing (16%)Discounters
(12%) Internet retailing (%)
Internet retail-ing (11%)
Convenience Stores and
Forecourt Re-tailers (6%)
Others (5%)Internet retail-
ing (5%)
Internet retail-ing (39%)
Discounters (11%) (6.2%)
Internet retail-ing (5%)
Others (5%)
Supermar-kets/
Hypermar-kets (9%)
Internet re-tailing (9%)
Soft drinksSlowest growth channels(CAGR 2011-16)
Discounters (1%)
Others (1%)
Supermar-kets/
Hypermarkets (0%) (0%)
Others (0%)
Supermar-kets/
Hypermarkets (-1.4%) (0%)
Traditional Grocery Re-tailers (1%)
Supermar-kets/
Hypermarkets (0%)
Traditional Grocery Re-
tailers (0%)
Others (-6%)Convenience
Stores & Fore-court Retailers
(2%) (2%)
Traditional Grocery Re-
tailers (-12%)
Supermar-kets/
Hypermarkets (2%)
Discounters (4%)
Others (7%)
Notes: * Market share of overall beverages market in 2018** Market channel share of overall beverages market in 2018
Source: Euromonitor International analysis from Passport

Exhibit 18 - Beverage Value Sales in 2018, 2023 & CAGR 2018-2023, US$ billion
Market Size and Potential Moderate Growth for Beverages Expected as Consumer Choices Evolve
The total beverage market in 2018 stood at US$691 billion, up from US$631 billion in 2013 and is expected to reach US$773 in 2023. Global growth will remain moderate, but stable with a projected forecast CAGR of 2.27% in the coming 5 years. Some major shifts between subcategories however are anticipated, as health and wellness impacts consumption patterns.
The fastest growing beverage markets between 2013 and 2018 were found in Sub-Saharan Africa, and the Middle East and North Africa, where strong population growth, an expansion of modern retailing and urbanization naturally boost demand. For similar reasons, growth rates in these two regions are also expected to remain the strongest over the coming five years. Additional support will be growing demand for hot drinks. Many countries in Sub-Saharan Africa and the Middle East and North Africa are witnessing the formation of an on-trade coffee culture through the expansion of domestic and international chains like Starbucks, Café Neo, Kaldi’s Coffee, Vida e Caffé, Costa Coffee and others. As consumers try to replicate the experience at home, off-trade coffee sales are growing
as well. Similar developments, especially good growth for hot drinks can be seen in Asia Pacific and Latin America as well. This is further supported by slow growth or even declining rates for carbonates in many markets, as several countries have introduced taxes on sugar-sweetened beverages.
Australasia was the slowest growing region for overall beverages in the past 5 years, as growing health awareness has dampened sales of sweetened drinks and beverages with artificial ingredients. Anti-sugar trends and a growing demand for naturally healthy products will also be the main reason for low growth in North America between 2018-2023. Several major US cities have placed taxes on sweetened beverages, with a devastating impact on the carbonates industry.
0.5% 140.7bn
137.3bn 1.9% 165.5bn
150.9bn
2.7% 110.0bn
96.3bn
4.7% 42.8bn
34.1bn
3.6% 49.9bn
41.8bn
2.7% 25.3bn
221.0bn
2.7% 11.3bn
9.9tn
Key: Inner circles indicate the Beverages market size in 2018, outer circles indicate market size in 2023
The distance between the inner and outer circles indicates the size of the absolute growth
The colour of the circles indicates the growth rate: Fast Moderate Slow Static
Source: Euromonitor International analysis from Passport
B
EVER
AG
ES
49

Exhibit 19 - Beverages Regional Value Sales Breakdown in 2018, 2023
100%
80%
60%
40%
20%
0%
Hot Drinks Soft Drinks
Asia Pacific Australasia Europe Latin America
Middle East & North Africa
North America
Sub-Saharan Africa
Source: Euromonitor International analysis from Passport
Similar developments are shaping the soft drinks market in Europe and growth within beverages is therefore expected to either come from functional and healthy soft drinks or through developments within hot drinks. In Western Europe, consumers also started to embrace zero-calorie alternatives in carbonates, while beverages derived from CBD oil could become an interesting area for global beverage companies in North America. CBD products are promoted for their potentially relaxing benefits and have seen high demand after partial legalisation of cannabis in some US localities and full federal legalisation in Canada in 2018.
Growing demand for hot drinks on the other hand is highly supported by an on-going premiumization trend in most markets. In Australasia and North America for example, fresh and pod coffee from speciality sources is growing in popularity as consumers want to replicate the foodservice experience at home. The hot drinks market is additionally supported by growing demand for herbal teas, which appeal to consumers for their health and functional benefits. Similar developments can be observed in Asia-Pacific, where green/white and herbal teas are seen as a healthy alternative to carbonates and concentrates and often bought as an aid to digestion or to improve skin complexion. The health and wellness trend is also responsible for strong growth of green and herbal teas in many markets in Europe and the Middle East and North Africa. Specific to the Middle East and North Africa and Asia-Pacific however is a shift from the traditional loose tea towards the more convenient form of tea bags.
Interesting innovations within
the beverage field therefore appeared mainly within the health and wellness sector. In the US, the largest market for overall beverages, both coffee and tea saw the introduction of products marketed for their health benefits as well as the incorporation of healthy ingredients from around the world.
Eight O’Clock Coffee for example expanded its infusions line by three flavours in 2017, each marketed for specific functional health benefits. Two varieties thereby used naturally healthy ingredients from around the world-Acai and turmeric- as the key functional ingredient.
Choice Organic Teas’ mushroom wellness range followed a similar strategy. These teas combine mushrooms (which Choice Organics indicates supports a healthier immune system) with ingredients such as turmeric and matcha. By indicating the functional benefits of each variety of tea on the box, Choice Organic is targeting consumers looking for specific attributes.
The positive image of hot drinks was also increasingly used to boost sales of soft drinks, with RTD coffee and RTD tea witnessing several important introductions. After Starbucks’ tie-up with PepsiCo proved to be a success, Coca-Cola made a deal with Dunkin’ Donuts to launch Dunkin’ Donuts RTD coffee in February 2017. Inspired by Starbucks’ success other companies, especially from
within the dairy sector followed suit. The UAE based company Al Rawabi and
the Saudi dairy giant Al Othman Group, the owner of
the Nada brand for example both
launched their own range of RTD coffees.

Market Trends and DriversNatural, healthy and functional beverages are shaping the beverage marketThe defining trend within beverages remains health and wellness. In face of an obesity epidemic and growing rates of diabetes and cardiovascular diseases consumers all over the world are interested in tasty, healthy and convenient alternatives to sugar-loaded carbonates. This is supported by government-led campaigns to limit the sugar intake through beverages in many countries. Several markets, including Saudi Arabia, the UAE, the UK, South Africa and the Philippines introduced new or higher soda/sugar taxes, directly affecting sales of carbonates and boosting the market for healthier options as a result. Within soft drinks, this has supported the development of two key areas: The first comprises of products positioned as natural alternatives or naturally “better for you” products such as water, not from concentrate 100% juices or green/white and herbal teas. The second key area is functional products. Especially in developing and emerging markets, consumers are showing an increasing interest in products fortified with minerals, vitamins, herbs or botanicals to reach daily intake recommendations.
Ethical labels as a unique selling pointEthical considerations are increasingly important to consumers of hot drinks. Ethical labels have thereby become the standard tool for measurement and assurance in developed markets, as consumers are not only aware of many common ethical labels, but also trust the NGO’s behind them to ensure authenticity. Within hot drinks, sustainability/environment certificates such as UTZ Rainforest Alliance, Fairtrade and Ethical Tea Partnership are leading, demonstrating the increasing awareness and concern for this topic. Future opportunities based on ethical labels are expected to also arise in emerging markets, as sustainability awareness started to develop in line with the formation of a larger middle class and growing health consciousness. Ethical labels are thereby expected to become a unique selling point, verifying a brand’s ethical credentials. As ethical labels are already quite established in many markets for coffee, consumers are also expected to demand a similar development within the tea segment and at some point, within soft drinks. A sustainable approach is increasingly seen as being part of a healthy product. The demand for tea as a healthy beverage is therefore expected to raise questions about the production process in regard to sustainability and human welfare, while soft drinks marketed as healthy could see a similar development.
Premiumization shapes the beverage industry Consumers of soft and hot drinks are willing to spend more on high-quality products, exotic flavours, special aromas and nutritional benefits as well as convenience. The most developed examples of this trend are flourishing subscription-based personalised tea sales in Asia-Pacific and growing home delivery services of specialty coffee and tea in bean or leaf formats in many developed markets, such as the UK. Other results, are the development of extravagant flavours, often inspired by countries and cultures and the introduction of flavour varieties. Premiumization within soft drinks on the other hand is based on the above-mentioned health trend, as many consumers are ready to pay high prices for premium juices, smoothies and plant waters to enjoy a combination of good taste and nutritional benefits. Such products are often distributed in smaller packaging types for convenient on-the-go consumption through channels like convenience stores or forecourt retailers.
B
EVER
AG
ES
51

Competitive LandscapeThe global beverage market is relatively consolidated and dominated by large multinational companies, namely Coca-Cola Co, The and PepsiCo Inc within the soft drinks sector and Nestlé SA, Jacobs Douwe Egberts and Unilever Group within hot drinks.
Rank Company Global Market Share
1 Coca-Cola Co, The 17.38%
2 PepsiCo Inc 7.28%
3 Nestlé SA 5.65%
4 Suntory Holdings Ltd 1.92%
5 Dr Pepper Snapple Group Inc 1.60%
6 Red Bull GmbH 1.46%
7 Unilever Group 1.40%
8 Jacobs Douwe Egberts 1.35%
9 Danone, Groupe 1.34%
10 Monster Beverage Corp 1.30%
11 Private Label 5.19%
12 Others 54%
Source: Euromonitor International analysis from Passport
Exhibit 20 - Global Company Shares 2018 - Beverages
Coca-Cola and PepsiCo are benefiting from their broad portfolios and strong consumer loyalty towards its’ carbonates brands, accounting for a combined share of 31% within soft drinks in 2018. Private Label, specifically strong within water and juices holds a share of merely 5% in overall soft drinks.
Nestlé SA and Jacobs Douwe Egberts are the leading players within the consolidated brand environment for coffee. Especially Nestlé has a strong portfolio of different product types to cater to various demands all over the world. Unilever is the largest manufacturer within the otherwise very fragmented tea segment, due to the popularity of its’ Lipton portfolio.

Distribution LandscapeSuper/Hypermarkets remain dominant distribution channel for beverages
Bricks and mortar stores remain dominant within the distribution of soft and hot drinks, despite good growth for internet sales.
Exhibit 21 - Global Soft Drinks Volume Sales Split by Retail Channels, 2013-2018
Exhibit 22 - Global Hot Drinks Volume Sales Split by Retail Channels, 2013-2018
100%
90%
80%
70%
60%
50%
40%
30%
20%
10%
0%
100%
90%
80%
70%
60%
50%
40%
30%
20%
10%
0%
Convenience Stores and Forecourt Retailers
Convenience Stores and Forecourt Retailers
Traditional Grocery Retailers
Traditional Grocery Retailers
Discounters
Discounters
Supermarkets/ Hypermarkets
Supermarkets/ Hypermarkets
Internet Retailing
Internet Retailing
2012
2012
2013
2013
2014
2014
2015
2015
2016
2016
2017
2017
2018
2018
Source: Euromonitor International analysis from Passport
Source: Euromonitor International analysis from Passport
B
EVER
AG
ES
53

Supermarkets/hypermarkets remain the most important channel for beverages globally, while traditional grocery retailers retain their position as the second most important channel. The latter thereby managed to keep its’ global market share relatively stable between 2013 and 2018, despite strong investment in modern retailing in all regions. Supermarkets/hypermarkets on the other hand lost shares to internet retailers and convenience stores and forecourt retailers.
The growing importance of these channels reflect the increasing demand for convenience among urban societies in many countries. Especially convenience stores are becoming more important, as they are often conveniently placed around public transportation, in crowded city centres and shopping malls or as a modern substitute for traditional grocers functioning as neighbourhood stores.
While discounters expanded their network in most regions between 2013 and 2018, their share remained stagnant on a global level. This is in line with developments in Europe. the core market for this store type.
Coming from a low base, internet retailing saw its importance rise the most, especially in the hot drinks category. Sales through this channel increased in line with growing demand for premium teas and coffees as well as specialty drinks. Consumers appreciate the variety available online as well as the convenience of home delivery.
Urbanization in line with shrinking household sizes is expected to be a major force in future retail developments on a global level: Faced with an aging society and increasingly busy lifestyles, consumers in mature markets such as Europe and North America are expected to turn towards smaller stores in urban environments. Accessibility and the availability of smaller packaging sizes are thereby key and cater to the demands of both groups.
Rapid urbanisation also allows an increasing number of consumers to access mobile phones and social media. Information and positive reinforcement increasingly comes in the form of online interaction with leading brands. While this is benefiting online sales, digital marketing campaigns are also often used in combination with in-store promotions and discounts. An excellent example for a successful online marketing strategy is Halo Top ice cream. The brand’s popularity grew based on word-of mouth marketing, which was triggered solely by social media advertisements and a cooperation with fitness gurus on YouTube.

Challenges and Opportunities
Chal lenges
Rising health and wellness awareness towards beverages with sugar impact less diverse manufacturers to a greater extent
Effects of climate change, especially new
pat-terns in terms of rainfall and temperature
Lack of training and agricultural support to sta-bilise and expand
production of key crops
Mismanaged water resources creates
scarcity and higher access charges
Rising consumer health and wellness awareness impacting sugar heavy
categories
Increasing regulatory control and additional
tax regimes concerning ingredient content e.g.
sugar
Higher production costs due to increasing
regulation of packaging e.g. PET Bottles, BPA-
free coatings
Evaluation of ethical credentials, sourcing
and sustainability policies by consumers
Key: Moons indicate the level of direct impact on each stakeholder
The fuller the moon, the higher the direct impact:
Low _________________________> high
Supplier/farmer ManufacturerWholesale / import - exporter
Retailer
B
EVER
AG
ES
55
Opportunities
Product customisation is the key to capitalising opportunities across most regions
Premiumization trend within coffee and tea
Agricultural developments and
technologies to improve crops
Increasing demand for naturally healthy
beverages, especially in developed markets
Growing appreciation of vitamin and mineral
fortification in many developing and
emerging markets
Ethical labelling as a unique selling point
within hot drinks
Consumer eagerness to try innovative products as well as products and
ingredients from around the world
Smart packaging to ensure freshness
and low use of preservatives
Increasing demand for on-the-go consumption
and convenience
Key: Moons indicate the level of direct impact on each stakeholder
The fuller the moon, the higher the direct impact:
Low _________________________> high
Supplier/farmer ManufacturerWholesale / import - exporter
Retailer


Beverages Sector
CONFIDENCE INDEXCurrent performance satisfaction vs. expected growth
Satisfaction - current performance Vs Activity
Confidence - Over the next 12 months Vs Activity
Confidence - Over the next 3 years Vs Sector
Negative Neutral Positive
Voice of the Industry

Main Challenge
Manufacturer
Higher regulatory control & production costs
Adapting to new retail and distribution models
Volatile commodity prices
Growing competition from Private Label products
1
2
3
4
Key TrendsKey Trends Vs Activity Beverages
Organic & Free-from 52.20%
Private Label 36.30%
Plastic bans on packaging, retail and foodservice 29.70%
Honest advertising & labeling 29.10%
Premium & Gourmet 24.20%
Ethical living: Eco-friendly, Halal and Fair trade 23.10%
Elevated convenience, 'grab-and-go' 15.90%
Food waste prevention 15.40%
Fortified & Functional 14.80%
Westernization & diversification of diet 13.70%
Farm to fork sustainability 12.10%
Animal welfare 3.30%
Main growth channel in the next 12 months by sectorProduct portfolio and strategy Vs Sector Beverages
Direct Sales to customer 38.80%
Private Label 30.00%
Research & Development 26.50%
Current Channels 21.80%
Contract Manufacturing 19.40%
Own ecommerce 14.70%
Mergers & Acquisitions 14.10%
Third-party ecommerce 10.00%
Omni-channel retailing 8.80%
Other 4.70%
B
EVER
AG
ESVoice of the Industry
5959

Critical Factors - Beverages
Consumer attention - Beverages
Top growth strategy for the next 3 years by sector
Beverages
Venture into new market Grow product portfolio Reduce cost / Enter value-for-money category
Explore new F&B category
40.2%
24.3%
17.8%
17.8%
30%
26%
27%
24%
21%
14%
9%
11%
11%
32%
26%
22%
23%
26%
28%
26%
22%
19%
0% 10% 20% 30% 40% 50% 60% 70%
Selling price (strong competition)
Input/raw material costs
Payment timeline/difficulty in getting paid
Cost of capital/access to credit
Tax, regulatory, bureaucratic aspects
Workforce cost
Fast-changing sector
Shortage of professional education / training
Patents and trademarks/counterfeiting problem
Critical factor - Beverages
Extremely critical Fairly critical
0% 10% 20% 30% 40% 50% 60% 70%
Patents and trademarks/counterfeiting problem
Shortage of professional education / training
Fast-changing sector
Workforce cost
Tax, regulatory, bureaucratic aspects
Cost of capital/access to credit
Payment timeline/difficulty in getting paid
Input/raw material costs
Selling price (strong competition)
Critical factor -Beverages
Extremely critical Fairly critical
6%
6%
14%
11%
15%
13%
19%
23%
28%
44%
49%
16%
26%
24%
27%
28%
30%
26%
35%
37%
34%
32%
0% 10% 20% 30% 40% 50% 60% 70% 80% 90%
Vegan
Premium/gourmet
Organic Certified
Free-from
Private label
Sustainability
Halal Certified
Packaging
Brand
Price
Quality
Consumer attention - Beverages
Extreme impact Significant impact
Voice of the Industry

Dairy

Dairy Industry - At a Glance
Asia Pacific Australasia Europe Latin AmericaMiddle
East & North Africa
North America
Sub-Saharan Africa
Consumer spending on dairy as % of total F&B*
5% 12% 11% 8% 8% 2% 20%
Key Growth Markets (2013-2018)
IndiaLaos
VietnamBhutan
Myanmar
New ZealandAustralia
RomaniaEstoniaAlbaniaKosovo
Macedonia
ChileDominican Republic
GuatemalaHaiti
Costa Rica
QatarAlgeria
LebanonSudanOman
CanadaUSA
EthiopiaBurkina Faso
ComorosMali
Gambia
Key Sub-categories**
Drinking Milk Products
(56%)Yoghurt and
Sour Milk Products
(29%)Cheese (5%)
Drinking Milk Products
(45%)Yoghurt and
Sour Milk Products
(25%)Cheese (16%)
Cheese (37%)Drinking Milk
Products (45%)
Other Dairy (16%)
Drinking Milk Products
(36%)Cheese (30%) Yoghurt and
Sour Milk Products
(15%)
Drinking Milk Products
(31%)Cheese (28%) Yoghurt and
Sour Milk Products
(21%)
Cheese (36%)Drinking Milk
Products (29%)
Yoghurt and Sour Milk Products
(14%)
Drinking Milk Products
(51%)Butter and
Spreads (15%)
Cheese (13%)
Key Chan-nels***
Super-markets/
hypermarkets (44%)
Traditional grocery retail-
ers (35%)
Super-markets/
hypermarkets (72%)
Traditional grocery retail-
ers (10%)
Super-markets/
hypermarkets (60%)
Discounters (18%)
Super-markets/
hypermarkets (48%)
Traditional grocery retail-
ers (38%)
Traditional grocery re-
tail-ers (49%)Super-
markets/ hypermarkets
(40%)
Super-markets/
hypermarkets (79%)
Others (9%)
Traditional grocery re-
tailers (48%)Supermar-kets/ hy-
permarkets (39%)
Fastest grow-ing channels (CAGR 2011-16)
Internet re-tailing (33%), Discounters
(10%)
Internet retailing (18%),
Discounters (13%)
Internet re-tailing (10%), Discounters
(3%)
Convenience stores & fore-court retailers (16%), Internet retailing (15%)
Internet retailing (51%),
Discounters (9%)
Internet retailing (19%),
Discounters (3%)
Internet re-tailing (55%), Discounters
(13%)
Slowest growth channels(CAGR 2011-16)
Others (1%)Traditional
Grocery Re-tailers (5%)
Traditional grocery retail-
ers (-1%)Supermar-
kets/ hyper-markets (2%)
Traditional grocery retail-
ers (0%)Others (0%)
Supermar-kets/ hyper-markets (7%)
Traditional grocery retail-
ers (8%)
Others (-4%)Tradition-al grocery retailers
(6%)
Tradition-al grocery retailers
(-1%)Others (1%)
Supermar-kets/ hyper-markets (9%)Others (10%)
Note: * Consumer spending on dairy also includes spending on eggs ** Market share of overall dairy market in 2016
*** Market channel share of overall dairy market in 2016Source: Euromonitor International analysis from Passport
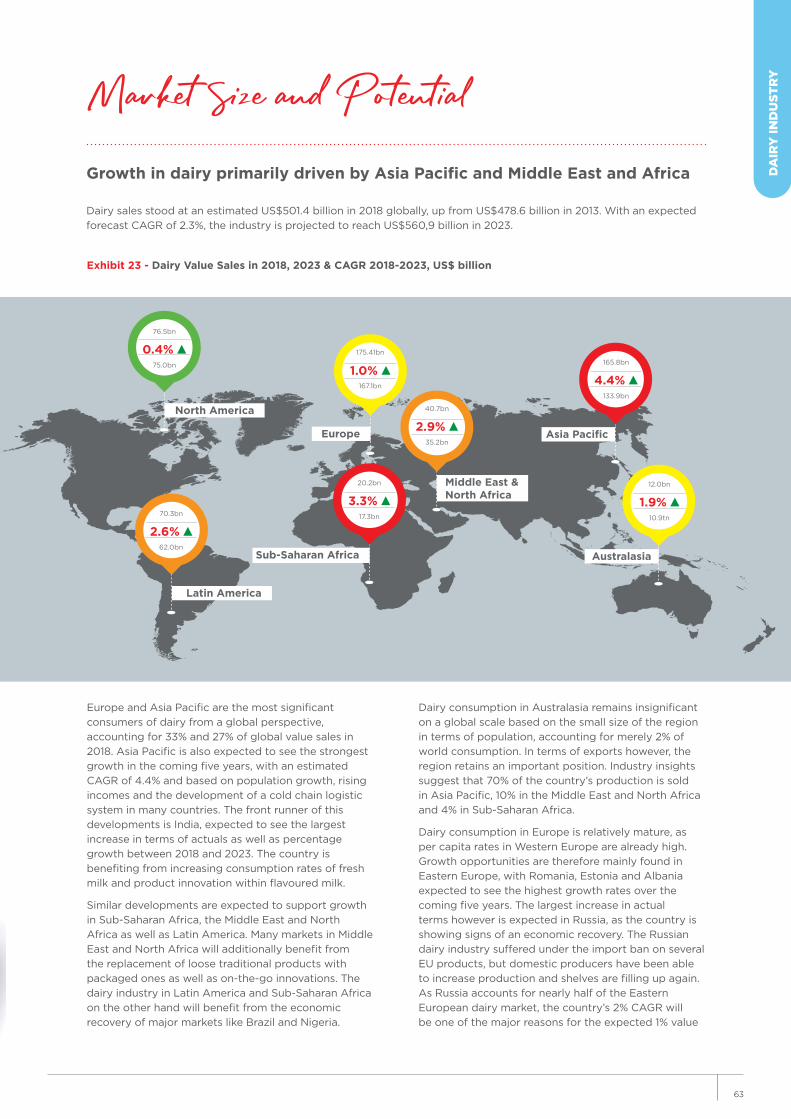
Dairy Industry - At a Glance
Exhibit 23 - Dairy Value Sales in 2018, 2023 & CAGR 2018-2023, US$ billion
Market Size and Potential
Growth in dairy primarily driven by Asia Pacific and Middle East and Africa
Dairy sales stood at an estimated US$501.4 billion in 2018 globally, up from US$478.6 billion in 2013. With an expected forecast CAGR of 2.3%, the industry is projected to reach US$560,9 billion in 2023.
Europe and Asia Pacific are the most significant consumers of dairy from a global perspective, accounting for 33% and 27% of global value sales in 2018. Asia Pacific is also expected to see the strongest growth in the coming five years, with an estimated CAGR of 4.4% and based on population growth, rising incomes and the development of a cold chain logistic system in many countries. The front runner of this developments is India, expected to see the largest increase in terms of actuals as well as percentage growth between 2018 and 2023. The country is benefiting from increasing consumption rates of fresh milk and product innovation within flavoured milk.
Similar developments are expected to support growth in Sub-Saharan Africa, the Middle East and North Africa as well as Latin America. Many markets in Middle East and North Africa will additionally benefit from the replacement of loose traditional products with packaged ones as well as on-the-go innovations. The dairy industry in Latin America and Sub-Saharan Africa on the other hand will benefit from the economic recovery of major markets like Brazil and Nigeria.
Dairy consumption in Australasia remains insignificant on a global scale based on the small size of the region in terms of population, accounting for merely 2% of world consumption. In terms of exports however, the region retains an important position. Industry insights suggest that 70% of the country’s production is sold in Asia Pacific, 10% in the Middle East and North Africa and 4% in Sub-Saharan Africa.
Dairy consumption in Europe is relatively mature, as per capita rates in Western Europe are already high. Growth opportunities are therefore mainly found in Eastern Europe, with Romania, Estonia and Albania expected to see the highest growth rates over the coming five years. The largest increase in actual terms however is expected in Russia, as the country is showing signs of an economic recovery. The Russian dairy industry suffered under the import ban on several EU products, but domestic producers have been able to increase production and shelves are filling up again. As Russia accounts for nearly half of the Eastern European dairy market, the country’s 2% CAGR will be one of the major reasons for the expected 1% value
North America
Latin America
Europe
Middle East &North Africa
Asia Pacific
AustralasiaSub-Saharan Africa
0.4% 76.5bn
75.0bn 1.0%
175.41bn
167.1bn
2.6% 70.3bn
62.0bn
3.3% 20.2bn
17.3bn
2.9% 40.7bn
35.2bn
4.4% 165.8bn
133.9bn
1.9% 12.0bn
10.9tn
D
AIR
Y IN
DU
STR
Y
63

CAGR in overall Europe. Economic growth in Russia is also expected to revive a health and wellness trend and more adventurous purchasing patterns there. This could open up opportunities in less traditional segments, such as flavoured milk drinks or drinking yoghurt.
The North American dairy market is suffering under a growing trend of lactose-free and vegan eating habits.
Especially drinking milk has therefore seen declining demand and storage warehouses are filling up with excess produce. Many farmers started to convert excess milk into butter, powdered milk and cheeses, as these products have a longer shelf life than fluid milk. In light of this glut of long-shelf-life dairy products, unit prices are expected to decline which in return could boost volume growth within other dairy, cheeses as well as butter and spreads.
The defining theme of innovations within dairy were dairy alternatives, often in combination with sustainability and health claims. The discounter Aldi for example introduced a broad private label range of milk alternatives, such as unsweetened and sweetened almond drinks as well as a coconut drink under its’ bio brand in Germany. As the organic certificate enjoys wide popularity and is often seen as a must among health-conscious consumers, this combination is seen as an excellent way to create a competitive edge.
Russia saw similar developments, as Sady Pridonya OAO NPG launched the oat drink NeMoloko, while Coca-Cola introduced its’ international brand of dairy alternatives AdeZ. Both products are designed to
offer a budget-friendly option in this segment, as the economic situation in Russia has forced many consumers to limit their spending.
Hebei Yangyuan Zhihui Beverage in China on the other hand focused on added health benefits and introduced a new walnut milk series made by CET cold brewed technique, while the US market saw a boost of non-dairy alternatives outside of the standard drinking milk segment, as Nestlé introduced Coffee Mate based on almond and coconut milk.
Exhibit 24 - Dairy Regional Value Sales by Product Type in 2018, 2023
100%
90%
80%
70%
60%
50%
40%
30%
20%
10%
0%
Butter and Spreads Yogurt and Sour milk ProductsCheese Drinking Milk
Products Other Dairy
Asia Pacific Australasia Europe Latin America
Middle East & North Africa
North America
Sub-Saharan Africa
Source: Euromonitor International analysis from Passport
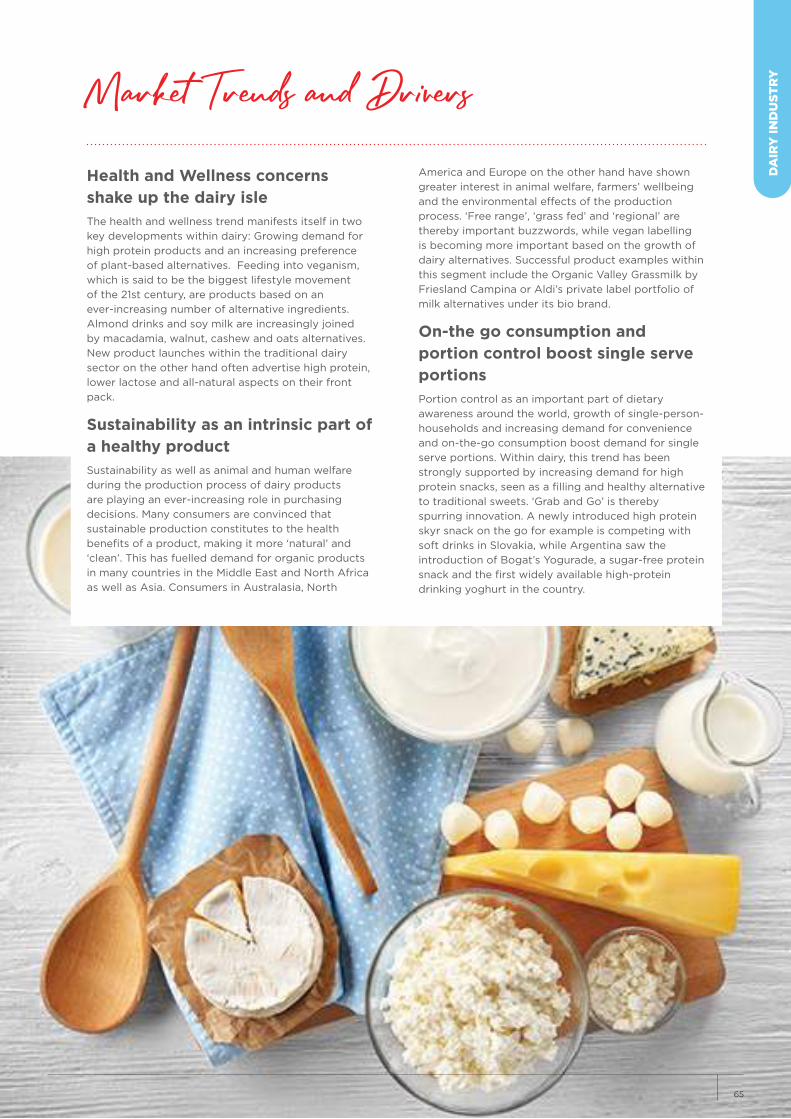
Market Trends and Drivers
Health and Wellness concerns shake up the dairy isleThe health and wellness trend manifests itself in two key developments within dairy: Growing demand for high protein products and an increasing preference of plant-based alternatives. Feeding into veganism, which is said to be the biggest lifestyle movement of the 21st century, are products based on an ever-increasing number of alternative ingredients. Almond drinks and soy milk are increasingly joined by macadamia, walnut, cashew and oats alternatives. New product launches within the traditional dairy sector on the other hand often advertise high protein, lower lactose and all-natural aspects on their front pack.
Sustainability as an intrinsic part of a healthy productSustainability as well as animal and human welfare during the production process of dairy products are playing an ever-increasing role in purchasing decisions. Many consumers are convinced that sustainable production constitutes to the health benefits of a product, making it more ‘natural’ and ‘clean’. This has fuelled demand for organic products in many countries in the Middle East and North Africa as well as Asia. Consumers in Australasia, North
America and Europe on the other hand have shown greater interest in animal welfare, farmers’ wellbeing and the environmental effects of the production process. ‘Free range’, ‘grass fed’ and ‘regional’ are thereby important buzzwords, while vegan labelling is becoming more important based on the growth of dairy alternatives. Successful product examples within this segment include the Organic Valley Grassmilk by Friesland Campina or Aldi’s private label portfolio of milk alternatives under its bio brand.
On-the go consumption and portion control boost single serve portionsPortion control as an important part of dietary awareness around the world, growth of single-person-households and increasing demand for convenience and on-the-go consumption boost demand for single serve portions. Within dairy, this trend has been strongly supported by increasing demand for high protein snacks, seen as a filling and healthy alternative to traditional sweets. ‘Grab and Go’ is thereby spurring innovation. A newly introduced high protein skyr snack on the go for example is competing with soft drinks in Slovakia, while Argentina saw the introduction of Bogat’s Yogurade, a sugar-free protein snack and the first widely available high-protein drinking yoghurt in the country.
D
AIR
Y IN
DU
STR
Y
65

Competitive Landscape
The global dairy market is dominated by private label products, as consumers in many countries don’t see an added value in purchasing higher priced brands from leading multinationals, especially within the drinking milk segment. Furthermore, most discounters in Europe incorporate the health and wellness trend into new product developments, for example through natural ingredient lists or organic certifications, thereby giving consumers an extra incentive to choose private label. The overall market is also fragmented, with local dairy companies often serving a geographically limited market. An exception are Danone, Groupe and Lactalis, Groupe, accounting for 5% and 4% respectively of global dairy sales. Danone managed to earn trust and appreciation among consumers for its’ functional yoghurt portfolio, with high consumer loyalty towards the Activia range. The brand serves consumers looking for a healthier and
convenient way to indulge through several on-the-go packaging sizes, while still retaining its healthy image based on probiotic properties. Lactalis’ success on the other hand is based on a strong cheese portfolio, which is very well established in many European markets and an increasing number of acquisitions in growing markets, such as Turkey and Brazil.
The global dairy market is highly fragmented, with a large presence of local players in many regions.
Exhibit 25 - Global Company Shares 2018 - Dairy
Rank Company Global Market Share
1 Danone, Groupe 4.60%
2 Lactalis, Groupe 4.01%
3 Inner Mongolia Yili Industrial Group Co Ltd 2.91%
4 China Mengniu Dairy Co Ltd 2.76%
5 Nestlé SA 2.54%
6 Kraft Heinz Co 1.69%
7 Royal FrieslandCampina NV 1.38%
8 Arla Foods Amba 1.33%
9 Yakult Honsha Co Ltd 1.11%
10 Savencia Fromage & Dairy 0.90%
11 Private Label 13.83%
12 Others 62.95%
Source: Euromonitor International analysis from Passport

Distribution LandscapeModern grocery retailing dominates distribution of dairySupermarkets/hypermarkets retain their dominant position within the dairy category, accounting for 55% of global value sales in 2018.
Consumers generally perceive modern grocery retailers as more trustworthy in maintaining an effective cooling system and thereby product freshness. Hence, supermarkets/hypermarkets represent an important pillar in supporting the growth of chilled dairy products in developing and emerging markets. The importance of traditional grocers on the other hand is limited and the channel was only dominant in Sub-Saharan Africa and Middle East and North Africa in 2018.
Nevertheless, supermarkets/hypermarkets are still losing shares to other retail formats, such as internet retailing, convenience stores and discounters. Big retail chains all over the world are therefore investing into a more diverse distribution system. Global giants such as Walmart, Carrefour or Woolworths for example have all strengthened their network
of convenience stores and e-commerce to reduce dependency on hypermarkets. While smaller retail formats often replace traditional retailers in developing countries, they are seen as a good way to penetrate city centres and premium suburbs in developed markets.
Another growing channel in many markets benefiting from strong price-consciousness since the 2009 global financial crisis are discounters. Consumers in developed markets started to see an absence of truly unique value propositions from many middle-market grocery retailers and branded products within the dairy category. This was further fuelled by the expansion of Aldi and Lidl, as the discounters offer a combination of low prices and quality, while also adapting to local tastes and latest trends.
Exhibit 26 - Global Dairy Value Sales Split by Retail Channels, 2013-2018
100%
90%
80%
70%
60%
50%
40%
30%
20%
10%
0%
Convenience Stores and Forecourt Retailers
Supermarkets/Hypermarkets
Internet Retailing
Discounters
Traditional Grocery Retailers
Others
2012 2013 2014 2015 2016 2017 2018
Source: Euromonitor International analysis from Passport
D
AIR
Y IN
DU
STR
Y
67

Challenges and Opportunities
Chal lenges
Growing consumer expectations as a key challenge and a basis for opportunities is the key challenge
Smooth adaptation of technology into
traditional and existing farming or manufactur-
ing processes
Volatility of raw milk prices
Decreasing brand loyalty and growing
demand for value for money
Increasing demand for plant-based dairy
alternatives as a result of veganism and
lactose-free diets
Growing demand for sustainability and envi-
ronmentally friendly farming and processing
Growing concerns regarding food safety
High cost of ‘clean’, ‘natural’, ‘free from’
‘organic’ and ‘grass fed’ products
Key: Moons indicate the level of direct impact on each stakeholder
The fuller the moon, the higher the direct impact:
Low _________________________> high
Supplier/farmer ManufacturerWholesale / import - exporter
Retailer

Opportunities New monitoring and
processing technologies to ensure food safety
and production optimization
Sustainable farming and production as an added value for dairy products
Supply chain optimisation/vertical
integration
Positioning of dairy products as a healthy
snack
Vitamin and mineral fortification as an added
value
Increasing demand for single-serve and conven-
ience
Private label offerings with lower price points
Consumers appetite for diversity and an
inter-national product assortment
Growing consumer awareness about protein
intake for hunger control, training and weight management
Key: Moons indicate the level of direct impact on each stakeholder
The fuller the moon, the higher the direct impact:
Low _________________________> high
Supplier/farmer ManufacturerWholesale / import - exporter
Retailer
D
AIR
Y IN
DU
STR
Y
69

Dairy Sector
Current performance satisfaction vs. expected growth
Satisfaction - current performance Vs Activity
Confidence - Over the next 12 months Vs Activity
Confidence - Over the next 3 years Vs Sector
Negative Neutral Positive
Voice of the Industry

Manufacturer
Volatile commodity prices
Growing competition from Private Label products
Adapting to new retail and distribution models
Negative publicity of processed foods and beverages
1
2
3
4
Main Challenge
Key TrendsKey Trends Vs Activity Dairy
Organic & Free-from 43.50%
Private Label 31.50%
Ethical living: Eco-friendly, Halal and Fair trade 26.10%
Premium & Gourmet 23.90%
Plastic bans on packaging, retail and foodservice 20.70%
Food waste prevention 19.60%
Farm to fork sustainability 18.50%
Fortified & Functional 18.50%
Honest advertising & labeling 17.40%
Elevated convenience, 'grab-and-go' 12.00%
Westernization & diversification of diet 6.50%
Animal welfare 4.30%
Main growth channel in the next 12 months by sectorProduct portfolio and strategy Vs Sector Dairy
Direct Sales to customer 41.00%
Research & Development 20.50%
Private Label 18.10%
Current Channels 15.70%
Mergers & Acquisitions 14.50%
Contract Manufacturing 13.30%
Own ecommerce 12.00%
Omni-channel retailing 8.40%
Third-party ecommerce 7.20%
Other 2.40%
D
AIR
Y IN
DU
STR
Y
Voice of the Industry
7171
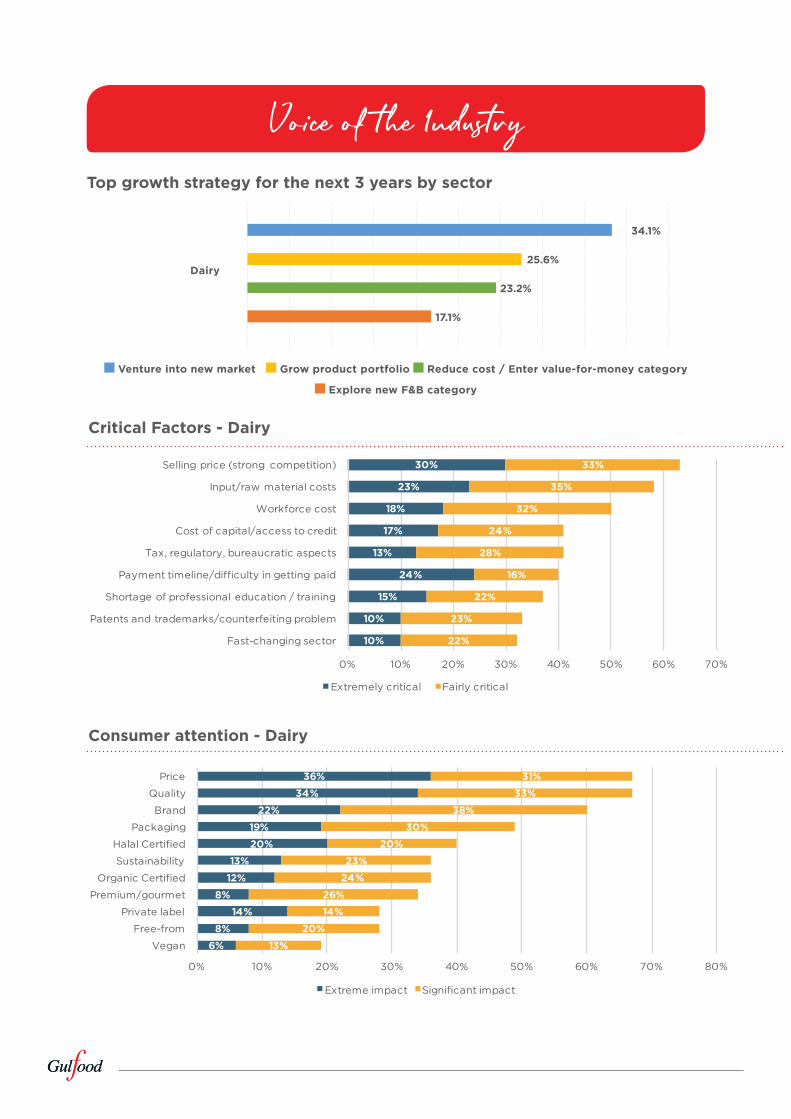
Critical Factors - Dairy
Consumer attention - Dairy
Top growth strategy for the next 3 years by sector
Dairy
Venture into new market Grow product portfolio Reduce cost / Enter value-for-money category
Explore new F&B category
30%
23%
18%
17%
13%
24%
15%
10%
10%
33%
35%
32%
24%
28%
16%
22%
23%
22%
0% 10% 20% 30% 40% 50% 60% 70%
Selling price (strong competition)
Input/raw material costs
Workforce cost
Cost of capital/access to credit
Tax, regulatory, bureaucratic aspects
Payment timeline/difficulty in getting paid
Shortage of professional education / training
Patents and trademarks/counterfeiting problem
Fast-changing sector
Critical factor - Dairy
Extremely critical Fairly critical
6%
8%
14%
8%
12%
13%
20%
19%
22%
34%
36%
13%
20%
14%
26%
24%
23%
20%
30%
38%
33%
31%
0% 10% 20% 30% 40% 50% 60% 70% 80%
Vegan
Free-from
Private label
Premium/gourmet
Organic Certified
Sustainability
Halal Certified
Packaging
Brand
Quality
Price
Consumer attention - Dairy
Extreme impact Significant impact
34.1%
25.6%
23.2%
17.1%
Voice of the Industry

MeatPoultry

Asia Pacific Australasia Europe Latin AmericaMiddle
East & North Africa
North America
Sub-Saharan Africa
Consumer spending on meat & poultry as % of total F&B
1.5% 2.2% 4.9% 1.4% 1.3% 3.9% 0.3%
Key Growth Markets (2013-2018)
JapanIndonesiaPhilippines
South Korea
New Zealand
TurkeyNorwayPolandSweden
Switzerland
Chile Mexico
IranEgypt
MoroccoSaudi Arabia
USACanada
Cote d’IvoireCongo,
Democratic RepublicGhana
Key Sub-categories*
Processed Meat 66.2%Meat Substi-tutes 33.8%
Processed Meat 95.1%
Processed Meat 98.0%
Processed Meat 99.2%
Processed Meat 97.1%
Processed Meat 95.4%
Chilled Pro-cessed Meat
97.1%
Key Channels**
Supermarkets /hypermar-kets (59.6%)Traditional
grocery retail-ers (12.4%)
Supermarkets /hypermar-kets (80%)Discounters
(15.6%)
Super-markets/
hypermar-kets(55.8%)Discounters
(20.3%)
Supermar-kets/hy-
permarkets (56.5%)
Traditional grocery retail-
ers (31.9%)
Supermar-kets/hy-
permarkets (47.6%)
Traditional grocery retail-
ers (40.1%)
Supermar-kets/hy-
permarkets (69.3%)
Traditional grocery retail-
ers (14.7%)
Supermar-kets /hy-
permarkets (54.4%)
Traditional grocery retailers (36.4%)
Fastest growth channels (CAGR 2013-18)
Internet retail-ing (24.4%)
vConvenience stores & fore-court retailers
(12.3%)
Internet retail-ing (13.4%)Discounters
(7.4%)
Internet retail-ing (9.4%)
Convenience stores & fore-court retailers
(1.6%)
Internet retail-ing (13.6%)
Convenience stores & fore-court retailers
(2.1%)
Internet retail-ing (32.1%)
Convenience stores & fore-court retailers
(6.6%)
Internet retail-ing (28.1%)Discounters
(1.7%)
Internet re-tailing (7.5%)Traditional groceries
(2.0%)
Slowest growth channels(CAGR 2013-18)
Tradition-al grocery retailers (-1.8%)
Supermar-kets/hy-
permarkets (0.6%)
Convenience stores & fore-court retailers
(-3.0%)Supermar-kets/hy-
permarkets (-1.3%)
Tradition-al grocery retailers(-3.7%)
Supermar-kets/hy-
permarkets (0.3%)
Traditional groceery retailers (-3.0%)
Supermar-kets/hy-
permarkets (-1.0%)
Traditional grocery retail-
ers (2.6%)Supermar-kets/hy-
permarkets (5.2%)
Traditional groceries (-0.5%)
Supermar-kets/hy-
permarkets (0.0%)
Super-markts/
hypermarkts (-4.5%)
Convenience stores & forecourt retailers (-4.0%)
Discounters (-3.5%)
Meat and Poul try Industry - At a Glance
Source: Euromonitor International analysis from Passport

Consumer preferences on meat tend to vary considerably across regionsGlobal meat and poultry sales stood at an estimated US$174.8 billion in 2018, up by a relatively stagnant CAGR of 0.5% since 2013. As of recently, the market has been driven by increased demand out of Asia and the Middle East and Africa regions for halal products, a sub-category especially significant to the Muslim majority population that resides in these markets. Global meat and poultry market sales are estimated to reach US$185.9 billion leading up to 2023, with growth picking up pace to a CAGR of 1.2% over the forecasted 2018-2023 period.
Regional value shares of meat and poultry consumption remain significant in Western Europe, Asia and North America, with estimated market shares of 43.5%, 25.6% and 20.1% of global sales respectively in 2018. The biggest consumers of meat and poultry products by value are the USA, China, Germany, Japan and Italy, combining for over $90 billion in sales in 2018 – nearly half of global market value.
Globally, chilled processed meat products benefitted directly from a more diversified product range to cater to stronger consumer demand – suppliers have also benefited from improved cold-chain systems that have allowed for more efficient operations. High-
Market Size and Potential
North America
Latin America
Europe
Middle East &North Africa
Asia Pacific
AustralasiaSub-Saharan Africa
1.2% 33.5bn
33.5bn 0.3% 73.9bn
73.5bn
2.9% 12.0bn
10.4bn
2.5% 1.3bn
1.1bn
5.2% 7.5bn
5.9bn
2.3% 50.2bn
44.8bn
0.2% 1.8bn
1.8bm
Exhibit 27 - Meat and Poultry Value Sales in 2018, 2023 & CAGR 2018-2023 US$ billion
Key: Inner circles indicate the Meat & Poultry market size in 2018, outer circles indicate market size in 2023The distance between the inner and outer circles indicates the size of the absolute growthThe colour of the circles indicates the growth rate: Fast Moderate Slow Static Source: Euromonitor International analysis from Passport
M
EAT
& P
OU
LTR
Y IN
DU
STR
Y
75

level consumer trends are also shaping the direction the industry is headed in their product composition. For example, in Asia Pacific, most chilled processed meat products are Westernised in their marketing and, as a result, are generally positioned as premium products with higher unit prices. Meat preferences vary significantly across markets in the Asia Pacific region, however, with countries such as Japan and Malaysia favouring chicken-based recipes, while others, such as China, favour beef products, which appear to be steadily growing in popularity.
Nevertheless, meat substitutes saw good growth in different markets, with Japan witnessing two very interesting introductions specifically designed to target a new consumer group, to ensure growth within this very mature market. The first one was Zaku Tofu, a product inspired by Kido Senshi Gundam, a hugely popular animation series. The product specifically targets middle-aged male Gundam fans who did not v much interest in tofu before this introduction. Sagamiya’s Natural TOFU was the second one, designed to make tofu popular among a young female consumer segment. The product portfolio comprises of many different varieties, such as cheese-like tofu, drinkable tofu and flavoured tofu such as chocolate and green tea.
Another great example of product development was Nestlé’s brand Herta. After a broad media campaign concerning the presence of nitrites in meat, Herta was the first brand to react and introduce five nitrite-free hams under its Le Bon Paris range and chilled processed poultry under its Le Bon Poulet portfolio. Such a quick reaction towards consumer’s
Europe, on the other hand, is displaying a different market dynamic. Meat substitutes in France are still growing rapidly with 43.0% growth in 2018, supported by the growing trend of capitalising on healthier alternatives to processed red meat. Conversely, in nearby Germany, the category has witnessed a value decline between 2017 and 2018 of 7.0%, with the outlook for the 2018-2023 period also negative. This market decline stems from a general consumer dissatisfaction towards the taste and product availability for this category.
Exhibit 28 - Meat and Poultry Regional Value Sales by Product Type in 2018
100%
90%
80%
70%
60%
50%
40%
30%
20%
10%
0%
Processed Meat Meat Substitutes
Asia Pacific Australasia Europe Latin America
Middle East & North Africa
North America
Sub-Saharan Africa
Source: Euromonitor International analysis from Passport

Growing importance of ‘health’ in high meat-consuming countriesEmerging countries, such as China and India, are expected to contribute heavily to the growth of the global meat and poultry industry due to rising incomes and healthy eating trends. Packaged processed meat products are considered to be hygienic and high-quality goods in these developing markets and being sold by well-established companies, such as the WH Group in China and Godrej Tyson Foods Ltd in India, gives them even more brand equity among consumers. In response to growing consumer demand for more fresh and healthy processed meat products, these manufacturers have increasingly shifted their focus from shelf-stable processed meat to chilled processed meat.
Demand on halal meat is set to escalateDemand for halal meat, an important feature of life across Muslim communities, is growing rapidly. In the Middle East and North Africa region, nearly all meat is halal by default, providing a potent market base, whereas in Asia Pacific, which also houses a significant Muslim population, this practice is not yet as comprehensive. As a result, demand for halal-certified products in that region is rising noticeably. In Singapore, for example, the first Halal-certified Japanese-French inspired café – Kumoya – has just recently opened, demonstrating a potential shift in new markets.
Similarly is the case in Europe, across several countries where Muslims make up an important and growing minority, such as France, Germany and the UK, rising demand for halal meat manifests itself on several fronts. For example, supermarkets such as Carrefour, Sainsbury’s and Tesco’s, for example, have expanded offerings of fresh halal meat and meat products.
Globally, by 2050, one in three people will be Muslim, presenting a larger opportunity for processed meat manufacturers to consider acquiring the halal label.
Growing share for meat substitutes in North America and AustralasiaAs the vegan and vegetarian populations continue to grow in response to increasing health concerns over meat intake, an even more impactful population has also seen strong growth in numbers. “Flexitarians”, or those consumers who actively seek to limit their meat intake while not ceasing it altogether, are a relatively new but fast-growing part of the consumer population who represent very strong growth prospects for meat substitutes. Sales of this category continue to grow at rapid rates with 10.3% and 17.9% value growth in 2017 and 2018,
respectively. Correspondingly, product varieties and offerings are also expanding rapidly, further driving this growth. In the USA, a critical market for this category, Tyson Foods, Cargills, Maple Leaf Foods and PHW Group are among the largest names thus far to invest in alternatives to traditional animal meat, including both plant-based substitutes and lab-grown cell-based meats. As these alternatives continue to penetrate the industry, more investment from traditional meat producers appears increasingly likely.
The shifts towards packaged products drives demandMexico, the largest processed meat market in Latin America and second fastest growing in the region, has seen a shift towards pre-packaged products similarly to other emerging markets in Asia Pacific, which is anticipated to drive the category’s dynamic growth over the forecast period. Consumers could order chilled processed meat products by volume, allowing them not only to customise their order, but also to manage their budgets more precisely.
Market Trends and Drivers
M
EAT
& P
OU
LTR
Y IN
DU
STR
Y
77

Safety demands and conerns are favouring private label manufacturersIn large developed markets like Italy and Germany, rising consumers’ concerns over food safety has presented a potential avenue for growth for private label manufacturers. In Germany, private labels for this category dominates sales, with consumers convinced that food safety inspectors guarantee the quality of private label products. While in Italy, Coop has introduced new private label lines, including Coop Origine, which targets consumers’ desire for total traceability by providing information on issues such as production processes and safety certification.
Health and Wellness and clean label movements are shaping the categoryDemand for healthy food has never been stronger, impacting both retail and foodservice operators in large markets like Canada. This is largely driven by the increasingly aging population, although younger consumers from the millennial and Gen Z cohorts are also becoming more health-conscious about the food and beverages they consume. Even families are adjusting their lifestyles accordingly - in Argentina, for example, parents are increasingly trying to replace typical products like hot dogs or hamburgers with more nutritious items for their children. As a result, health and wellness meat substitutes and soy-based products are slowly gaining a place on the tables of Argentinian households. Similarly in Canada, demand for processed meat products that are free from artificial ingredients and low in sodium, with labels like “free-from antibiotics and growth hormones” and “all- natural” have become more impactful on consumers’ purchasing decisions.

Competitive LandscapeMeat and Poultry is a highly fragmented market and leading players are often determined by their dominance in a limited number of large markets.
The largest share by far is hold by Private Label brands. Meat and poultry is another segment, where consumers are often price-conscious and less convinced about the added value known brand names could deliver. Most consumers determine the value of a product within this category by labels, suggesting a transparent, sustainable or organic production process, the absence of additives or regional sourcing. Especially in Europe, this has offered great chances for discounters and their associated private label brands.
With a share of 3%, WH Foods, formerly known as Shineway International, is currently leading within the processed meat and poultry market. The company is the leading supplier of processed meat and poultry in China and therefore benefiting from the sheer size of the Chinese market. The name change set the starting point for the company’s intention to expand overseas and in 2017, WH Foods acquired the US-based Clougherty Packing LLC, marking its venture into the US West Coast market.
The second biggest company within this segment is Tyson Foods Inc, which increased its stance within the processed meat and poultry market in 2014 through the buyout of Hillshire Farms. The company thereby increased its’ geographical reach outside the US and Mexico significantly.
Exhibit 29 - Global Company Shares 2018 - Meat and Poultry
Rank Company Global Market Share
1 WH Group 3.33%
2 Tyson Foods Inc 2.64%
3 Kraft Heinz Co 2.26%
4 Hormel Foods Corp 1.53%
5 Sigma Alimentos SA de CV 1.24%
6 Nestlé SA 0.95%
7 Maple Leaf Foods Inc 0.80%
8 Brf Brasil Foods SA 0.72%
9 People's Food Holdings Ltd 0.68%
10 NH Foods Ltd 0.58%
11 Private Label 22.83%
12 Others 62.44%
M
EAT
& P
OU
LTR
Y IN
DU
STR
Y
79

Consumers look for convenience and value for moneyModern grocery retailers continue to dominate the retail landscape for meat and poultry, driven by convenience, promotions and discounts. Rising disposable incomes and urbanisation in developing countries continued to further drive growth in modern distribution channels.
Distribution Landscape
Exhibit 16 - Global meat and poultry value sales split by retail channels, 2012-2018
100%
90%
80%
70%
60%
50%
40%
30%
20%
10%
0%
2012 2013 2014 2015 2016 2017 2018
Globally, processed meat and poultry are mainly sold through store-based retailing. Modern grocery retailers, mainly supermarkets and hypermarkets, continued to facilitate the most sales in the meat and poultry industry. Rising urbanisation continues to drive the shift away from traditional retail outlets to supermarkets and hypermarkets, both of which have been better able to invest in adequate cold supply-chain facilities.
On the other hand, in developing regions including the Middle East and North Africa, Sub-Saharan Africa as well as Latin America, traditional grocery retailers have acquired a substantial share of meat and poultry sales. Independent small grocers play a vital role in many emerging markets, with proximity being crucial competitive advantage for these retailers, as many shoppers in these countries lack the means of
transportation to reach modern shopping centres. In India, Indonesia and the Philippines, for example, traditional retailers like kirana stores, warung and sari-sari stores also offer consumers informal credit facilities to help build loyalty and drive repeat shopping trips.
In competition with store-based retailing, internet retailing constitutes the fastest growth channel globally, due to an worldwide baseline trend for convenience in shopping. As consumers become increasingly mobile and lead busier lives, internet retailing has emerged as a favourable alternative to many brick-and-mortar businesses by offering a wider range of products and direct delivery.
Convenience Stores and Forecourt Retailers
Traditional Grocery RetailersDiscounters Supermarkets/
Hypermarkets Internet Retailing Others
Source: Euromonitor International analysis from Passport
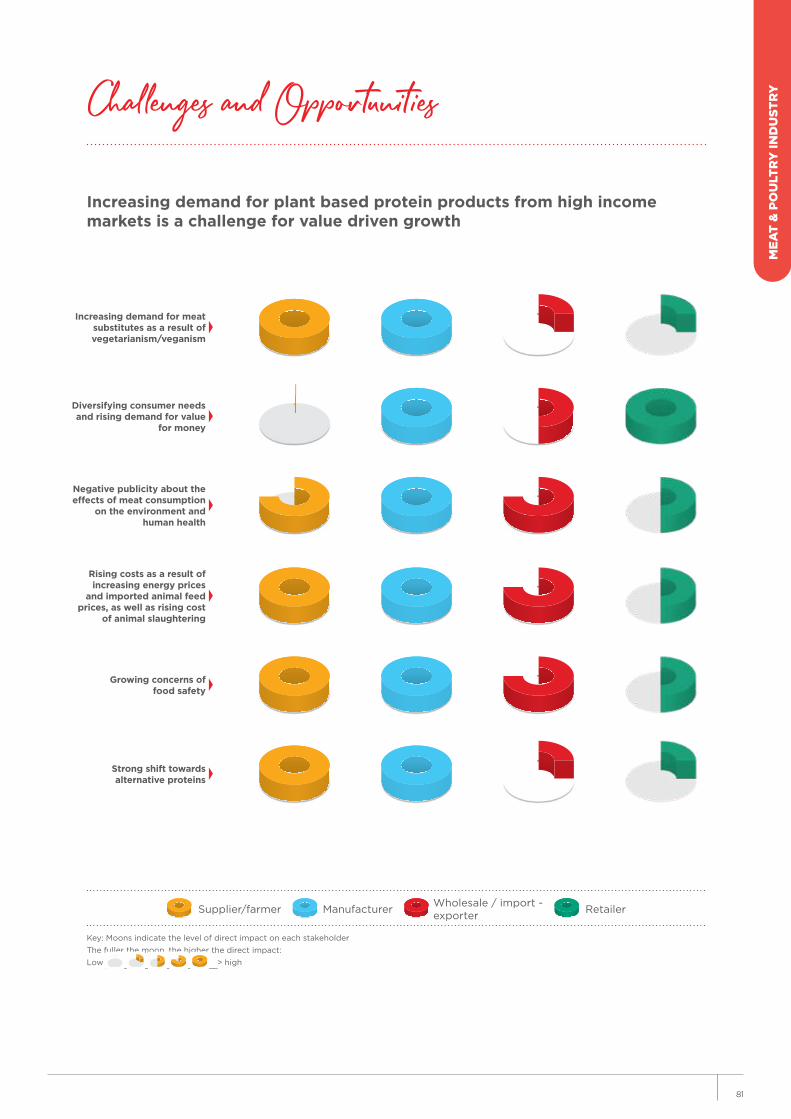
Increasing demand for plant based protein products from high income markets is a challenge for value driven growth
Challenges and Opportunities
Diversifying consumer needs and rising demand for value
for money
Negative publicity about the effects of meat consumption
on the environment and human health
Increasing demand for meat substitutes as a result of vegetarianism/veganism
Rising costs as a result of increasing energy prices
and imported animal feed prices, as well as rising cost
of animal slaughtering
Growing concerns of food safety
Strong shift towards alternative proteins
Key: Moons indicate the level of direct impact on each stakeholder
The fuller the moon, the higher the direct impact:
Low _________________________> high
Supplier/farmer ManufacturerWholesale / import - exporter
Retailer
M
EAT
& P
OU
LTR
Y IN
DU
STR
Y
81

Meat and poul try Sector
CONFIDENCE INDEXCurrent performance satisfaction vs. expected growth
Satisfaction - current performance Vs Activity
Confidence - Over the next 12 months Vs Activity
Confidence - Over the next 3 years Vs Sector
Negative Neutral Positive
Voice of the Industry

Manufacturer
Volatile commodity prices
Growing competition from Private Label products
Higher regulatory control & production costs
Demand for traceability and sourcing transparency
1
2
3
4
Key TrendsKey Trends Vs Activity Meat & poultry
Organic & Free-from 49.50%
Ethical living: Eco-friendly, Halal and Fair trade 36.40%
Private Label 32.30%
Farm to fork sustainability 26.30%
Honest advertising & labeling 25.30%
Food waste prevention 23.20%
Plastic bans on packaging, retail and foodservice 22.20%
Premium & Gourmet 20.20%
Elevated convenience, 'grab-and-go' 12.10%
Animal welfare 11.10%
Westernization & diversification of diet 7.10%
Fortified & Functional 7.10%
Main growth channel in the next 12 months by sectorProduct portfolio and strategy Vs Sector Meat & poultry
Direct Sales to customer 37.20%
Private Label 24.40%
Contract Manufacturing 20.90%
Research & Development 19.80%
Current Channels 17.40%
Mergers & Acquisitions 16.30%
Third-party ecommerce 12.80%
Own ecommerce 11.60%
Omni-channel retailing 3.50%
Other 7.0%
Main Challenge
M
EAT
& P
OU
LTR
Y IN
DU
STR
Y
Voice of the Industry
8383

Critical Factor - Meat & poultry
Consumer attention - Meat & poultry
Top growth strategy for the next 3 years by sector
Meat & poultry
Venture into new market Grow product portfolio Reduce cost / Enter value-for-money category
Explore new F&B category
28%
34%
21%
19%
17%
16%
13%
9%
12%
32%
25%
26%
25%
26%
20%
23%
25%
17%
0% 10% 20% 30% 40% 50% 60% 70%
Input/raw material costs
Selling price (strong competition)
Tax, regulatory, bureaucratic aspects
Workforce cost
Payment timeline/difficulty in getting paid
Shortage of professional education / training
Cost of capital/access to credit
Fast-changing sector
Patents and trademarks/counterfeiting problem
Critical factor - Meat & poultry
Extremely critical Fairly critical
4%
7%
13%
12%
13%
22%
18%
21%
27%
43%
46%
12%
21%
23%
27%
27%
22%
29%
36%
35%
34%
34%
0% 10% 20% 30% 40% 50% 60% 70% 80% 90%
Vegan
Premium/gourmet
Free-from
Private label
Sustainability
Organic Certified
Packaging
Brand
Halal Certified
Quality
Price
Consumer attention - Meat & poultry
Extreme impact Significant impact
26.8%
29.3%
25.60%
18.30%
Voice of the Industry
Seafood Industry
85

Asia Pacific Australasia Europe Latin AmericaMiddle
East & North Africa
North America
Sub-Saharan Africa
Consumer spending on Seafood as % of total F&B
1.1% 1.2% 2.1% 0.7% 0.8% 0.7% 0.3%
Key growth markets for Seafood(2013-2018)
ThailandIndonesiaPhilippinesChina
New ZealandAustralia
SerbiaAustriaPolandCzech RepublicIrelandFinlandNorway
ArgentinaMexicoCosta RicaChile
TurkeyMoroccoAlgeriaUAEEgypt
CanadaGhanaCongoSouth Africa
Key Seafood sub-categories*
Processed seafood (100%)
Processed seafood (100%)
Processed seafood (100%)
Processed seafood (100%)
Processed seafood (100%)
Processed seafood (100%)
Processed seafood (100%)
Seafood key channels**
Supermarkets/Hypermarkets (0.1% CAGR)Others (-2.4% CAGR)
Supermarkets/Hypermarkets (-0.9% CAGR)Discounters (8.1% CAGR)
Supermarkets/Hypermarkets (1.1% CAGR)Discounters (1.5% CAGR)
Supermarkets/Hypermarkets (-3.7% CAGR)Traditional Grocery Retailers (-7.6% CAGR)
Supermarkets/Hypermarkets (6.1% CAGR)Traditional Grocery Retailers (-2.4% CAGR)
Supermarkets/Hypermarkets (-0.7% CAGR)Traditional Grocery Retailers (-1.2% CAGR)
Supermar-kets/Hyper-markets (1.8% CAGR)Traditional Grocery Re-tailers (2.5% CAGR)
Seafoodfastest growth channels (CAGR 2013-18)
Discounters (27.6% CAGR)Internet Retailing (4.3% CAGR)
Internet Re-tailing (13.6% CAGR)Discounters (8.1% CAGR)
Internet Re-tailing (9.6% CAGR)Convenience Stores and Forecourt Retailers (1.9% CAGR)
Internet Re-tailing (15.9% CAGR)Others (3.9% CAGR)
Internet Re-tailing (42.5% CAGR)Discounters (8.6% CAGR)
Internet Re-tailing (26.4% CAGR)Discounters (1.4% CAGR)
Internet Retail-ing (7.4% CAGR)Discounters (5.3% CAGR)
Seafoodslowest growth channels(CAGR 2013-18)
Others (-2.4% CAGR)Supermarkets/Hypermarkets (0.1% CAGR)
Convenience Stores and Forecourt Retailers (-3.0% CAGR)Supermarkets/Hypermarkets (-0.9% CAGR)
Traditional Grocery Retailers (-7.3% CAGR)Others (-3.7% CAGR)
Traditional Grocery Retailers (-7.6% CAGR)Supermarkets/Hypermarkets (-3.7%)
Traditional Gro-cery Retailers (2.4% CAGR)Supermarkets/Hypermarkets (6.1% CAGR)
Others (-1.7% CAGR)Traditional Gro-cery Retailers (-1.2% CAGR)
Supermar-kets/Hyper-markets (1.8% CAGR)Convenience Stores and Forecourt Retailers (2.0% CAGR)
Seafood Industry - At a Glance

Regional PerformanceGlobally, Asia Pacific was the largest market for Seafood at US$33.6 billion in 2018, followed by Europe at US$31.4 billion. Asia-Pacific witnessed a marginal decline over 2013-2018 (-0.6% CAGR) and value sales are expected to decline further over 2018-2023 (-1.2% CAGR), mainly due to declining sales of chilled processed seafood in Japan, the largest market in the region. However, sales are poised to rise in other parts of the region over 2018-2023, owing to the convenience of processed seafood products.
Overall, growth in the forecast period is expected to be driven by regions such as Middle East and North Africa and Sub-Saharan Africa which are expected to witness a CAGR of 5.2% and 3.0% respectively.
Moderating value growth expected despite strong demand to 2021 The total market size for Seafood globally stood at US$81.9 billion in 2018. Value sales witnessed a CAGR decline of -0.4% between 2013-2018, but the market is expected to recover slightly over 2018-2023, recording a positive CAGR of 0.7%.
Exhibit 31 - Regional Seafood Market Size in 2018, 2023 & CAGR 2018-2023 US$ billion
Sales in Middle East and North Africa have been stimulated by demand for products that offer practicality, taste and nutrition. Consumers in North Africa tend to purchase processed seafood as a staple item, and this trend is expected to remain strong over the forecast period.
Sub-Saharan Africa, the smallest global Seafood market, is the second fastest growing region. Growth in this region is attributable to the increase in shelf-stable seafood, which is preferred over fresh fish by lower-middle-income groups due to its relative affordability and lack of required refrigeration.
Historically however, Latin America, is the slowest growing region, with a CAGR decline of -4.1% between 2013-2018. Venezuela, the market leader in this region in 2013, has seen a massive decline in
Market Size and Potential
North America
Latin America
Europe
Middle East &North Africa
Asia Pacific
AustralasiaSub-Saharan Africa
1.1% 6.5bn
6.1bn 1.5% 33.7bn
31.3bn
2.5% 5.6bn
5.0bn
3.0% 1.2bn
1.0bn
5.2% 4.7bn
3.6bn
-1.2% 31.7bn
33.6bn
2.1% 1.3bn
1.1bm
Key: Inner circles indicate the Seafood market size in 2018, outer circles indicate market size in 2023The distance between the inner and outer circles indicates the size of the absolute growth
The colour of the circles indicate the growth rate Fast Moderate Slow Static
Source: Euromonitor International analysis from
Passport
SE
AFO
OD
IND
UST
RY
87

sales since, as branded processed seafood was not able to compete with black-market imports due to their higher pricing, which led some brands exiting the market. However, retailers’ preference for pre-packaged products has driven growth in processed seafood in other parts of the region, and it is anticipated to continue to benefit from this trend over the forecast period.
Country SnapshotsProcessed seafood product options have steadily expanded in the Philippines and Indonesia, as companies exploit growing consumer desire for convenience and affordability. Demand for the category is expected to grow, as processed seafood shortens meal preparation time, which strongly attracts busy urban dwellers, as well as those with limited cooking skills. Furthermore, items such as canned tuna are actively promoted by key brands as a health food in the Philippines, and recorded the fastest growth in value terms in 2018. In the same year, modern retailers allocated more shelf space to shelf-stable seafood in Indonesia. More products were also available in smaller packaging, highlighting the shift towards portion control and ease of consumption.
China, the second largest market in Asia-Pacific, witnessed growth with a value CAGR of 5.5%. Meanwhile, India recorded a sharp value CAGR of 18.1%, but this was from a low base as it still only
accounts for a small share of the market.
Demand for convenience also
drove growth in New Zealand, with the highest
value CAGR in Australasia, at
2.5%. This is expected to
remain a key driver over the forecast period. Premiumisation trends have also influenced new product development activity.
In Norway, an unusually warm spring and summer drove sales of barbeque foods, including seafood options, in 2018. In the previous year, the Norwegian Directorate of Health published a report, which outlined the need to promote the consumption of fish and seafood. Government initiatives regarding food tend to be successful in Norway as health authorities are well respected. Hence, long-term consumption patterns are likely to be impacted by these initiatives, and processed seafood is expected to outperform processed meat, partly due to a high degree of product innovation at the end of the review period creating healthier seafood-based dishes.
In Poland, recent consumer awareness regarding shelf-stable seafood began to grow due to healthier lifestyles. This resulted in rising demand for better-quality products in oil. Consumer awareness continues to develop, and a move from lower quality to higher-quality products with slightly higher prices is expected over the next five years.
Russia, the market leader in Europe, saw a decline in CAGR terms of -0.6%. However, processed seafood is predicted to recover slightly over the forecast period.
In Latin America, Mexico is the largest market, with processed seafood products growing due to the convenience they offer with regard to cooking time and storage. Ready meals witnessed dynamic growth over the review period, with the entry of new competitors and products. Many of these companies are leaders in sales of processed seafood, who added value to their products by offering more sophisticated options to consumers.
Convenience also boosted growth of processed seafood products in Chile, recording a high increase in both retail volume and retail value terms, is in line with the increasingly accelerated pace of life among Chileans. There was also a significant development in white meat categories, due to consumer perception that fish, chicken and turkey are healthier than red meat. As awareness of the importance of healthy
nutrition continues to grow in Chile, demand for healthier products can be expected to continue.
Brazil, the second largest market in Latin America, observed a CAGR decline of -1.2% over 2013-2018, as the economy was slow in recovering from the recession.
In Egypt, consumers tend to prefer buying processed seafood compared to fresh
products, as it is cheaper. Tuna is the bestseller in shelf-

stable processed seafood, as it does not have an alternative. Growing retail modernisation and the increasing convenience trend continue to drive growth in Algeria. More women are participating in the workforce, and as such are opting for quick meal solutions. As a result, demand for processed seafood is expected to remain strong over the forecast period. Iran, the market leader in the Middle East, also observed value sales growth, with a CAGR of 3.1% over 2013-2018.
Consumers in South Africa, the market leader in Sub-Saharan Africa, choose shelf-stable fish products because they are much cheaper than fresh fish. This trend will continue and contribute to the growth of these products over the forecast period.
Processed seafood sales in Canada increased in value terms, with the highest value CAGR in North America, at 1.7%. Sustainable sourcing has increasingly become a necessity for brands, which has influenced them to place a greater focus on sustainable seafood.
Middle East Focus
One of the most significant driving forces in the Middle East & North Africa is consumer demand for convenience. Processed seafood products are considered a go-to food when people don’t have the time to cook. Such products are used to prepare snacks, which children and adults take to school or work. Consumers are becoming increasingly familiar with such products, which are in turn becoming a part of the eating culture of this region. The health and wellness trend also plays a major role in the growth of this category. Seafood is often perceived
as healthy and sales of seafood harvested from sustainable fishing are growing.
Sustainability and adequate resource usage is increasingly important for consumers within seafood and a growing area for investments. In Western Europe and North America, Marine Stewardship Council (MSC) and Aquaculture Stewardship Council (ASC) certifications are therefore often seen as a standard, as consumers’ demand proof of responsible aquaculture. Awareness for seafood sustainability in Japan, largest market for this category and many other countries in Asia Pacific however is still low and just developing. They could however develop into an important unique selling point in mature seafood markets. In Japan for example, the industry giants Nippon Suisan Kaisha and Maruha Nichiro Holdings both launched MSC-certified product portfolios, while the leading retailer AEON wants to acquire the MSC or ASC Chain of Custody (CoC) certification for all its general merchandise stores and supermarkets by 2020. As MSC and ASC have partnered up with the Japanese Olympic athletes, the Tokyo 2020 Olympic and Paralympic Games are seen as a great opportunity to raise awareness and promote these certificates as a unique selling point.
Consumer’s demand for a transparent production process within seafood also benefited a new product under Coop’s private label line Coop Origine in Italy. The portfolio’s unique selling point is the provision of information on issues such as production processes and safety certification: Scottish Salmon thereby became a popular choice in Italy’s growing seafood market.
SE
AFO
OD
IND
UST
RY
89

Market Trends and Drivers Prices
The price of processed seafood has not been regulated in some markets, such as Venezuela, so manufacturers have more frequently transferred cost increases to the end consumer. Shelf-stable seafood used to be the only affordable protein source for many consumers. However, higher production costs have made such options unaffordable for most Venezuelan households. Similarly, food safety concerns and the political environment in Brazil have offset potential growth due to frugal behavior among consumers.
Unit prices of processed seafood have increased in South Africa due to a rise in the price of raw materials, which are largely imported, and made more expensive by the volatile local currency. Shelf-stable seafood is also dependent on fluctuating steel prices, as the products are primarily sold in metal cans.
Countries across regions are moving towards the development of sustainable seafood. Japan, one of the world’s largest consumers of seafood has been lagging behind Europe and North America in seafood sustainability awareness, but changes have slowly been taking place in advance of the Olympic and Paralympic Games. Both environmentally friendlier packaging and increasing awareness of the logos certifying sustainability are expected to be a way forward in Finland.
Flavour innovation will also encourage growth in processed seafood. As palates become more receptive to unique and exotic flavors, consumers in Australia are being offered bolder choices to experiment with. Players in Poland recently started to develop new flavours and packaging, especially products following the convenience trend, such as smaller portions that enable consumers to eat on the go.
Frozen salmon and shrimp sales have fallen in Egypt, due to their very high prices. The products are subject to the highest taxes as they are considered luxury items and are only available through modern trade channels.
In the USA, tariff discussions between the US and China, as well as other significant trading partners,
have created significant instability and uncertainty around global trade. Despite a large domestic market, US producers of seafood rely heavily on access to lucrative foreign markets and have experienced increasing anxiety as tariffs have created notable additional costs.
Marketing and Advertising
Promotions and advertising remain key drivers of growth in Mexico. In-store promotions offering a better price per volume for products with a complementary sauce or dressing are likely to be used by brands to attract consumers. Companies were also increasingly active through digital advertising and social media over the review period, and are likely to continue focusing on these platforms over the forecast period. Processed seafood in the UAE also grew as a result of promotions.
Private Label
Private label has become a significant player in this segment, focusing more on the premiumisation of their brands. The share of private label is predicted to rise over the forecast period, with grocery retailers increasing the variety and quality of products to meet consumer demand for affordable products of higher quality. This is expected to influence brand manufacturers to differentiate their products in terms of ingredients, taste and packaging.
In Argentina, although Quickfood, controlled by Brazil’s Brf Brasil Foods, is the second largest player in the market, Brf has decided to divest itself of the company. Brf’s decision is part of a global divestment plan to focus mainly on the Brazilian and Asian markets.
Health and Wellness
Fresh seafood also poses a threat to the growth of processed seafood, as many consumers consider the latter to be unhealthy and hazardous because of the chemicals used in its processing. This will continue to be the main obstacle to growth, especially in agricultural countries, where the price of fresh food is very affordable.
Processed seafood players are expected to launch new products leveraging the health and wellness trend. Innovative options with a health and wellness
positioning that explore gourmet flavors, but remain low in sodium, calories and saturated fat, should
work well in the future.

Competitive LandscapeThe competitive landscape of seafood is very fragmented and generics and private label accounted for 43% in 2018.
No single company managed to gain more than 2% value shares on a global level within the seafood category. In fact, only Thai Union Frozen Products PCL, Nomad Foods Ltd and Dongwon Group had shares above 1%, while all other players remained of limited importance.
Loyalty towards seafood brands is rare and many consumers decide on the basis of origin, price, flavours and increasingly the ethical stance towards sustainability and organic or more natural production.
Exhibit 32 - Global Company Shares 2018 - Seafood
Rank Company Global Market Share
1 Thai Union Frozen Products PCL 1.86%
2 Nomad Foods Ltd 1.82%
3 Dongwon Group 1.50%
4 Bolton Group, The 1.18%
5 Grupo Calvo SA 0.89%
6 Connors Bros Ltd 0.85%
7 Nippon Suisan Kaisha Ltd 0.74%
8 Maruha Nichiro Corp 0.58%
9 Lur Berri Coopérative Agricole 0.58%
10 Hagoromo Foods Corp 0.54%
11 Generics 24.57%
12 Private Label 18.75%
13 Others 46%
SE
AFO
OD
IND
UST
RY
91

Supermarkets and hypermarkets led sales in the seafood category across all regions in 2018. This channel held a dominant share of more than 50% in all regions barring Asia Pacific, Middle East and North Africa in 2018.
The share of supermarkets and hypermarkets was highest in Australasia, at 79.6%, followed by North America (70.1%), Sub-Saharan Africa (66.2%) and Europe (56.3%). The bottom three regions included Latin America (55.3%), Middle East (49.7%) and lastly Asia Pacific, with a 49.2% share in 2018.
Overall, across regions globally, customers preferred supermarkets and hypermarkets due to the availability of a wide variety of options at competitive prices. Supermarkets and hypermarkets witnessed positive growth across most regions over 2013-18, with North America, Latin America and Australasia bring the exceptions. In these regions, the channel witnessed a decline, mainly due to the some growth of discounters as a channel.
Distribution is key for players in Brazil, which successfully consolidates the leading position of supermarkets/hypermarkets . Small local brands are
In the Seafood sector globally, supermarkets and hypermarkets held the majority share of 57.9% among other sales channels in 2018. The strong foothold of this channel is mainly attributed to the preference for convenience, variety and competitive prices by consumers globally.
Supermarkets and hypermarkets also held the leading share for sales of processed seafood worldwide. However, the channel witnessed a CAGR decline of 0.5% between 2013-18, mainly due to the growing popularity of internet retailing as a preferred channel by consumers. Although it only had a 2.1% share of total sales by channel in 2018, internet retailing witnessed the fastest growth, with a 10.4% CAGR between 2013-18 globally.
unable to compete on price with larger players, given the logistical challenges in the current landscape. Large food conglomerates take advantage of economies of scale in transportation, and this trend is expected to continue in the future.
In the UAE, discounter chains increased their share of distribution strongly over the review period. This was due to the rapid increase in the number of these outlets, with continued expansion expected over the forecast period. The increasing number of private label lines offered by discounters also stimulated sales through this distribution channel, posing a threat to small independent grocers.
In 2018, there was a significant increase in the number of processed seafood players entering the internet retailing space in Indonesia. For example, Fiesta by Primafood International created its own website, where consumers can obtain a wide range of products. Other players have partnered with online marketplaces to make their products available via these portals.
Distribution Landscape
Exhibit 33 - Global Seafood Distribution by Channel (2012-2018)
100%
80%
60%
40%
20%
0%
Convenience Stores and Forecourt Retailers
Supermarkets/Hypermarkets
Internet Retailing
Discounters
Traditional Grocery Retailers
Others
2012 2013 2014 2015 2016 2017 2018
Source: Euromonitor International analysis from
Passport

Asia Pacific Focus
Internet retailing witnessed the strongest growth in the most regions across the world, with the exception of Asia Pacific. The growth in sales via internet retailing was mainly due to the aggressive price points offered by online retailers to attract consumers. Consumers also appreciated the ease of shopping from home at anytime, further driving growth in this channel.
In Asia Pacific, discounters witnessed the strongest growth over 2013-18, mainly due to price-sensitive consumers looking for standard quality products. Generics dominated the processed seafood market in Japan, the largest market for processed seafood in Asia in 2018.
This section provides a quick snapshot of the different challenges and opportunities available within the industry and how they are positioned across different industry stakeholders. Risks / challenges and opportunities are assessed to see if they are positive or negative for different stakeholders in the value chain. More risks/opportunities will be added where applicable.
Concerns about sustainability
Rise of processed meat substitutes
Changing lifestyle of consumers
Rising input costs
Challenges and Opportunities
Key: Moons indicate the level of direct impact on each stakeholder
The fuller the moon, the higher the direct impact:
Low _________________________> high
Supplier/farmer ManufacturerWholesale / import - exporter
Retailer
SE
AFO
OD
IND
UST
RY
93

Seafood Sector
CONFIDENCE INDEXCurrent performance satisfaction vs. expected growth
Satisfaction - current performance Vs Activity
Confidence - Over the next 12 months Vs Activity
Confidence - Over the next 3 years Vs Sector
Negative Neutral Positive
Voice of the Industry

Main Challenge
Manufacturer
Higher regulatory control & production costs
Volatile commodity prices
Demand for traceability and sourcing transparency
Adapting to new retail and distribution modelsa
1
2
3
4
Key TrendsKey Trends Vs Activity Seafood
Organic & Free-from 43.90%
Private Label 28.10%
Ethical living: Eco-friendly, Halal and Fair trade 28.10%
Farm to fork sustainability 26.30%
Premium & Gourmet 22.80%
Honest advertising & labeling 21.10%
Plastic bans on packaging, retail and foodservice 21.10%
Westernization & diversification of diet 19.30%
Food waste prevention 12.30%
Elevated convenience, 'grab-and-go' 12.30%
Fortified & Functional 5.30%
Animal welfare 3.50%
Main growth channel in the next 12 months by sectorProduct portfolio and strategy Vs Sector Seafood
Direct Sales to customer 30.80%
Private Label 23.10%
Research & Development 11.50%
Contract Manufacturing 17.30%
Current Channels 21.20%
Third-party ecommerce 23.10%
Mergers & Acquisitions 19.20%
Own ecommerce 7.70%
Omni-channel retailing 7.70%
Other 1.90%
SE
AFO
OD
IND
UST
RY
Voice of the Industry
9595

Top growth strategy for the next 3 years by sector
Seafood
Venture into new market Grow product portfolio Reduce cost / Enter value-for-money category
Explore new F&B category
41.20%
29.40%
17.60%
11.80%
Critical Factor - Seafood
Consumer attention - Seafood
0%
2%
6%
2%
4%
10%
10%
8%
8%
31%
35%
25%
23%
19%
33%
35%
29%
29%
37%
42%
42%
42%
0% 10% 20% 30% 40% 50% 60% 70% 80% 90%
Vegan
Premium/gourmet
Organic Certified
Free-from
Private label
Halal Certified
Packaging
Sustainability
Brand
Price
Quality
Consumer attention - Seafood
Extreme impact Significant impact
25%
29%
19%
12%
17%
15%
8%
6%
6%
37%
31%
27%
35%
25%
27%
25%
23%
17%
0% 10% 20% 30% 40% 50% 60% 70%
Input/raw material costs
Selling price (strong competition)
Tax, regulatory, bureaucratic aspects
Cost of capital/access to credit
Workforce cost
Payment timeline/difficulty in getting paid
Fast-changing sector
Shortage of professional education / training
Patents and trademarks/counterfeiting problem
Critical factor - Seafood
Extremely critical Fairly critical
Voice of the Industry

Pulses, Grains
Cereals

Asia Pacific Australasia Europe Latin AmericaMiddle
East & North Africa
North America
Sub-Saharan Africa
Consumer spending on breads and cereals as % of total F&B
3.0% 2.5% 1.8% 2.4% 2.4% 2.3% 2.1%
Key Growth Markets (2013-2018)
IndiaIndonesiaMalaysiaPhilippinesThailand
New Zealand RussiaSpainGermany
Dominican RepublicChileArgentinaBrazil
EgyptIranSaudi ArabiaUAETurkey
CanadaUS
South AfricaGhanaKenyaCameroon
Key Sub-categories*
Rice, pasta and noodles (96.4%)Breakfast cereals (4.6%)
Breakfast cere-als (54.8%)
Rice, pasta & noodles (67.2%)Breakfast cere-als (32.8%)
Rice, pasta and noodles (85.2%)Breakfast cere-als (14.8%)
Rice, pasta and noodles (90.5%)Breakfast cere-als (9.5%)
Breakfast cere-als (55.4%)Rice, pasta and noodles (44.6%)
Rice, pasta and noodles (85.4%)Dry pulses (14.6%)
Key Channels**
Supermarkets/hypermarkets (39.5%)Traditional grocery retailers (34.3%)
Supermarkets/hypermarkets (85.5%)Discounters (6.3%)Traditional gro-cery retailers (5.5%)
Supermarkets/hypermarkets (65.8%)Discounters (13.4%)Traditional grocery stores (9.9%)
Supermarkets/hypermarkets (49.7%) Traditional grocery retail-ers (37.4%)
Supermarkets/hypermarkets (47.9%) Traditional grocery re-tailers (44.4%)
Supermarkets/hypermarkets (69.2%) Traditional grocery retail-ers (8.4%)
Traditional grocery retail-ers (48.7%)Supermarkets/hypermarkets (41.5%)
Fastest growth channels (CAGR 2013-18)
nternet retailing (29.4%)Discounters (13.4%)
Internet retail-ing (15.4%)Discounters (7.8%)
Internet retail-ing (9.1%)Convenience stores and forecourt retail-ers (3.6%)
Internet retail-ing (28.6%)Discounters (10.6%)
Internet retail-ing (53.1%)Traditional gro-cery retailers (10.0%)
Internet retail-ing (23.6%)Discounters (1.4%)
Internet retail-ing (27.3%)Discounters (15.1%)
Slowest growth channels(CAGR 2013-18)
Supermarkets/hypermarkets (2.4%)Traditional gro-cery retailers (4.7%)
Convenience stores &forecourt retailers (-0.3%)Supermarkets/hypermarkets (1.5%)
Traditional gro-cery retailers (1.6%)Supermarkets/hypermarkets (2.3%)
Traditional gro-cery retailers (6.8%)Supermarkets/hypermarkets (6.9%)
Convenience stores &forecourt retail-ers (4.8%)Supermarkets/hypermarkets (8.2%)
Traditional gro-cery retailers (-2.2%)Convenience stores and fore-court retailers (-2.1%
Traditional grocery retail-ers (10.0%)Convenience stores and forecourt re-tailers (10.1%)
Pulses, Grains and Cereals - At a Glance

In most developed markets, sales of cereals are at saturation point. Diversifying diets and a move away from carbohydrate-heavy foods mean there is little room to grow. North America, following a decline value CAGR of -1.8% between 2013 and 2018, is expected to decline further over the forecast period, though at a slower rate with an anticipated -0.2% value CAGR between 2018-2023.
Growth is also expected to be slow in other more developed regions, including Europe and Australasia with value CAGRs of 0.8% and 1.1% respectively over the forecast period. Breakfast cereal holds the largest market value share in Australasia and North
While Asia Pacific region drives value demand, the Sub-Saharan Africa region is the most dynamicWith a global market size of US$178.1 billion in 2018, Pulses, Grains & Cereals accounted for 10.2% of the total packaged food market, growing by a CAGR of 1.2% between 2013-2018. Nonetheless, the category is anticipated to witness stronger growth over the forecast period with a value CAGR of 2.7% making it the second fastest growing category after Fats & Oils.
Growth mainly stems from emerging regions, led by Sub-Saharan Africa, followed by the Middle East and North Africa and Asia Pacific, with rising disposable incomes and growing availability and affordability of premium products.
Exhibit 34 - Pulses, Grains & Cereals value sales in 2018, 2023 & CAGR 2018-2023, US$ billion
America. Higher unit prices and challenges from the growing snacking-trend mean that breakfast cereals will further impact the performance of both regions. Breakfast cereal sales in Europe face similar prospects, due to their reputation for being unhealthy and increasing competition from other convenient options, such as breakfast bars.
Dynamic growth in Sub-Saharan Africa is the result of consumers trading up to packaged products. The fastest growth is visible where there is still room to grow consumption levels, such as breakfast cereals, which are still at an earlier stage of development. Middle East and North Africa is also set to see rapid
Market Size and Potential
North America
Latin America
Europe
Middle East &North Africa
Asia Pacific
AustralasiaSub-Saharan Africa
-0.2% 20.6bn
20.8bn 0.8% 28.8bn
27.6bn
2.0% 19.7bn
17.9bn
5.1% 10.4bn
8.1bn
3.8% 13.3bn
11.0bn
3.7% 107.9bn
90.1bn
1.1% 2.4bn
2.2bm
Key: Inner circles indicate the Pulses, Grains & Cereals category market size in 2018, outer circles indicate market size in 2023. The distance between the inner and outer circles indicates the size of the absolute growth
The colour of the circles indicate the growth rate Fast Moderate Slow Static
Source: Euromonitor International analysis from Passport
PU
LSES
, GR
AIN
S &
CER
EALS
99
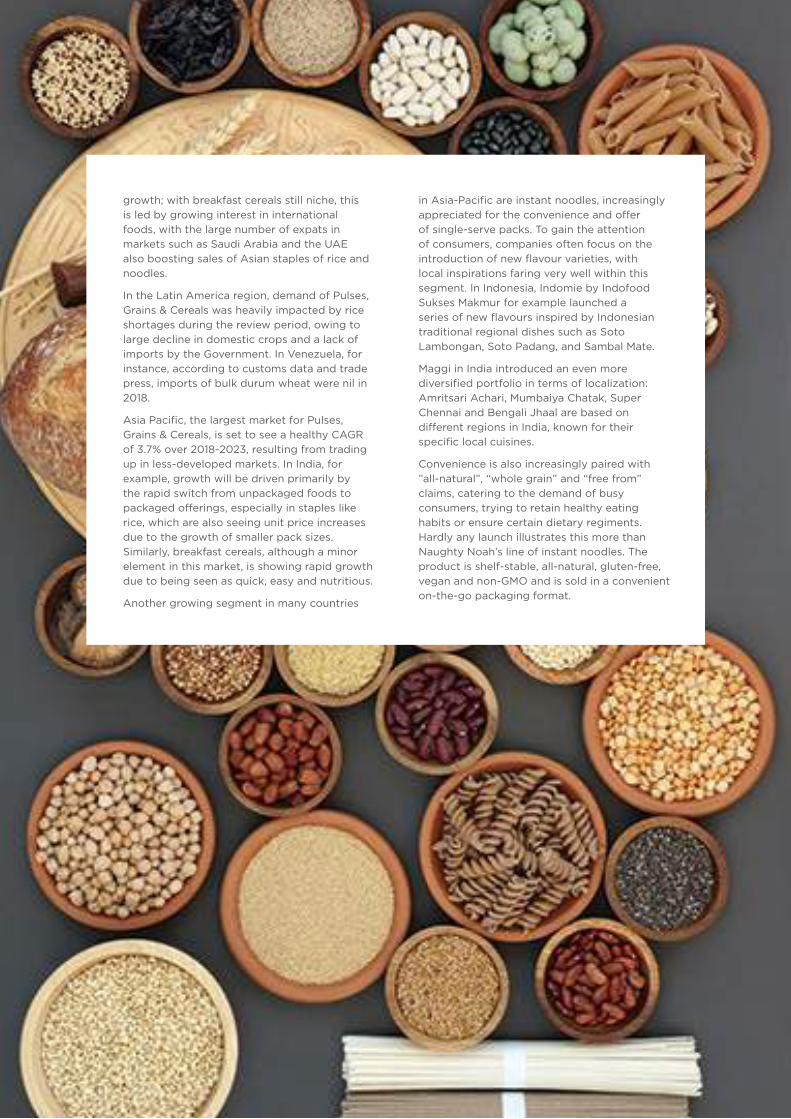
growth; with breakfast cereals still niche, this is led by growing interest in international foods, with the large number of expats in markets such as Saudi Arabia and the UAE also boosting sales of Asian staples of rice and noodles.
In the Latin America region, demand of Pulses, Grains & Cereals was heavily impacted by rice shortages during the review period, owing to large decline in domestic crops and a lack of imports by the Government. In Venezuela, for instance, according to customs data and trade press, imports of bulk durum wheat were nil in 2018.
Asia Pacific, the largest market for Pulses, Grains & Cereals, is set to see a healthy CAGR of 3.7% over 2018-2023, resulting from trading up in less-developed markets. In India, for example, growth will be driven primarily by the rapid switch from unpackaged foods to packaged offerings, especially in staples like rice, which are also seeing unit price increases due to the growth of smaller pack sizes. Similarly, breakfast cereals, although a minor element in this market, is showing rapid growth due to being seen as quick, easy and nutritious.
Another growing segment in many countries
in Asia-Pacific are instant noodles, increasingly appreciated for the convenience and offer of single-serve packs. To gain the attention of consumers, companies often focus on the introduction of new flavour varieties, with local inspirations faring very well within this segment. In Indonesia, Indomie by Indofood Sukses Makmur for example launched a series of new flavours inspired by Indonesian traditional regional dishes such as Soto Lambongan, Soto Padang, and Sambal Mate.
Maggi in India introduced an even more diversified portfolio in terms of localization: Amritsari Achari, Mumbaiya Chatak, Super Chennai and Bengali Jhaal are based on different regions in India, known for their specific local cuisines.
Convenience is also increasingly paired with ”all-natural”, “whole grain” and “free from” claims, catering to the demand of busy consumers, trying to retain healthy eating habits or ensure certain dietary regiments. Hardly any launch illustrates this more than Naughty Noah’s line of instant noodles. The product is shelf-stable, all-natural, gluten-free, vegan and non-GMO and is sold in a convenient on-the-go packaging format.

Market Trends and Drivers
Premiumisation transforms noodles category
Premiumisation is prevailing in packaged food, with instant noodles a good demonstration of this. The instant noodles category has been growing steadily globally, and especially in Asia Pacific. As incomes and urbanisation rise in the region, premiumisation will continue, in response to consumer demand for value-added, convenient and enhanced taste products. Leading players have been launching premium products made with better raw materials, updated packaging, and innovative flavours. For instance, in Vietnam, Masan Consumer Corp launched its Omachi instant noodles cup with real meat sticks in 2018, to improve the taste of its product and to add more calories and nutrients. Such products offer consumers a more filling meal and present a transformation of noodles into a meal territory, albeit with the heftier price tag that comes with it.
Rice consumption in china is set to see a decline
With a value of US$33.98 billion, China accounted for almost 23% of total value consumption of rice, pasta and noodles in 2018. The category’s growth stems from demand for noodles, while demand for rice is anticipated to decline in China, partly owing the country’s slower population growth, and changing eating habits. In order to keep fit, Chinese people are trying to consume fewer carbohydrates and more vegetables. Rice is also being replaced with alternatives like grains and cereals, which can both fill the stomach and offer wellbeing benefits such as enhancing intestinal movements, lowering blood sugar and cholesterol, to name a few.
“No artificial” claims on the rise
With health high on the consumer agenda, the clean label trend will be one of the major factors contributing to ethical label growth worldwide. In North America, “no artificial flavours” is the most prevalent claim across packaged food in percentage terms. Clean label claims are on the rise, affecting the rice, pasta and noodles segment too with Naughty Noah’s in the USA launching a line of instant noodles with all-natural, gluten-free, vegan and non-GMO ramen. Manufacturers globally, are eager to illustrate to consumers not only the clean label attributes of their portfolios, but also to be seen to be embracing the underlying principles of clean labelling, i.e. transparency, robustness, clarity and relevancy. For many manufacturers, clean labels represent a useful vehicle through which to drive this message home. In 2018, Kellogg (a leading manufacturer of breakfast cereals) has taken the lead among other multinational brands by removing all artificial colours and flavours from the entirety of its product portfolio.
Snacking trend presents a challenging opportunity to breakfast cereals
Across the Latin America, North America and Australasia regions, as well as Europe to a certain extent, breakfast cereal sales have suffered due to a shift in consumption habits away from breakfast as a main meal. Over the forecast period, growth of breakfast cereals will be challenged further by innovation across snacking areas that encourage on-the-go consumption. Consumer expectations are constantly evolving, demanding convenient and flavoursome products that do not impede a healthy lifestyle. While this has been encouraging across snack bars, yoghurt and biscuit areas, such innovation has been harder to replicate in breakfast cereals. That being said, this lifestyle change among consumers could present a new opportunity for breakfast cereal manufacturers, by shifting to advertising their products as indulgent snacking items that fulfil snacking needs if eaten at other times of the day.
Health and wellness remain at the forefront of innovation
As nutritional value continues to be an overriding priority for consumers, much of the innovation in Pulses, Grains & Cereals can be described as a revamping of traditional products to better align with changing eating habits and health trends. New offerings following this theme can increasingly be found, representing some of the biggest growth drivers for manufacturers. In the USA, the frozen aisle contains many great examples of this type of innovation, with new products from B&G like riced cauliflower and veggie spirals, which give consumers a convenient, low-carb alternative to traditional grain rice and wheat pasta. Furthermore, as demand for protein continues to rise, a growing number of manufacturers are adding this nutrient to traditionally low-protein products. Barilla, for example, launched its ProteinPLUS line of pasta. Similarly, within breakfast cereals, nutritional value is the core of new product development. For example, Australian manufacturer MixMyMuesli, launched its Healthy Start muesli breakfast range, with no added sugar, syrup or oil in addition to a high protein muesli range, while Sanitarium launched a cholesterol-lowering Weet-Bix, by using plant sterols to reduce cholesterol levels by up to 9% in four weeks.
Packaging innovation
Packaging innovation to appeal to the young generation was another major trend, with the adoption of bright, bold colours and attractive pictures especially within breakfast cereals. On the other hand, with rising consumer demand for convenience and practicality; staple food manufacturers, including rice, pasta and noodles, are responding with several launches of smaller portion size packs and easy-open pouch packages. Mars launched Uncle Ben’s Express in Brazil – regular rice in small-portion (220g pouches) that is ready in two minutes.
PU
LSES
, GR
AIN
S &
CER
EALS
101

Competitive LandscapeAs Pulses, Grains & Cereals market is fragmented, as the category comprises of a large number of different product segments, with few players actually present in all of them.
Apart from a 10% share for private label products, the category is led by Kellogg Co, as the companies leading position within the consolidated breakfast cereals market ensured a 4% share in 2018. The company however lost shares, as consumers in North America, Europe and Australasia started to question the health
benefits of regular cereals. The Chinese giant Ting Hsin International Group hold a second position with a global value share of 3% in 2018. The company is benefiting from the popularity of its’ Master Kong brand of instant noodles in combination with the sheer size of the Chinese market.
Exhibit 35 - Global Company Shares 2018 - Pulses, Grains & Cereals
Rank Company Global Market Share
1 Kellogg Co 4.21%
2 Ting Hsin International Group 2.95%
3 Nissin Foods Holdings Co Ltd 2.45%
4 JA Group (Japan Agricultural Cooperatives) 2.17%
5 General Mills Inc 1.70%
6 PepsiCo Inc 1.66%
7 Ebro Foods SA 1.55%
8 Cereal Partners Worldwide SA 1.55%
9 Toyo Suisan Kaisha Ltd 1.52%
10 Indofood Sukses Makmur Tbk PT 1.47%
11 Private Label 9.73%
12 Others 69.05%
Source: Euromonitor International analysis from Passport

Supermarkets and hypermarkets dominate global distributionGlobally, the leading sales channel for Pulses, Grains & Cereals is supermarkets/hypermarkets, with a share of 49.3% in 2018, followed by traditional grocery retailers with a share of 28.8%. Supermarkets/hypermarkets lead due to the wide selection of products on offer, and one- stop shopping convenience at the lowest prices.
Supermarkets/hypermarkets lead in all regions except Sub-Saharan Africa, where they rank second to traditional grocery retailers. Their strongest positions are in Australasia, North America and Europe. Networks here are very well developed and grocery chains compete strongly on price and range. Strong private label collections also underpin this dominance, ranging from basic value ranges for bulk essentials, to premium chilled noodle and pasta dishes at competitive prices.
Distribution Landscape
Traditional grocery retailers growing at a faster rate than modern grocery retailers
Time-pressed consumers are increasingly prioritising convenience. Small format retailers, like small independent grocers, have grown faster than larger supermarkets (with global value CAGRs of 5.4% and 2.8% respectively between 2013-2018) by offering proximity and time savings. Global urbanisation trends, have also helped drive growth for these smaller outlets.
Internet retailing is poised for substantial growth, with the Middle East and Asia Pacific chartering a course for e-commerce
Internet retailing was the most dynamic channel over the review period with a global value CAGR of 26.8% over 2013-2018, led by the Middle East and North Africa with 59.1% and Asia Pacific with 29.4%. Despite sales being small in absolute terms, internet retailing has emerged as a tectonic shift, driven by younger consumers who increasingly rely on e-commerce. As consumers gravitate to e-commerce for routine weekly purchases, trip frequency to brick and mortar outlets will decline and opportunities for unplanned sales will become more limited; thus posing a significant threat for supermarket/hypermarket channel growth and development.
Exhibit 36 - Global Pulses, Grains & Cereals value sales split by retail channels, 2012-2018
100%
90%
80%
70%
60%
50%
40%
30%
20%
10%
0%
2012 2013 2014 2015 2016 2017 2018
Convenience Stores and Forecourt Retailers
Traditional Grocery RetailersDiscounters Supermarkets/
Hypermarkets Internet Retailing Others
Source: Euromonitor International analysis from Passport
PU
LSES
, GR
AIN
S &
CER
EALS
103

Challenges and Opportunities
Chal lenges
Key opportunities lie in navigating consumer demand for lower carb, convenient and sustainable foods
Crop vulnerability to weather conditions
Price volatility due to climate conditions and
dependence on high number of small farms
Move away from wheat-based products in
developed markets due to health concerns
Some market saturation for basic rice, pasta, noodles
and breakfast cereals in developed markets
Rising health awareness and shift away
from carbohydrate consumption
Increased penetration of private label, offering
high quality at lower prices
Price pressure on small players including
manufacturers and traditional grocery
retailers, from large-scale manufacturers and
modern retailing
Key: Moons indicate the level of direct impact on each stakeholder
The fuller the moon, the higher the direct impact:
Low _________________________> high
Supplier/farmer ManufacturerWholesale / import - exporter
Retailer

Opportunities Ethical farming methods
gain a competitive advantage
Shift from loose/bulk products to packaged
and branded items, especially in developing
markets
Need for convenience across developed markets presents
opportunities for quick cook, ready prepared, exotic
flavours and health-positioned products
Growing demand for breakfast cereals as a
snacking alternative, due to changing lifestyles
Growth in alternative starches and protein-centric ‘carbs’, like lentil or quinoa-based
pastas and rice, and oat-based cereals
Rising opportunity for alternative carbs and
gluten-free options to attract a health-conscious
demographic
Sustainability and mounting focus on clean
label concerns
Key: Moons indicate the level of direct impact on each stakeholder
The fuller the moon, the higher the direct impact:
Low _________________________> high
Supplier/farmer ManufacturerWholesale / import - exporter
Retailer
PU
LSES
, GR
AIN
S &
CER
EALS
105

Pulses, Grains and Cereals Sector
CONFIDENCE INDEXCurrent performance satisfaction vs. expected growth
Satisfaction - current performance Vs Activity
Confidence - Over the next 12 months Vs Activity
Confidence - Over the next 3 years Vs Sector
Negative Neutral Positive
Voice of the Industry

Main Challenge
Manufacturer
Volatile commodity prices
Growing competition from Private Label products
Adapting to new retail and distribution models
Technology/Automation integrations
1
2
3
4
Key TrendsKey Trends Vs Activity Pulses, Grains & Cereals
Organic & Free-from 54.90%
Private Label 33.20%
Honest advertising & labeling 33.20%
Plastic bans on packaging, retail and foodservice 28.80%
Ethical living: Eco-friendly, Halal and Fair trade 28.30%
Food waste prevention 23.40%
Farm to fork sustainability 20.70%
Premium & Gourmet 17.40%
Elevated convenience, 'grab-and-go' 12.00%
Fortified & Functional 7.60%
Westernization & diversification of diet 5.40%
Animal welfare 4.30%
Main growth channel in the next 12 months by sectorProduct portfolio and strategy Vs Sector Pulses, Grains & Cereals
Direct Sales to customer 51.20%
Private Label 21.40%
Contract Manufacturing 20.80%
Research & Development 18.50%
Third-party ecommerce 16.10%
Current Channels 11.90%
Own ecommerce 11.30%
Mergers & Acquisitions 7.10%
Omni-channel retailing 6.00%
Other 1.80%
PU
LSES
, GR
AIN
S &
CER
EALS
Voice of the Industry
107107

Top growth strategy for the next 3 years by sector
Pulses, Grains & Cereals
Venture into new market Grow product portfolio Reduce cost / Enter value-for-money category
Explore new F&B category
Critical Factor - Pulses, Grains & Cereals
Consumer attention - Pulses, Grains & Cereals
29%
22%
19%
16%
23%
9%
8%
7%
8%
32%
29%
28%
31%
23%
21%
20%
19%
17%
0% 10% 20% 30% 40% 50% 60% 70%
Selling price (strong competition)
Payment timeline/difficulty in getting paid
Tax, regulatory, bureaucratic aspects
Input/raw material costs
Cost of capital/access to credit
Workforce cost
Patents and trademarks/counterfeiting problem
Fast-changing sector
Shortage of professional education / training
Critical factor - Pulses, Grains & Cereals
Extremely critical Fairly critical
6%
6%
15%
16%
17%
15%
19%
20%
15%
44%
48%
13%
19%
22%
22%
22%
27%
23%
31%
37%
30%
29%
0% 10% 20% 30% 40% 50% 60% 70% 80% 90%
Vegan
Premium/gourmet
Sustainability
Free-from
Organic Certified
Private label
Halal Certified
Brand
Packaging
Price
Quality
Consumer attention - Pulses, Grains & Cereals
Extreme impact Significant impact
38.20%
21.80%
18.80%
21.20%
Voice of the Industry

38.20%
21.80%
18.80%
21.20%
Fats Oils

Fats and Oils - At a Glance
Asia Pacific Australasia Europe Latin AmericaMiddle
East & North Africa
North America
Sub-Saharan Africa
Consumer spending on breads and cereals as % of total F&B
1.8% 0.6% 0.9% 1.3% 2.1% 0.5% 1.2%
Key Growth Markets (2013-2018)
IndiaBangladeshMalaysiaJapanPakistan
New ZealandAustralia
UKGermanyFrance
ArgentinaColombiaBrazilMexicoPeru
EgyptAlgeriaIranMoroccoTurkey
CanadaSouth AfricaKenyaTanzania
Key Sub-categories*
Palm Oil (20.4%)Soy Oil (20.0%)Rapeseed Oil (13.6%)
Olive Oil (55.9%)Rapeseed Oil (17.8%)
Olive Oil (46.2%)Sunflower Oil (34.5%)
Soy Oil (38.4%)Corn Oil (13.7%)Sunflower Oil (11.3%)
Sunflower Oil (44.7%)Olive Oil (23.8%)Corn Oil (10%)
Olive Oil (37.6%)Soy Oil (26.6%)Rapeseed Oil (14.9%)
Sunflower Oil (36.5%)Palm Oil (24.6%)Olive Oil (13.8%)
Key Channels**
Traditional Grocery Retailers (60.8%)Supermarkets/Hypermarkets (34.8%)
Supermarkets/hypermarkets (85.1%)Discounters (10.2%)
Supermarkets/Hypermarkets (59.4%)Traditional grocery retailers (15.4%)Discounters (13.2%)
Supermarkets/Hypermarkets (48.2%)Traditional grocery retailers (39.1%)
Traditional grocery retailers (57.5%)Supermarkets/hypermarkets (33.5%)
Supermarkets/hypermarkets (79.8%)Traditional grocery retailers (6.2%)
Traditional grocery retailers (50.3%)upermarkets/hypermarkets (41.3%)
Fastest growth channels (CAGR 2013-18)
Internet (15.9%)Traditional Grocery Retailers (16.5%)
Internet (17.4%)Discounters (12.9%)
Internet (13.6%)Convenience Stores & Forecourt Retailers (3.4%)
Internet (22.7%)Convenience Stores & Forecourt Retailers (16.0%)
Internet (20.9%)Discounters (14.1%)
Internet (48.2%)Discounters (2.1%)
Internet (131.4%)Traditional Grocery Retailers (10.6%)
Slowest growth channels(CAGR 2013-18)
Convenience Stores & Forecourt Retailers (3.3%)Discounters (3.8%)
Convenience Stores & Forecourt Retailers (1.6%)Supermarkets/hypermarkets (3.2%)
Traditional Grocery Retailers (-0.5%)Supermarkets/hypermarkets (2.8%)
Traditional Grocery Retailers (7.9%)Supermarkets/hypermarkets (8.3%)
Convenience Stores & Forecourt Retailers (6.4%)Traditional grocery retailers (7.2%)
Convenience Stores & Forecourt Retailers (-0.9%)Traditional grocery retailers (-0.3%)
Supermarkets/ Hypermarkets (7.6%)Convenience Stores & Forecourt Retailers (7.9%)
Source: Euromonitor International analysis from Passport Notes: *Market share of overall Fats & Oils market in 2018
** Market channel share of overall Fats & Oils market in 2018

Asia Pacific was the fastest growing region during 2013-2018, recording a CAGR of 7.4%, driven by the popularity of palm and soy oil, which combined accounted for more than a 40% value share of Fats & Oils sales in the region. Rising incidences of conditions such as obesity and high cholesterol are increasingly leading consumers to choose healthier and more nutritious oils, such as soy and olive oils, which are rich in omega 3 and vitamin E and are cholesterol free.
In India, the largest market for Fats & Oils, urban consumers are increasingly becoming health aware and slowly shifting to healthier Edible oil categories, including olive oil and rapeseed oil. Manufacturers are
The total global market value for Fats & Oils stood at US$95.7 billion in 2018, up by a CAGR of 5.7% between 2013-2018. It is forecast to reach US$126.4 billion by 2023. India and China alone were responsible for approximately 52% of global value in 2018.
Exhibit 37 - Fats & Oils Value Sales in 2018, 2023 & CAGR 2018-2023, US$ billion
tapping into this trend by widening their variety of offerings in the country, and new players are entering the market, e.g. Rajasthan Olive Cultivation Ltd.
While Europe is the second largest region for Fats & Oils, mature European markets shows slow forecast growth to 2023, with a value CAGR of 1.1% resulting from concerns about health and wellness, which continue to shape consumption patterns. Growing demand for healthier diets is driving sales of olive oil in the region, with consumers trading up, either from other Fats & Oils to olive oil or within olive oil to higher value offerings, for example, (super) premium products or organic products as an alternative to conventionally grown olive trees.
Market Size and Potential
North America
Latin America
Europe
Middle East &North Africa
Asia Pacific
AustralasiaSub-Saharan Africa
-0.5% 3.9bn
4.0bn 1.1% 15.0bn
14.2bn
2.4% 10.7bn
9.5bn
3.4% 5.5bn
4.6bn
3.4% 11.6bn
9.8bn
8.3% 790bn
52.9bn
2.3% 579.0bn
517.0bm
Key: Inner circles indicate the Fats & Oils market size in 2018, outer circles indicate market size in 2023The distance between the inner and outer circles indicates the size of the absolute growth
The colour of the circles indicate the growth rate Fast Moderate Slow Static
Source: Euromonitor International analysis from Passport
FA
TS &
OIL
S
111

Exhibit 38 - Fats & Oils Regional Value Sales by Product Type in 2018
100%
90%
80%
70%
60%
50%
40%
30%
20%
10%
0%
2012 2013 2014 2015 2016 2017 2018
Olive Oil Corn Oil Palm Oil Rapeseed Oil Soy Oil Sunflower Oil Other Edible Oil
Source: Euromonitor International analysis from Passport
In the Middle East and North Africa, sunflower oil has the biggest share, however corn oil and olive oil are also expected to grow. Consumption in this region is price sensitive, and the region’s growth is volume driven, which presents opportunities for frying oils with healthier and better propositions.
In Latin America, while soy oil will continue to dominate value sales in 2023, olive oil will be the most dynamic category with a value CAGR of 4.4% between 2018-2023. With lower inflation rates, and recovering purchasing power among low- and middle-income groups, olive oil is one of the first products they are choosing to move back to.
North American region is forecast to register a slight drop in value over the 2018-2023 period (-0.5%), owing to greater uncertainty regarding trade tariffs. Olive oil, which had the largest value share of Fats & Oils sales in the region, at more than 37% in 2018, is predominantly imported from Mediterranean countries. In July 2018, certain US trade policies began to pose their first direct threat to the stability of prices within the industry as the US International Trade Commission approved a new set of tariffs on imports. While still far too early to ascertain any definitive fallout, concerns over the potential impact
on prices that could arise for American consumers are mounting. Theoretically, should prices of imported olive oil increase, American consumers may shift more aggressively to the growing supply of domestic products, further transforming the category.
On a global level, health and wellness was therefore probably the most important factor impacting new product developments within Fats & Oils, with important launches within olive oil dominating many markets. In India, where olive oil is still a niche product, Borges introduced several new products, while Turkey saw the introduction of an increasing number of smaller, organic super-premium ranges.
However, as olive oil is often seen as a luxury, not affordable by many consumers in developing countries, innovations within blended oils often try to fill the gap. NatureFresh Acti Heart, a blend of canola oil and rice bran oil for example was introduced in 2018 by Cargill India to offers price conscious consumers in India a cheap alternative to olive oil.

Market Size and Potentialshare expected to reach 22.2% by 2023, up from 21.2% in 2018. Manufacturers in Asia Pacific have recently attempted to capitalise on this trend via TV advertising campaigns and new product launches. For instance, in 2018 Cargill launched Gemini Rice Bran Oil to appeal to health-conscious consumers. However, it will take some time before other Fats & Oils gain mainstream popularity.
Growing need for credible and clean labels
In the EU, protected designation of origin (PDO) and protected geographical indication (PGI) labels are used for olive oil. GMO-free, kosher and Halal-certified oils are available in many countries, with GMO content particularly sensitive in Europe and Asia Pacific. GMO-free leads the clean label charge in China, with sales largely derived from a few key vegetable and seed oil manufacturers that support GMO-free agriculture. In an effort to address transparency and sustainability growing requirements by customers and governments alike, Nestlé and Unilever undertook the bold step of becoming the first global food manufacturers to publish their entire palm oil supply chains, in 2018 to. PepsiCo has since responded by pledging to publish a list of its palm oil suppliers.
Premiumisation supports value growth
Fats & Oils is one of the categories in which consumers are willing to pay more for smaller quantities of high-quality, premium offerings. This, combined with the latest health and wellness trend, offered ample opportunities for value growth. Furthermore, most Fats & Oils will also probably benefit from the development of more sophisticated packaging (e.g. dark/smoked glass in olive oil, which is already widespread in Italy), smaller formats or more convenient closures and pourers.
Healthy types of Fats & Oils prevail
The rising incidence of conditions like obesity and high cholesterol are increasingly leading consumers to choose healthier and more nutritious foods. Consumers globally are shifting towards healthier alternatives. Vegetable oils, which are rich in unsaturated fatty acids, are perceived as reducing the risk of cardiovascular diseases. Among vegetable oils, sunflower oil will maintain the largest value share in 2023. In China, rice oil is another healthy oil that is gaining increasing attention as it is believed to have a good balance of fatty acids while retaining the optimum nutrition from rice. Arawana is a pioneer brand of rice oil. In the Middle East region, the shift towards healthier alternatives is also growing, with coconut oil gaining popularity, not only for cooking purposes but also for use uses, such as skin and hair care.
Palm oil benefits from lower price point
Globally, palm oil is anticipated to gain a larger value share over the forecast period, reaching 15.6% in 2023, up from 13.4% in 2018 and recording a value CAGR of 8.9%. Palm oil remains among the cheapest options within Fats & Oils and is widely used by foodservice operators. Palm oil is also seeing a rise in manufacturer activity to entice further demand. For instance, in India, the Malaysian Palm Oil Council signed a memorandum of understanding with the Mumbai Dabbawala Association in 2017, to raise awareness of palm oil among Indian consumers. Together with its affordability, such campaigns should continue to support growth in palm oil consumption over the forecast period.
Other Fats & Oils gain momentum as companies introduce new products
Thanks to rising health awareness, other Fats & Oils, such as canola, groundnut, coconut, rice bran and sesame oil, are steadily gaining popularity with its value
FA
TS &
OIL
S
113

Competitive LandscapeWhile private label still holds a leading position within Fats & Oils, its’ 9% share shows limited success in this category.
Wilmar International Ltd is the dominant player within the edible oil market, due to leading positions in many large countries in Asia-Pacific, such as China, India, Indonesia and Vietnam. The sheer size of these markets in combination with high per capita oil consumption supported the strong stance of the company. Nevertheless, innovative new players and growing demand for premium products such as high-end olive oil, nut and seed oils, such as macadamia and walnut or grapeseed oil put pressure on the company, who’s share dropped from 10% in 2013 to 7% in 2018.
Exhibit 39 - Global Company Shares 2018 Cereals – Fats & Oils
Rank Company Global Market Share
1 Wilmar International Ltd 6.94%
2China National Cereals, Oils & Foodstuffs Imp & Exp Corp (COFCO)
2.27%
3 Bunge Ltd 1.92%
4 Adani Group 1.81%
5 Deoleo SA 1.65%
6 Cargill Inc 1.57%
7 Emami Ltd 1.41%
8 Ruchi Group 1.35%
9 Savola Group 1.16%
10 Shandong Luhua Group Co Ltd 1.09%
11 Private Label 8.52%
12 Others 70.30%
Source: Euromonitor International analysis from Passport

Traditional grocery retailers lead with a strong position in Asia Pacific and the Middle East and North Africa regionsGlobally, the leading sales channel for Fats & Oils is traditional grocery retailers, which accounted for 48.8% of value sales in 2018, up from 39.7% in 2013. The traditional grocery retail channel continues to grow in Asia Pacific, Middle East and North Africa, as well as Sub-Saharan Africa. In Asia Pacific, traditional retailers account for the largest value share of Fats & Oils sales among global regions, while in Sub-Saharan Africa traditional grocery retailers increased their market share from 46.9% in 2013 to 50.3% in 2018, benefitting from rapid urbanisation and slower development of modern retail infrastructure.
Supermarkets/hypermarkets hold the second largest value share globally, at 42% in 2018, with the channel leading sales in Australasia, Europe, Latin America and North America. The growing popularity of private label brands within Fats & Oils is further strengthening the position of supermarkets/hypermarkets in developed regions. High quality, price competitive private label oil ranges are now present not only in discounters but also in leading chained retailers in developed markets, placing them in a strong position.
Internet retailing, despite being a niche channel for Fats & Oils (1.3% value share in 2018), is growing rapidly, supported by the established and developed markets of Europe and North America. Clearly convenience is the major factor driving growth of the channel.
Discounters’ market share in Fats & Oils is also growing rapidly in regions like Middle East and North Africa as well as Australasia, benefiting from proximity and value offerings, as well as the establishment and rapid expansion of leading discounters, such as Aldi and Lidl.
Retail consolidation in Latin America is apparent in the expansion of modern retail, especially in large markets such as Brazil and Argentina. Small local stores struggle to compete with the economies of scale offered by modern retailers. However, their high visibility in residential areas ensures they offer convenience to price-sensitive consumers.
Distribution Landscape
Exhibit 40 - Global Fats & Oils Value Sales Split by Retail Channels, 2013-2018
100%
90%
80%
70%
60%
50%
40%
30%
20%
10%
0%
2012 2013 2014 2015 2016 2017 2018
Convenience Stores and Forecourt Retailers
Traditional Grocery RetailersDiscounters Supermarkets/
Hypermarkets Internet Retailing Others
Source: Euromonitor International analysis from Passport
FA
TS &
OIL
S
115

Challenges and Opportunities
Chal lenges
The main challenges in the Fats & Oils industry are in the very first step of the supply chain
High cost of ethical farming
Weather volatility impact on consistent quality of
oil crops
High cost of investment in modernisation and
scaling up
Dependence on narrow geographic footprints of
most oil crops
Overcoming consumer concerns over ethics in palm oil production as well as trust in quality
controls
Rising competition from private label
manufacturers, both at the value and premium
ends of the market
Trade agreements and rising import tariffs
Key: Moons indicate the level of direct impact on each stakeholder
The fuller the moon, the higher the direct impact:
Low _________________________> high
Supplier/farmer ManufacturerWholesale / import - exporter
Retailer

Opportunities
Healthy, high quality and ethical oils present opportunities
Emphasising sustainable and ethical farming
methods offers greater sales potential
Oils that are successfully positioned as healthy
show strong growth potential
Clear and credible labelling to address
issues of health, quality and ethics
Globalisation and widening consumer
palates are encouraging use beyond traditional oils
Higher sales mark ups through premiumisation and value-added oils in
developed countries
Increasing demand for exotic oils such as
coconut oil
Rising consumer awareness of the
benefits of quality/healthy oils
Key: Moons indicate the level of direct impact on each stakeholder
The fuller the moon, the higher the direct impact:
Low _________________________> high
Supplier/farmer ManufacturerWholesale / import - exporter
Retailer
FA
TS &
OIL
S
117

Fats and Oils Sector
CONFIDENCE INDEXCurrent performance satisfaction vs. expected growth
Satisfaction - current performance Vs Activity
Confidence - Over the next 12 months Vs Activity
Confidence - Over the next 3 years Vs Sector
Negative Neutral Positive
Voice of the Industry

Main Challenge
Manufacturer
Volatile commodity prices
Technology/Automation integrations
Demand for traceability and sourcing transparency
Higher regulatory control & production costs
1
2
3
4
Key TrendsKey Trends Vs Activity Fats & Oils
Organic & Free-from 58.90%
Ethical living: Eco-friendly, Halal and Fair trade 46.40%
Private Label 35.70%
Honest advertising & labeling 26.80%
Plastic bans on packaging, retail and foodservice 19.60%
Food waste prevention 16.10%
Elevated convenience, 'grab-and-go' 12.50%
Farm to fork sustainability 10.70%
Westernization & diversification of diet 10.70%
Fortified & Functional 8.90%
Premium & Gourmet 7.10%
Animal welfare 5.40%
Main growth channel in the next 12 months by sectorProduct portfolio and strategy Vs Sector Fats & Oils
Direct Sales to customer 46.30%
Contract Manufacturing 24.10%
Private Label 22.20%
Research & Development 20.40%
Current Channels 20.40%
Own ecommerce 18.50%
Mergers & Acquisitions 14.80%
Third-party ecommerce 9.30%
Omni-channel retailing 5.60%
Other 1.90%
FA
TS &
OIL
S
Voice of the Industry
119119

Top growth strategy for the next 3 years by sector
Fats & Oils
Venture into new market Grow product portfolio Reduce cost / Enter value-for-money category
Explore new F&B category
Critical Factor - Fats & Oils
Consumer attention - Fats & Oils
31%
27%
22%
18%
15%
13%
24%
15%
16%
27%
31%
35%
33%
27%
29%
16%
24%
18%
0% 10% 20% 30% 40% 50% 60% 70%
Selling price (strong competition)
Input/raw material costs
Tax, regulatory, bureaucratic aspects
Cost of capital/access to credit
Workforce cost
Fast-changing sector
Payment timeline/difficulty in getting paid
Shortage of professional education / training
Patents and trademarks/counterfeiting problem
Critical factor - Fats & Oils
Extremely critical Fairly critical
4%
11%
13%
11%
15%
18%
9%
13%
18%
36%
47%
24%
16%
20%
25%
25%
25%
38%
36%
33%
36%
25%
0% 10% 20% 30% 40% 50% 60% 70% 80%
Vegan
Premium/gourmet
Private label
Organic Certified
Free-from
Sustainability
Packaging
Brand
Halal Certified
Quality
Price
Consumer attention - Fats & Oils
Extreme impact Significant impact
35.2%
29.6%
18.5%
16.7%
Voice of the Industry
Cooking Ingredients
Industry
121

Asia Pacific Australasia Europe Latin AmericaMiddle
East & North Africa
North America
Sub-Saharan Africa
Consumer spending on Cooking Ingredients as % of total F&B in 2018
1.8% 3.8% 3.1% 2.0% 1.8% 4.4% 1.6%
Key growth markets(2013-2018)
IndiaChinaVietnam
New ZealandAustralia
FranceItalyGermany
ArgentinaBrazilMexico
Saudi ArabiaIranEgypt
USACanada
South AfricaGhanaDemocratic Republic of Congo
Key sub-categories in 2018
Sauces, Dress-ings and Con-diments 87.5%Sweet Spreads 7.2%Soup 5.4%
Sauces, Dressings and Condiments 73.1%Sweet Spreads 16.3%Soup 10.6%
Sauces, Dressings and Condiments 67.2%Sweet Spreads 21.6%Soup 11.2%
Sauces, Dressings and Condiments 78.9%Sweet Spreads 15.1%Soup 6.1%
Sauces, Dressings and Condiments 64.7%Sweet Spreads 31.6%Soup 3.7%
Sauces, Dressings and Condiments 73.2%Soup 13.5%Sweet Spreads 13.3%
Sauces, Dressings and Condiments 88.3%Sweet Spreads 7.8%Soup 3.8%
Key channels in 2018
Supermarkets/Hypermarkets 52.1%Traditional Grocery Retailers 23.9%
Supermarkets/hypermarkets 83.3%
Supermarkets/hypermarkets 59.5%Discounters 17.6%Traditional Grocery Stores 11.8%
Supermarkets/hypermarkets 54.1%Traditional Grocery Stores 33.8%
Traditional Grocery Stores 44.7%Supermarkets/hypermarkets 41.7%
Supermarkets/hypermarkets 75.8%Traditional Grocery Stores 5.3%
Traditional Grocery Stores 65.7%Supermarkets/hypermarkets 28.0%
Fastest growth channels (CAGR 2013-18)
Discounters 12.3%Internet Retailing 11.8%Traditional Grocery Retailers 8.9%
Internet Retail-ing 11.0%Discounters 6.6%
Internet Retail-ing 10.1%Convenience Stores and Forecourt Re-tailers 3.6%Discounters 3.5%
Internet Retail-ing 31.8%Convenience Stores and Forecourt Re-tailers 12.6%Discounters 10.4%
Internet Retail-ing 44.6%Discounters 10.2%Supermarkets/Hypermarkets 8.3%
Internet Retail-ing 20.5%Discounters 3.5%
Internet Retail-ing 36.0%Convenience Stores and Forecourt Re-tailers 12.0%Discounters 11.9%
Slowest growth channels(CAGR 2013-18)
Supermarkets/Hypermarkets 5.4%Convenience Stores and Forecourt Re-tailers 7.2%
Convenience Stores and Forecourt Retailers -5.0%Supermarkets/Hypermarkets 1.9%Traditional Grocery Retailers 2.5%
Traditional Grocery Retailers 0.1%Supermarkets/Hypermarkets 2.6%
Supermarkets/Hypermarkets 8.8%Traditional Grocery Retailers 9.4%
Convenience Stores and Forecourt Re-tailers 7.4%Traditional Gro-cery Retailers 7.7%
Traditional Gro-cery Retailers -0.6%Convenience Stores and Forecourt Retailers 1.4%Supermarkets/Hypermarkets 1.6%
Traditional Grocery Re-tailers 10.4%Supermar-kets/Hyper-markets 10.4%
Cooking Ingredients Industry at a Glance
Source: Euromonitor International analysis from Passport

Key growth markets Globally, Asia-Pacific was the largest market for Cooking Ingredients in 2018. The region’s young generation is increasingly trying international cuisines, such as Mexican food, the preparation of which relies on extensive use of Sauces, Dressings and Condiments. This resulted in sales of these products rising remarkably.
Asia Pacific is also among the fastest growing regions, despite being the largest market in 2018. The sheer size of the Asia Pacific region makes it impossible to ignore, but the growth story goes far beyond mere size. Cooking Ingredients is particularly benefiting from the
boom in e-commerce, which is making such products available in small cities and towns, and thus helping the category’s rapid expansion.
On the other hand, Latin America and Europe were the slowest growing regions between 2013-2018. Europe saw only marginal growth over 2013-2018, with a value CAGR of 0.3%. This reflected mature position of Cooking Ingredients in these markets, especially the UK, France and Germany. That being said, sales are poised to recover and grow by 1.3% over 2018-2023, as consumers migrate towards premium offerings. Meanwhile, Latin America is forecast to see the most dynamic growth over 2018-2023 with a value CAGR
Cooking Ingredients is among the smallest categories in packaged food, with a world total market size of US$172.96 billion in 2018, up by a CAGR of 1.6% between 2013-2018. However, the category has an optimistic prospect over the forecast period, as value growth is anticipated to accelerate to reach a CAGR of 2.3% between 2018-2023.
Growth is largely stemming from emerging regions, where there is a growing ability to afford more premium options that also offer better health benefits. Meanwhile, the growing popularity of international cuisines, rising disposable incomes and increasingly busy lifestyles are some of the major factors positively impacting the growth of Cooking Ingredients globally.
Exhibit 41 - Cooking Ingredients by Region (2018, US$ billion)
Market Size and Potential
North America
Latin America
Europe
Middle East &North Africa
Asia Pacific
AustralasiaSub-Saharan Africa
1.2% 41.5bn
39.1bn 1.3% 49.9bn
46.7bn
3.5% 17.4bn
14.7bn
4.2% 7.6bn
6.2bn
3.2% 10.1bn
8.5bn
3.3% 63.7bn
54.1bn
0.6% 3.5bn
3.4bm
Key: Inner circles indicate the Cooking Ingredients market size in 2018, outer circles indicate market size in 2023The distance between the inner and outer circles indicates the size of the absolute growth
Colour of the circles indicate the growth rate Fast Moderate Slow StaticSource: Euromonitor International analysis from Passport
C
OO
KIN
G IN
GR
EDIE
NTS
123

of 3.5% compared to a CAGR of -0.4% between 2013-2018, with sales boosted as the Brazilian economy continues to recover.
North America saw only marginal growth over 2013-2018, as a result of product maturity in the US. Value growth has also been depressed by growing interest in private label products.
The Middle East region is growing from a small base, and remains among the smallest Cooking Ingredients markets globally. Growth of Cooking Ingredients in the Middle East region is benefiting from premiumisation and a shift towards healthier food alternatives, including home cooking, which is largely driving demand for Sauces, Dressing and Condiments as well as Soup.
Key growth sub-categories Given the rising popularity of Westernisation and Western food in India and China, sales of Sauces, Dressings and Condiments have risen and led solid growth in Asia Pacific in 2018. India’s dry sauces remained the largest category within Sauces, Dressings and Condiments and continued to post strong double-digit growth in value terms in 2018. Together with herbs and spices, dry sauces are a key ingredient in Indian cuisine, and therefore used on a daily basis in most households in the country. Another factor that bolstered the development of both categories was rising demand for ready-to-use blended products that make it easier to prepare more complicated dishes, such as biryani, at home. In China, pasta sauces and salad dressings contributed the most to the regions’ growth due to the increasing need for a simple and convenient cooking approach.
While China is responsible for a 36.6% of value share of Asia Pacific’s Cooking Ingredients market, the majority of growth in the region stems from India, with a sharp value CAGR over the review period of 12.4%.
In Europe, despite the apparent maturity of the market
in Germany and France, Sauces,
Dressings and Condiments continue to grow, being the second fastest growth category after sweet spreads. The category plays a key role in supplying suitable Cooking Ingredients for increasingly busy consumers who generally like to cook and appreciate convenient solutions to enhance the flavour of their meals. In Germany, table sauces, such as barbecue sauces (due to the increasing popularity of barbecuing), oyster sauces, soy sauces and chili sauces posted robust current value growth, with many benefiting from a certain trend towards more-exotic dishes.
In Latin America, Brazil and Mexico are the two largest markets for Cooking Ingredients, with Sauces, Dressings and Condiments again accounting for the largest market share in value terms. Brazil is not only the largest market in Latin America, with a 39.0% value share, but is also among the third fastest growing markets in the region, after Argentina and Mexico.
Sweet Spreads (particularly nut and seed variants) recorded the fastest value CAGR in Mexico, at 3.9%, benefiting from their health-associated attributes, specifically as a source of protein and energy. In Brazil too, Sweet Spreads growth was second only to Sauces, Dressings and Condiments with a value CAGR of 3.0% between 2013-2018, driven by improved packaging and marketing strategies by manufacturers which were in line with consumer preferences for either smaller packaging with low disbursement, or larger packaging at competitive unit prices.
Despite growth in the Middle East and North Africa as a whole, the value of Cooking Ingredients in Saudi Arabia witnessed a slowing trend in 2018, which is anticipated to continue to dip in 2019/2020 before recovering slightly after that up to 2023. The Kingdom is undergoing many changes, including the introduction of VAT and expat levy-taxes, in addition to the removal of government subsidies on staple foods. A combination of these factors is influencing consumer purchasing power and forcing a shift towards lower priced items. Iran, is among the largest markets in the Middle East region, with Sweet Spreads representing both the largest market share and fastest growth category, with a value CAGR of 8.3% over 2013-2018.
In 2018, sales growth recovered slightly in the US, with a small uptick registered relative to the decline witnessed in 2017. Much of this improved performance came as a result of strong growth in health and wellness areas. The US is the largest market for Soup globally, by a significant margin. The category was also the most dynamic between 2017/2018, recording value growth of 1.4%.
Higher unit prices in Nigeria, caused by the depreciation of the local currency, led to a decline in value sales over the review period, with Cooking Ingredients recording a CAGR of -3.7% over 2013-2018.
South Africa, the second largest market in the region, recorded strong value growth of 3.2% over the review period, due to the rising cost of raw materials, growing fuel prices and a 1% increase in Value Added Tax (VAT), the first increase since 1994.
One of the main drivers behind growth in Cooking Ingredients in the Middle East and Africa is demand for convenience. As lifestyles become increasingly fast-paced, consumers have less time to prepare meals. This has led to consumers seeking meal solutions that are quick, convenient, nutritious and easy to prepare. Moreover, urbanisation and an increase in the number of single households also contributed to demand for convenience, with Cooking Ingredients such cooking and pasta sauces requiring less effort to prepare. However, alongside this, there is also much more awareness of the importance of healthy eating, encouraging consumers to replace eating-out with home-prepared meals.
Product developmentInnovative developments within the category focused mainly on health and wellness, often in combination with convenience and in Asian markets often influenced by Westernization. The premium brand Shinho, from Yantai Shinho Weidamei Food Co, for example introduced a soy sauce with limited and high-end ingredients named “Followed the Law of Nature” in China, while the US saw Bertolli’s launch of an entire organic pasta sauce portfolio and “Simply Avocado”
dips by Wholly Guacamole- a ready-to-eat format of avocados without any artificial ingredients.
Dr. Oetker’s new Funfoods Zero0Fat Dressings offer a healthy alternative of typical Western dressings, such as 1000 Island dressing or Honey-Mustard to consumers in India. The company is thereby taking advantage of growing demand for convenient ready-made products with reduced fat and calorie contents and a growing appreciation of Western flavours.
Claudia Lauener Hofer, Sustainability Director, Frutco AG (Switzerland)
Turning waste-like
material, such as fruit and
vegetable peels, into real high
quality food.
What to invest in?
C
OO
KIN
G IN
GR
EDIE
NTS
125

Expansion through acquisition In the US, Campbell Soup Co. completed its acquisition of Pacific Foods of Oregon Inc. at the end of 2017, for US$700 million. Pacific Foods is a manufacturer of mainly organic soups and broths. Campbell, a company not especially known for natural and organic products, seems to have made a wise decision by incorporating an organic brand into its portfolio. As organic products continue to thrive in the US, it makes sense that Campbell would try to take advantage of that growth.
In Italy, Consorzio Casalasco del Pomodoro, a leading Italian company in the production and processing of industrial tomatoes, acquired a majority share of brand De Rica from Generale Conserve. Aiming to become the Italian reference company in the canned tomato sector.
New regulations come into beingThe Packaged Food market, generally including Cooking Ingredients, witnessed a wave of new regulations in 2018. In Italy, new labelling regulations came into force on 5th April 2018, requiring all packaged food to carry the name and address of the manufacturer or packaging plant. This, in a country like Italy, benefits local manufacturers of cooking sauces, bearing in mind that Italian consumers favour and look for tomato-based products that are made with local ingredients. Meanwhile in Canada, pressure is mounting over health-related issues, forcing clear front-pack labelling highlighting products that are high in saturated fat, sugar and sodium.
Similarly, governments in the Middle East and Africa saw changes relating to Value Added Tax (VAT), specifically the Gulf States and South Africa. . The Gulf States imposed VAT on most commodities and services, including Cooking Ingredients, for the first time at the beginning of 2018. In Saudi Arabia and the UAE, VAT of close to 5% saw consumers respond to rising prices by seeking out the best value for money and cutting back on non-essential areas and products. Meanwhile, South African consumers saw VAT increase by 1%, the first rise since 1994.
New flavour evolutionsWhile the Westernisation trend is not new; it is still growing and impacting consumption preferences in regions such as Asia Pacific, Middle East and Africa, resulting in diversification in flavour offerings in cooking sauces as well as soups.
Meanwhile, in developed markets such as Europe and the US, ethnic and foreign sauces are seen as fashionable. The ongoing popularisation of ethnic products, such as fish sauce, oyster sauce and soy sauce are driven by the success of Asian foodservice establishments. In the US, for example, Kraft Heinz partnered with restaurant group Momofuku to launch a new line of Korean chilli sauce called Ssäm Sauce. Soup flavours are also evolving beyond mainstream ethnic, from Thai to Persian.
Premiumisation gains ground Across developed markets, maturity is one of the major obstacles to growth, forcing manufacturers to develop new products, which offer additional consumer benefits in terms of health, taste or convenience. In this regard, using locally sourced or organic ingredients has been one of the strategies most applied by manufacturers to position their products in the premium segment, thereby meeting consumer demand for quality.
Natural and free-from, are seeing growing demand, aligning with the increasing healthy living trend The increasing global buzz about eating healthy food, supported by the media and official authorities, has led to high consumer awareness of additives and ingredients that could have a negative impact on health. This led manufacturers such as Unilever to reformulate existing brands, such as Knorr, using natural ingredients and removing additives.
Market Trends and Drivers

Competitive LandscapePrivate label dominates cooking ingredients in 2018, accounting for 12% of overall sales within the category.
The Cooking Ingredients industry is dominated by internationally renowned brands, offered by global giants, such as Unilever Group, Kraft Heinz Co and Nestlé SA. All three companies have broad and constantly updated product portfolios, usually in line with the latest trends and developments. Knorr is Unilever’s biggest brand and has a large range of sauces, dressings and condiments as well as soups. The brand is positioned within typical convenience categories and one of Unilever’s Sustainable Living brands, meaning that much innovation is focused on natural and ethical products. Knorr is thereby benefiting from two global trends. The brand is also benefiting from local innovation and incorporation of regional tastes, preferences and ingredients. A similar strategy is followed by Kraft Heinz, which is specifically strong within sauces, dressing and condiments and Nestlé with its’ Maggi brand.
Exhibit 42 - Global Company Shares 2018 – Cooking Ingredients
Rank Company Global Market Share
1 Unilever Group 6.39%
2 Kraft Heinz Co 4.46%
3 Nestlé SA 2.77%
4 McCormick & Co Inc 2.67%
5 Campbell Soup Co 2.63%
6 Ferrero & related parties 1.54%
7 Ajinomoto Co Inc 1.33%
8 Kikkoman Corp 1.01%
9 JM Smucker Co, The 0.98%
10 Kewpie Corp 0.93%
11 Private Label 11.55%
12 Others 63.75%
Source: Euromonitor International analysis from Passport
Voice of the Industry
The cost of input/
raw material is the
number one issue across
“Ingredients”, “Meat &
Poultry”, and “Seafood”
categories.
C
OO
KIN
G IN
GR
EDIE
NTS
127

Distribution LandscapeConvenience and value are two of the most important factors that guide consumer decision-making regarding channels. As a result, supermarkets/hypermarkets, which offer a wide selection of products and one-stop shopping convenience at the lowest prices, remain the largest channels for Cooking Ingredients globally, with a value share of 58.9% in 2018.
Supermarkets/hypermarkets led sales of Cooking Ingredients across the majority of regions in 2018, followed by traditional grocery retailers. Value share was highest in Australasia (83.3%), followed by North America (75.8%), Europe (59.5%), Latin America (54.1%), Asia Pacific (52.1%) and lastly Middle East and Africa (44.7%).
The only exception was the Sub-Saharan Africa region, where traditional grocery retailers accounted for a larger value share than supermarkets/hypermarkets, at 65.7% compared to 28.0%.
Proximity is crucial for independent small grocers, which play a vital role in many emerging markets, as many shoppers lack the means of transportation to reach modern shopping centres. This proximity provides unparalleled convenience, a factor that is becoming increasingly important with the growth of urbanisation. The global urban population grew by nearly 2.0% over 2013-2018 while the rural population stagnated.
Despite a majority value share, supermarkets/hypermarkets lost share to non-grocery retailers over the review period, specifically online channels. Frequent modern shoppers have internet access, credit cards and bank accounts and are gradually shifting and favouring the convenience of online shopping.
E-commerce is having a strong impact on nearly all retail areas, with Cooking Ingredients fast becoming
no exception. Every day, more and more consumers are shopping for their groceries online, with this trend expected to accelerate in the coming years. Internet retailing is therefore, among the fastest growing channels globally, cannibalising sales from store-based retailers, and forcing supermarkets/hypermarkets to find ways to adapt to the dramatic rise of e-commerce. As a result, click-and-collect models that blend online orders with in-store pick-up have grown rapidly as a convenient alternative to home delivery.
The success of discounters and convenience stores also showcases how consumer preferences are shifting in favour of smaller format stores that compete primarily on the basis of proximity. Quick, fill-in shopping trips save consumers time in their increasingly busy routines.
Leading regional grocery retailers include Seven & Holdings Co. Ltd in Asia Pacific, Woolworths Ltd in Australia and Wesfarmers Ltd in Australasia, Schwarz Beteiligroup Gmbh and Aldi Group in Europe, Walmart in North and Latin America, as well as Shoprite Holdings Ltd and Carrefour SA in the Middle East and Africa.
Exhibit 43 - Global Cooking Ingredients Distribution by Channel (2012-2018)
100%
90%
80%
70%
60%
50%
40%
30%
20%
10%
0%
Internet RetailingTraditional Grocery Retailers Others
2018 2017 2016 2015 2014 2013 2012
Convenience Stores andForecourt Retailers
Supermarkets/HypermarketsDiscounters
So
urc
e: E
uro
mo
nit
or
Inte
rnati
on
al a
naly
sis
fro
m P
ass
po
rt

By 2030 70% of the global household will live in urban areas, while 20% of it will be single household. Population change will lead to a shift in consumers’ lifestyle; which is anticipated to further fuel demand for convenient, easy-to-prepare and cook meals,
nonetheless addressing the rising nutritious demands. Consequently, the changing lifestyle is undoubtedly presenting a number of challenges and opportunities for all stakeholders of Cooking Ingredients.
Challenges and Opportunities
Increasing raw material costs
High prices remain a barrier
Changing lifestyles fundamentally change
eating habits
Rising health-awareness/anti-sugar
movement
Shift towards premiumisation and
nutritional content
Growing popularity of international cuisines
Adapting to shift to e-commerce
Key: Moons indicate the level of direct impact on each stakeholder
The fuller the moon, the higher the direct impact:
Low _________________________> high
Supplier/farmer ManufacturerWholesale / import - exporter
Retailer
C
OO
KIN
G IN
GR
EDIE
NTS
129

Ingredients Sector
CONFIDENCE INDEXCurrent performance satisfaction vs. expected growth
Satisfaction - current performance Vs Activity
Confidence - Over the next 12 months Vs Activity
Confidence - Over the next 3 years Vs Sector
Negative Neutral Positive
Voice of the Industry

Main Challenge
Manufacturer
Volatile commodity prices
Growing sustainable production pressures
Growing competition from Private Label products
Higher regulatory control & production costs
1
2
3
4
Key TrendsKey Trends Vs Activity Ingredients
Organic & Free-from 60.50%
Private Label 29.80%
Ethical living: Eco-friendly, Halal and Fair trade 29.00%
Plastic bans on packaging, retail and foodservice 23.40%
Premium & Gourmet 18.50%
Food waste prevention 18.50%
Elevated convenience, 'grab-and-go' 18.50%
Honest advertising & labeling 17.70%
Fortified & Functional 15.30%
Farm to fork sustainability 13.70%
Westernization & diversification of diet 9.70%
Animal welfare 2.40%
Main growth channel in the next 12 months by sectorProduct portfolio and strategy Vs Sector Ingredients
Direct Sales to customer 43.50%
Research & Development 31.30%
Contract Manufacturing 27.00%
Private Label 20.90%
Current Channels 16.50%
Mergers & Acquisitions 15.70%
Own ecommerce 13.00%
Third-party ecommerce 10.40%
Other 4.30%
Omni-channel retailing 2.60%
C
OO
KIN
G IN
GR
EDIE
NTS
Voice of the Industry
131131

Top growth strategy for the next 3 years by sector
Ingredients
Venture into new market Grow product portfolio Reduce cost / Enter value-for-money category
Explore new F&B category
Critical Factor - Ingredients
Consumer attention - Ingredients
27%
26%
22%
26%
21%
16%
15%
12%
20%
38%
35%
33%
21%
26%
29%
23%
26%
13%
0% 10% 20% 30% 40% 50% 60% 70%
Input/raw material costs
Selling price (strong competition)
Tax, regulatory, bureaucratic aspects
Payment timeline/difficulty in getting paid
Cost of capital/access to credit
Workforce cost
Shortage of professional education / training
Fast-changing sector
Patents and trademarks/counterfeiting problem
Critical factor - Ingredients
Extremely critical Fairly critical
10%
11%
18%
20%
12%
13%
28%
24%
22%
36%
46%
13%
22%
22%
21%
30%
33%
23%
31%
34%
32%
30%
0% 10% 20% 30% 40% 50% 60% 70% 80%
Vegan
Premium/gourmet
Organic Certified
Free-from
Sustainability
Private label
Halal Certified
Brand
Packaging
Price
Quality
Consumer attention - Ingredients
Extreme impact Significant impact
35.1%
24.6%
18.4%
21.9%
Voice of the Industry

Confectionery, Snacks and
Ready - to - Eat Industry

Confectionery, Snacks and Ready-to-Eat Industry-At a Glance
Asia Pacific Australasia Europe Latin AmericaMiddle
East & North Africa
North America
Sub-Saharan Africa
Consumer spending on this category as % of total F&B
4.6% 13.3% 10.8% 7.6% 6.3% 14.6% 2.4%
Key growth markets for this category(2013-2018)
NepalBangladeshIndiaCambodiaLaos
Papua New GuineaFijiNew CaledoniaFrench Poly-nesia
IcelandAlbaniaLithuaniaRomaniaEstonia
GuatemalaBoliviaCubaHaitiPanama
SyriaQatarBahrainUnited Arab EmiratesOman
USACanada
SudanEritreaGambiaBurundiSao Tomé e Príncipe
Key sub-categories*
Savoury Snacks (34.0%)Confection-ery (31.5%)
Confectionery (34.4%)Savoury Snacks (27.6%)Ice Cream and Frozen Des-serts (19.5%)
Confectionery (46.4%)Savoury Snacks (21.9%)
Confectionery (33.8%)Savoury Snacks (27.1%)Sweet Biscuits, Snack Bars and Fruit Snacks (25.1%)
Confectionery (34.0%)Savoury Snacks (25.5%)Sweet Biscuits, Snack Bars and Fruit Snacks (20.6%)
Savoury Snacks (39.9%)Confectionery (29.5%)
Confectionery (41.2%)Sweet Bis-cuits, Snack Bars and Fruit Snacks (24.6%)
Key channels**
Supermarkets/Hypermarkets (39.0%)Traditional Gro-cery Retailers (32.1%)
Supermarkets / Hypermarkets (65.7%)Convenience Stores and Forecourt Re-tailers (14.0%)
Supermarkets / Hypermarkets (47.1%)Traditional Gro-cery Retailers (19.0%)
Traditional Gro-cery Retailers (56.4%)Supermarkets / Hypermarkets (27.6%)
Traditional Gro-cery Retailers (48.4%)Supermarkets / Hypermarkets (37.7%)
Supermarkets / Hypermarkets (51.6%)Others (22.9%)
Traditional Grocery Re-tailers (47.8%)Supermarkets / Hypermar-kets (33.9%)
Fastest growth channels (CAGR 2013-18)
Internet Retail-ing (34.2%)Discounters (11.7%)
Internet Retail-ing (14.0%)Discounters (8.9%)
Internet Retail-ing (9.5%)Discounters (4.3%)
Internet Retail-ing (22.6%)Convenience Stores and Forecourt Re-tailers (9.5%)
Internet Retail-ing (35.4%)Discounters (11.4%)
Internet Retail-ing (20.5%)Discounters (5.2%)
Internet Retail-ing (23.0%)Discounters (13.6%)
Slowest growth chan-nels(CAGR 2013-18)
Others (2.1%)Supermarkets / Hypermar-kets (3.2%)
Others (0.8%)Traditional Gro-cery Retailers (1.8%)
Traditional Gro-cery Retailers (1.0%)Others (1.6%)
Others (6.6%)Supermarkets / Hypermarkets (7.6%)
Others (4.7%)Convenience Stores and Forecourt Re-tailers (7.3%)
Traditional Gro-cery Retailers (1.7%)Supermarkets / Hypermarkets (2.1%)Others (2.4%)
Convenience Stores and Forecourt Re-tailers (10.5%)Supermarkets / Hypermar-kets (10.7%)

The fastest growing region is Sub-Saharan Africa, with a CAGR of 3.7% expected for the 2018 to 2023 period, to reach a market size of US$11,166 million. The slowest growing region is Europe, with a CAGR of 1.4% expected for the same period, rising from US$163,254 million in 2018, to US$174,733 million in 2023.
Being the smallest of all regions in market size, Sub-Saharan Africa’s demand for Ice Cream and Frozen Desserts, as well as Savoury Snacks, is growing at a rapid rate. Urbanisation as well as exposure to new products is driving growth of this category, with the Sub-Saharan African population benefiting from rising disposable incomes. South Africa is by far the largest consumer in the region, and with the increase in VAT of 1% as well as inflation (around 4% in 2018), prices of Confectionery, Snacks & Ready-to-eat products increased by approximately 7%, driving up market
value for the region.
Latin-American countries are reducing their intake of products in this category. An increase in health awareness and an economic recession in several countries in the region are driving consumers further away from snacks, and shifting their consumption towards cheaper and healthier alternatives. With the alarming rise of obesity in the region, Latin American governments are urging populations to embrace healthier lifestyles, exercise regularly, and consume more fruits and vegetables, and fewer products with high sugar and calorie contents. These trends are expected to continue their effect on the market in the forecast period, as consumers shift to maintaining healthier lifestyles.
In most developed countries, sales of Confectionery,
Confectionery, Snacks & Ready-to-eat is among the largest categories within Packaged Food, reaching a global market size of US$548.8 billion in 2018, with a CAGR of 1.5% for the 2013 to 2018 period. It is expected to reach US$601.3 billion by 2023, with a CAGR of 2.4% over 2018 to 2023. Europe led sales of Confectionery, Snacks & Ready-to-eat products, with a 30.4% market share in 2018, with Asia Pacific ranking second with 25.3%, and North America with 24.4% in third place.
Exhibit 44 - Confectionery, Snacks and Ready-to-Eat sales in 2018, 2023 and & CAGR 2018-2023 US$ billion
Market Size and Potential
1.7% 142.2bn
130.8bn 1.4% 174.7bn
163.3bn
2.5% 63.8bn
56.3bn
3.7% 11.2bn
9.3bn
3.3% 34.5bn
29.2bn
3.5% 161.2bn
135.7bn
2.4% 13.8bn
12.2bn
Key: Inner circles indicate the Confectionery, Snacks and Ready-to-Eat category market size in 2018, outer circles indicate market size in 2023. The distance between the inner and outer circles indicates the size of the absolute growth
The Colour of the circles indicate the growth rate Fast Moderate Slow Static
Source: Euromonitor International analysis from Passport
C
ON
FEC
TIO
NER
Y, S
NA
CK
S &
REA
DY-
TO-E
AT
IND
UST
RY
C
ON
FEC
TIO
NER
Y, S
NA
CK
S &
REA
DY-
TO-E
AT
IND
UST
RY
135

Snacks & Ready-to-eat products are either stagnating or growing at a very slow rate. Europeans have been adopting healthier lifestyles for a few years now, dragging the already mature category into a declining growth cycle. Only healthier savoury snack options, low in sugar, with a low caloric count, are on the rise, and often, even these are being replaced with fruit and vegetables. Consumers will not compromise on taste and still want a choice between healthy products and the occasional indulgence. Unique tastes and adventurous flavours help to create a whole eating experience; as a result, shelves are getting busy with Mexican flavours, spicy tastes and Asian influences that are expected to continue flourishing in the coming years. The most successful categories in Savoury Snacks in 2018 were those that, in addition to the snacking trend, were also able to tap into the health and wellness trend. For example, Graze is skyrocketing in the UK. The use of natural ingredients and claims around the high natural plant-based protein
content is enjoying massive growth and there are no signs of this slowing down any time soon. In particular, Graze’s Veggie Protein, made of chickpeas and edamame, is one of its most successful variants.
In North America, the category shows signs of slowing down, with a CAGR of 1.7% for the 2018 to 2023 period. Savoury Snacks is the fastest growing category, as it is the one offering the most variety of ‘healthier’ alternatives, using unrefined carbohydrates and no added sugar, yet still coming up with a tasty product. North American consumers, especially the younger demographic, are shifting from regular meals to meal/snack mixes. As local consumers are leading increasingly busy lifestyles, the demand for on-the-go consumption and convenience, in terms of time, energy and skills needed for food preparation, is on the rise. This, combined with rising health consciousness, has led to a rapidly rising focus on healthy snacks that are convenient to consume.
Australasia is also witnessing declining growth for the category, with the exception of Ice
Cream and Frozen Desserts, and Savoury Snacks. Cobranding strategies have been at the forefront of product and marketing
innovations in the Ice Cream category. In 2016, Peters collaborated with Nestlé and
introduced a range of ice cream flavours featuring iconic sweets and chocolates. The success of which has encouraged high-equity brands to
continuously collaborate with each other in Australia.
But the health and wellness trend is also impacting the category, and free from products are becoming more mainstream. In early 2018, Over
the Moo expanded its gluten-free range with two new flavours: Dream Team Cookies N Cream and Mint to
Be, thus encouraging smaller players to enter the market with only healthy, free from alternatives.
Sales in Middle East and North Africa are led by Egypt and Saudi Arabia, the two largest markets for this category. Sweet Biscuits are widely consumed in Egypt, and double-digit growth over the 2013 to 2018 period is expected to continue, making companies such as Nestle Egypt
and PepsiCo Egypt consider adding products in this category to their portfolios. However, it seems that Sweet Biscuits is the only category within Confectionery, Snacks &

Ready-to-Eat products that is growing in the country. All other sub-categories are showing a hard decline in sales due to the devaluation of the Egyptian pound, making imported raw materials costlier to local producers and imported finished products expensive for the average consumer. Saudi Arabia, on the other hand, shows strong market growth. Ice Cream & Frozen Desserts are growing at double digit rates, with companies such as Baskin Robins and Marble Slabs opening their doors in the Kingdom. Most categories in Snacks are suffering after the introduction of 5% VAT, with ice cream the only category that continues to grow unabated.
Asia Pacific is a very large market, with countries such as China and Japan leading that growth, as the two largest consumers of Confectionery, Snacks & Ready-to-Eat products in the region. China’s consumption of Savoury Snacks and Sweet Biscuits, Snack Bars and Fruit Snacks showed strong growth in the review period of 2013 to 2018. The emergence of yam chips brought new vigour to the category, shifting the unhealthy image fried snacks have in the country, to a more positive one, showing that healthy products can provide tasty flavours. In Japan, another negative concept is being turned to positive, impacting sales of snacks. Although snacking used to be considered a bad habit, leading to weight gain and unhealthy behaviour, modern consumers now have a positive perspective on it. Due to the aggressive promotion of healthy snacking by snack manufacturers in Japan, consumers are aware that being hungry can cause blood sugar levels to soar. As a result, a positive performance was seen in most Sweet Biscuits, Snacks Bars and Fruits Snacks categories.
China and India impact the Asian Pacific region strongly, China with premiumisation, and India with an average increase in prices of 6% to 7%. Considering they are the two largest markets in the region, followed by Japan and Indonesia, double-digit growth in the Indian market, and the positive growth in all sub categories in China, drove growth of the Asia Pacific market.
Price increases in Brazil are saving the region from an even stronger decline in the market for Confectionery, Snacks & Ready-to-eat products in Latin America. Being by far the largest market, the price increases gave the country, and region, a positive value growth rate despite declining in volume terms.
The UK is the largest market in Europe, followed by Germany, Russia and France. The UK market has, however, declined over the period between 2013 and 2018 due to growing health awareness and the demonisation of sugar. In return, industry players have started offering low and no-sugar alternatives. For example, sugar confectionery manufacturer Tangerine reformulated its Wham and Fruit Salad chews to include real fruit juice to give its products a more
“natural” appeal in 2017. Similarly, the leader Mondelez re-vamped its Maynards Bassetts brand by switching to natural flavours and colours and pledging to reduce salt and saturated fat by 10% and increasing portion control options by 25% by 2020.
As for Middle Eastern and North African countries, most have a large variety of traditional goods in this category. However, Snacks & Ready-to-Eat products are not traditional to the region, making them a very attractive market for many foreign brands. Being a niche market, fuelled by an interest in international goods and brands, these categories are expected to continue growing at a moderate to fast rate in this region.
Innovation within the confectionary, snacks and ready-to-eat segment is key at this stage, as the industry is specifically sensitive to anti-sugar movements and trends towards clean eating and healthy and wholesome food choices in many countries.
Many companies all over the world therefore choose to re-position their portfolios as a healthier variant in comparison to former snacking options. PepsiCo for example revamped an established product portfolio under a new line: Frito-Lay’s new Simply Line offers customers organic and non-GMO versions of favourites like Dorito’s and Cheetos in the US. The company also introduced healthier products, such as the new multi-grain variant with low salt under the Kurkure brand in India. Other companies choose to acquire established smaller brand with a healthy portfolio.
Another interesting development within snacks all over the world are options based on supposedly healthier ingredients, such as snacks based on vegetables, sweet potatoes or chickpeas. According to PepsiCo this trend might soon incorporate new protein sources. The company posted an innovation request on a business community platform for plant-, mycoprotein- (funghi) and insect-based proteins to incorporate into their products.
Another field for innovation are product types advertised as a special treat and premium indulgence. This includes the incorporation of new flavours, many of which are adult-only or inspired by flavours from around the world and offered as special editions. In Germany, Aldi launched a limited edition of Länder-chips, offering varieties and ingredients from around the world, while Ludwig Schokolade introduced alcohol-infused chocolate specialties under its’ Trumpf brand in the context of the 2018 World Cup.
C
ON
FEC
TIO
NER
Y, S
NA
CK
S &
REA
DY-
TO-E
AT
IND
UST
RY
137

Innovation in flavours The demand for something different is on the rise, and with a category as mature as Confectionery, Snacks & Ready-to-eat, premiumisation and differentiation are the way to grow. Consumers worldwide are demanding new, bold flavours, and different presentations, as the maturity of the category, even with the varieties it already has to offer, falls short of satisfying that demand. Several companies have found that testing new mixes of flavours, ingredients, and packaging is a potential growth opportunity, and a way to improve sales globally. For example, in 2018, Lay’s introduced its “Tastes of America” flavours, going from Thai Sweet Chilli to Chesapeake Bay Crab Spice. In 2019, African ingredients are expected to make their way into the snacking industry, with bold spices and superfoods, such as harissa, dukkah and tiger nuts.
AdultificationFrom wine and ham flavoured chips, to rosé sorbet, adult only flavours are making their way into the Confectionery, Snacks & Ready-to-eat industry. Patatas Torres, a Spanish chips producer, introduced a sparkling wine flavoured potato chip, while Haagen
Dazs shook the market with its Spirits line of ice cream, with flavours such as Vodka Key Lime Pie, Whisky Chocolate Truffle and Rum Vanilla Caramel Blondie. Even though this trend is relatively new, it is expected to continue growing at a rapid rate, especially as these products have been traditionally targeted children.
Healthy, free-from and ingredient swaps are on the rise, driving demand for label transparencyThe mindful eating trend that started a few years ago in developed countries has now hit all countries globally. Free-from, and other health related labelling now appear on most snacks worldwide, from ingredient swaps to the more typical Non-GMO, to satisfy the health concerns of mindful eaters. Consumers are watching what they eat, counting calories, reducing sodium and sugar intake, and demanding to see these health facts on the packaging of products they purchase. This trend not only affect snacks, but all products under the Confectionery, Snacks & Ready-to-eat category. Ice cream alternatives such as frozen yoghurt, dairy-free and gluten-free are making their way into supermarket freezers, giving consumers healthier options using ingredient swaps. Confectionery is also being affected, with dark chocolate on the rise due to its health benefits.
Market Trends and Drivers

Competitive LandscapePepsiCo and Mondelez International Inc retained neck-to-neck positions, with both accounting for 7% of global value sales of Confectionary, Snacks and Ready-to-Eat.
The whole category remained in the hands of multinationals and saw a comparatively low share of private label sales, which accounted for merely 8% in 2018. Mondelez and PepsiCo manage to incorporate local tastes and preferences into their portfolios, while usually being seen as qualitatively superior to local brands. Even in Europe where private label is often seen as the superior choice, consumers often prefer branded products in this category. Pressure from private label therefore remains limited. A threat for both could be the growing demand for healthier options and a trend towards limited premium indulgence. Smaller local players could thereby take shares form PepsiCo, while brands like Lindt and Ferrero already started to take shares from Mondelez within chocolate confectionary.
Exhibit 45 - Global Company Shares 2018 – Confectionery, Snacks & Ready-to-Eat
Rank Company Global Market Share
1 PepsiCo Inc 7.09%
2 Mondelez International Inc 6.99%
3 Mars Inc 4.86%
4 Unilever Group 3.88%
5 Nestlé SA 3.56%
6 Ferrero & related parties 2.63%
7 Hershey Co, The 1.84%
8 Kellogg Co 1.39%
9 General Mills Inc 1.29%
10 Perfetti Van Melle Group 1.10%
11 Private Label 8.01%
12 Others 57.35%
Source: Euromonitor International analysis from Passport
Voice of the Industry
Unlike any other
category, the main
challenge for “Confectionery,
Snacks & Ready-to-Eat” is
the higher regulatory control
& production costs. All other
sectors are more impacted
by volatile commodity
prices.
C
ON
FEC
TIO
NER
Y, S
NA
CK
S &
REA
DY-
TO-E
AT
IND
UST
RY
139

Supermarkets and hypermarkets are the leading channel for Confectionery, Snacks & Ready-to-eat products, with more than 43.7% of global sales of the category in 2018. Offering more shelf space, supermarkets and hypermarkets offer a wider variety to choose from than traditional grocery retailers, or convenience stores. Furthermore, consumers tend to shop for all their groceries in one place, making it the first choice for most purchases in the Food & Beverage category.
Supermarkets and hypermarkets tend to lead sales of Confectionery, Snacks & Ready-to-eat in developed markets. The highest participation for this channel was in Australasia, with 65.7% of category sales, followed by North America and Europe, where it represented 51.6% and 47.1% of category sales respectively. It also led sales in Asia Pacific, with 39%, followed closely by traditional grocery stores which had a 32.1% share of the market.
In developing markets, category sales were led by traditional grocery retailers. This channel represented 56.4% of sales in Latin America, followed by the Middle East and North Africa, with 48.4%, and Sub-Saharan Africa, with 47.8%.
Supermarkets and hypermarkets rely strongly on urbanization urbanisation to thrive. In emerging developing countries, most of the population remains rural, giving traditional grocery retailers an advantage over their larger competitors. Consumers cannot afford to travel to the nearest city to purchase in supermarkets and hypermarkets, and the latter cannot grow in rural areas, as the population is more scattered.
In developed countries, however, supermarkets and hypermarkets are the first choice for consumers, as
they offer a wide variety of products and brands, and competitive prices to dominate the market.
Although supermarkets and hypermarket dominate sales of Confectionery, Snacks & Ready-to-eat globally, this channel is also the most mature, with a CAGR of only 3.7% over the 2013-2018 period. In developed countries, the markets are saturated with different supermarket and hypermarket chains competing on price, with no further room to grow. The key for this channel to maintain its growth is to penetrate emerging countries and take advantage of higher rates of urbanisation in large cities and fast-growing towns.
The fastest growing channel globally is internet retailing, albeit from a very small base. Even though it only represents 2.7% of category sales globally, this category’s CAGR for the review period was 22.5%. With more and more stores entering this channel every year and constant advances in technology, it is the most promising channel for investment in the coming years.
Distribution Landscape
Exhibit 46 - Global Confectionery, Snacks & Ready-to-Eat by Channel (2012-2018)
100%
90%
80%
70%
60%
50%
40%
30%
20%
10%
0%
Internet RetailingTraditional Grocery Retailers Others
2018 2017 2016 2015 2014 2013 2012
Convenience Stores andForecourt Retailers
Supermarkets/HypermarketsDiscounters
So
urc
e: E
uro
mo
nit
or
Inte
rnati
on
al a
naly
sis
fro
m P
ass
po
rt

Challenges and Opportunities
Chal lenges
Increasing cost of ingredients
Increase in minimum salary in many
developing countries
Saturated mature market for
Confectionery, Snacks & Ready-to-eat in
developed markets
Increase or introduction of VAT in
several coun-tries
Price pressure on traditional grocery
retailers from supermarkets/
hypermarkets and dis-counters
Price pressure on small manufacturers
from large-scale manufacturers
Health trends leading consumers away from
sugar, sodium and carbohydrates
This section will provide a quick snapshot of the different challenges and opportunities in the industry and how they are positioned across different industry stakeholders. Risks/challenges and opportunities are assessed to see if they are positive or negative for different stakeholders in the value chain.
Key: Moons indicate the level of direct impact on each stakeholder
The fuller the moon, the higher the direct impact:
Low _________________________> high
Supplier/farmer ManufacturerWholesale / import - exporter
Retailer
C
ON
FEC
TIO
NER
Y, S
NA
CK
S &
REA
DY-
TO-E
AT
IND
UST
RY
141

Opportunities
Growth of internet retailing
Innovation in flavour trends
Growth of alternatives for healthy swaps
Increased international trade as consumers
demand more variety and brands
Key: Moons indicate the level of direct impact on each stakeholder
The fuller the moon, the higher the direct impact:
Low _________________________> high
Supplier/farmer ManufacturerWholesale / import - exporter
Retailer

Confectionery, Snacks, Ready -to-Eat
CONFIDENCE INDEXCurrent performance satisfaction vs. expected growth
Satisfaction - current performance Vs Activity
Confidence - Over the next 12 months Vs Activity
Confidence - Over the next 3 years Vs Sector
Negative Neutral Positive
C
ON
FEC
TIO
NER
Y, S
NA
CK
S &
REA
DY-
TO-E
AT
IND
UST
RY
Voice of the Industry
143143

Main Challenge
Manufacturer
Higher regulatory control & production costs
Volatile commodity prices
Technology/Automation integrations
Adapting to new retail and distribution models
1
2
3
4
Key TrendsKey Trends Vs Activity Confectionery, Snacks & Ready-to-Eat
Organic & Free-from 56.00%
Private Label 30.50%
Ethical living: Eco-friendly, Halal and Fair trade 25.90%
Plastic bans on packaging, retail and foodservice 24.80%
Food waste prevention 24.80%
Elevated convenience, 'grab-and-go' 23.40%
Premium & Gourmet 22.70%
Honest advertising & labeling 20.90%
Westernization & diversification of diet 15.60%
Farm to fork sustainability 12.10%
Fortified & Functional 9.60%
Animal welfare 1.80%
Main growth channel in the next 12 months by sectorProduct portfolio and strategy Vs Sector Confectionery, Snacks & Ready-to-Eat
Direct Sales to customer 41.60%
Research & Development 22.90%
Private Label 22.50%
Contract Manufacturing 18.30%
Current Channels 17.20%
Mergers & Acquisitions 13.40%
Third-party ecommerce 11.80%
Own ecommerce 11.50%
Omni-channel retailing 9.90%
Other 3.40%
Voice of the Industry

Top growth strategy for the next 3 years by sector
Confectionery, Snacks & Ready-to-Eat
Venture into new market Grow product portfolio Reduce cost / Enter value-for-money category
Explore new F&B category
Critical Factor - Confectionery, Snacks & Ready-to-Eat
Consumer attention - Confectionery, Snacks & Ready-to-Eat
30%
23%
23%
23%
18%
17%
13%
10%
9%
32%
31%
30%
30%
27%
27%
28%
25%
20%
0% 10% 20% 30% 40% 50% 60% 70%
Selling price (strong competition)
Input/raw material costs
Payment timeline/difficulty in getting paid
Tax, regulatory, bureaucratic aspects
Workforce cost
Cost of capital/access to credit
Shortage of professional education / training
Fast-changing sector
Patents and trademarks/counterfeiting problem
Critical factor - Confectionery, Snacks & Ready-to-Eat
Extremely critical Fairly critical
4%
8%
9%
14%
14%
13%
21%
21%
22%
44%
48%
21%
27%
31%
26%
29%
30%
25%
46%
49%
35%
39%
0% 10% 20% 30% 40% 50% 60% 70% 80% 90% 100%
Vegan
Premium/gourmet
Free-from
Private label
Sustainability
Organic Certified
Halal Certified
Packaging
Brand
Price
Quality
Consumer attention - Confectionery, Snacks & Ready-to-Eat
Extreme impact Significant impact
36.8%
27.6
17.2%
18.4%
C
ON
FEC
TIO
NER
Y, S
NA
CK
S &
REA
DY-
TO-E
AT
IND
UST
RY
Voice of the Industry
145145

CATEGORYDEFINITIONS
BeveragesHot Drinks
This is the aggregation of Coffee, Tea, and Other Hot Drinks.
This is the aggregation of Coffee, Tea, and Other Hot Drinks:
CoffeeThis is the aggregation of fresh coffee and instant coffee. Please note that foodservice sales of coffee are volumes sold to the on-trade (foodservice) sector and not those sold to the consumer.
TeaThis is the aggregation of Black Tea, Fruit/Herbal Tea, Green Tea, Instant Tea, and Other Tea.
Other Hot DrinksThis is the aggregation of Flavoured Powder Drinks and Other Plant-based Powder Drinks. Products can be served hot or cold, and can be mixed with water, milk, or other liquids. Bottled, ready-to-drink flavoured milk drinks are NOT included here and are included in Passport Packaged Food.
Soft Drinks
This is the aggregation of the following categories; Carbonates; Fruit/vegetable juice; Bottled water; Functional drinks; Concentrates; RTD tea; RTD coffee and Asian speciality drinks.
CarbonatesSweetened, non-alcoholic drinks containing carbon dioxide are included here. All carbonated products containing fruit juice (“sparkling juices”) are included here, unless they are tea-based (these are included in carbonated RTD tea) or carbonated Energy drinks, which are included in Energy Drinks. Carbonated
bottled water is also excluded. Carbonates are an aggregation of cola carbonates and non-cola carbonates, whether regular or low calorie. Euromonitor International includes both naturally and artificially-sweetened carbonates.
JuiceThis category covers all still packaged juice obtained from fruits or vegetables by mechanical processes, reconstituted or fresh, often including pulp or fruit/vegetable puree. All unpackaged juices are excluded. Only still drinks are included here. Carbonated varieties are included non-cola carbonates. Juice-flavoured milk drinks and fruit shakes which are primarily milk are excluded–these are instead tracked in Packaged Foods Dairy. However, if the juice component is greater, the product is to be excluded from Packaged Foods Dairy coverage and tracked under the relevant category (based on % juice content) within Soft Drinks juice. This sector is the aggregation of 100% juice, nectars (25-99% juice content), juice drinks (up to 24% juice content), and coconut & other plant waters.
Bottled Water
This category is the aggregation of still bottled water (spring, mineral & purified), carbonated bottled water (spring, mineral & purified), flavoured bottled water and functional bottled water. Bulk bottled water is split out separately. It is defined as packaged drinking water – purified, spring or mineral – that is packaged in a container of 8 litres or larger. The bulk bottled water data types apply to Still Bottled Water and Carbonated Bottled Water but do not apply to functional or flavoured bottled water. Bulk water is classified according to the new Bulk retail volume and Bulk retail value data type regardless of channel of sale: bulk water sold via
retail locations and bulk water delivered direct to a consumer’s home is included. Bulk water sold to institutions (offices, schools etc.) remains excluded.
RTD Coffee
Includes packaged ready-to-drink coffee, consumed either hot or cold, made using a base of either brewed coffee or coffee extract. Excludes all coffee flavoured milk drinks that primarily target children, or where coffee is one of a number of flavours within the brand range. Leading brands in off-trade volume include Georgia, Nescafé and Suntory Boss.
RTD Tea
This category includes all packaged products based on brewed tea or tea extract. May be sweetened or unsweetened, carbonated or still, with a wide variety of different flavourings. May contain juice.
Concentrates
This is the aggregation of liquid concentrates and powder concentrates.
Energy Drinks
These are functional drinks designed to boost energy levels. Often lightly carbonated, these contain high levels of caffeine and a number of added water-soluble vitamins, most often a selection of B vitamins including niacin, pantothenic acid, vitamin B6, and vitamin B12. Ingredients can also include amino acids such as taurine and glucuronolactone, as well as herbal products such as guarana and ginseng. Can be carbonated or still. Leading brands in off-trade volume include Red Bull, Monster and RockStar. Glucose-based energy beverages such as Lucozade Energy are included here.
Sports Drinks
The choice of sports drink usually depends on the provision of fluids, carbohydrates or both. Included into this subsector are isotonic, hypotonic and
Appendices

hypertonic sports drinks. Isotonic are products that replace lost body fluids, electrolytes (sodium, potassium and chlorides) and glucose in similar concentrations to existing body fluid without causing either swelling or shrinkage of cells. These products usually contain about 5-8% carbohydrate and are intended to be consumed during exercise and/or heat exposure. Hypotonic this product is a weaker solution than your body fluid. These drinks contain less carbohydrate and therefore have lower osmolality (fewer dissolved particles than blood). These drinks help the body to speed up water absorption and are best used when you need urgent fluid replacement, as in after exercise. These drinks are not the best for energy replacement. Hypertonic - this drink is a stronger solution than your body fluid. These drinks are designed to replace and maintain energy levels during exercise of at least one hour. They are absorbed slowly and therefore are not appropriate for fluid replacement. Leading brands in off-trade volume include Gatorade, Powerade and Aquarius.
Asian Speciality Drinks
This category includes all traditional Asian drinks not included in RTD tea or juice drinks, including products such as Bandung (rose syrup with milk), bird’s nest, tamarind juice, ginger, lemongrass, roselle, zalaka, jelly drinks including grass jelly (cincau), sugar cane, and vinegar drinks. Lactic acid drinks, such as Calpis, are included here. Drinks containing a limited amount of yogurt (generally 3% or less) such as Bikkle, are included here, though drinking yogurts such as Yakult are excluded. While both products are highly popular in markets like Japan, drinking yogurts will contain mostly yogurt with a very short shelf life (two weeks or less), while yogurt drinks will contain
less than 3% dairy and remain on the shelves for up to 9 months. All nut or pulse-based products, such as peanut milk, almond juice, or soy drinks are tracked in Non-Dairy Milk alternatives in Passport Packaged Food.
DairyThe Dairy category is an aggregation of Butter and Margarine; Cheese; Drinking Milk Products; Yoghurt and Sour Milk Products and Other Dairy:
Butter and Margarine
This is the aggregation of butter, cooking fats and margarine and spreads.
Cheese
This is the aggregation of processed and unprocessed cheese. Note: Non-dairy cheese substitutes are included in cheese, either as spreadable or unspreadable.
Drinking Milk Products
This is the aggregation of fresh/pasteurised milk, long-life/UHT milk, goat milk, flavoured milk drinks, non-dairy milk alternatives, powder milk and flavoured powder milk drinks.
Yoghurt and Sour Milk Products
This is the aggregation of yoghurt and sour milk drinks which include kefir, lassi, as well as butter milk and whey drinks.
Other Dairy
This is the aggregation of chilled and shelf stable desserts, chilled snacks, coffee whiteners, condensed/evaporated milk, cream, and fromage frais and quark.
Meat and PoultryThe Meat and Poultry category is an aggregation of Processed meat and Meat Substitutes:
Processed Meat
This is the aggregation of shelf stable meat, chilled processed meat and frozen processed meat.
Meat Substitutes
This is the aggregation of shelf stable meat substitutes, chilled meat substitutes and frozen meat substitutes, as well as free from meat soy-based ready meals and other ready meals.
SeafoodThe Seafood category is the aggregation of shelf stable seafood, chilled processed seafood and frozen processed seafood.
Pulses, Grains and CerealsThe Pulses, Grains & Cereals category is an aggregation of Breakfast Cereals and Rice, Pasta and Noodles:
Breakfast Cereals
This is the aggregation of ready-to-eat (RTE) and hot cereals.
Hot Cereals
Includes porridge and instant hot cereals e.g. oat, wheat, rice, etc. Instant hot cereals are defined by the fact that they can be made in a dish with added water or milk and can be microwaved. Porridge is generally made by using an oat based cereal cooked in milk or water. Only products to eat are included. Hot cereals beverages
01
A
PP
EN
DIC
ES
147

are excluded. Leading global brands include Quaker Oatmeal (PepsiCo), Quaker Avena (PepsiCo), Granvita (Productos Vida), Nestum (Cereal Partners).
RTE Cereals
Ready To Eat Cereals are the aggregation of children’s and family breakfast cereals
Rice, Pasta and Noodles
This is the aggregation of rice, noodles and pasta. Includes: Pre-packaged noodles. Excludes: Any noodles, pasta or rice bought loose, bulk and/or unpackaged. Excludes: Any noodle-based ready meals, which would be tracked under ready meals.
Fats and OilsThe Fats & Oils category is an aggregation of Olive Oil; Corn Oil; Palm Oil; Rapeseed Oil; Soy Oil; Sunflower Oil; Other Edible Oil:
Olive Oil
All varieties of packaged fluid/liquid olive oil, including virgin, extra virgin, “green” olive oil etc. Olive oil residue is excluded. Leading global brands include Carbonell (Sos Arana Alimentación), Bertolli (Unilever), Puget (Unilever), Komili (Unilever), Filippo Berio (SALOV), Carapelli (Carapelli Firenze SpA).
Corn Oil
For product category definitions please refer to the definitions section (can be found under the “Help” section on Passport) for the respective systems: Packaged Food, Fresh Food, Soft Drinks and Alcoholic Drinks.
Palm Oil
Oils which contains over 50% of palm oil.
Rapeseed Oil
Oils which contains over 50% of rapeseed oil. This includes both rapeseed and canola oil.
Soy Oil
Oils which contains over 50% of soy oil.
Sunflower Oil
Oils which contain at least 50% sunflower oil.
Other Edible Oil
This includes vegetable and seed oil such as coconut oil, grapeseed oil, groundnut oil, sesame oil and walnut oil, as well as blended oils which contain less than 50% of any single type of oils broken down into the researched oil categories.
Cooking IngredientsThe Cooking Ingredients category is an aggregation of Sauces, Dressings and Condiments; Soup and Sweet Spreads:
Sauces, Dressings and Condiments
This is the aggregation of tomato pastes and purees, bouillon/stock cubes, herbs and spices, monosodium glutamate (MSG), table sauces, pasta sauces, cooking sauces, dry sauces, ketchup, mayonnaise, mustard, oyster sauces, salad dressings, dips, pickled products, and other sauces, dressings and condiments.
Soup
This is the aggregation of shelf stable, dehydrated, instant, chilled and frozen soup.
Sweet Spreads
This is the aggregation of jams and preserves, honey, chocolate spreads, nut based spreads, and yeast based spreads.
Confectionery, Snacks aand Ready-to-EatThe Confectionery, Snacks and Ready-to-Eat category is an aggregation of Confectionery; Ice Cream and Frozen Desserts; Savoury Snacks and Sweet Biscuits, Snack Bars and Fruit Snacks:
Confectionery
This is the aggregation of chocolate confectionery, sugar confectionery and gum. Note: Retail sales measurements are confined to packaged sales. However, exceptions are made to seasonal chocolate, where unpackaged/artisanal sales are included. Pick ‘n’ mix sales are also included. Finally sales from chocolatiers, typically displayed loose and later packed (usually in boxes) are also included.
Ice Cream and Frozen Desserts
This is the aggregation of all sales of ice cream and frozen desserts
Savoury Snacks
This is the aggregation of fruit snacks, chips/crisps, extruded snacks, tortilla/corn chips, popcorn, pretzels, nuts and other sweet and savoury snacks
Sweet Biscuits, Snack Bars and Fruit Snacks
This is the aggregation of biscuits and snack bars.
Appendices

Regional Definitions
Asia PacificAfghanistan Mongolia
American Samoa Myanmar
Armenia Nauru
Azerbaijan Nepal
Bangladesh New Caledonia
Bhutan North Korea
Brunei Pakistan
Cambodia Papua New Guinea
China Philippines
Fiji Samoa
French Polynesia Singapore
Guam Solomon Islands
Hong Kong, China South Korea
India Sri Lanka
Indonesia Taiwan
Japan Tajikistan
Kazakhstan Thailand
Kiribati Tonga
Kyrgyzstan Turkmenistan
Laos Tuvalu
Macau Uzbekistan
Malaysia Vanuatu
Maldives Vietnam
EuropeAlbania Latvia
Andorra Liechtenstein
Austria Lithuania
Belarus Luxembourg
Belgium Macedonia
Bosnia-Herzegovina Malta
Bulgaria Moldova
Croatia Monaco
Cyprus Montenegro
Czech Republic Netherlands
Denmark Norway
Estonia Poland
Finland Portugal
France Romania
Georgia Russia
Germany Serbia
Gibraltar Slovakia
Greece Slovenia
Hungary Spain
Iceland Sweden
Ireland Switzerland
Italy Ukraine
Kosovo United KingdomAustralasiaAustralia New Zealand
World
Asia Pacific Middle East and North Africa
Australasia North America
Europe Sub-Saharan Africa
Latin America
R
EG
ION
AL
DE
FIN
ITIO
NS
149

Latin AmericaAnguilla Guadeloupe
Antigua Guatemala
Argentina Guyana
Aruba Haiti
Bahamas Honduras
Barbados Jamaica
Belize Martinique
Bermuda Mexico
Bolivia Nicaragua
Brazil Panama
British Virgin Islands Paraguay
Cayman Islands Peru
Chile Puerto Rico
Colombia Sint Maarten
Costa Rica St Kitts
Cuba St Lucia
Curacao St Vincent and the Grenadines
Dominica Suriname
Dominican Republic Trinidad and Tobago
Ecuador Uruguay
El Salvador US Virgin Islands
French Guiana Venezuela
Grenada
Middle East and North Africa Algeria Mauritania
Bahrain Morocco
Djibouti Oman
Egypt Qatar
Iran Saudi Arabia
Iraq Sudan
Israel Syria
Jordan Tunisia
Kuwait Turkey
Lebanon United Arab Emirates
Libya Yemen
Sub-Saharan AfricaAngola Madagascar
Benin Malawi
Botswana Mali
Burkina Faso Mauritius
Burundi Mozambique
Cameroon Namibia
Cape Verde Niger
Central African Republic Nigeria
Chad Réunion
Comoros Rwanda
Congo, Democratic Republic Sao Tomé e Príncipe
Congo-Brazzaville Senegal
Côte d'Ivoire Seychelles
Equatorial Guinea Sierra Leone
Eritrea Somalia
Ethiopia South Africa
Gabon South Sudan
Gambia Swaziland
Ghana Tanzania
Guinea Togo
Guinea-Bissau Uganda
Kenya Zambia
Lesotho Zimbabwe
Liberia
North AmericaCanada USA

Notes

Notes

Notes
