global implications of enso events on inland fisheries
TRANSCRIPT

Global Implications of ENSO Events on Inland Fisheries
Ian G. Cowx
INSERT PHOTOS
HERE
INSERT PHOTOS
HERE
IFM, York, 21 May 2109
UNIVERSITY OF
Hull International Fisheries Institute
HIFI

Outline
• Where are we with research on extreme climate events.
• Impacts of extreme events on inland fisheries– Case studies: UK, African
Great Lakes, Mekong • Adaptation strategies and
increasing resilience

Winter
Summer
Current emphasis on climate research
Temperature and precipitation to 2050 (IPCC 2007)
IPCC predictions for inland areas are increased temperatures and regional variation in precipitation

Current emphasis on climate research
0
100
200
300
400
500
6001975
1977
1979
1981
1983
1985
1987
1989
1991
1993
1995
1997
1999
2001
2003
2005
2007
2009
2011
2013
2015
2017
Marine Inland
Expanding research focussing on marine environment and changes in distribution and phenology of species
Are we missing the impacts of extreme events – especially those driven by natural processes, e.g. ENSO?
0
10
20
30
40
50
60
70
1975
1977
1979
1981
1983
1985
1987
1989
1991
1993
1995
1997
1999
2001
2003
2005
2007
2009
2011
2013
2015
2017
Marine Inland

Enso eventsDisruption of upwelling events arising from southern oscillations

1972-73 1982-83 1997-98 2015-16
el Niño events

el Niño events – marine environment

el Niño – freshwater environment

1974-76 1988-90 1998-2000 2016-18
el Niño v la Niña

la Niña – freshwater environment
River Rivelin, UK – July 18

Extreme climate events

Extreme events shape ecosystems
From Webb
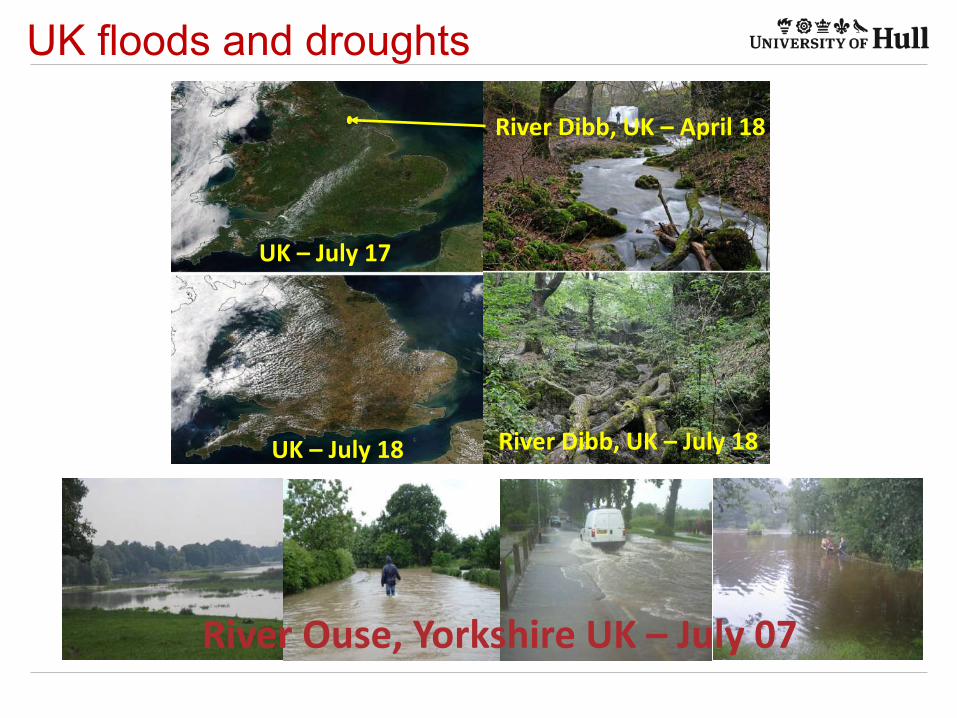
UK floods and droughts
River Dibb, UK – April 18
River Dibb, UK – July 18
UK – July 17
UK – July 18
River Ouse, Yorkshire UK – July 07

2015 winter floods - YorkshireBoxing Day floods some of the most severe on record
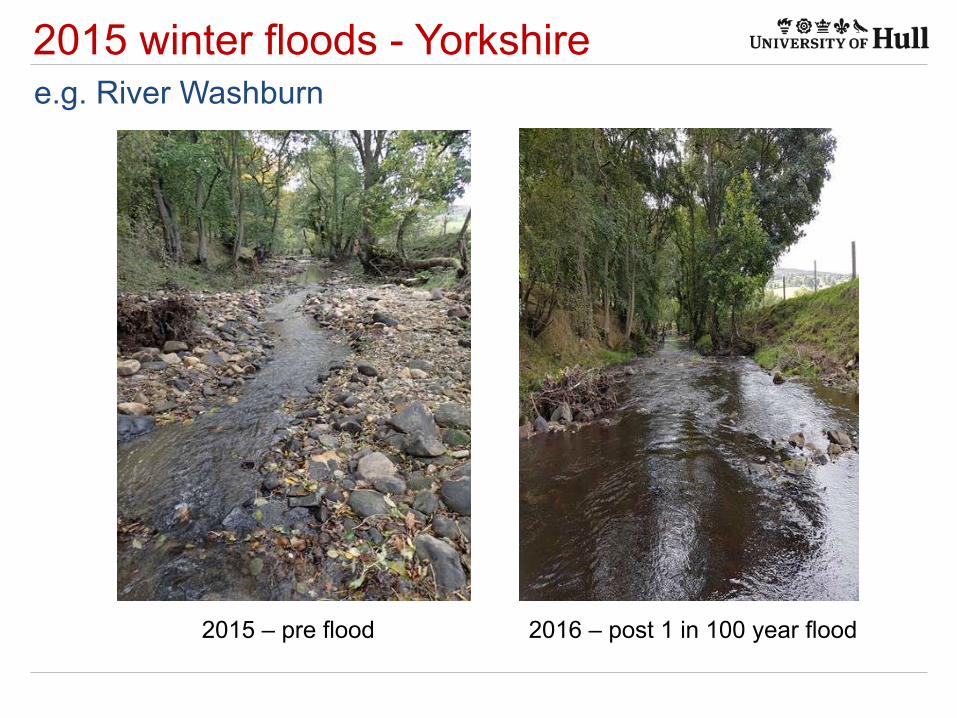
2015 winter floods - Yorkshiree.g. River Washburn
2015 – pre flood 2016 – post 1 in 100 year flood

2015 Winter floods – River Washburn
0+ brown trout
1+ brown trout
Similar response to trout populations across north of England – washout of spawning redds

African Great Lakes – fisheries yield
Prediction: Fisheries yield (kg/ha) dependent on seasonal relative lake level (Source Kolding et al. 2012)

470
471
472
473
474
475
476
477
1900 1920 1940 1960 1980 2000
wat
er le
vel i
n m
etre
s (a
.m.s
.l)
Year
Variation in water level, Lake Malawi
Malawi
1133.00
1133.50
1134.00
1134.50
1135.00
1135.50
1136.00
1900 1920 1940 1960 1980 2000
Lake
leve
l in
met
res
(a.m
.s.l)
Year
Water level variation in Lake Victoria
Victoria
Lake level variability and el Niño
-
200
400
600
800
1,000
1,200
1965
1967
1969
1971
1973
1975
1977
1979
1981
1983
1985
1987
1989
1991
1993
1995
1997
1999
2001
2003
2005
2007
2010
2014
Land
ings
(ton
nes i
n th
ousa
nds)
Year
Nile perch Dagaa Tilapias Haplochromines Others
Year1980 1990 2000 2010
Tota
l cat
ch
0
20000
40000
60000
80000Tilapiines Haplochromines Usipa Other

1133.00
1133.50
1134.00
1134.50
1135.00
1135.50
1136.00
1900 1920 1940 1960 1980 2000
Lake
leve
l in
met
res
(a.m
.s.l)
Year
Water level variation in Lake VictoriaVictoria
Lake Victoria - la Niña periodVictoria – Mara wetland

Fisheries of the lower Mekong Basin
ðEstimated 2.5 million t/yr
ð200+ species; 30+ of high commercial importance
ð > 40% of total fish catch in LMB (about 1.3 million tonnes worth US$6 billion) dependent on migratory fish
ð Fish production dependent on fish migration (all seasons of year) and extent of flooding

Drivers of fish productionWater level and flooding• Water level and extent of
flooding key drivers of fish production
• Shifts in fisheries productivity due to changes in hydrological patterns
0
20000
40000
60000
80000
100000
120000
0
0.5
1
1.5
2
2.5
1995
1996
1997
1998
1999
2000
2001
2002
2003
2004
2005
2006
2007
2008
2009
2010
2011
2012
2013
2014
Capt
ure
fish
yiel
d (t
)
Mea
n an
nual
wat
er le
vel (
m)
meanannual
Annual Delta fishery
y = 47575x - 15010R² = 0.5366
0.0
0.5
1.0
1.5
2.0
2.5
3.0
3.5
0
5
10
15
20
25
Wat
er le
vel (
m)
Catc
h ra
te (k
g/da
y)
Catch rate
Water Level
Daily catch driven by water level in delta

Climate changePredicted effects of climate change in Lower Mekong Basin
Temperature Precipitation
Predicted alteration of flood cycleo Potential greater rainfall
in monsoon season in Viet Nam Highlands altering flooding magnitude, duration and extent in LMB
o More extreme flooding cycle.
o 3-10% increase in wet season flows
o 2-6% reduction in dry season flows

Predicted change in fish yield (t)
Mekong delta + 65,000Cambodian floodplain
+ 44,300
Tonle Sap + 30,200Total change + 139,500
Climate change – fish productionPredicted shift in daily discharge at Prek Kdam---- baseline---- Climate change scenario
= +10% increase in fish production

Lower Mekong Basin 2015 El NiñoAnnual water level in Tonle Sap, Cambodia –red indicates severe el Niño years
0.00
2.00
4.00
6.00
8.00
10.00
12.00
01/01/19
85
01/01/19
86
01/01/19
87
01/01/19
88
01/01/19
89
01/01/19
90
01/01/19
91
01/01/19
92
01/01/19
93
01/01/19
94
01/01/19
95
01/01/19
96
01/01/19
97
01/01/19
98
01/01/19
99
01/01/20
00
01/01/20
01
01/01/20
02
01/01/20
03
01/01/20
04
01/01/20
05
01/01/20
06
01/01/20
07
01/01/20
08
01/01/20
09
01/01/20
10
01/01/20
11
01/01/20
12
01/01/20
13
01/01/20
14
01/01/20
15
01/01/20
16
01/01/20
17
01/01/20
18
Water level in Viet Nam Delta

0.0
100.0
200.0
300.0
400.0
500.0
600.0
700.0
800.0
900.0
0
5,000
10,000
15,000
20,000
25,000
30,000
35,000
40,000
45,000
50,000
95-9
6
96-9
7
97-9
8
98-9
9
99-0
0
00-0
1
01-0
2
02-0
3
03-0
4
04-0
5
05-0
6
06-0
7
07-0
8
08-0
9
09-1
0
10-1
1
11-1
2
12-1
3
13-1
4
14-1
5
15-1
6
16-1
7
Floo
d In
dex
dura
tion
of h
igh
wat
er le
vels
Biom
ass
(tonn
es)
Biomass (Tonnes) Flood index
Severe reduction in flood peak and durationTonle Sap dai fishery closed early in November (2015) rather than February/March
0.00
2.00
4.00
6.00
8.00
10.00
12.0001
/01/19
85
01/01/19
86
01/01/19
87
01/01/19
88
01/01/19
89
01/01/19
90
01/01/19
91
01/01/19
92
01/01/19
93
01/01/19
94
01/01/19
95
01/01/19
96
01/01/19
97
01/01/19
98
01/01/19
99
01/01/20
00
01/01/20
01
01/01/20
02
01/01/20
03
01/01/20
04
01/01/20
05
01/01/20
06
01/01/20
07
01/01/20
08
01/01/20
09
01/01/20
10
01/01/20
11
01/01/20
12
01/01/20
13
01/01/20
14
01/01/20
15
01/01/20
16
01/01/20
17
01/01/20
18
Tonle Sap 2015 El Niño

Exposure Sensitivity
Potential ecological impact
Recovery potential
+
Resource dependency
Potential social impact
Adaptive capacity
Social- Ecological Vulnerability
Ecological Vulnerability
Feedbacks
Ecological
Socio-economic
Adaptation strategies
Adaptation: A process that aims to generate resilience to external stressors (related to resource dependence) and capacity to use potential opportunities in a sustainable and ethical manner

UK adaptation to floods and droughts
FloodsDredging: improved discharge capacity of riversNatural flood risk management: tree planting, reconnecting floodplains and buffer zones
DroughtsFlow Regulation: reduced compensation flows and regulate abstractionHabitat restoration – narrowing channels

Based on household surveys
• Shift in livelihoods of fishing communities towards employment such as construction [but not agriculture]
• Shift is diets: Fish and OAAs contribute about 70% of animal protein intake but drops to 54%
• Fish farming as non-equitable solution• Diplomatic engagement with China to
release water from upstream dams
Adaptation strategies - Mekong
This project receives funding from the European Union’s Horizon 2020 research and innovation programme under grant
agreement No 678193.
CERESClimate change and European aquatic
RESources
Ian Cowx
IFM, York 21 May 2019
Hull International Fisheries Institute
CERESPROJECT.EU