global food crisis-a most devastating phenomena: causes, severity and outlook, impact upon nations...
TRANSCRIPT

welcome

1st Seminar on
Global Food Crisis: Causes, Severity and Outlook
Major advisorDr. M. T. Sharma
By
Vijay B. KerabaPGS12AGR5760UAS Dharwad

Imagine a planet EARTHImagine a planet EARTH
There’s an extreme poverty
• Where >300 million of people live in hunger
A child die of hunger every 6-seconds
Where billions of people are malnourished
• Where there are riots because of “No Food”
Where millions of
people are RichWhere they enjoy
delicious, nutritious and yet tasty food
They’re overweighed
Where they waste the food
GLOBAL FOOD CRISIS
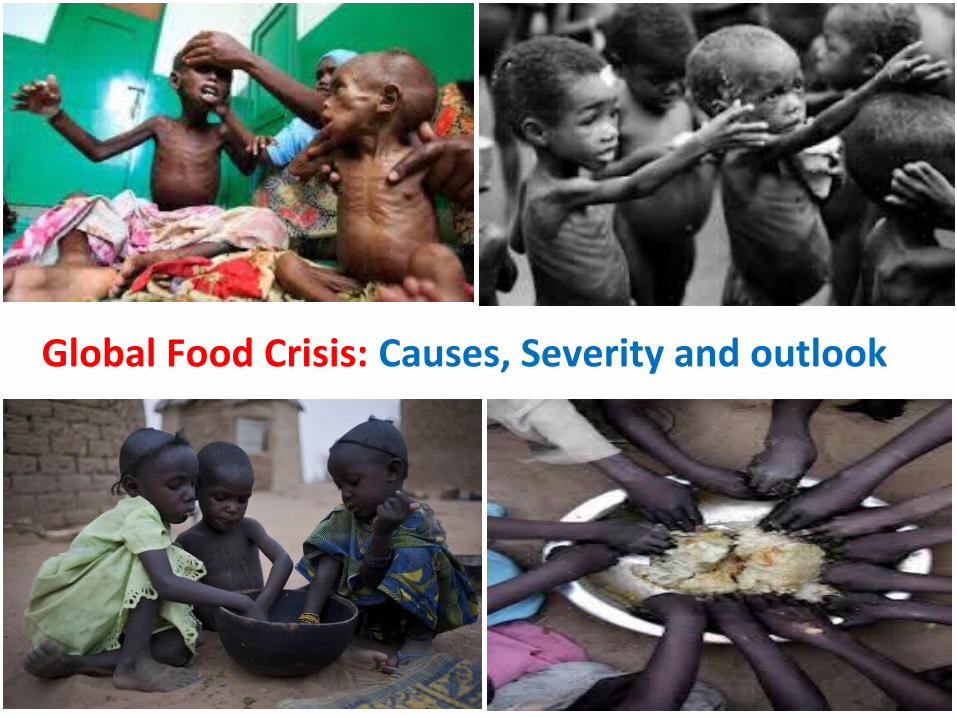
Global Food Crisis: Causes, Severity and outlook

FLOW OF PRESENTATIONFLOW OF PRESENTATION• Introduction• Food prices: Trends, drivers, outlook• Nature and underlying causes of the food crisis• Impact of food crisis• Implications for India• Future prospects and• Conclusion

CrisisCrisis .
? FoodFood CrisisCrisis . . ? ?“A food crisis occurs when rates of hunger and
malnutrition rise sharply at local, national, or global levels.
Timmer, C. (2010)
Food Security exists Food Security exists
When all people, at all times, have physical and economic access
to sufficient, safe and nutritious food to meet their dietary needs and food
preference for an active and healthy life.
(World Food Summit, Rome, 1996)
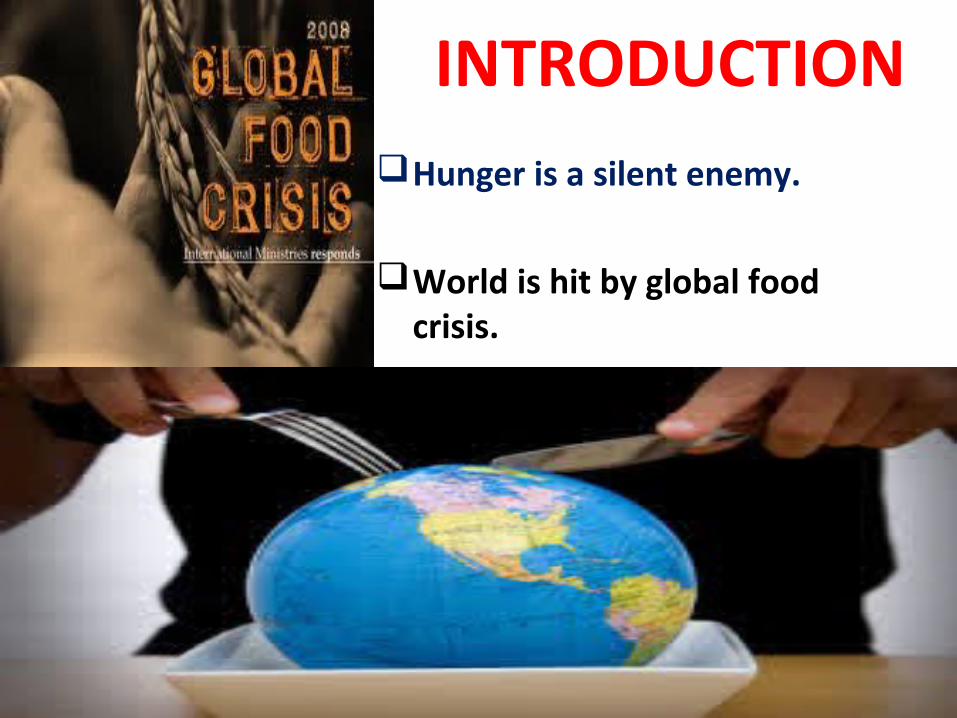
INTRODUCTIONHunger is a silent enemy.
World is hit by global food crisis.

Cntd....Most immediate are the urgent hunger needs in over 37 developing
countries, 20 of which are LDCs.
The global food crisis undermines one of the most fundamental human
rights – “The right to be free from hunger and malnutrition.”
The 3 billion people living on $2 or less spend between 50 - 80% on food.
– Food prices have increased by 83% in just three years.
The price increase has been observed particularly very sharp for staple food crops.
In June-Sept, 2012,» Price of maize increased by 50%» That of wheat increased by 45%» And price of soybean by 40%
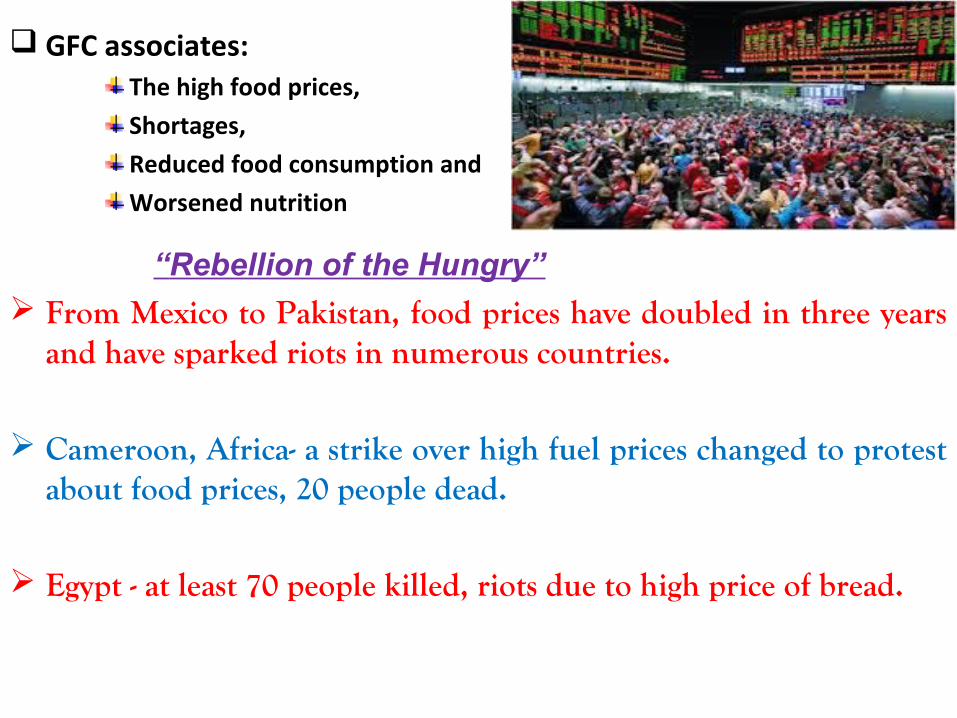
GFC associates:The high food prices,
Shortages,
Reduced food consumption and
Worsened nutrition
“Rebellion of the Hungry”
From Mexico to Pakistan, food prices have doubled in three years and have sparked riots in numerous countries.
Cameroon, Africa- a strike over high fuel prices changed to protest about food prices, 20 people dead.
Egypt - at least 70 people killed, riots due to high price of bread.

Important TermsPrice Volatility: Volatility is a measure of price
variation from period (t − 1) to time period ‘t’.
Where, R - Price Volatility
Pt - Price variation at period ‘t’
P(t-1) - Price variation at period ‘t-1’
R = Pt − P(t−1 )
Food Price Index:
It is a measure of the monthly change
in international prices of a basket of food
commodities.

2008 The Year of Global Food Crisis
The Sunday Herald described the world’s food situation as:
” The Biggest Crisis of the 21st Century”
7% of them dying before they reach fifth birthday.!!7% of them dying before they reach fifth birthday.!!
Extent / Severity of Global Food Crisis

Map of Hunger (% prevalence of undernourishment, 2012)Map of Hunger (% prevalence of undernourishment, 2012)
Source: FAO, Statistics Division (FAOSTAT)Source: FAO, Statistics Division (FAOSTAT)
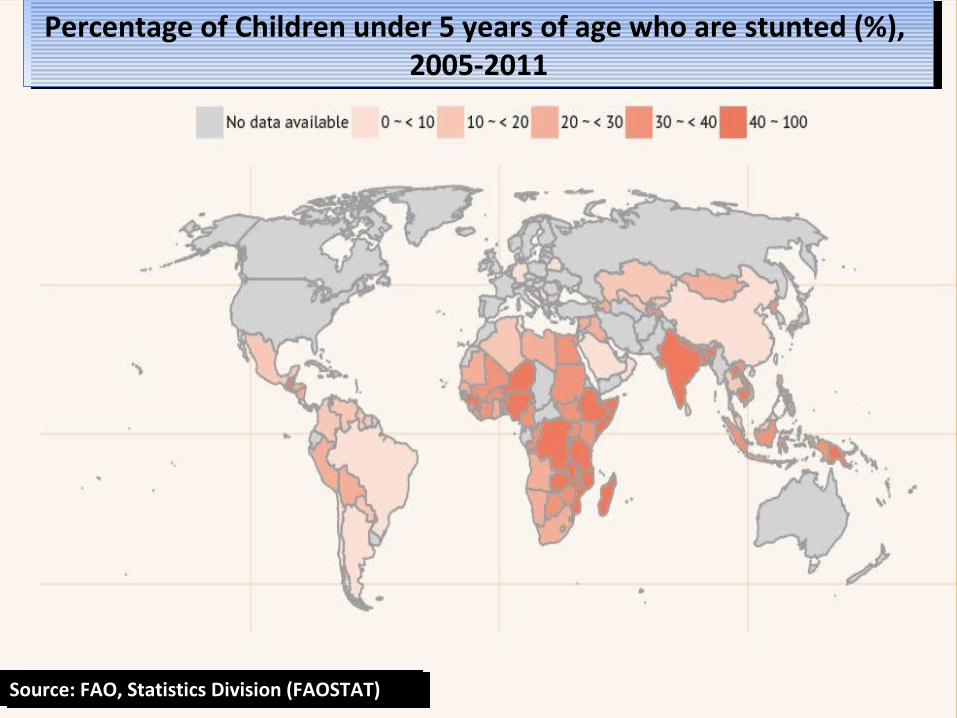
Percentage of Children under 5 years of age who are stunted (%), 2005-2011
Percentage of Children under 5 years of age who are stunted (%), 2005-2011
Source: FAO, Statistics Division (FAOSTAT)Source: FAO, Statistics Division (FAOSTAT)

NUMBER OF PEOPLE UNDERNOURISHED(1990-1992 TO 2010-2012)
NUMBER OF PEOPLE UNDERNOURISHED(1990-1992 TO 2010-2012)
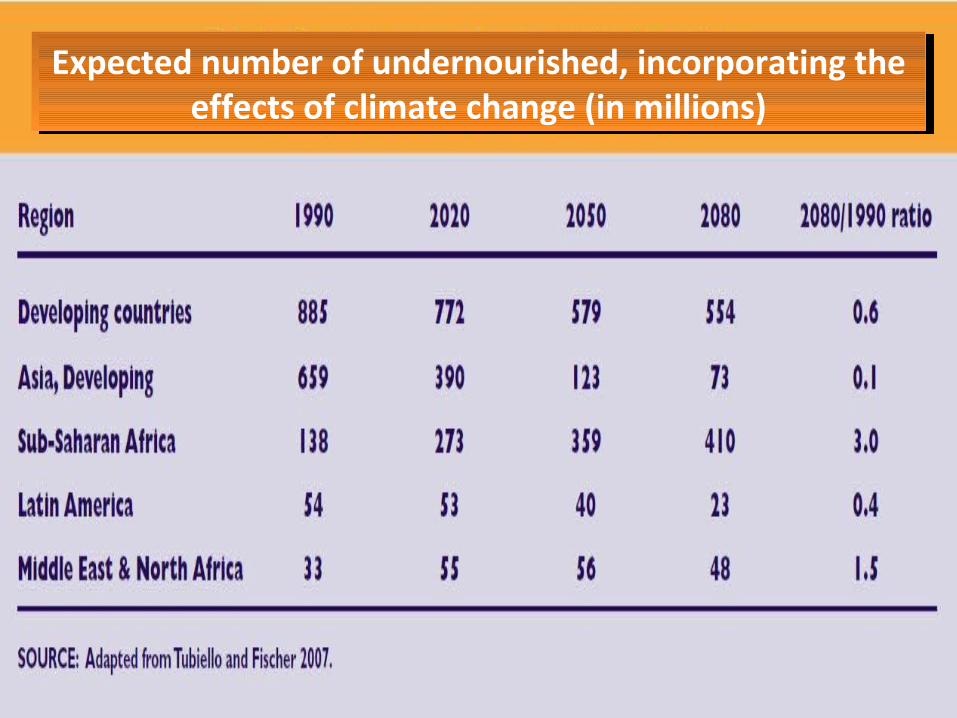
Expected number of undernourished, incorporating the effects of climate change (in millions)
Expected number of undernourished, incorporating the effects of climate change (in millions)

Price Hike

Domestic food price volatility by level of economic development (2000 and 2010)
Domestic food price volatility by level of economic development (2000 and 2010)

YearFood Price Index
Meat Dairy CerealsVegetable
oilsSugar
2000 91.1 96.5 95.2 85.8 69.5 116.1
2001 94.6 100.1 105.3 86.8 67.2 122.6
2002 89.6 89.9 80.9 93.7 87.4 97.8
2003 97.7 95.9 95.6 99.2 100.6 100.6
2004 112.7 114.2 123.6 107.1 111.9 101.7
2005 117.9 123.7 134.9 101.3 102.7 140.3
2006 127.2 120.9 130.0 118.9 112.7 209.6
2007 161.6 130.8 220.3 163.4 172.0 143.0
2008 201.4 160.7 222.9 232.1 227.1 181.6
2009 160.6 141.3 150.0 170.2 152.8 257.3
2010 188.0 158.3 206.7 179.2 197.4 302.0
2011 230.1 183.3 230.2 240.9 254.5 368.9
2012 213.4 182.0 194.1 236.1 223.9 305.7
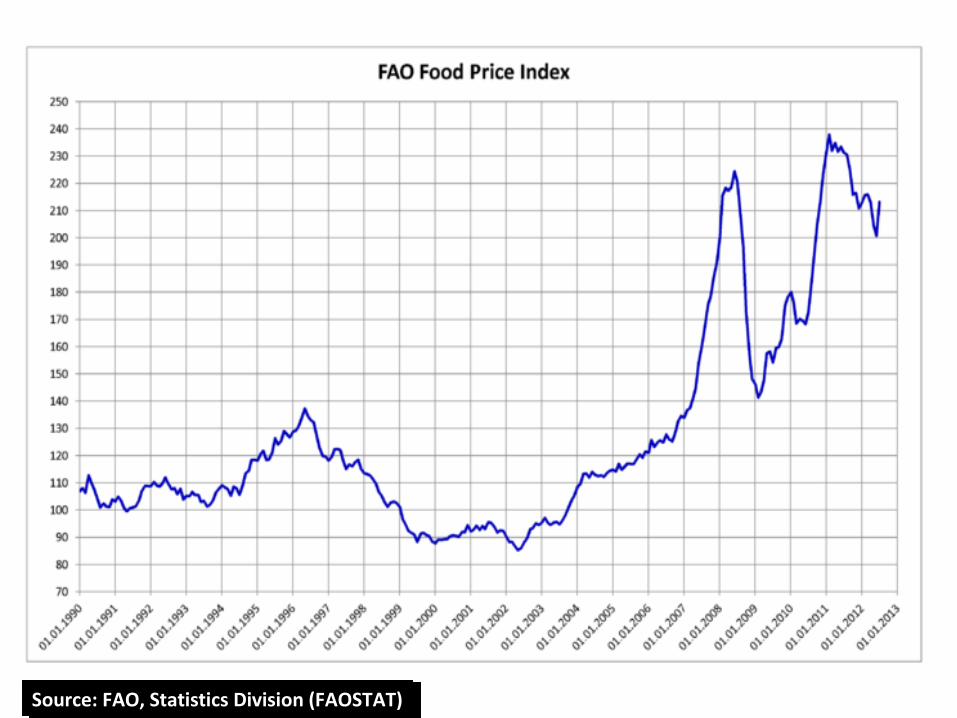
FAO Food Price IndexFAO Food Price Index
Source: FAO, Statistics Division (FAOSTAT)Source: FAO, Statistics Division (FAOSTAT)
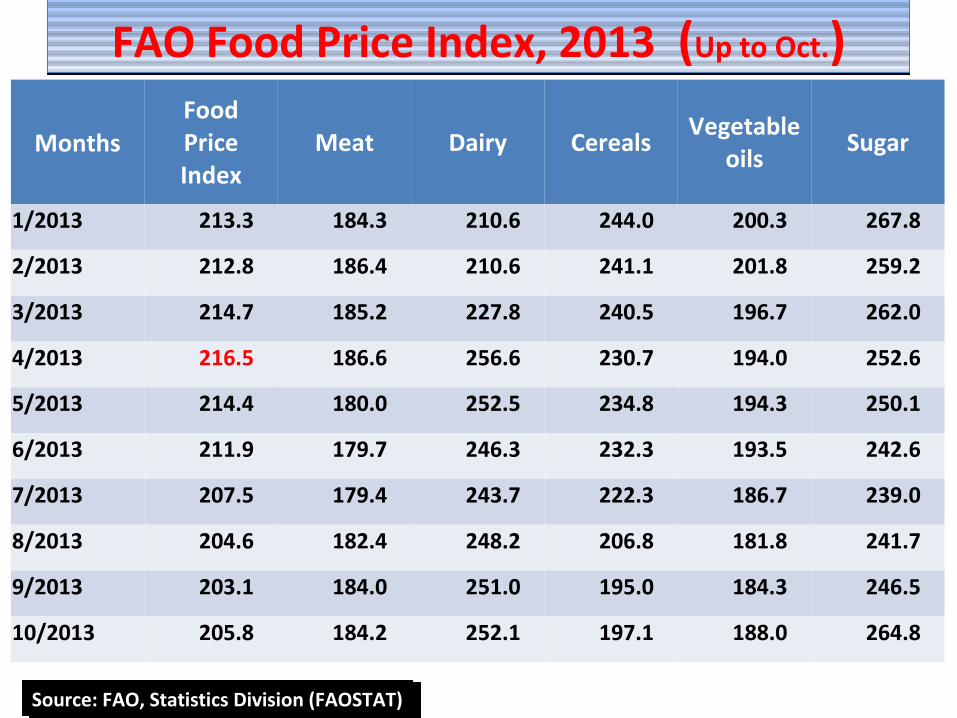
FAO Food Price Index, 2013 (Up to Oct.)FAO Food Price Index, 2013 (Up to Oct.)
MonthsFood Price Index
Meat Dairy CerealsVegetable
oilsSugar
1/2013 213.3 184.3 210.6 244.0 200.3 267.8
2/2013 212.8 186.4 210.6 241.1 201.8 259.2
3/2013 214.7 185.2 227.8 240.5 196.7 262.0
4/2013 216.5 186.6 256.6 230.7 194.0 252.6
5/2013 214.4 180.0 252.5 234.8 194.3 250.1
6/2013 211.9 179.7 246.3 232.3 193.5 242.6
7/2013 207.5 179.4 243.7 222.3 186.7 239.0
8/2013 204.6 182.4 248.2 206.8 181.8 241.7
9/2013 203.1 184.0 251.0 195.0 184.3 246.5
10/2013 205.8 184.2 252.1 197.1 188.0 264.8
Source: FAO, Statistics Division (FAOSTAT)Source: FAO, Statistics Division (FAOSTAT)
Source: FAO, Statistics Division (FAOSTAT)Source: FAO, Statistics Division (FAOSTAT)
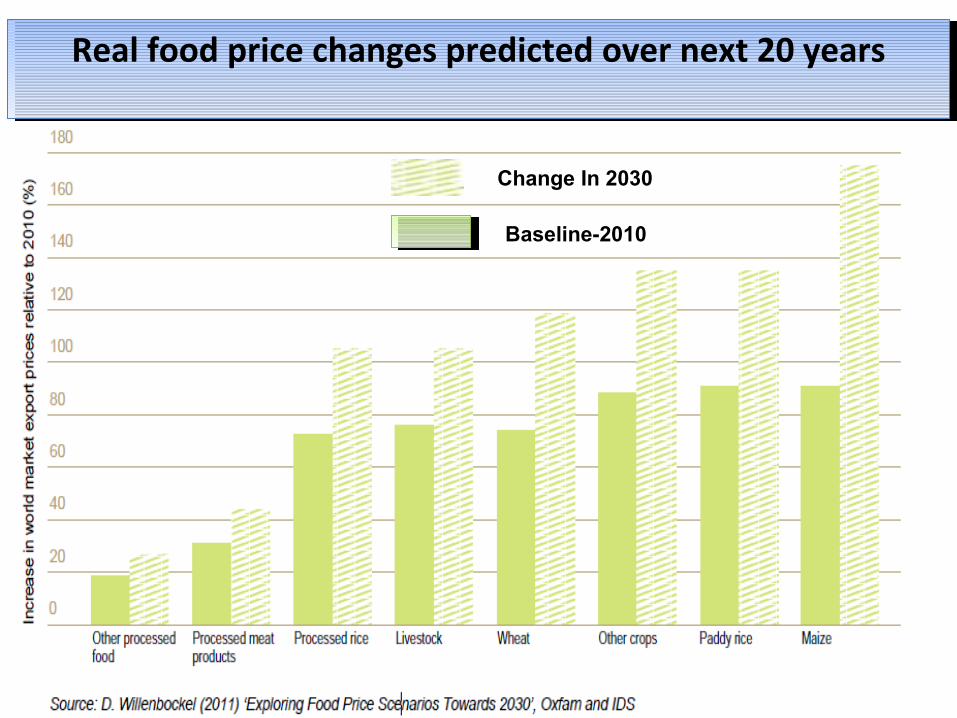
Real food price changes predicted over next 20 yearsReal food price changes predicted over next 20 years
Change In 2030
Baseline-2010

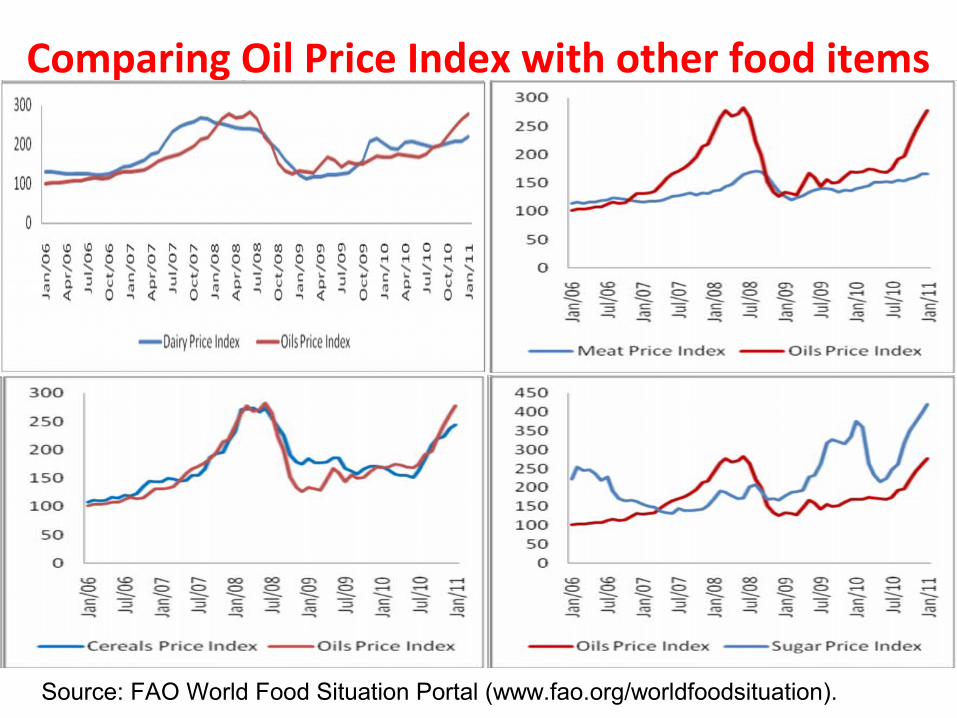
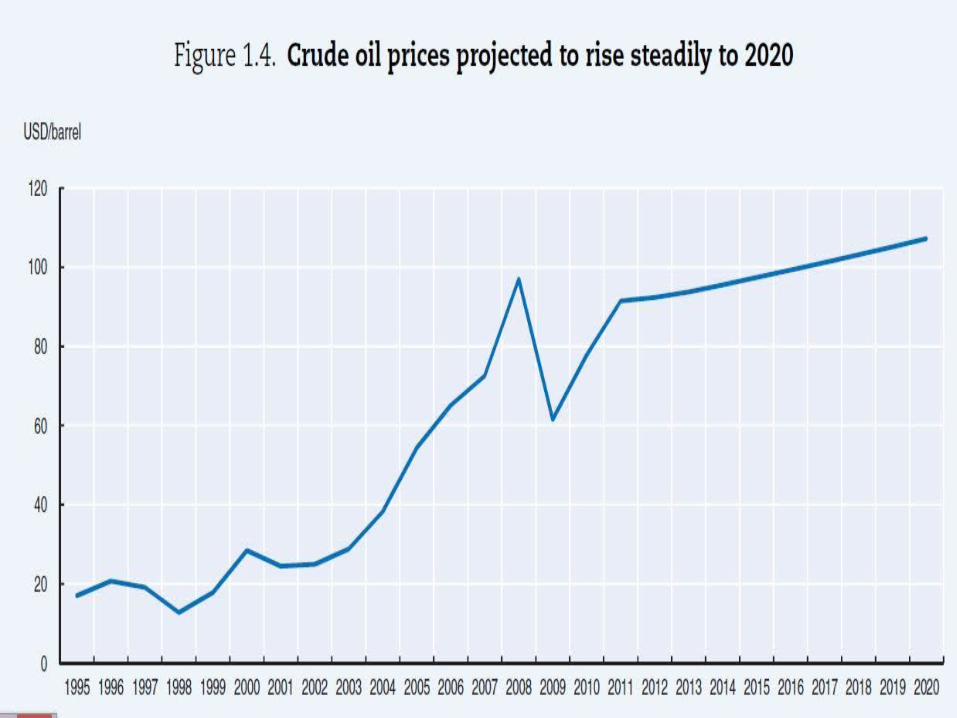
Comparing Oil Price Index with other food items
Source: FAO World Food Situation Portal (www.fao.org/worldfoodsituation).
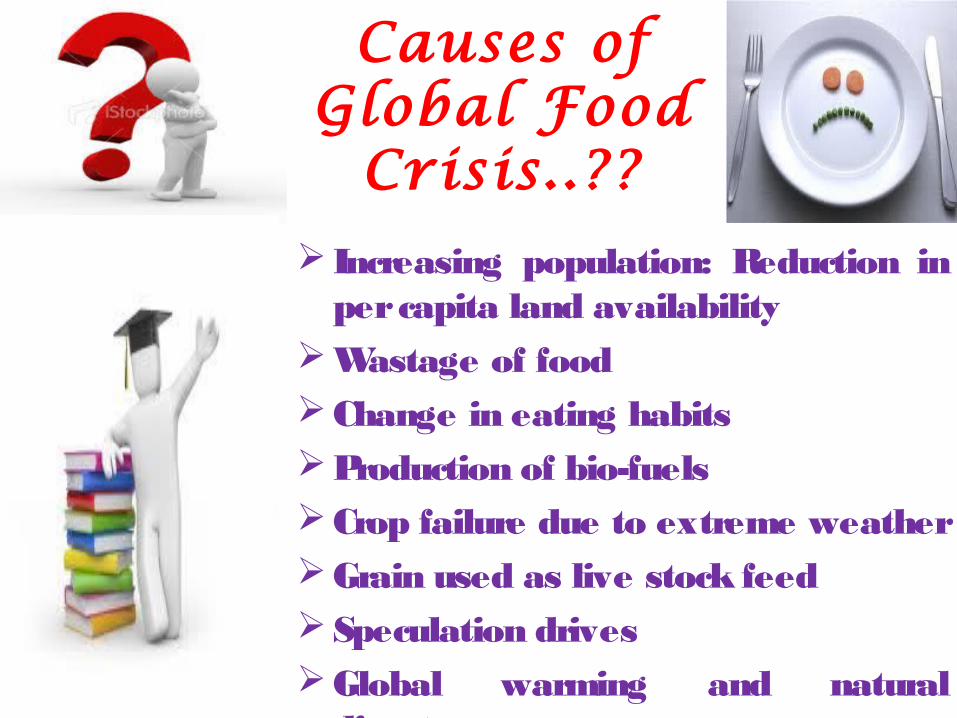
Causes of Global Food
Crisis..?? Increasing population: Reduction in
per capita land availabilityWastage of foodChange in eating habitsProduction of bio-fuelsCrop failure due to extreme weatherGrain used as live stock feedSpeculation drivesGlobal warming and natural
disasters
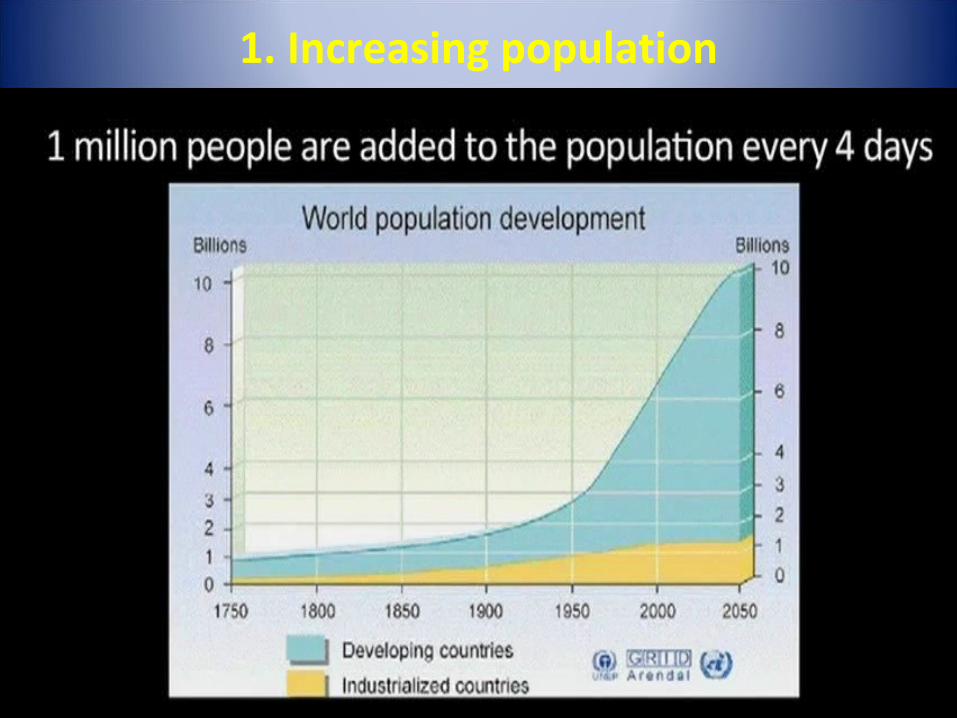
1. Increasing population

World rural and urban population(1960-2050)
World rural and urban population(1960-2050)
The global population is rising by more than 1.15 per cent a year, which contributes to a net addition to the demand for food and which reduces available resources for food production.
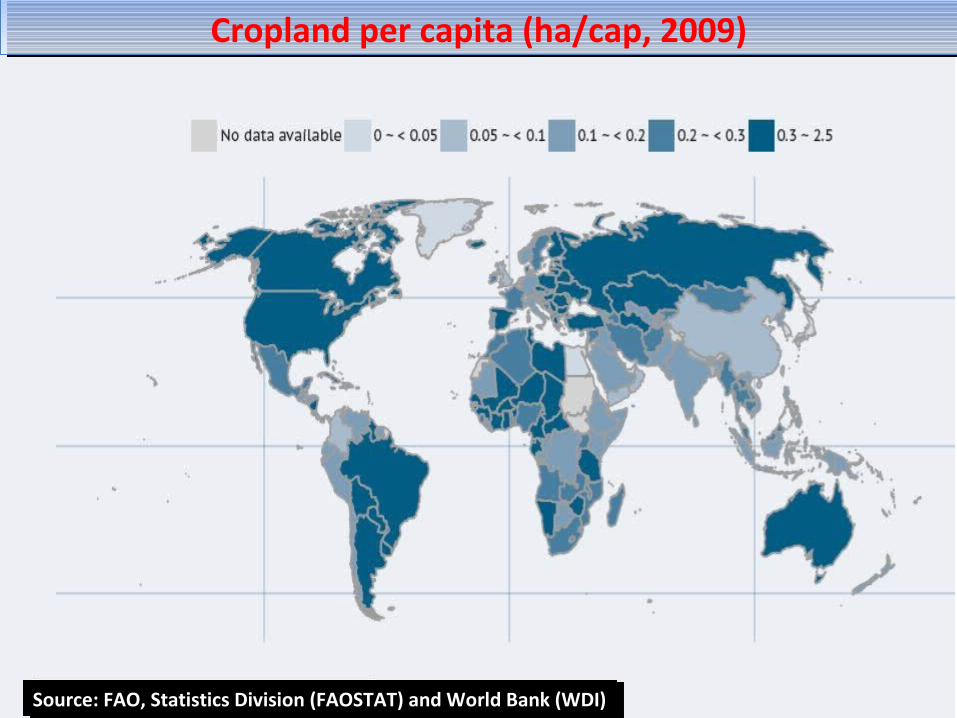
Cropland per capita (ha/cap, 2009)Cropland per capita (ha/cap, 2009)
Source: FAO, Statistics Division (FAOSTAT) and World Bank (WDI)Source: FAO, Statistics Division (FAOSTAT) and World Bank (WDI)
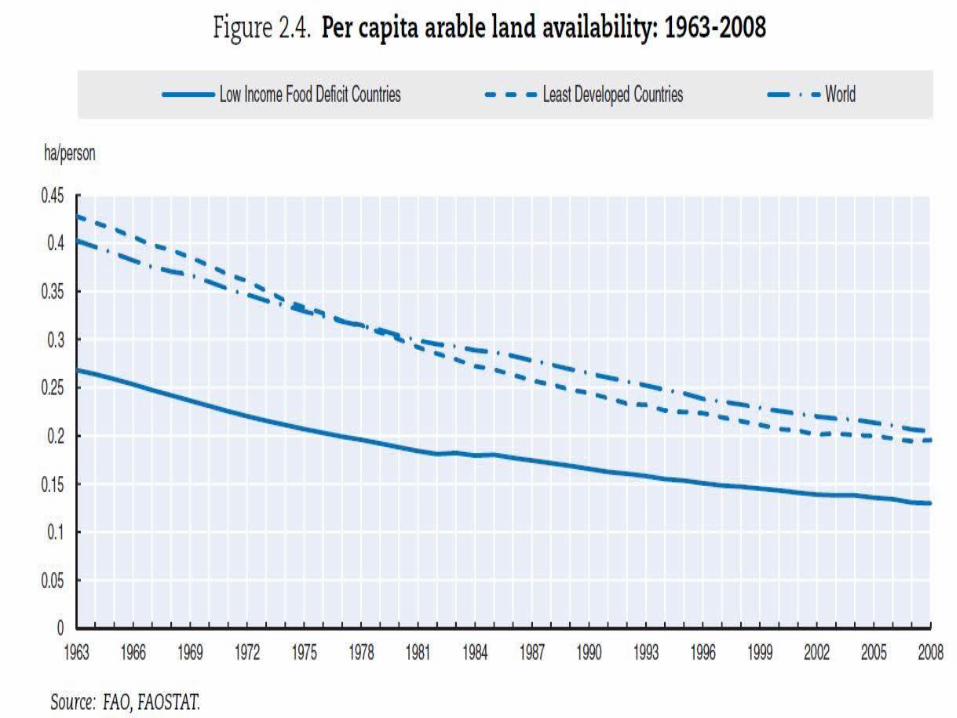

We have already lost 24% of the
world’s farmland and are continuing
to lose a further 1% per year
We have already lost 24% of the
world’s farmland and are continuing
to lose a further 1% per year

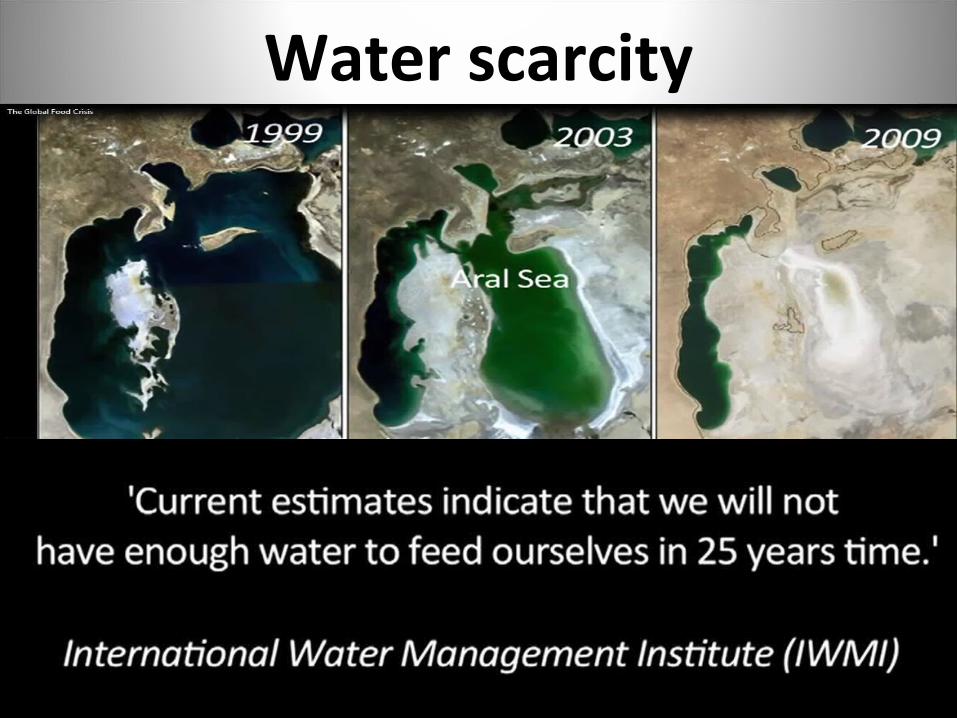
Water scarcity

2. Wastage of food

3. Change in eating habits

A diminishing supply of fish will put more pressure on land based protein food sources and encourage intensive farming.
Japanese are consuming 10 times as much protein as they did 50 years ago.
More and more people are shifting towards meat based food system
The shift in diets towards meat products, particularly in China, and population growth in India and other countries are also contributing to the surge in prices of staple foods.
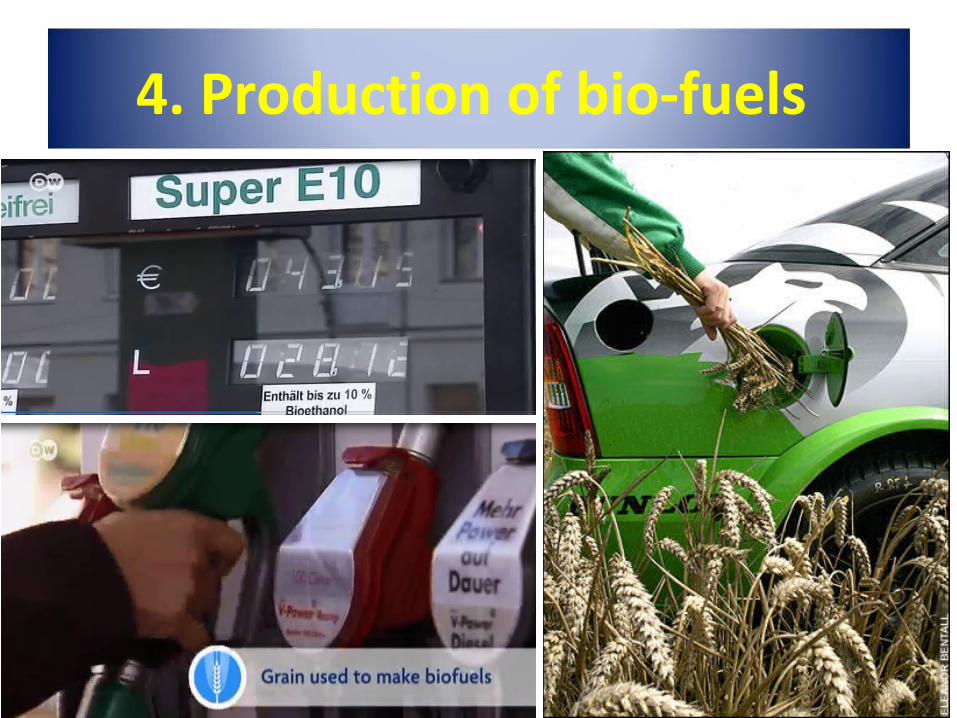
4. Production of bio-fuels

It takes 232Kg of corn to fill an average
50L car tank with ethanol.
Enough corn to feed a child for 1 year.!
IMF estimates that corn ethanol
production in the US accounted for at
least ½ the rise in world’s corn
demand in past 3 years, as farmers
switched their farms to corn.


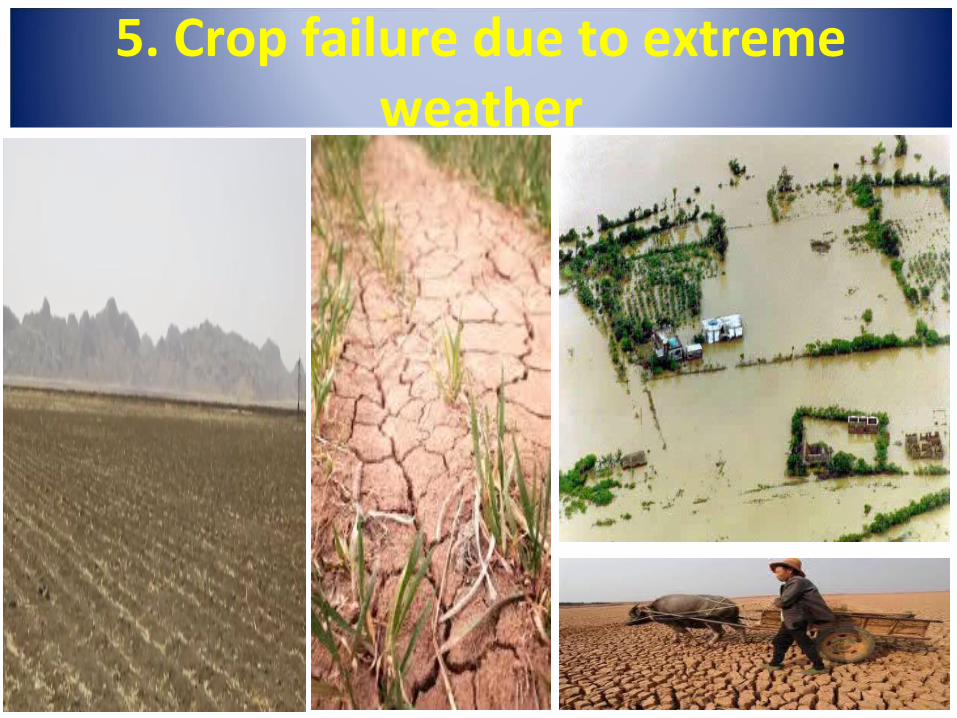
5. Crop failure due to extreme weather


Global warmingThe threat of global
warming caused by emissions of
man-made greenhouse gases
such as carbon dioxide (CO2)
that are released into the
atmosphere by the burning of
fossil fuels such as oil, gas and
coal has resulted in a search for
so-called “green” fuels that can
power our vehicles (cars, trucks,
boats, and planes)

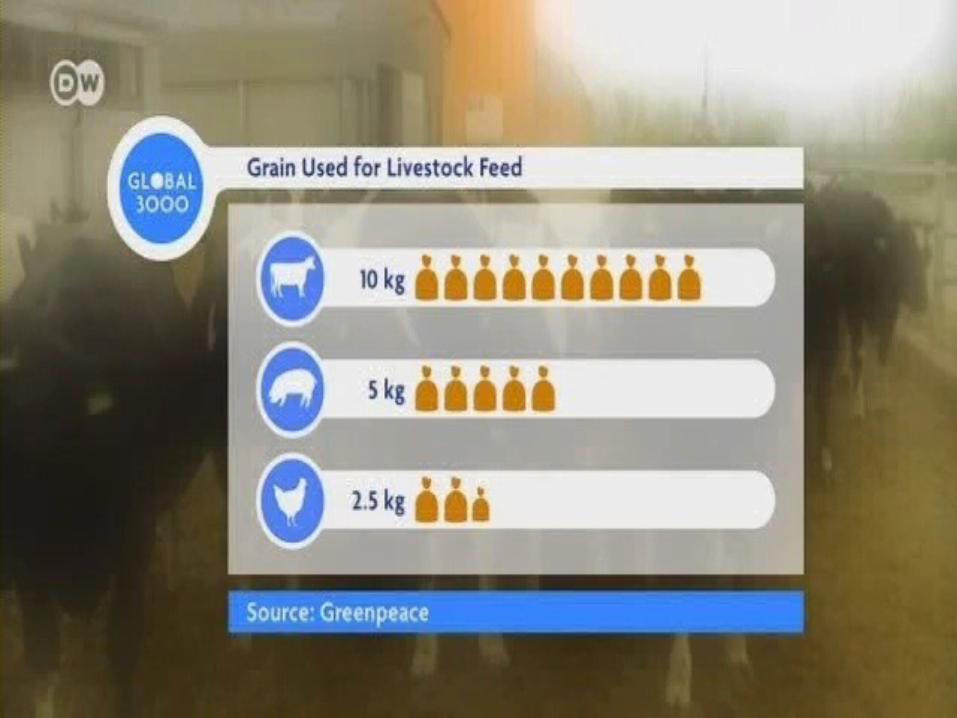
6. Grain used as live stock feed
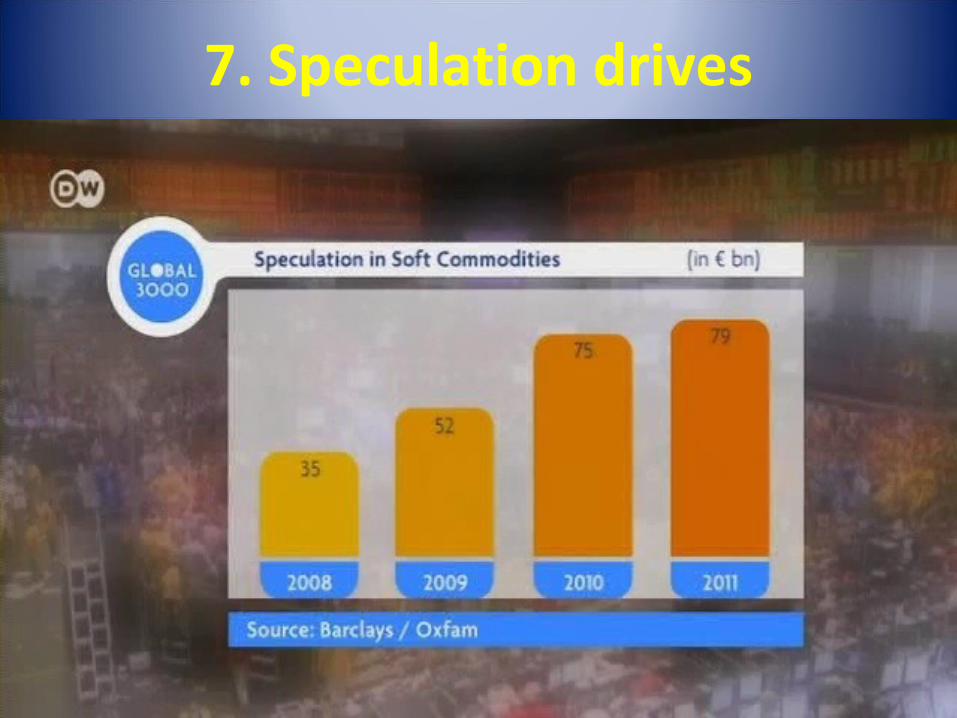
7. Speculation drives

Professional speculators and hedge
funds are driving up the prices of
basic commodities in commodity
futures
These dealers are reported to be
shifting investments out of equities
and mortgage bonds and ploughing
them into food and raw materials.
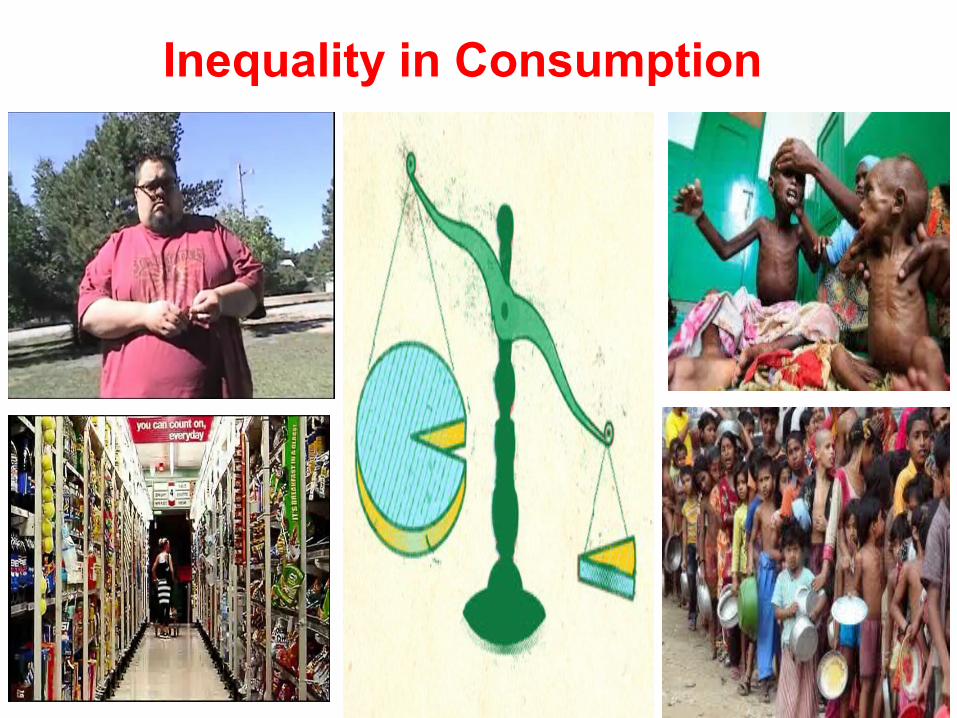
Inequality in Consumption
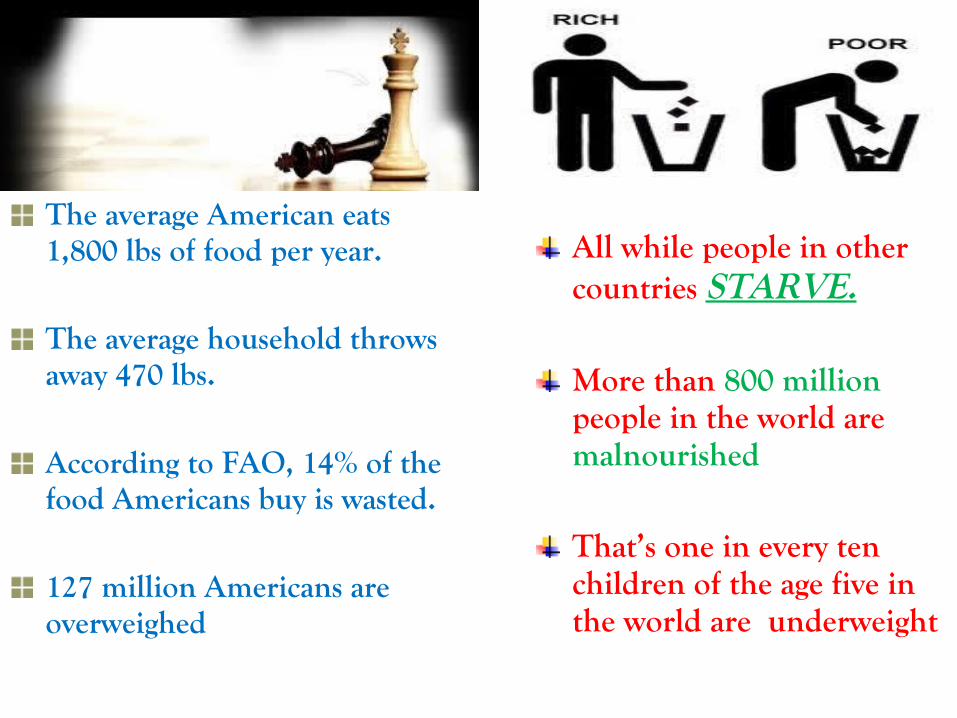
The average American eats 1,800 lbs of food per year.
The average household throws away 470 lbs.
According to FAO, 14% of the food Americans buy is wasted.
127 million Americans are overweighed
All while people in other countries STARVE.
More than 800 million people in the world are malnourished
That’s one in every ten children of the age five in the world are underweight
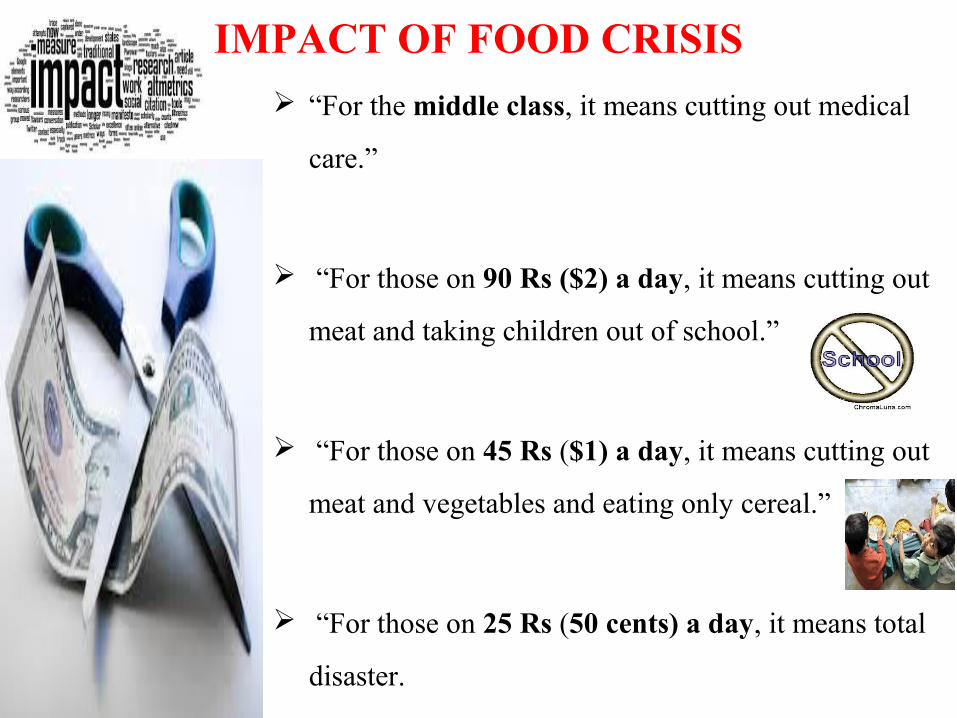
IMPACT OF FOOD CRISIS
“For the middle class, it means cutting out medical
care.”
“For those on 90 Rs ($2) a day, it means cutting out
meat and taking children out of school.”
“For those on 45 Rs ($1) a day, it means cutting out
meat and vegetables and eating only cereal.”
“For those on 25 Rs (50 cents) a day, it means total
disaster.

Impact on the poor
Rising food prices affect the poor directly.
The poor generally spend large fractions of their budgets on food, so rising prices make them more likely to reduce their food consumption.
The short-term impacts are alarming: incomes fall by more than 25% and food consumption by almost 20%.
Medium-term prospects remain bleak, with incomes and food consumption down by 11% and 8% respectively.
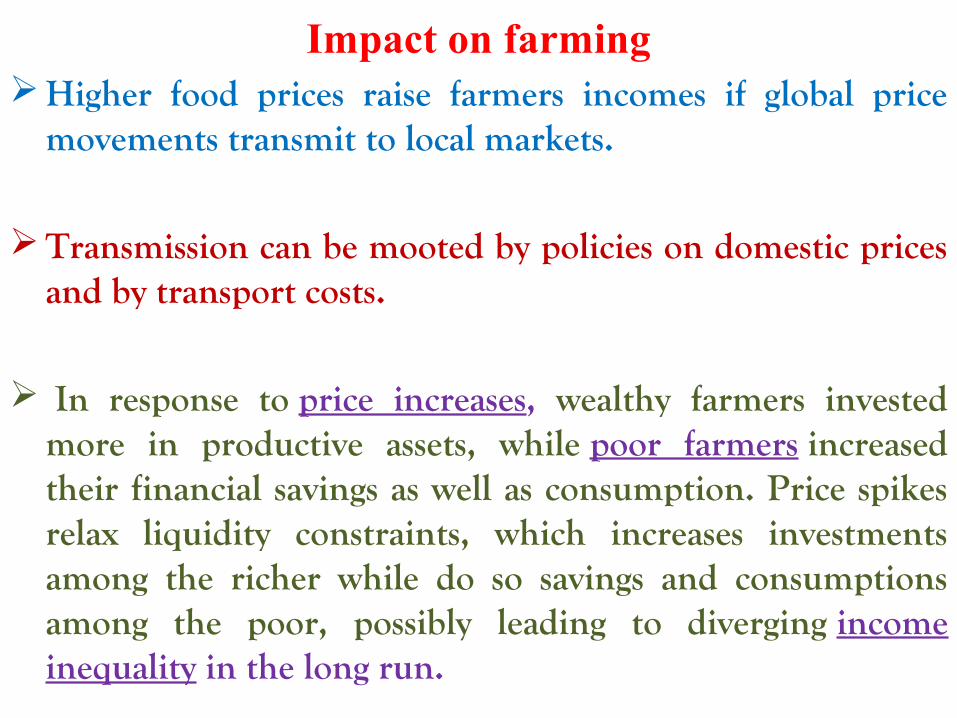
Impact on farming Higher food prices raise farmers incomes if global price
movements transmit to local markets.
Transmission can be mooted by policies on domestic prices and by transport costs.
In response to price increases, wealthy farmers invested more in productive assets, while poor farmers increased their financial savings as well as consumption. Price spikes relax liquidity constraints, which increases investments among the richer while do so savings and consumptions among the poor, possibly leading to diverging income inequality in the long run.

Impact on low-income countries
Low-income countries face inflationary pressure and rising import
bills both of which undermine economic growth and development.
FAO estimates that food import bills for developing countries rose by
25% in 2007 (Shapouri and Rosen, 2008).
The World Food Programme (WFP) needing another $500 million
to sustain current operations, the likely outcome for these countries
is that food availability will fall.
Higher food prices are incentives to produce local food and could
stimulate agriculture
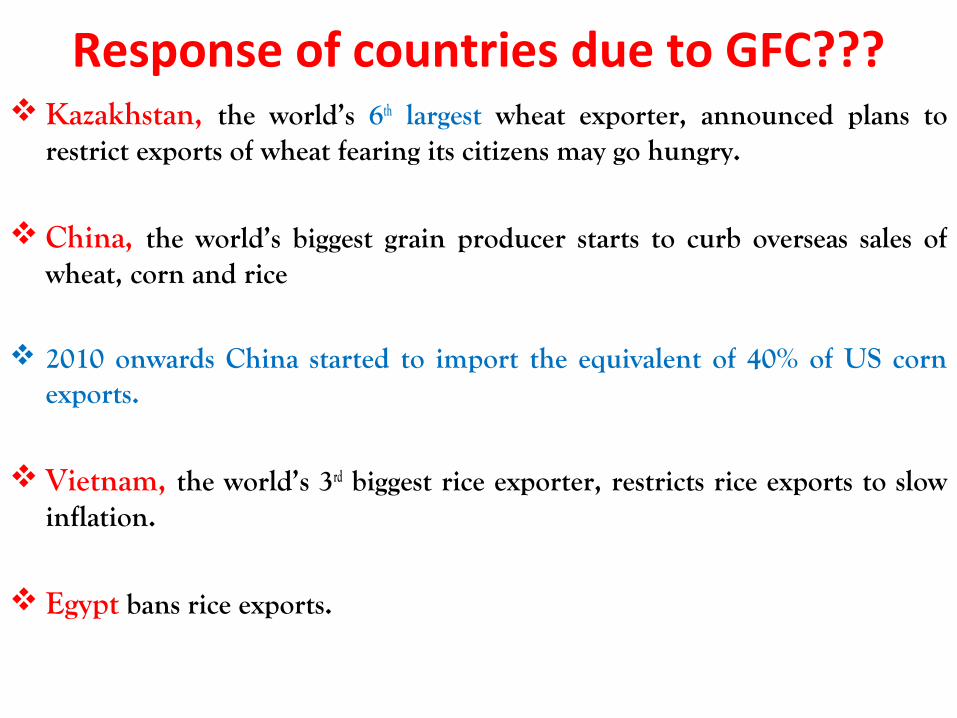
Response of countries due to GFC??? Kazakhstan, the world’s 6th largest wheat exporter, announced plans to
restrict exports of wheat fearing its citizens may go hungry.
China, the world’s biggest grain producer starts to curb overseas sales of wheat, corn and rice
2010 onwards China started to import the equivalent of 40% of US corn exports.
Vietnam, the world’s 3rd biggest rice exporter, restricts rice exports to slow inflation.
Egypt bans rice exports.
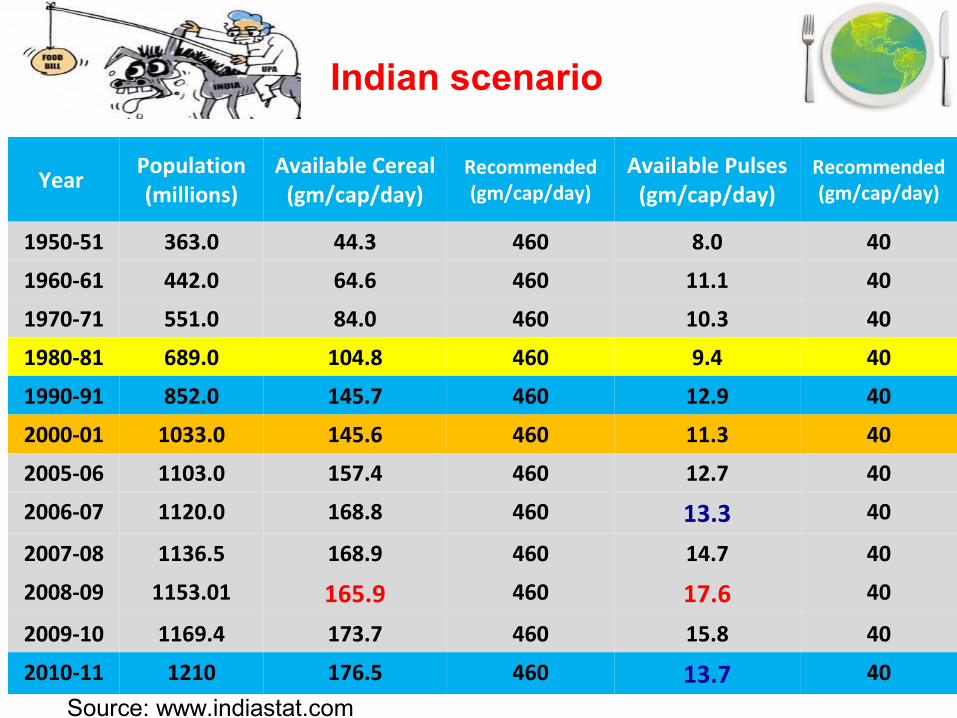
Indian scenario
Source: www.indiastat.com
Year Population (millions)
Available Cereal(gm/cap/day)
Recommended(gm/cap/day)
Available Pulses(gm/cap/day)
Recommended(gm/cap/day)
1950-51 363.0 44.3 460 8.0 40
1960-61 442.0 64.6 460 11.1 40
1970-71 551.0 84.0 460 10.3 40
1980-81 689.0 104.8 460 9.4 40
1990-91 852.0 145.7 460 12.9 40
2000-01 1033.0 145.6 460 11.3 40
2005-06 1103.0 157.4 460 12.7 40
2006-07 1120.0 168.8 460 13.3 40
2007-08 1136.5 168.9 460 14.7 40
2008-09 1153.01 165.9 460 17.6 40
2009-10 1169.4 173.7 460 15.8 40
2010-11 1210 176.5 460 13.7 40
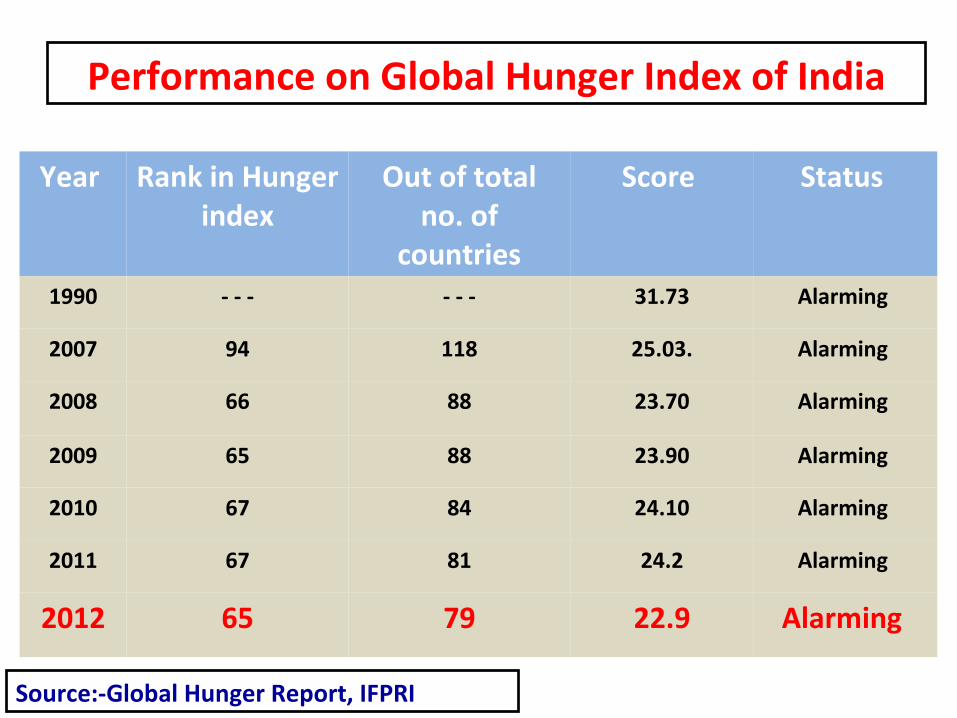
Year Rank in Hunger index
Out of total no. of
countries
Score Status
1990 - - - - - - 31.73 Alarming
2007 94 118 25.03. Alarming
2008 66 88 23.70 Alarming
2009 65 88 23.90 Alarming
2010 67 84 24.10 Alarming
2011 67 81 24.2 Alarming
2012 65 79 22.9 Alarming
Source:-Global Hunger Report, IFPRI
Performance on Global Hunger Index of India
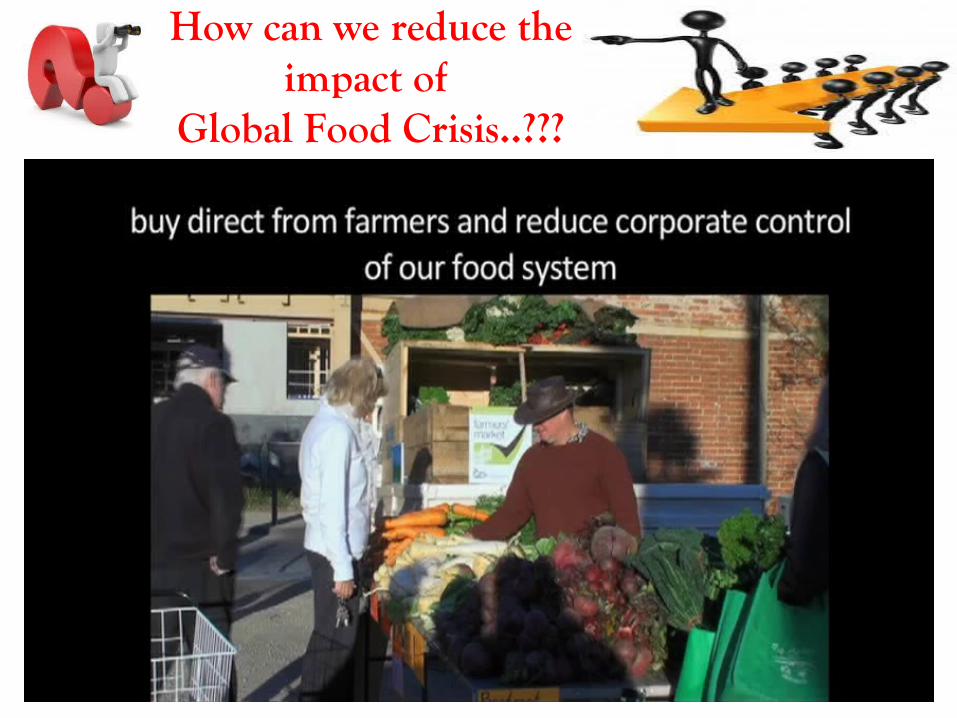
How can we reduce the impact of
Global Food Crisis..???

Future Prospects
Higher food prices and greater attention to food now would certainly stimulate
production
There is scope to raise production through area expansion in Europe and
North America, and a productivity increase in developing Asia and Eastern
Europe.
The pressure to use grain for biofuel as an alternative to hydrocarbon energy
is going to increase.
Precautionary measures like
export bans and rationing in various
countries have exacerbated the price
increase
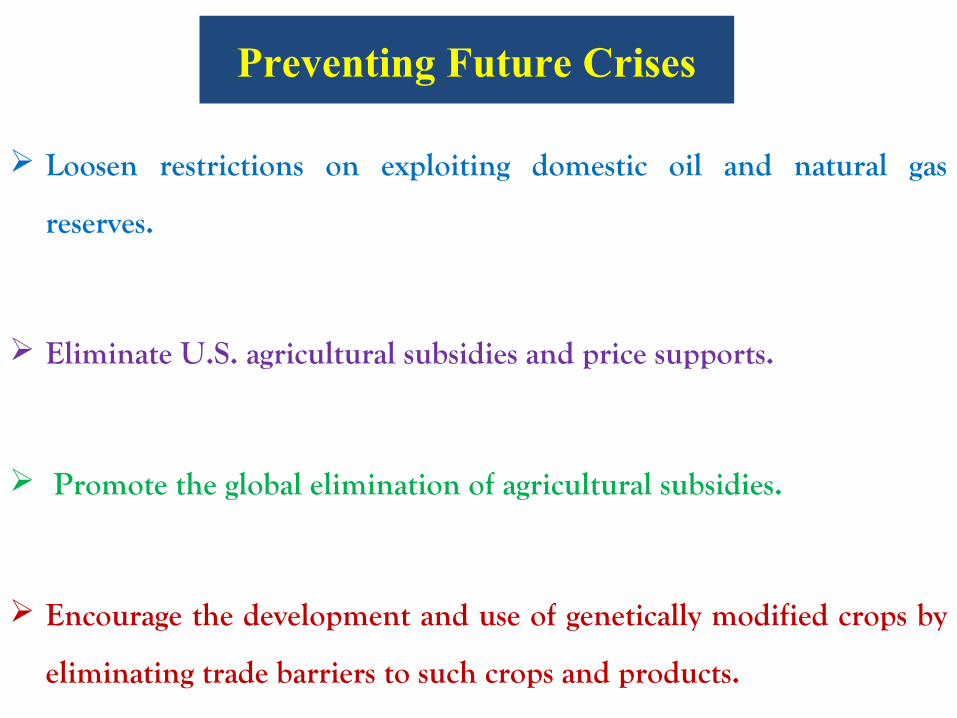
Preventing Future Crises
Loosen restrictions on exploiting domestic oil and natural gas
reserves.
Eliminate U.S. agricultural subsidies and price supports.
Promote the global elimination of agricultural subsidies.
Encourage the development and use of genetically modified crops by
eliminating trade barriers to such crops and products.


Seminar ends here,
But, what about the Global Food Crisis . . ? ???
Think on.... .!!!!!Our food system is broken.!We need to fix it..!!
We must....!!!
Thank youThank you