global economic prospects - world banksiteresources.worldbank.org/intgep/resources/... · simple...
TRANSCRIPT

Global Global Global
Economic Economic Economic
ProspectsProspectsProspects
Volume 3Volume 3Volume 3 | June 2011| June 2011| June 2011
The World Bank

© 2011 The International Bank for Reconstruction and Development / The World Bank
1818 H Street NW
Washington DC 20433
Telephone: 202-473-1000
Internet: www.worldbank.org
E-mail: [email protected]
All rights reserved
1 2 3 4 13 12 11 10
This volume is a product of the staff of the International Bank for Reconstruction and Development /
The World Bank. The findings, interpretations, and conclusions expressed in this volume do not neces-
sarily reflect the views of the Executive Directors of The World Bank or the governments they represent.
The World Bank does not guarantee the accuracy of the data included in this work. The boundaries, col-
ors, denominations, and other information shown on any map in this work do not imply any judgment on
the part of The World Bank concerning the legal status of any territory or the endorsement or acceptance
of such boundaries.
Rights and Permissions
The material in this publication is copyrighted. Copying and/or transmitting portions or all of this work
without permission may be a violation of applicable law. The International Bank for Reconstruction and
Development / The World Bank encourages dissemination of its work and will normally grant permis-
sion to reproduce portions of the work promptly.
For permission to photocopy or reprint any part of this work, please send a request with complete infor-
mation to the Copyright Clearance Center Inc., 222 Rosewood Drive, Danvers, MA 01923, USA; tele-
phone: 978-750-8400; fax: 978-750-4470; Internet: www.copyright.com.
All other queries on rights and licenses, including subsidiary rights, should be addressed to the Office of
the Publisher, The World Bank, 1818 H Street NW, Washington, DC 20433, USA. fax: 202-522-2422;
e-mail: [email protected].

3
Global Economic Prospects
Maintaining progress amid turmoil
June 2011

4
Acknowledgments
This report is a product of the Prospects Group in the Development Economics Vice Presidency of the World Bank.
Its principal authors were Andrew Burns and Elliot (Mick) Riordan.
The project was managed by Andrew Burns, under the direction of Hans Timmer and the guidance of Justin Yifu
Lin. Several people contributed substantively to the report. The modeling and data team was lead by Theo Janse van
Rensburg assisted by Irina Kogay, Sabah Zeehan Mirza and Betty Dow. The projections, regional write-ups and
subject annexes were produced by Dilek Aykut (Finance), John Baffes (Commodities) Annette De Kleine (South
Asia), Allen Dennis (Sub-Saharan Africa, International Trade), Eung Ju Kim (Finance), Theo Janse van Rensburg
(East Asia & Pacific), Elliot (Mick) Riordan (Middle-East & North Africa), Cristina Savescu (Latin America &
Caribbean, Inflation, Industrial Production), Shane Streifel (Commodities), and Lucio Vinhas de Souza (Europe &
Central Asia). Regional projections and annexes were produced in coordination with country teams, country direc-
tors, and the offices of the regional Chief Economists and PREM directors. In particular, the draft benefitted from
the invaluable insights and inputs offered by our colleagues from the Middle-East and North Africa region during
this volatile and uncertain period . The short-term commodity price forecasts were produced by John Baffes, Betty
Dow, and Shane Streifel. The remittances forecasts were produced by Sanket Mohapatra,
The accompanying online publication, Prospects for the Global Economy, was produced by a team led by Nadia
Islam Spivak and Sarah Crow, and comprised of Betty Dow, Augusto Clavijo, Kathy Rollins, and Sachin Shahria
with technical support from David Horowitz and Roula Yargiz. The translation process was coordinated by Jorge
del Rosario (French and Spanish) and Li Li (Chinese).
Rebecca Ong and Merrell Tuck-Primdahl managed media relations and the dissemination. Hazel Macadangdang
managed the publication process.
Several reviewers offered extensive advice and comments. These included Otaviano Canuto, Jorg deCressin, Doerte
Doemeland, Shahrokh Fardoust, Marianne Fay, Kalpana Kochlar, David Rosenblatt, Sergio Schmukler, Phil Suttle,
Hans Timmer, Robert Townsend, and Volker Trichiel.

The global financial crisis is no longer the major force dictating the pace of economic activity in developing countries. The majority of developing countries have, or are close to having regained full-capacity activity levels. As a result, country-specific productivity and sectoral factors are now the dominant factors underpinning growth.
Macroeconomic policy in developing countries needs to turn toward medium-term productivity enhancements, managing inflationary pressures re-establishing the fiscal and monetary cushions that allowed most developing countries to come through the crisis so well. In contrast, activity in high-income and some developing European countries continues to struggle with crisis-related problems, including banking-sector, fiscal and household restructuring.
The earthquake and tsunami in Japan and the political turmoil in the Middle-East and North Africa have contributed to a modest slowing in global industrial production and trade. Nevertheless, global activity is expanding significantly faster than its long-term trend rate. Indicators point to some further slowing in the second quarter of 2011, as the expansion slows toward a more sustainable pace.
Global growth is projected to remain strong from 2011 through 2013. After expanding 3.8 percent in 2010, global GDP is projected to slow to 3.2 percent in 2011 before firming to a 3.6 percent pace in each of 2012 and 2013, (4.8, 4.3, 4.4 and 4.5 over 2010 to 2013) percent when aggregated using purchasing power parities) (table 1).
Policy tightening and the earthquake in Japan, among other factors, are projected to reduce growth in high-income countries to 2.2 percent in 2011. Subsequently, the expansion is expected to firm to near 2.6
percent in 2012 and 2013, as the negative effects of household, banking and government budget consolidation begin to fade and rebuilding in Japan intensifies. Excluding Japan, high-income growth will be more stable, slowing only marginally in 2011 and strengthening to 2.7 percent in 2012 and 2013.
As output gaps close , aggregate growth in developing economies is projected to ease to a still strong 6.3 percent pace in 2011 through 2013—broadly in-line with these countries’ underlying potential growth rate. The good performance is broadly-based with non-BRIC countries projected to grow by around 4.5 percent (3 or more percent in per capita terms).
Robust domestic demand growth in developing countries has supported output in high income countries, but has accentuated capacity constraints in some domestic markets and in global energy and metals markets. Low–and middle-income countries were responsible for 46 percent of global growth in 2010. Importantly, they were responsible for more than all the increase in global oil and metals demand over the past 5 years, and their growth was, therefore, responsible for much of the rise in global inflation. In addition, still loose policies and ample global credit flows have contributed to domestic inflation pressures and asset price bubbles in some middle-income countries.
Both monetary and fiscal policy in developing countries may have to tighten more quickly to curb these pressures. While macro-policy is tightening, a more rapid tightening of fiscal and monetary policy and more exchange rate flexibility may be required to avoid overheating and keep inflation in check. More discretionary tightening would also help re-establish the macro-policy cushions that enabled countries to
Global Economic Prospects June 2011:
Maintaining progress amid turmoil
Overview & main messages

2
Table 1 The Global Outlook in summary
(percent change from previous year, except interest rates and oil price)
Global Economic Prospects June 2011
2009 2010e 2011f 2012f 2013f
Global Conditions
World Trade Volume (GNFS) -11.0 11.5 8.0 7.7 7.7
Consumer Prices
G-7 Countries 1,2 -0.2 1.2 1.9 1.7 1.9
United States -0.3 1.6 2.2 2.1 2.5
Commodity Prices (USD terms)
Non-oil commodities -24.1 27.6 20.7 -12.0 -9.4
Oil Price (US$ per barrel) 3 61.8 79.0 107.2 102.1 98.7
Oil price (percent change) -36.3 28.0 35.6 -4.8 -3.3
Manufactures unit export value 4 -5.6 2.5 4.9 -3.2 0.3
Interest Rates
$, 6-month (percent) 1.2 0.5 0.7 1.2 2.2
€, 6-month (percent) 1.5 1.0 1.6 2.1 2.4
International capital flows to developing countries (% of GDP)
Developing countries
Net private and official inflows 3.9 4.8
Net private inflows (equity + debt) 3.4 4.4 3.9 3.8 3.8
East Asia and Pacific 3.6 5.0 4.2 3.8 3.6
Europe and Central Asia 2.2 3.5 4.0 4.1 3.9
Latin America and Caribbean 3.7 4.8 4.3 4.2 4.1
Middle East and N. Africa 2.7 2.3 0.3 1.7 2.1
South Asia 4.2 3.8 4.8 4.5 4.5
Sub-Saharan Africa 3.9 3.7 3.9 4.2 5.0
Real GDP growth 5
World -2.2 3.8 3.2 3.6 3.6
Memo item: World (PPP weights) 6 -0.8 4.8 4.3 4.4 4.5
High income -3.4 2.7 2.2 2.7 2.6
OECD Countries -3.5 2.6 2.1 2.6 2.5
Euro Area -4.1 1.7 1.7 1.8 1.9
Japan -6.3 4.0 0.1 2.6 2.0
United States -2.6 2.8 2.6 2.9 2.7
Non-OECD countries -1.9 4.2 4.3 4.8 4.9
Developing countries 1.9 7.3 6.3 6.2 6.3
East Asia and Pacific 7.4 9.6 8.5 8.1 8.2
China 9.1 10.3 9.3 8.7 8.8
Indonesia 4.6 6.1 6.3 6.5 6.5
Thailand -2.3 7.8 3.7 4.2 4.3
Europe and Central Asia -6.4 5.2 4.7 4.4 4.6
Russia -7.8 4.0 4.4 4.0 4.1
Turkey -4.8 8.9 6.1 5.1 5.3
Romania -7.1 -1.2 1.6 3.7 4.0
Latin America and Caribbean -2.1 6.0 4.5 4.1 4.0
Brazil -0.7 7.5 4.2 4.1 3.8
Mexico -6.1 5.5 4.4 4.1 4.2
Argentina 0.9 9.2 6.3 4.2 4.3
Middle East and N. Africa 2.8 3.1 1.9 3.5 4.0
Egypt 4.7 5.2 1.0 3.5 5.0
Iran 0.1 1.0 0.0 3.0 3.0
Algeria 2.4 3.3 3.7 3.6 3.5
South Asia 6.2 9.3 7.5 7.7 7.9
India 7, 8 9.1 8.8 8.0 8.4 8.5
Pakistan 7 3.6 4.1 2.5 3.9 4.3
Bangladesh 7 5.7 5.8 6.2 6.4 6.6
Sub-Saharan Africa 2.0 4.8 5.1 5.7 5.7
South Africa -1.8 2.8 3.5 4.1 4.4
Nigeria 6.7 7.9 7.1 7.5 7.3
Angola 2.4 3.4 6.7 8.1 7.8
Memorandum items
Developing countries
excluding transition countries 3.1 7.8 6.5 6.4 6.5
excluding China and India -1.8 5.5 4.5 4.5 4.6
7
8
Source: World Bank.
Notes: PPP = purchasing power parity; e = estimate; f = forecast.
1. Canada, France, Germany, Italy, Japan, the UK, and the United States.
2. In local currency, aggregated using 2005 GDP Weights.
3. Simple average of Dubai, Brent and West Texas Intermediate.
4. Unit value index of manufactured exports from major economies, expressed in USD.
5. Aggregate growth rates calculated using constant 2005 dollars GDP weights.
6. Calculated using 2005 PPP weights.
In keeping with national practice, data for India, Pakistan and Bangladesh are reported on a fiscal year basis in Table 1.1. Aggregates that
depend on these countries, however, are calculated using data compiled on a calendar year basis.
Real GDP at market prices. GDP growth rates calculated using real GDP at factor cost, which are customarily reported in India, can vary
significantly from these growth rates and have historically tended to be higher than market price GDP growth rates. Growth rates stated on
this basis, starting with FY2009-10 are 8.0, 8.5, 8.2, 8.5, and 8.6 percent – see Table SAR.2 in the regional annex.

3
counteract so effectively the cyclical effects of the financial crisis.
Although solid growth led by developing-countries is the most likely outcome going forward, high food prices, possible additional oil-price spikes, and lingering post-crisis difficulties in high-income countries pose downside risks.
Further increases in food and fuel prices cannot be ruled out. Although prices are expected to moderate, supply conditions remain tight.
A worsening of conditions in the Middle-East and North Africa could derail global growth. If oil prices were to rise sharply and durably — either because of increased uncertainty or due to a significant disruption to oil supply, global growth could be reduced by around 0.5 percentage points.
A poor harvest during the 2011/12 crop year, or a second substantial increase in oil prices could cause domestic food prices in developing countries to rise much higher, with dire consequences for poverty.
Domestic food prices may come under upward pressure in many countries. Since June 2010, local food prices in developing countries increased 7.9 percent—much less than the 40 percent surge in international dollar prices. International prices are expected to moderate in the second half of 2011 and into 2012/13. However, if crops disappoint or oil prices (an important cost-side determinant of food prices) rise, lagged pass through of high international prices could see local food prices increase further — with important negative impacts for poverty in many developing countries.
Concerns about fiscal sustainability in high-income countries persist. High fiscal deficits and rising sovereign debt pose medium-term challenges to a wide-range of OECD countries (gross sovereign debt is projected to reach 103 percent of OECD GDP in 2012). Although steps being taken by authorities to resolve short-term problems
in the euro-zone should prevent an acute crisis, a loss of confidence such as envisioned in ECB stress-test scenarios could have large (but manageable) negative implications for developing countries.
Further financial stresses may emerge, as monetary policy in high-income countries begins to tighten. As short– and long-term interest rates and re-financing costs rise, both banks and firms may find their balance sheets coming under renewed pressure — requiring additional measures to address shortcomings.
The remainder of this report is organized as follows. The next section discusses recent developments in global production, trade, inflation, and financial markets, and presents updates of the World Bank’s forecast for the global economy and developing countries. This is followed by a more detailed discussion of some of the risks and tensions in the current environment, and a short section of concluding remarks. Several annexes address regional and sectoral issues in much greater detail.
Recent economic developments
The global recovery continued robustly during the final months of 2010 and into early 2011. Vibrant domestic demand in developing countries, still loose macro policy, reduced drag on growth from a recovering financial sector, and improved labor market conditions in several high-income economies helped to overpower the influence of a gradual tightening of monetary and fiscal policies, rising commodity prices, the political turmoil in the Middle-East and North Africa, and the natural disaster and nuclear catastrophe in Japan
The recovery in industrial activity is progressing at a moderate pace
Recent developments in industrial production is described in more detail in the industrial production
annex (http://go.worldbank.org/6J3VPK07S2).
After marking a pause in the third quarter of
2010, industrial production in both high-income-
and developing countries expanded at a more-
than 15 percent annualized rate (3m/3m, saar)
toward the end of 2010. Output once again
Global Economic Prospects June 2011

4
began to slow in the first quarter of 2011 (first
panel, figure 1). The recent fading in world
industrial production growth from a 15 percent
3m/3m annualized pace in February to 8.5
percent in March reflects the 15 percent decline
in Japanese production in March, and similar
declines in Egypt and Tunisia. Excluding these
countries, momentum growth in the rest of the
world was 10.3 percent, well above the longer-
term trend growth rate of just under 3 percent.
Among developing countries, the pickup in
production has been broadly-based, but also
quite differentiated, with output expanding 19
percent in East Asia & the Pacific during the
first quarter of 2011 (saar)—this rate
subsequently slipped to 15 percent in April; in
Latin America & the Caribbean, growth has
maintained a 10 percent pace. In contrast,
developing Europe & Central Asia has seen
momentum dip from 10 percent in March to 3.8
percent by April (saar). Though production in
South Asia was weak in the fourth quarter of
2010, it picked up pace into the first quarter —
expanding at a 9 percent rate. Data for Sub-
Saharan Africa are sparse, but industrial
production was increasing at a modest 2.1
percent pace at the end of 2010 in the 4 Sub-
Saharan African countries for which industrial
production data are available.
Based on the limited recent data available for
industrial production in the Middle-East and
North Africa, the political turmoil in the region
has had a notable impact on activity. In Tunisia
production dropped 18.8 percent between
December 2012 and February 2011, but has
picked up 8 percent in March; still, output stands
9 percent lower in the first quarter of 2011
versus year earlier levels. As of February 2011,
industrial activity in Egypt was down 20 percent
from December 2010 levels and 14.4 percent
from a year earlier.
Post-earthquake data for Japan indicate a sharp
contraction of activity in that country. Industrial
production declined 15.5 percent in March on a
seasonally adjusted basis, while consumer
demand has also drawn back as individuals
conserve energy and moderate consumption in
solidarity with disaster victims. Retail sales in
March were 8.5 percent lower than a year before,
while machinery and equipment sales were off
17 percent. Overall, preliminary estimates
suggest that GDP declined by 3.7 percent in the
first quarter of 2011 (saar), although much of
that decline appears to reflect a fall in
inventories (box 1).
Figure 1 Industrial production has been more volatile than global demand
Inventory cycle in manufactured goods makes IP more volatile
Global industrial production slowing once again than underlying demand
Source: World Bank, Thomson/Reuters.
-30
-25
-20
-15
-10
-5
0
5
10
15
20
2009M01 2009M05 2009M09 2010M01 2010M05 2010M09 2011M01
Developing
High-income
World
industrial production, ch% 3m/3m, saar
-25
-20
-15
-10
-5
0
5
10
15
20
-10
-8
-6
-4
-2
0
2
4
6
Q1-08 Q3-08 Q1-09 Q3-09 Q1-10 Q3-10 Q1-2011
World real GDP growth, quarterly ch% q/q saar. Sample of 50 high-income and developing countries
GDP left
IP right
Global Economic Prospects June 2011

5
Box 1 Short-term impact of the disaster in Japan
Official estimates place the damage from the
March 11 earthquake and tsunami at between 3
and 5 percent of Japanese GDP, directly affect-
ing a region that represents about 4 percent of
Japanese GDP and 4.5 percent of its population.
Some 450 thousand people have been left home-
less, and more than 20,000 may have died. Al-
though in some respects, the disaster is similar
in scale to the Kobe earthquake of 1995, notable
differences include the nuclear crisis, the addi-
tional loss of life and property damage attribut-
able to the tsunami (see box table). In particular,
the disaster has damaged an estimated 7.3 per-
cent of Japan’s power supply, about 3.8 percent
due to disrupted thermal generation and 3.5 per-
cent from nuclear. In addition about 2 percent of the county’s distribution substations were damaged (table). The
lost thermal capacity is expected to be fully restored by May, while lost nuclear capacity may be permanent. Cur-
rently, generating capacity in the Tokyo area, which represents about 40 percent of Japanese GDP, exceeds de-
mand levels by almost 20 percent— partly because of voluntary conservation efforts. At the peak of the crisis ca-
pacity was reduced by 40 percent. TEPCO now expects to have 55m KW-hours of capacity in place by the end of
July, approximately 87 percent of peak summer demand. For Japan as a whole, the projected shortfall represents
3.8 percent of generating capacity (TEPCO, 2011).
Although the Kobe disaster had little impact on Japan’s
GDP growth, the current crisis is expected to cut into
growth more sharply. Following Kobe, industrial produc-
tion fell marginally. Both imports and exports declined by 2
percent for two months, but bounced back in the third, and
GDP growth in the quarter of the earthquake was subdued
but positive — in part because of a sustained increase in
government spending of between 1 and 2 percent of GDP.
As a result, GDP growth came in at 1.9 percent, a full per-
cent point higher than the preceding year, and about 0.4
percent above estimates of the economy’s productive poten-
tial at that time (figure).
The impacts from this year’s disaster are more serious. In-
dustrial production in March was down 15.5 percent from February, in part because of electricity disruption and
the pull-back in consumer spending that has been associated with the first weeks of the post-crisis period. Retail
sales during March were down 8.5 percent from a year ago, while machinery and business equipment sales were
down 17 percent. For the car industry, disruptions are expected to last until the end of the second quarter of 2011,
potentially reducing output by one-half. GDP is estimated to have fallen 3.7 percent in the first quarter and uncer-
tainty is large, many are now expecting second-quarter GDP to decline by a further 3-7 percent (annualized rates),
before reconstruction efforts overcome the effects of economic disruption and cause growth to rebound. Regional
impacts so far have been limited, with slower growth in the initial quarter of at most 0.5 percentage points for
countries with closest trade ties (Malaysia, Vietnam and Thailand).
Should the nuclear situation deteriorate, or if nuclear pollution already having occurred requires an extended clean
-up effort, longer-term impacts could be envisaged. Using Chernobyl as a model (a 50 km exclusion zone was put
in place, some 400 thousand people would be permanently displaced, and some 3 percent of Japanese agricultural
production lost (4 percent of Japanese and 0.1 percent of global rice production).
Kobe had no noticeable impact on growth
Source: Japanese statistical bureau.
-4
-3
-2
-1
0
1
2
3
4
5
6
7
Q1 1993 Q3 1993 Q1 1994 Q3 1994 Q1 1995 Q3 1995 Q1 1996 Q3 1996
Quarterly growth (saar)
y-o-y growth
Japanese GDP growth before and after Kobe
Kobe earthquake,January 11 1995
Percent
Impacts of the 1995 Kobe and 2011 Tohoku earthquakes
Source: World Bank; Various press reports and official estimates.
Kobe Tohoku
17-Jan-95 11-Mar-11
Dimension of tragedy
- size of tremor (Richter scale) 7.3 9.1
- Lives lost 6434 15,202
- Missing 8,718
- people left homeless 300,000 450,000
- Estimated Property Damage (% of GDP) 2.5 4-5
- Initial disruption to power system (% of generating capacity) 7.3
- Medium-term disruption to power system (% gen. cap.) 3.8
- Industrial production growth (month of disaster) -0.1 -15.3
- Quarterly GDP growth (quarter of disaster) 2.9 -3.7
Global Economic Prospects June 2011

6
The expansion of global demand has been
more stable
Recent developments in trade is described in more detail in the prospects for trade annex (http://
go.worldbank.org/2OPGGNPVD0).
The recovery in aggregate demand has been
more stable than that of industrial production
(second panel, figure 1). GDP for the 50 high-
income and developing countries for which
quarterly data are available indicates that
aggregate demand continued to expand during
the last half of 2010 and into the first quarter of
2011 — albeit at a slower and more sustainable
pace than earlier. The relative stability of
demand viz-a-viz industrial production, partly
reflects the concentration of the real-side effects
of the crisis in durables consumption and
investment goods, but the mid-2010 pause in
industrial activity is also consistent with a sharp
inventory cycle. An initial period of de-stocking
during the acute phase of the crisis forced a rapid
resumption of activity to meet gradually
strengthening demand and to rebuild inventories.
This re-stocking may have overshot demand,
resulting in a pause in industrial activity growth
at mid year. But by the final quarter of 2010,
demand had caught up and industrial activity
growth accelerated once more.
World trade has also bounced back
Reflecting the high content of manufactures in
global trade, the recovery in world merchandise
export and import volumes also paused during
the middle of 2010, but is now expanding at a
moderate to strong pace across economies.
Importantly, demand from developing countries
was responsible for more-than 50 percent of the
increase in global import volumes (first panel,
figure 2). Strong developing-country import
expenditures partly reflect robust domestic
demand growth in these economies. Global retail
sales have posted positive growth rates for the
past 20 months of between 7 and 10 percent
(3m/3m, saar), outstripping that of high-income
countries by a factor of 2 (second panel, figure
2). The main beneficiaries of expanding demand
for tradables have been high-income countries,
whose exports were expanding at a still strong
15 percent annualized rate in the first quarter of
2011, down from close to 20 percent at the end
of 2010.
Developing country exporters also benefitted
from the uptick in global demand, with their
export volumes expanding at a 12.1 percent
annualized rate in the three months ending
March 2011. South Asian exports have been
particularly strong, with volumes up more than
30 percent from their year-earlier levels, driven
by sales to China and the rest of East Asia.
Exports from Europe and Central Asia have
grown rapidly, notably in Russia, where they
have expanded at more-than a 17 percent
annualized pace (supported by energy exports),
and in Romania and Turkey (reflecting stronger
Figure 2. Robust domestic demand causes Developing country imports to lead the rebound in trade
Contributions to global merchandise import growth,
% change 3m/3m saar Retail sales growth, GDP-weighted 3m/3m saar
Source: World Bank. Thomson Datastream.
-10.0
-5.0
0.0
5.0
10.0
15.0
20.0
25.0
30.0
35.0
2010M01 2010M03 2010M05 2010M07 2010M09 2010M11
Rest of Developing countries
China
Germany
USA
Rest of HIY
World
Contributions to global merhcandise import growth. % change 3m/3m, saar
-10
-5
0
5
10
15
20
25
Jan-06 Oct-06 Jul-07 Apr-08 Jan-09 Oct-09 Jul-10
High-income
China
Developing countries, excl China
percent, y/y
Global Economic Prospects June 2011

7
high-income European investment and consumer
demand). In Latin American and the Caribbean,
Brazilian exports had been growing briskly in
response to continued strong East Asian demand,
but growth has eased to 12 percent as of April
(saar). And the expansion has been less robust in
Argentina and Chile. Overall exports from the
region have been expanding at a 9.3 percent
annualized pace during thee three months ending
March 2011 (saar).
Both trade and industrial production have reached — or are close to recovering — trend levels
Recovery in industrial production has brought
developing country output more-than 20 percent
above its pre-crisis August 2008 levels (first
panel, figure 3), while production in high-
income countries is now about 2.5 percent below
that level, and some 9 percent below peaks of
February 2008 (trade volumes have also
recovered pre-crisis levels)1.
Industrial output in China is more than 40
percent above its pre-crisis peak, and 36 percent
higher for the East Asia region considered as a
whole. After booming during the first half of
2010, output growth in South Asia slowed
toward the end of 2010. Nevertheless, output
stands 24 percent higher than before the crisis.
Among other developing regions, Europe and
Central Asia had eclipsed pre-crisis levels by 5
percent as of March; while Sub-Saharan African
production now stands 2.5 percent below.
Compared with levels of output that might have
been expected had there been no crisis2,
significant gaps remain. Gaps are especially
large among high-income countries because
these economies were most directly affected by
the financial crisis (second panel, figure 3).
Among developing regions, the gap with pre-
crisis trends is largest for Europe & Central Asia
(13.8 percent), partly reflecting unsustainably
high pre-crisis growth rates and the severity of
the post-crisis adjustment underway in those
economies. The shortfall in both the Middle East
& North Africa and Sub-Saharan Africa is
estimated to be close to 10 percent (partly
reflecting the recent political turmoil), while the
gap has closed in East Asia & the Pacific, South
Asia, and Latin America & the Caribbean.
Overall, the recovery is well advanced in many
developing countries and industrial capacity
constraints have become increasingly binding.
Whole economy output gaps for 2011, the
difference between actual and potential GDP, are
expected to be less than one percent in 72
countries, 64 percent of the developing
economies outside of Europe and Central Asia
for which data exist (figure 4). Output gaps
among high-income countries are larger, with 45
percent of high-income countries facing a
negative output gap of more-than 2 percent.
Figure 3. Industrial production has recovered pre-crisis trends in many developing countries
Source: World Bank, Thomson/Datastream.
80
85
90
95
100
105
110
115
120
Jan-06 Aug-06 Mar-07 Oct-07 May-08 Dec-08 Jul-09 Feb-10 Sep-10
industrial production, August-2008=100
Developing countries
DEV excluding China High-income countries
2.5
-13.8 -11.9-9.2
0.7 3.2 4.4
-60
-40
-20
0
20
40
60
Developing Europe & Central Asia
Middle East & N. Africa
Sub-Saharan Africa
Latin Am. & Caribbean
South Asia East Asia & Pacific
median percentage difference from long term trendand within-region range
Global Economic Prospects June 2011

8
The rise in international fuel, metals and food prices
Recent developments in, and prospects for, these markets are described in more detail in the commodity
annex (http://go.worldbank.org/5KM5S6POA0 ).
Strong GDP growth and the elimination of spare
capacity in major developing economies has
contributed to a sharp increase in the prices of
metals and oil (box 2) during the second half of
2010 (first panel, figure 5) and into the first
months of 2011. Higher energy prices have in
turn contributed to increased fertilizer and
agricultural production costs, which in
combination with supply shortfalls in several
markets caused food prices to spike in the
second half of 2010 in the face of only gradually
rising demand (box 3).
As of early 2011, prices of internationally traded
food commodities reached levels just below
peaks observed during the 2008 food crisis.
However, the overall price of grains — the most
critical food component from a poverty
standpoint3— did not increase as much as in
2008, mainly because international rice prices
remained broadly stable (second panel, figure 5).
Since February, commodity prices have
stabilized or declined, reflecting weakening
demand and perhaps profit taking by institutional
investors. Prices are off earlier peaks by between
3 and 10 percent for the main aggregates.
Figure 4 Growing capacity constraints are contributing to rising inflation in some countries
(Estimated % difference between actual and potential GDP in 2011)
Source: World Bank.
Figure 5 Commodity prices have recovered much of the losses observed since the financial crisis
Source: World Bank.
0
50
100
150
200
250
300
Jan-05 Sep-05 May-06 Jan-07 Sep-07 May-08 Jan-09 Sep-09 May-10 Jan-11
Energy
Food
Metals and Minerals
Real commodity pruices, index Jan 200-5=100, USA CPI def latedtext
50
75
100
125
150
175
200
225
250
275
300
325
350
Jan-00 Jan-01 Jan-02 Jan-03 Jan-04 Jan-05 Jan-06 Jan-07 Jan-08 Jan-09 Jan-10 Jan-11
Rice
Wheat
Maize
Real grain prices, January 2005=100
Global Economic Prospects June 2011

9
While supply shocks played a central role in
explaining the sharp rise in grain prices in the
second half of 2010 (box 3), the trend rise in
food and other agricultural prices since the turn
of the century reflects among other things rising
fuel, transportation and fertilizer costs as well as
increased demand from biofuels (Timilsina and
Shresha, 2010).
Typically, a sustained 10 percent increase in
energy prices yields a 2-3 percent increase in the
long-run price of most foods (Baffes, 2010),
with this relationship being stronger in high-
income countries that use particularly energy–
intensive technologies and lower in countries
where less fuel and fertilizer is used, e.g. in Sub-
Saharan Africa. Bearing these relationships in
Box 2 Strong demand from developing countries driving up prices of extractive commodities
Strong demand by developing countries (notably China) is shaping the markets for extractive commodities, and
has contributed to the rise in their prices during the post-crisis period.
Developing countries now account for almost 1/2 of global crude oil demand
More than all of the net increase in global oil demand over the past 5 years has come from developing countries
(oil demand in high-income OECD countries peaked in 2005:Q4 and has since declined by 3.7 mb/d), with de-
mand for oil by developing countries growing by more than 4.1 percent per annum over the past 5 years. Non-
OECD countries now consume 47 percent of global oil production, up from 25 percent in 1970, with more than
two thirds of that amount going to countries other than China and India (their global shares are 10.4 percent and
3.8 percent, respectively).
Crude oil prices began rising during the fourth quarter of 2010 despite ample supplies and spare capacity, boosted
by strong demand from developing countries, declining stocks and expectations of future supply tightness. This
trend was exacerbated toward the end of the year and into 2011, as political turmoil in the Middle East and North
Africa disrupted oil deliveries from the region (notably the shutting out of some 1.3mb/d of sweet, distillate-rich
Libyan crude-oil exports4) and fears of further possible disruptions in the region.
Although fraught with uncertainty, estimates suggest that the supply loses in North Africa added about $15 to the
price of a barrel of oil. Assuming no further supply disruptions and a gradual reduction in uncertainty arising from
the political situation in the Middle-East and North Africa, oil prices are expected to ease in the second half of
2011, averaging $107/bbl for the year as a whole, before declining further in 2012 and 2013 toward a real price of
80 2011 U.S. dollars per barrel, consistent with long-term demand and supply conditions.
Chinese demand dominates metals markets
In 2009, China overtook the OECD as the world's largest metal consumer, now consuming more than 40 percent
of global metal supplies. Chinese metal demand growth over the past decade has served to single-handedly the
metals intensity of global GDP (tons of metals used to produce a unit of GDP). As of 2004, increased metals de-
mand had reversed 30 years of declining metal content of global GDP due to technological change and increased
consumption of services (World Bank, 2008).
Although metals and minerals prices declined sharply with the financial crisis, many now exceed their pre-crisis
peaks. Prices have risen the most for supply-constrained metals, such as copper and tin (up 460 and 590 percent
from their average levels in 2000/03), while despite stronger demand growth, other metal prices have increased
less rapidly due to ample supply (aluminum for example, is up 86 percent over the same period despite stronger
demand growth).
Prices for a number of metals appear to have peaked in February 2011, reflecting weaker demand growth, rising
inventories and strong supply. In those few cases where future prices exceed spot prices, a large portion of stocks
are tied up in warehouse financing arrangements and not available to the market — which has given an appearance
of market tightness that has helped support prices5.
Mainly reflecting price increases already observed, metals prices in 2011 are expected to average 17 percent
higher than in 2010 before they begin to decline in 2012, as additional supply and demand-side substitution eases
market pressures. While metals markets are generally less concentrated than oil markets (and therefore less open to
cartel-like pricing) future supply and prices will remain sensitive to labor disputes and energy costs.
Global Economic Prospects June 2011

10
mind, most of the 58 percent increase in the
average price of food between the periods
1986/03 and 2004/10 can be explained by the
245 percent increase in the price of oil during
that period (figure 6).
Once the short-term supply-shortage induced
component of current high food prices
dissipates; and assuming (i) that energy prices
ease as discussed in box 2, and (ii) that 2011/12
is a normal crop year, then long-run equilibrium
food prices should also tend to decline over the
next few years. Nevertheless, food prices are
anticipated to remain substantially higher than
during the late 1990s — largely reflecting higher
fuel and fertilizer costs. In the baseline
projection, wheat, maize and rice prices are
expected to decline in 2012 to roughly the same
Box 3 Understanding the recent rise in global agricultural prices
The rapid rise of global agricultural prices in the latter half of 2010 and into 2011 reflects a combination of factors.
Some agricultural commodities are used as raw materials, and demand and capacity constraints for these picked up
in the second half of 2010, leading to sharp increases in, for example, cotton (up 147 percent since June 2010) and
rubber (up 158 percent).
The rise in food prices was broadly based. Unlike the 2008
food-price spike, when almost half (48 percent) of the increase
in the overall food index was due to rising grain prices, this
time rising fats and oils prices were responsible for the bulk
(40 percent) of the increase in the aggregate index. The main
drivers of the run-up in internationally traded food prices in the
second half of 2010 were poor grain crops and low inventories.
While demand for food continued to rise, thereby contributing
to market tightness, there was no major change in this trend,
and indeed demand growth for most major food groups is
slowing (see box 4).
World wheat production in the 2010/11 crop year is estimated
to have declined by 5.3 percent, mainly due to a 25 percent
shortfall in Russian output; and stock-to-use ratios in major
exporting countries have fallen to 25 percent, well below the
30 percent average of the past decade.6 Maize prices also came
under pressure as global production increased just 0.2 percent in 2011 and by only 2.5 percent over the past 3
years combined. Rice prices in contrast, have remained relatively subdued, ranging within a fairly narrow band of
$450-$550/ton over the past two years. International food prices have declined somewhat in recent months, partly
reflecting expectations of a normal 2011/12 crop-year — although volatility remains a concern, as crops are not
expected to be large enough to restore stocks to comfortable levels.
Market tightness has been accentuated by demand for biofuels, notably maize for ethanol use in the United States,
and edible oils (mostly rapeseed oil) for biodiesel in Europe. Approximately 30 percent of U.S. maize production
now goes to biofuels, reducing availability for food and feed and contributing to a fall in stock-to-use ratios to 15
percent (from the historical average of 20 percent).7
Fats and oils were responsible for the majority of
the increase in global food prices in 2010/11
Source: World Bank.
-40
-20
0
20
40
60
80
2005M01 2006M01 2007M01 2008M01 2009M01 2010M01 2011M01
Other Foods
Fats & Oils
Grains
Contribution of grains, fats & oils and other food to y-o-y growth in the World Bank's International Food index (%)
Figure 6 Higher energy prices explain most of the 58
percent increase in agricultural prices since the 1990s.
Source: World Bank
0
100
200
300
400
500
600
1986 1988 1990 1992 1994 1996 1998 2000 2002 2004 2006 2008 2010
commodity prices, index average 1986-2003=100
Oil 245% up
Food58% up
Historically, a 10 percent increase in oil prices has increased food prices by 2-3%.
On this basis, the 245% increase in oil prices since 2003 would be expected to increase food prices by between 50 and 73%.
Global Economic Prospects June 2011

11
level as in 2010.
Local food prices in developing countries have not increased as much as international food prices
Notwithstanding the 40 percent increase in the
dollar price of internationally traded food
commodities since June 2010, and food-price
unrest in several countries, overall food price
indexes in developing countries have risen by
much less (7.9 percent through January 2011)
(figure 7). Lower food price increases in
developing countries reflect a variety of factors
(see commodity annex).
International prices are quoted in dollars, but
the dollar is depreciating against most
developing country currencies (down 9
percent in nominal effective terms since June
2010)— so even if all of the price increase
were passed through, the price rise in local
currency terms would be smaller.
In addition, local transport costs, price
controls and other market imperfections
introduce significant gaps and lags between
international and local prices.
The weights used to calculate international
food price indexes are those of commodities
in international trade, not in consumption.
Because the vast majority of food is not
traded internationally, the price of
domestically produced and consumed foods
enters in local price indexes with a bigger
weight than in the international food price
index. Most important for local food price
indices are grains prices, including the price
of rice (which has not increased much),
cassava and other products whose prices are
only loosely connected to international
markets.
Finally, although 2010/11 was a bad crop
year for several major exporters of
internationally traded foods, it was a good
crop year for many developing countries —
actually driving down domestic prices for
some of these goods (notably maize in much
of Africa) even as internationally traded food
prices rose rapidly.
Overall, pass-through of world prices to local
prices (even of the same commodity) is weak
(see commodity annex for a fuller discussion).
On average, only about one quarter of
international price increases are passed on to
local prices in the space of a year, although over
the long-run this ratio tends to rise in those
instances where local prices are not controlled.
Countries where pass-through is stronger tend to
either be major importers or exporters of the
commodity in question, and have limited
regulations or price controls. Pass-through is
weaker or even non-existent among countries
that are more self-sufficient and have weak
infrastructure. Local grain prices change rapidly
Figure 7. Domestic food prices in developing countries
have not increased as much as international food
Source: World Bank.
90
110
130
150
170
190
210
Jan-05 Jan-06 Jan-07 Jan-08 Jan-09 Jan-10 Jan-11
index, January 2005=100
International $ food prices (US CPI deflated)
Developing country food prices (nominal, Consumer demand weighted)
Figure 8 Biggest changes in food inflation
Source: World Bank, ILO food price database.
-30 -25 -20 -15 -10 -5 0 5 10 15 20
Togo
El Salvador
Seychelles
Honduras
Bolivia
Venezuel
Iran
Morocco
Indonesia
Lithuania
Bangladesh
Mexico
South Africa
Tunisia
Algeria
Fiji
India
Egyp
Ghana
Uganda
Change in local food price inf lation, December 2010/ Dec 2009,percentage points
Global Economic Prospects June 2011

12
in response to international prices in only a very
few developing countries, for example South
Africa and Argentina (see the Commodity
Annex for more on food price pass through).
Of course, some countries are much more
dependent on imported food, and therefore more
sensitive to fluctuations in international food
prices. Many island states and countries in the
Middle-East and North Africa import large
proportions of their food (import ratios for some
grains exceed 80 percent in 12 of 14 Middle-East
& North African countries for which data are
available). Partly reflecting this, the Seychelles
and Togo were among the developing countries
(for which data are available) that experienced
the largest increase in food inflation rates
between December 2009 and December 2010
(figure 8). Overall, food inflation in 2010
exceeded 10 percent in 33 of 80 developing
countries for which data are available.
In countries with price controls on food, rising
prices have put enormous pressure on fiscal
budgets (for example Bangladesh, Egypt and
India). Moreover, several cases where the
authorities sought to raise controlled prices in
line with market developments resulted in
significant political turmoil and even rioting (for
example, Egypt, Tunisia, Mozambique, and
Uganda).
High and rising commodity prices imply varied terms-of-trade effects across developing countries
A sharp increase in fuel and food prices during
the course of 2010 has imposed large changes in
the terms of trade of many developing countries
(see below and the commodity annex for more
on the implications of higher food and energy
prices). Gains have been concentrated among oil
exporters, and losses among resource and food-
Box 4. Trends in the global demand for food
Demand for food tends to be relatively stable, responding
to slowly evolving factors (principally, population and in-
come growth), and its rate of growth has not accelerated in
the recent past. Indeed, global demand for major food
groups has been slowing over the past half century. This
trend is expected to continue to do so as global population
growth slows, and the increment to per capita demand from
rising incomes declines.
Per capita demand for food tends to rises with incomes,
although after income reaches a certain threshold per capita
food demand tends to level off. For grains (including indi-
rect demand to produce meat), most of the world’s popula-
tion has already reached the point where per capita demand
has leveled off. Demand for meat is still rising faster than
is population, but the differential is declining as meat con-
sumption of most of the world’s population approaches
peak levels. Only demand for edible oils continues to rise
much more rapidly than population, and is expected to con-
tinue to do so over the next twenty years or so, as poorer
populations are increasingly able to afford the packaged
and prepared foods that are heavy in edible oil content.
The somewhat higher growth rates for grains and edible
oils projected for this decade reflect the diversion of some
of these products to biofuels7 — biofuel-related demand for
food products is expected to grow rapidly over 2010-2019.
Per capita grain consumption (direct and indirect)
rises as income rises
Source: World Bank, FAO.
BrazilChina
India
Russia
18
45
135
367
1,0
00
Gra
in C
onsu
mptio
n p
er
ca
pita
( K
g )
0.4 1.1 2.9 8.1 22.0 59.8GDP per capita (1,000 PPP $)
Note : Curve fitted on a log scale.
Global food demand trends, 1960-2030
f) FAO-OECD forecast (meat = simple average of
chicken growth 2.4 percent and other meats 1.7 percent).
Source: World Bank, FAO, OECD.
Population Grains Edible oils Meats
1961-70 2.0 2.9 4.6 3.8
1971-80 1.8 2.3 4.4 3.2
1981-90 1.7 2.3 3.9 2.7
1991-2000 1.4 1.3 2.4 2.7
2000-08 1.4 1.1 2.7 2.0
2009-19f 1.4 1.4 2.9 2.1
Global Economic Prospects June 2011

13
poor oil-importing countries. Despite oil prices
expected to average about $107/bbl, terms of
trade impacts for many oil importers are not as
large as might be expected, because other
commodity prices (food, as well as metals and
minerals) are also high and rising, which tends to
generate offsetting effects. The ten countries
experiencing largest positive terms of trade
effects saw gains exceeding 8 percent of GDP,
and were concentrated among oil exporters. The
largest negative effects were smaller in scale,
generally less than 6 percent of GDP, and
included significant impacts in small island
states such as Seychelles, Cape Verde and St.
Vincent and Grenadines — all of which are oil
importers and dependent on imported food
(figure 9).
Remittances and tourism are important sources
of foreign currency, representing inflows of 10
or more percent of GDP for several developing
countries (figure 10). The dollar value of
remittances received by residents of developing
countries increased a modest 5.6 percent in
2010. However, because of inflation and dollar
depreciation the local market purchasing power
of these remittances is estimated to have
declined by 3.6 percent in the year. Flows to
South Asia and East Asia increased the most (8.2
and 7.4 percent respectively), with inflows to
Europe and Central Asia and Latin America and
the Caribbean (the two regions having been hit
hardest in 2009) rising by just 1.3 and 1.7
percent respectively.
In 2010 world tourism recovered more strongly
than expected following the global recession.
Tourism arrivals increased by an estimated 7
percent and the dollar value of receipts increased
6.6 percent (World Tourism Organization,
2011), with emerging economies serving as the
engine for growth. Among developing regions,
the Middle-East, East Asia, and South Asia saw
the biggest increases in volumes, up 14-, 13-,
Figure 10 Tourism and remittances are important sources of foreign currency for many developing countries
Source: World Bank, UN International Tourism Organization
0 10 20 30 40 50
Philippines
Costa Rica
Egypt
Thailand
Morocco
Malaysia
Tunisia
Jordan
Jamaica
Fiji
Lebanon
Cape Verde
Seychelles
Maldives
Tourism receipts in 2010, % of GDP
0 10 20 30
Sudan
Pakistan
Fiji
Morocco
Vietnam
Armenia
Bangladesh
Philippines
Jordan
Jamaica
Honduras
Lebanon
Haiti
Kyrgyz Republic
Remittances in 2010, % of GDP
% of GDP
Global Economic Prospects June 2011
Figure 9 Largest terms of trade effects
Estimated, ex ante terms-of-trade effects (% of GDP) in 2010
Source: World Bank.
-10 -5 0 5 10 15 20
Seychelles
Moldova
Cape Verde
St. Vincent and the Grenadines
Dominica
Lebanon
Jordan
Kenya
St. Lucia
Fiji
Nicaragua
Honduras
Algeria
Venezuela
Yemen
Iran
Nigeria
Azerbaijan
Oman
Angola

14
and 10 percent respectively, with intra-regional
tourism in the Middle-East and North Africa
playing a big role.
However, the political turmoil in the Middle East
and North Africa at the end of 2010 and in the
first months of 2011 has cut into the tourism
business sharply. As of mid May, 2011 tourist
arrivals have declined sharply in Bahrain, Egypt,
Jordan, Syria and Tunisia. According to the
World Travel and Tourism Council, first quarter
tourist arrivals in Egypt and Tunisia were off
about 45 percent compared with the like period
of 2010. If tourism receipts decline 18 percent in
Egypt during 2011, that would imply a direct 1.5
percent of GDP foreign currency shortfall.
Jordan, Syria and Tunisia could experience
negative impacts of similar magnitude, while the
fall-off in other countries in the region is likely
to be less pronounced.
Of course some of this tourism spending will
show up as an increase in tourism in other
countries — although for the moment data do
not indicate which developing countries might
be the most significant beneficiaries. During the
first two months of 2011, tourism arrivals were
up in all regions except the Middle East (-10
percent y/y) and North Africa (-9 percent). Latin
America & the Caribbean and South Asian
destinations saw volumes rise by 15 percent
compared with the same period in 2010, while
arrivals were up 13 percent in both Sub-Saharan
Africa and developing Europe and Central Asia.
Arrivals to East Asia & the Pacific were up 6
percent. Overall, the U.N. World Tourism
Organization expects tourism arrivals to rise by
about 4-5 percent in 2011.
Capital flows to developing countries have
recovered
Recent developments in finance is described in more detail in the financial markets annex (http://
go.worldbank.org/II5NRC07Z4).
Capital flows to developing countries recovered
substantially in 2010, reaching about 4.6 percent
of developing country GDP (table 2). Flows
remain well below their peak levels of 2006 and
2007, with most of the compression endured by
Europe and Central Asia, while flows as a share
of GDP for other developing regions have been
much more stable.
For 2011 as a whole private capital inflows are
expected to increase only 5 percent, as the more
volatile flows that led the sharp recovery in 2010
are expected to stabilize or weaken. In particular,
portfolio equity flows into developing countries
are projected to decline 20 percent, with the
sharpest falloffs expected in the Middle-East and
North Africa, reflecting political turmoil in the
region. In contrast, firms in developing countries
continue to rely on international bond markets
for debt financing, as they are faced with
ongoing tightening in domestic credit markets
and limited recovery in international bank-
lending.
The dollar value of FDI8 is expected to rise by a
further 14 percent in 2011, but will not regain its
pre-crisis level in absolute terms until 2012,
when it is projected to reach $604 billion (vs.
$615 billion in 2008). Overall, net private capital
flows to developing countries are anticipated to
reach more than $1 trillion by 2013, but their
share in developing country GDP will be falling
from an estimated 4.4 percent in 2010 to around
3.8 percent at that time, in part reflecting an
expected tightening of short-term debt flows as
interest rates begin to rise and regulatory
conditions tighten (figure 11).
Figure 11 Net private capital flows to developing coun-
tries
Source: World Bank.
0
1
2
3
4
5
6
7
8
9
-0.2
0.0
0.2
0.4
0.6
0.8
1.0
1.2
2005 2006 2007 2008 2009 2010p 2011f 2012f 2013f
ST Debt flows
Bank
Bond
Portfolio Equity
FDI
$ trillion
Global Economic Prospects June 2011

15
Global imbalances are expected to remain well below 2007 levels
Reflecting offsetting terms-of-trade effects for
most developing countries and modest
improvements in remittance and tourism flows, few
countries are expected to run into extreme current
account problems in 2011, and most developing
countries are expected to be able to finance
additional current account shortfalls that may arise.
Higher oil prices will increase the current account
surpluses of oil exporting countries, which ex ante
serves to increase global imbalances (which
Figure 12. Global imbalances have declined and are ex-
pected to remain at much lower than in mid-decade
Source: World Bank.
0
1
2
3
4
5
6
7
2000 2001 2002 2003 2004 2005 2006 2007 2008 2009 2010 2011 2012 2013
USA Oil importers Oil exporters
China oil importers Oil exporters
High-income
Developing
% Global GDP
Table 2 International capital flows to developing countries rebounds, surpassing 2008 levels
$ billions
Source: World Bank.
Note: e = estimate, f = forecast
/a Combination of errors and omissions and transfers to and capital outflows from developing countries.
2003 2004 2005 2006 2007 2008 2009 2010e 2011f 2012f 2013f
Current account balance 138.3 195.2 318.8 450.3 469.1 440.6 284.4 264.5 219.6 159.9 163.1
as % of GDP 2.0 2.4 3.3 4.0 3.4 2.6 1.7 1.4 1.0 0.6 0.6
Financial flows:
Net private and official inflows 264.1 342.2 502.9 656.3 1132.1 771.1 633.8 930.2
Net private inflows (equity+debt) 276.1 366.3 567.0 725.9 1132.1 743.3 557.4 857.8 892.7 963.5 1065.3
Net equity inflows 180.6 243.6 379.2 497.0 664.9 561.2 498.1 633.2 674.1 733.9 839.8
..Net FDI inflows 154.3 206.7 311.7 389.3 529.8 614.4 390.0 485.4 555.0 603.6 696.2
..Net portfolio equity inflows 26.3 36.9 67.5 107.7 135.1 -53.2 108.2 147.8 119.1 130.3 143.6
Net debt flows 83.6 98.6 123.8 159.3 467.2 209.9 135.6 297.0 218.6 229.6 225.5
..Official creditors -11.9 -24.1 -64.0 -69.6 0.0 27.8 76.4 72.4
....World Bank -2.5 2.4 2.7 -0.2 5.2 7.3 17.7 19.3
....IMF 2.4 -14.7 -40.2 -26.7 -5.1 10.0 26.5 16.3
....Other official -11.8 -11.8 -26.6 -42.6 0.0 10.6 32.2 36.8
..Private creditors 95.5 122.7 187.8 228.9 467.2 182.1 59.2 224.6 218.6 229.6 225.5
....Net M-L term debt flows 38.3 69.8 113.3 145.0 283.0 196.1 52.8 104.1
......Bonds 23.1 34.3 48.3 31.7 88.2 24.1 51.1 66.5
......Banks 19.5 39.7 70.3 117.9 198.5 176.8 3.2 37.6
......Other private -4.4 -4.1 -5.3 -4.7 -3.7 -4.8 -1.6 0.0
....Net short-term debt flows 57.2 52.9 74.5 83.9 184.2 -14.0 6.4 120.5
Balancing item /a -116.9 -137.5 -406.9 -458.6 -509.5 -733.5 -271.1 -524.4
Change in reserves (- = increase) -285.5 -399.9 -414.8 -647.9 -1091.7 -478.2 -647.0 -670.3
Memorandum items
Net FDI outflows 23.6 46.1 61.6 130.5 148.7 207.5 153.9 210.0
Workers' remittances 137.5 159.3 191.8 226.3 278.2 325.0 307.6 324.7 348.6 374.5
As a percent of GDP
2003 2004 2005 2006 2007 2008 2009 2010p 2011f 2012f 2013f
Net private and official inflows 3.9 4.3 5.3 5.8 8.1 4.6 3.9 4.8
Net private inflows (equity+debt) 4.1 4.6 5.9 6.4 8.1 4.4 3.4 4.4 3.9 3.8 3.8
Net equity inflows 2.7 3.0 4.0 4.4 4.8 3.3 3.1 3.3 3.0 2.9 3.0
..Net FDI inflows 2.3 2.6 3.3 3.4 3.8 3.7 2.4 2.5 2.4 2.4 2.5
..Net portfolio equity inflows 0.4 0.5 0.7 1.0 1.0 -0.3 0.7 0.8 0.5 0.5 0.5
..Private creditors 1.4 1.5 2.0 2.0 3.3 1.1 0.4 1.2 1.0 0.9 0.8
Global Economic Prospects June 2011

16
rebounded from decade lows in 2009 to reach
about 5 percent of global GDP in 2010). The
combined balances of the United States and
China have halved from 2.6 percent of global
GDP in 2006 to 1.3 percent in 2010 (figure 12).
Looking forward, a lagged step-up in imports by
oil exporting economies; policy tightening in
high-income countries and continued reliance on
domestic demand for growth among developing
countries, are expected to combine and maintain
global imbalances at levels well below those of
2007, when persistent increases were a cause for
genuine policy concern. The absolute value of
current account imbalances among developing
oil importers (including China) are expected to
moderate slightly as these economies have
already returned to close to full capacity levels
of demand. In contrast, further recovery is
expected in high-income countries, which may
be reflected in a decline in private-sector savings
and therefore increased deficits. However, this
effect is expected to be offset by increased
public-sector savings from fiscal tightening —
with the result that imbalances for this group of
countries are also projected to decline modestly,
from about 3 to 2.8 percent of global GDP
between 2011 and 2013.9
Growth will slow but remain robust
The global recovery has broadened to encompass
more firms, more countries and more
components of aggregate demand. Improving
labor market conditions in high-income
countries, and strongly expanding domestic
demand in developing countries augurs well for
a continued maturation of the recovery that is
now almost two years old (global industrial
production began picking up in March 2009).
The recovery in the United States has gained
strength over the past 6 months and shows signs
of becoming more self-sustaining. Significant
gains in levels of manufacturing and services
activity, business investment have helped to
improve conditions in U.S. labor markets
(employment has been growing by more than
115 thousand per month since March 2010, and
the unemployment rate dropped to 9.1 percent as
of May 2011). Following a relatively weak
weather-influenced first quarter GDP results, and
some flagging in the pace of the recovery in the
second quarter, GDP growth is expected to pick
up in the second half of the year, with whole
year gains of 2.6 percent in 2011 and 2.9 percent
in 2012, and with growth easing to 2.7 percent
by 2013.
The recovery in Europe continues to face
substantial headwinds from uncertainty
surrounding sovereign debt in several Euro Area
members, and a wide-reaching but necessary
process of fiscal consolidation. Nevertheless,
outturns in Germany and France have shown
increasing strength, with unemployment in
Germany now well below pre-crisis levels. But
in many other countries, growth is becoming
constrained by fairly austere fiscal consolidation
programs, ongoing banking-sector restructuring
and by a skepticism regarding the financial
sector that is serving to raise borrowing costs. As
monetary policy has entered a renewed
tightening phase additional stresses in the
financial sector—may become more apparent,
presenting further challenges for these
economies. Overall, after expanding 1.7 percent
in 2010, Euro Area GDP is expected to repeat
that performance in 2011, strengthening to 1.8
percent in 2012 and 1.9 by 2013, as financial-
sector headwinds to growth begin to fade.
The horrible natural disaster and ensuing nuclear
challenge in Japan will shape economic and
human developments in that country for years to
come (see box 1). Despite the very real human
and wealth losses associated with the crisis, its
impact on GDP growth is expected to be
temporary. While second quarter GDP could
decline at a 3 percent annualized rate, the pace of
activity is expected to pick up to a 3 or 4 percent
annualized rate in the final two quarters of the
year — bringing whole year growth to around
0.1 percent in 2011. GDP is likely to increase
to 2.6 percent in 2012, before settling at 2
percent in 2013 — broadly in line with the
country’s growth potential.
Overall, global growth is projected to ease from
3.8 percent in 2010 to 3.2 percent in 2011,
before picking up to 3.6 percent in each of 2012
Global Economic Prospects June 2011

17
Box 5. Synopsis of regional outlooks
The regional annexes to this report contain more detailed accounts of regional economic trends, including
country-specific forecasts (for more details, http://go.worldbank.org/OBY9F2CJV0)
Growth in developing East Asia and the Pacific (http://go.worldbank.org/Q2V3HPR0F0) is projected to slow from 9.6 to
8.5 percent between 2010 and 2011, reflecting the shorter term adverse consequences of the Japanese earthquake
for regional exports, as well as a tightening of both monetary and fiscal policies within the region (figure).
China’s expansion is projected to slow from the its 10.3 percent pace of 2010 to 9.3 in 2011 and around 8.7 per-
cent in each of 2012 and 2013, as the effects of government’s policy tightening take stronger effect. Output in
the remainder of the East Asia region is also projected to slow, from 6.8 percent in 2010 to 5.3 percent in 2011,
before strengthening gradually to 6.4 and 6.5 percent in 2012 and 2013.
Economic activity in developing Europe and Central Asia (http://go.worldbank.org/C4P2GZR0P0) is projected to con-
tinue to recover — albeit at slower rates than during 2010—as the very large adjustment costs of the financial
crisis begin to fade. High oil prices should boost demand in regional oil exporters (notably Russia) increasing
remittances and exports for other countries in the region. Continued weakness in the banking sector in several
countries, and household exposures to foreign currency debt remain significant sources of risk. The region is
also among the most exposed to problems that may arise from the Euro-Area fiscal sustainability crisis. Aggre-
gate GDP is expected to ease from the 5.2 pace of 2010 to 4.7 percent in 2011, before a modest easing to 4.5
percent sets in for 2012-13, in-line with underlying fundamentals.
With output gaps for some of the larger countries in Latin America and the Caribbean (http://
go.worldbank.org/1S4SNDR160) largely closed, continued robust growth in several economies will come head-to-head
with increasing inflationary pressures and a tightening of policy. As a result, growth is projected to diminish
from the 6 percent pace of 2010 to 4.5 percent in 2011. Activity is projected to remain solid, but to ease toward 4
percent over 2012-13 as policy measures dig deeper. Exchange rate appreciation due to capital inflows and high
commodity prices has put a dent in competitiveness, also expected to contribute to the softening of growth.
Countries in Central America and the Caribbean will face headwinds from higher commodity prices, offset to
varying degrees by a more favorable outlook for tourism and remittances as labor market conditions improve in
the United States.
The political turmoil in developing Middle East and North Africa (http://go.worldbank.org/IU7FS7QXE0) is projected to
cut into near-term growth for a large number of economies in the region. Output already forgone- and continued
uncertainty are expected to cause growth to slow in the economies most directly touched by the crisis by be-
tween 3 and 4 percentage points in 2011 relative to what would have been observed otherwise. Growth in the
remainder of the region will be reduced by 1 to 2 points. Many countries are projected to see tourism revenues,
worker remittances, foreign direct investment and other international capital flows decline, further tightening
Developing country growth rates to stabilize at historically elevated rates
Source: World Bank.
-8
-6
-4
-2
0
2
4
6
8
10
12
East Asia and Pacific
Europe & Central Asia
Latin America & Caribbean
Middle East & North Africa
South Asia Sub-Saharan Africa
2009 2010 2011 2012 2013
Real GDP growth, ch%, 2009 to 2013
Global Economic Prospects June 2011

18
and 2013. The slowdown for high-income
countries (from 2.7 percent in 2010 to 2.2
percent in 2011) mainly reflects very weak
growth in Japan due to the after-effects of the
earthquake and tsunami (see earlier box 1).
Growth in the remaining high-income countries
is expected to remain broadly stable at around
2.5 percent through 2013, despite a gradual
withdrawal of the substantial fiscal and monetary
stimulus introduced following the financial crisis
to prevent a more serious downturn.
For developing countries growth is projected to
decline from 7.3 to 6.2 percent between 2010
and 2012 before firming somewhat in 2013,
reflecting an end to bounce-back factors that
served to boost growth in 2010 and the
tightening of monetary and fiscal policies as
capacity constraints become increasingly binding
(see box 5 and the regional annexes to this
conditions for regional oil importers. Activity is expected to pick up slowly as turmoil resolves over time, with
growth among developing countries in the region rising from 1.9 percent in 2011 to 4 percent by 2013.
GDP growth in 2011 in South Asia (http://go.worldbank.org/VFFA8EDQF0) is expected to slow from the robust 9.3 per-
cent pace set in 2010 to 7.5 percent, as policy tightens in response to higher inflation and an unsustainably loose
fiscal policy stance. These negative factors and high import costs due to commodity prices are likely to be par-
tially offset by strong trade, notably in India, which is reorienting its exports toward China and East Asia. Though
investment spending is projected to remain robust (buoyed by infrastructure projects), consumer demand is antici-
pated to come under pressure due to reduced fuel and food subsidies. Turmoil and economic weakness in the
Middle East and North Africa is expected to be a negative for remittances to the region, further dampening house-
hold incomes and outlays. Regional growth should revive toward an 8 percent pace by 2013 on the back of do-
mestic reforms and an improved global environment.
GDP growth in Sub-Saharan Africa (http://go.worldbank.org/PHW504QYG0) is projected to register 5 percent in 2011—
the only developing region projected to enjoy an acceleration of growth in the year—buoyed by favorable terms
of trade for oil exporters, and continued large inflows of FDI from China and elsewhere. Activity is expected to
continue to firm with growth reaching 5.7 percent by 2013. The region has avoided the worst effects of higher
food prices due to strong local crops, but should international prices remain at current or higher levels, local food
prices could begin rising in the second half of 2011 and into 2012, with negative consequences for consumer
demand and poverty. Inflation pressures may go hand and hand with this development, especially as elections are
expected in 13 countries in the region.
Box 5. Synopsis of regional outlooks (cont.)
Figure 13 Headline inflation pressures have picked up since mid-2010
Median headline inflation rates Distribution of increase in developing country inflation rates
Source: World Bank.
0
2
4
6
8
10
12
14
-6 -4 -2 0 2 4 6 8 10 12 14 More
# of countries
Change in year-over-year inflation rate over past 12 months,percentage points
-6
-3
0
3
6
9
12
Jan-05 Oct-05 Jul-06 Apr-07 Jan-08 Oct-08 Jul-09 Apr-10 Jan-11
Developing
High-income
Headline inflation, ch%, 3m/3m, saar
Global Economic Prospects June 2011

19
document for more details on recent economic
developments and the outlook for low– and
middle-income countries — including country
specific forecasts).
R i s i n g i n f l a t i o n p o s e s macroeconomic policy challenges
Recent developments in inflation is described in more detail in the inflation annex (http://go.worldbank.org/
FA0QD707X4).
The rise in commodity prices, combined with the
rapid closing of output gaps and strong capital
inflows has contributed to an acceleration of
inflation throughout the developing world.
Headline inflation in developing countries neared
7 percent (year-over-year) in April 2011, a more
than 3 percentage point increase since low points
in July 2009, when concerns of deflation were
paramount. Headline inflation (y-o-y) in high-
income countries has also picked up, reaching
2.8 percent in April 2011.
Monthly inflation accelerated more starkly,
reaching a 9.1 percent annualized pace among
developing countries in the 3 months ending in
January 2011. Since then, the pace of inflation
has eased to around 6.7 percent in April, and to
4.3 percent in high-income countries (first panel,
figure 13).
The extent of the increase and its main
determinants varies markedly across countries,
with inflation having increased by 10 percentage
points or more over the past 12 months in the
Democratic Republic of Congo, Ethiopia, the
Kyrgyz Republic, Bolivia, and Mongolia. Year-
over-year headline inflation increased during this
period by 3 or more percentage points in 33 of
the 93 developing countries for which data are
available (second panel, figure 13). However, the
extent of the pickup in inflation in most countries
has been modest. Inflation rates in 55 percent of
developing countries remain below their average
rate of the pre-crisis period (January 2000
through August 2008). And inflation is less than
2 percentage points higher than that average in
80 percent of countries.
The biggest acceleration has been in the East
Asia and Pacific- and Middle-East and North
African regions, reflecting capacity constraints in
the former and food prices in the latter (first
panel, figure 14). While on a year-over-year
basis inflation has eased in South Asia and
Europe and Central Asia, monthly data suggests
that price pressures remain strong in South Asia
and are rising in Africa, with the pace of
increase in the first quarter of 2011 exceeding 15
percent in South Asia and close to 10 percent in
Sub-Saharan Africa (second panel, figure 14).
Rising food and fuel prices have also been
associated with significant increases in food and
fuel subsidies—both implicitly as the gap
between market and controlled prices increases
Figure 14 Regional changes in inflation
Year-over-year inflation Quarterly inflation (3m/3m saar)
Source: World Bank.
0
2
4
6
8
10
12
14
16
18
High-income East Asia & Pacific
Europe & Central Asia
Latin America & Caribbean
Middle East & N. Africa
South Asia Sub-Saharan Africa
Jan-09
Jan-10
Mar 11 or latest
Headline inflation rate, y-o-y percent change
-5
0
5
10
15
20
High-income East Asia & Pacif ic
Europe & Central Asia
Latin America & Caribbean
Middle East & N. Africa
South Asia Sub-Saharan Africa
Jan 2009
Jan 2010
Apr 2011 or latest
Global Economic Prospects June 2011

20
and because of the imposition of new policies to
alleviate the impact of the price hikes. Several
countries in the Middle-East and North Africa
increased food and/or fuel subsidies (Algeria,
Egypt, Jordan, Morocco, Syria and Tunisia), with
associated increases in government deficits
exceeding 2 percent of GDP in many instances.
Rising food and fuel prices have also increased
subsidy spending in several Asian economies,
including India, Pakistan and Indonesia.
Responding to the rise in inflation and the
closing of output gaps, authorities in many
developing countries have begun the process of
adjusting macroeconomic policy, which had been
loosened in the wake of the financial crisis, to a
Box 6 Should developing countries accommodate external price shocks?
Several OECD countries produce estimates of core inflation that either exclude food and fuel prices or exclude
the most volatile components from the overall consumer price index, and prefer to guide monetary policy with
these measures rather than headline inflation. Currently, even as headline inflation is rising rapidly, so-called core
inflation indexes remain low at 1.3 percent in high-income Europe and 1.1 percent in the United States.
Most developing countries do not publish separate core inflation measures and, recent research (Walsh, 2011)
suggests that in some cases, policy in developing countries may be better advised to focus on headline not core
measures. According to this line of argument, the high weight of food and fuel prices in the overall consumption
basket of developing countries (more than 50 percent in many cases) means that price increases in these goods
spread more easily into other prices than in high-income countries. As a result, accommodating such price in-
creases runs the risk of allowing a second round of price increases to occur — potentially yielding an inflation-
ary spiral.
A second strand of logic argues that because food prices are such a large component of the overall basket, not
accommodating them (even if they do pass through to other prices) would pose too harsh an adjustment on real
wages. In this case, a credible monetary authority might be better-off to announce that they would accommodate
the price increase and allow some second round increases (thereby reducing the real wage shock), but would seek
to firmly re-establish its inflation targets within a well specified period of time.
Of course, the success of such a strategy lies in the credibility of the monetary authority. If inflationary expecta-
tions adjust upward despite the monetary authority’s declaration to re-establish inflation targets by a given date,
then the long-term costs of bringing expectations back down may exceed the short-term benefits of easing the real
-wage adjustment to permanently higher food prices.
Figure 15 Policy tightening has begun and markets suggest more is to be expected
Rates are on the rise in many developing regions And markets expect further increases
Source: World Bank, Thomson/Reuters, Bloomberg.
0
50
100
150
200
250
300
350
400
450
500
Brazil Chile Colombia Russia China India Indonesia Malayisa Thailand
Change since 2009 low
Market expected between May 20 and end of 2011
change in offical policy rate, basis points
4
5
6
7
8
9
10
11
12
13
14
01/01/2008 07/01/2008 01/01/2009 07/01/2009 01/01/2010 07/01/2010 01/01/2011
Developing
Asia
Europe & Central Asia
Latin America & the Caribbean
Sub-Saharan Africa/ Middle East & North Africa
policy interest rates in percent
Global Economic Prospects June 2011

21
more neutral stance.
Monetary policy interest rates in much of the
developing world have been rising (first panel,
figure 15). In Latin America, the median policy
rate has increased from 7.9 percent in March
2010 to 9.6 percent by May 2011, and in Asia it
has increased by 106 basis points to 6.31
percent. Reflecting much larger output gaps,
policy rates in Europe and Central Asia have
been broadly stable (up only 50 basis points
since February 2011). In the Middle East and
North Africa and Sub-Saharan Africa rates
continue to decline.
Despite the increase in nominal interest rates,
real rates (nominal deflated by actual inflation)
remain low and even negative in many
developing countries. Expected real rates (which
is what matters for monetary policy) may not be
negative if expectations are that the current
pickup in inflation in transitory. However, if
some of the recent increase is deemed permanent
then additional monetary tightening may be
called for (see box 6 for a fuller discussion of
how monetary policy in developing countries
should respond to increases in commodity
prices). Indeed, expected inflation has increased
in several developing countries where data exist,
for example in Argentina, Belarus, Brazil, Chile,
Ethiopia, and India among others.
Figure 16 Gross capital flows to, and credit growth in, developing countries eased toward the end of 2010
Source: World Bank using Dealogic, IFS.
Note: Data refer to gross flows of new bond and equity issues and syndicated bank loan commitments.
0
5
10
15
20
25
30
Jan-09 May-09 Sep-09 Jan-10 May-10 Sep-10 Jan-11
Bond issuance
Equity placement
Syndicated bank loans
billions $, 3 month moving average
0
5
10
15
20
25
30
35
2009 Jan 2009 Jul 2010 Jan 2010 Jul 2011 Jan
BrazilChina ColombiaIndonesiaIndiaMalaysiaTurkey
y-o-y Credit growth, CPI def lated
Figure 17 Upward pressure on middle-income currencies and reserve accumulation also eased in 2010Q4
Source: World Bank, IFS.
-20.0
-10.0
0.0
10.0
20.0
30.0
40.0
50.0
East Asia & Pacif ic
Europe & Central Asia
Latin America & Caribbean
Middle East & N. Africa
South Asia Sub-Saharan Africa
2010Q1 2010Q2 2010Q3 2010Q4
Annualized rate of increase in USD reserves
90
100
110
120
130
140
150
2009M01 2009M05 2009M09 2010M01 2010M05 2010M09 2011M01 2011M05
Brazil South AfricaTurkey IndiaIndonesia ThailandChina
real effective exchange rate indices, Jan 2009=100
Global Economic Prospects June 2011

22
As discussed in length in the previous edition of
Global Economic Prospects, efforts to tighten
monetary policy and rein-in credit growth were
complicated in 2010 by strong capital inflows.
Some of these flows (mainly short-term debt and
equity flows) were perceived as having an
important speculative and temporary component.
As a result, many countries (notably several
large middle-income countries with relatively
deep capital markets) sought to resist the
associated upward pressures on their currencies,
putting into place a wide range of administrative
and regulatory measures designed to reduce the
attractiveness of short-term financial investments
or reduce the extent of credit expansion
associated with reserve accumulation.
Measures employed included sterilizing inflows
through government bond sales, and interest rate
hikes. Many countries employed non-traditional
measures that did not increase domestic interest
rates in order to avoid increasing the returns to
foreigners of making short-term investments in
these countries. These included raising reserve
requirements10, and imposing taxes on short-
term foreign capital investments. Turkey even
went so far as to lower domestic interest rates
(and therefore risk a rapid expansion in domestic
credit) in order to discourage foreign capital
inflows.
Partly as a result of these steps, foreign capital
inflows into—and credit growth in—many of
these countries eased toward the end of 2010 and
into 2011 (figure 16). However, attributing
causality is difficult because renewed concerns
about fiscal sustainability in high-income
Europe; political turmoil in the Middle East and
North Africa; rising oil prices, and the crisis in
Japan may also have been playing a role. Indeed,
profit-taking on the part of investors, and
concerns that perhaps emerging market
currencies and local stock-markets had reached
unsustainably high levels may also have been
factors at play.11
Whatever the reason for the reduced inflows,
they were reflected in an easing in the upward
pressure on the currencies of many middle-
income countries, and a slowing in the pace of
international reserve accumulation throughout
much of the developing world, East Asia
forming a notable exception (figure 17).
Fiscal policy will likely have to do more
going forward
Looking forward, policymakers in developing
countries will need to make fuller use of all of
the tools at their disposal to keep inflation under
control. While the more unstable capital inflows
that characterized the third quarter of 2010 have
abated, many of the underlying conditions that
attracted those flows remain in place (low short-
term interest rates in high-income countries;
stronger growth prospects in developing
countries; strong commodity prices, and a long-
run tendency for developing–country currencies
to appreciate). Moreover, countries are now
confronted with additional pressures from
growing capacity constraints and rising
commodity prices.
If countries are to deal with these (and other as
yet unknown) challenges, they may need to take
fuller advantage of both fiscal and exchange rate
policies. To this point in the recovery,
withdrawal of the fiscal stimulus that was put in
place during the acute phase of the crisis has
been limited. Although government deficits have
declined in many developing countries, this
mainly reflects improved revenues as activity
has recovered and output gaps returned to near
Global Economic Prospects June 2011
Figure 18 Modest expected improvement in fiscal
deficits in some developing regions
Source: World Bank.
-10.0
-8.0
-6.0
-4.0
-2.0
0.0
2.0
4.0
High Income Countries
East Asia & Pacific
Europe & Central Asia
Latin America & Caribbean
Middle East & N. Africa
South Asia Sub-Saharan Africa
2007 2010 2011 2012 2013
general govt balance as a share of GDP (%)

23
zero levels. Discretionary cuts to spending have
been limited. Government deficits have declined
by less than might have been expected given that
output gaps in most countries will be close to, or
above zero—suggesting that almost all of the
cyclical component of government deficits has
been eliminated and that remaining budgetary
shortfalls are structural in nature (figure 18).
Importantly, even by 2013 no region is
anticipated to see fiscal balances return to the pre
-crisis levels of 2007. They will therefore not
have in place the kind of fiscal buffers that
allowed policy in developing countries to
respond counter-cyclically to the financial crisis.
Until such buffers are restored, countries will be
more vulnerable to future domestic or external
shocks.
A more assertive tightening of fiscal policies in
developing countries would also allow a given
level of macroeconomic tightening to be
achieved at lower interest rates. Lower domestic
interest rates would both reduce the financial
incentive for potentially destabilizing short-term
debt inflow, but might also increase investment
rates and overall activity by lowering the cost of
capital for local entrepreneurs.
Some countries should consider introducing
more flexible exchange rate regimes. When
countries face temporary and or speculative
pressures on their currencies, reserve
accumulation and other strategies to resist
unwarranted exchange rate appreciation (or
depreciation) may well be warranted. However,
when those pressures are persistent and
enduring, a policy that resists exchange rate
adjustment may well be counter-productive.
For example, while Brazil faced strong inflows
of short-term debt flows, the authorities were
arguably correct in resisting the upward pressure
they caused on their currency. However, Brazil
has also been—and continues to be a major
destination for FDI, which has in large measure
been attracted to the country’s long-term
fundamentals. In this context, the authorities
decision to not resist upward pressures stemming
from FDI inflows is equally appropriate.
Similarly, countries that have sustained large
current account surpluses for an extended period
of time may well be better off allowing their
currencies to float more freely, rather than
continuing to resist upward pressure—
especially when domestic inflationary tensions
are building.
Risks to the global economy
The recovery is mostly complete in developing
countries, with prospects in individual countries
increasingly dependent on local conditions and
medium-term productivity growth rather than the
large, global-level forces that dominated
economic activity during and immediately after
the financial crisis. While the robust growth
outlined in the baseline remains the most likely
outcome, several tensions and external events
have the potential to disrupt that process.
On the upside, output could come in more
strongly than anticipated, or the very strong
speculative capital flows that characterized the
third quarter of 2010 could return. Either
scenario could potentially accentuate inflationary
pressures in the global economy — both those
stemming from commodity markets and those
coming from increasingly binding capacity
constraints in a number of emerging markets. In
such a scenario, which pre-supposes that policy
tightening efforts underway are not sufficient to
rein in demand, the authorities would be obliged
to tighten more aggressively in 2012, provoking
a more pronounced slowdown in 2013.
There are several potential downside risks.
A much more severe slowing of the global
economy could come about if the political
turmoil in the Middle East and North Africa
were to result in a prolonged period of high
oil prices — either through increased
uncertainty, or an enduring disruption to
global oil supply.
Conditions in global food markets represent
a more focused risk for the poor in
developing countries. Another year of poor
harvests could see prices rise still higher —
especially if combined with higher oil prices
— with potentially serious consequences for
Global Economic Prospects June 2011

24
the poor.
The market nervousness over fiscal
sustainability in high-income Europe —
although less acute than in the past, still has
the potential to disrupt growth in developing
countries if it begins to weigh on confidence.
Continued turmoil in the Middle-East and North Africa could push oil prices even higher
The recent turmoil in the Middle East and North
Africa lifted oil prices to $112/bbl in late April
2011 (World Bank average), a 40 percent
increase on the average price of $79.60/bbl in
2010. In the baseline, oil prices, which have
since declined to around $107/bbl, are expected
to gradually moderate toward a long-run
equilibrium price of about $80/bbl in constant
2011 dollar terms. This implies annual price
levels of $107/bbl in 2011 drifting to $96.7/bbl
by 2013. However, if current uncertainties
persist, or a major supply disruption occurs, oil
prices could remain high or even increase further
— with serious consequences for global growth.
During the Iranian revolution and the Iraq/
Iran War, crude oil prices more-than doubled
from $14/bbl in 1978 to $35/bbl by 1981.
When Iraq invaded Kuwait in 1991, oil
prices increased sharply from $20/bbl to a
peak of $44/bbl five months later, with the
average price rising by one-third to $28/bbl.
During the extended conflict in Iraq, prices
increased by 40 percent.
The current turmoil in the Middle East and North
Africa has been associated with a $22/bbl
increase in oil prices, from $90/bbl in December
2010 to $112/bbl by late April 2011. Prices
could increase further on additional disruption to
supplies, notably if this involved a larger
exporting country.
Preliminary simulations suggest that a further
$50/bbl increase in the price of oil for a period of
Table 3 A further increase in oil prices due to political turmoil in the Middle-east could cut further into growth
(Change in the level of GDP (%) from baseline and change in current account balance (% of GDP)
Source: World Bank.
Impact of a $50/barrel price hike (11q2-12q2) due to uncertainty
2010 2011 2012 2013 2010 2011 2012 2013
World 0.0 -0.5 -1.0 -0.4 0.0 0.0 0.0 0.0
Oi l exporting 0.0 0.2 0.5 0.9 0.0 1.5 1.4 -0.2
Oi l importing 0.0 -0.6 -1.3 -0.7 0.0 -0.2 -0.2 0.1
High income 0.0 -0.6 -1.2 -0.6 0.0 0.1 0.2 0.2
Oi l exporting 0.0 -0.4 -0.6 0.3 0.0 1.4 1.7 0.1
Oi l importing 0.0 -0.6 -1.2 -0.7 0.0 -0.1 0.0 0.2
Developing countries 0.0 -0.1 -0.4 0.0 0.0 0.3 0.1 -0.3
Oi l exporting 0.0 0.9 1.6 1.5 0.0 1.5 1.2 -0.4
Oi l importing 0.0 -0.7 -1.5 -0.8 0.0 -0.5 -0.6 -0.2
Middle-income 0.0 -0.1 -0.4 0.0 0.0 0.3 0.1 -0.3
Low-income 0.0 -1.3 -2.4 -0.6 0.0 0.0 0.3 0.1
East As ia and Paci fic 0.0 -0.8 -1.7 -1.0 0.0 -0.8 -1.1 -0.3
Oi l exporting 0.0 -0.4 -0.3 0.7 0.0 -0.5 -0.4 0.3
Oi l importing 0.0 -0.8 -1.9 -1.2 0.0 -0.9 -1.2 -0.4
Europe and Centra l As ia 0.0 -0.2 -0.2 0.8 0.0 1.6 1.8 0.1
Oi l exporting 0.0 0.1 0.7 2.0 0.0 2.3 2.4 -0.1
Oi l importing 0.0 -0.5 -1.2 -0.6 0.0 0.1 0.4 0.1
Latin America and Caribbean 0.0 0.5 0.7 0.5 0.0 -0.2 -0.4 -0.2
Oi l exporting 0.0 1.2 1.8 0.9 0.0 -0.4 -0.9 -0.1
Oi l importing 0.0 -0.3 -0.4 0.2 0.0 -0.1 -0.1 -0.2
Middle East and N.Africa 0.0 0.8 1.3 1.1 0.0 3.3 3.2 -0.9
Oi l exporting 0.0 1.5 2.4 1.4 0.0 3.7 3.4 -1.2
Oi l importing 0.0 -1.4 -2.3 0.0 0.0 0.4 1.2 0.4
South As ia 0.0 -0.9 -1.7 -0.7 0.0 -0.1 0.3 0.2
Sub-Saharan Africa 0.0 1.0 1.7 1.4 0.0 3.3 2.7 -1.3
Oi l exporting 0.0 3.7 6.6 4.4 0.0 6.2 4.4 -3.6
Oi l importing 0.0 -0.9 -1.6 -0.7 0.0 0.0 0.3 0.2
Real GDP Current account (% of GDP)
Global Economic Prospects June 2011

25
1 year (beginning in the second half of 2011, for
example) could shave off 0.5 and 1.0 percentage
points from global output in 2011 and 2012
(table 3). This overall result masks significant
differences between countries and regions.
Oil exporting countries experience significant
gains (6.6 percent of GDP in Sub-Saharan Africa
and 2.4 percent in the Middle East and North
Africa),12 while oil importing countries
experience losses. The largest losses are
expected to be among oil-importing countries in
the Middle East and North Africa (-2.3 percent)
as well as in East Asia and Pacific (-1.9 percent
in 2012), reflecting both the direct effects of
higher oil prices on incomes in these regions, as
well as their greater reliance on exports to other
negatively affected oil-importing regions
(Europe and Central Asian oil-importers benefit
from strong Russian imports).
GDP declines in oil importers reflect real income
losses as the cost of oil and related goods and
services rise, which leads to lower demand,
reduced competitiveness, and output declines —
with intensive oil-importing economies
experiencing the biggest declines (for example
Jamaica and Guyana). Negative impacts among
countries with close economic ties to oil
exporters (for example those in Europe and
Central Asia) tend to be reduced by increased
export demand from oil exporters.
In terms of external balances, current account
balances (as a share of GDP) are expected to rise
by up to 6.2 percent of GDP in oil exporting Sub
Saharan Africa, and by about half that much in
the Middle East and North Africa, while in East
Asia and Pacific, external balances decline by
about 1 percent of GDP.
Should the turmoil result in a large and sustained
(say 10-15mb/d) reduction in global oil supply,
adverse effects could be more than twice as
large. Prices might initially rise as high as $200/
bbl, cutting sharply into household incomes and
firm-level profitability. Moreover, supply
shortages could directly constrain production in
a way that uncertainty-based price rises would
not. In the latter case, oil would not be available
at any price; in the former oil would be available
— but at higher cost.
A poor crop or higher oil prices could see domestic food prices in developing countries increase further in 2011-2012
The surge in international food prices during the
second half of 2010 provoked concerns of a
―second food crisis‖, of similar magnitude to that
of 2007-08. Indeed, international food prices
increased to levels close to their 2008 peaks.
However, effects on the ground have been
mitigated by a number of factors— notably, the
fact that not all major grain prices have increased
as much as they did in 2008. International rice
prices remain relatively low, 46 percent lower
than peak prices in 2008 — although still twice
their average level between 2000 and 2007.
Moreover, 2010 was a good crop year for many
developing countries — especially in Africa —
so that local prices increased by much less than
international prices; and local food price indexes
rose by an average of 9.7 percent in the 12
months ending December 2010. Of course, much
larger increases were observed in some
economies with 33 of 80 countries experiencing
food price increases of 10 percent or more in
2010.
Simulations suggest that if the June 2011/May
Figure 19 Another poor crop or higher oil prices could
push food prices even higher
Source: World Bank.
Higher oil will also affect food prices
100
150
200
250
300
350
2000 2002 2004 2006 2008 2010 2012
Baseline
5% production shortfall
5% production shortfall and 50% incerase in energy prices
8
(Nominal Wheat price, US$/ton)Forecast
Source: DEC Prospects Group, World Bank.
Global Economic Prospects June 2011

26
2012 crop year is of normal size, then
internationally traded grain prices should decline
in 2012 (significant price relief is unlikely to be
observed until towards the end of 2011, as
information on harvests becomes clearer).
However, if the crop is poor (i.e. 5 percent—or 1
standard deviation—less than normal), then
wheat prices could rise by a further 3.5 percent
(figure 19).
Given the importance of oil and natural gas as
inputs to food production, food prices could rise
an additional 16 percent should oil prices
increase by the $50/bbl outlined in the earlier oil
price scenario.
Persistent euro-area uncertainty, and rising high-income country interest rates as monetary stimulus is withdrawn, could reveal further weaknesses in the global economy.
The fiscal situation in high-income countries
continues to concern markets. Despite recently
announced and anticipated spending cuts, fiscal
policy in the United States remains loose due to
tax measures introduced or extended in
December 2010. The Congressional Budget
Office (2011) projects a U.S. federal deficit of
9.8 percent of GDP in fiscal year 2011 based on
current policies, and a debt-to-GDP ratio that
could climb to 77 percent of GDP by 2021, from
its current 62 percent of GDP level. In Japan, the
fiscal deficit is expected to exceed 11 percent of
GDP in 2011 and gross debt to exceed 230
percent.
At the same time in Europe, despite substantial
steps to reduce deficits in several countries, and
the multiple financial rescue-packages brought to
bear, markets remain concerned that one or more
Euro Area economies might have to restructure
its debt. The price of ensuring against default of
the sovereign debt of Greece has surged to
record highs for the Euro Area, and credit default
swap rates for Ireland and Portugal have also
given up earlier declines (figure 20). Even the
risk premium for traditional ―safe haven
countries‖ such as the United Kingdom and
Germany have edged upwards.
For developing countries, the situation in Europe
is of concern because a serious deterioration in
financial and economic conditions could weaken
demand for developing country exports. In
addition, banks could be forced to reduce credit
growth, or even repatriate funds from foreign
affiliates — with more direct impacts on credit
and economic growth in developing countries—
notably in Europe and Central Asia.
A restructuring of the sovereign debt of one or
more European countries could adversely affect
the capital of some Euro-area banks. Data from
the Bank for International Settlements (BIS)
suggests that the sovereign debt of Greece,
Ireland, Portugal and Spain held by Euro-area
banks may represent more than 20 percent of the
tier-1 capital of euro area banks. If a
restructuring caused capital adequacy ratios to
fall below regulatory thresholds, this could have
Table 4 Results of ECB stress test
Source: ECB (2011).
2011 2012
Euro Area -2.0 -2.0
European Union -2.1 -2.0
Russia -2.0 -1.3
China -1.0 -0.1
Rest of Asia -1.4 -0.1
Brazil -2.1 -0.1
Mexico -2.0 -0.5
Rest of Latin America -2.0 -0.7
Non-EU, Rest of the World -1.5 -0.3
Figure 20 Renewed pressure on high-income coun-
try debt
Source: World Bank, Thomson/Datastream..
5-yr sovereign credit-default swap rates, basis points
0
200
400
600
800
1000
1200
1400
1600
Jun Jul Aug Sep Oct Nov Dec Jan Feb Mar Apr May
Greece Italy
Ireland LMICs with Median < 200
Portugal LMICs with Median > 200
Spain
Global Economic Prospects June 2011

27
wider implications, given the extensive cross-
holdings between banks globally. In such a
scenario, European banks (but potentially other
banks as well) could be forced to re-consolidate
balance sheet in a second round.
In such scenario, banks might be compelled to
draw on resources of affiliates and subsidiaries in
developing countries (mainly in Europe &
Central Asia and Latin America & the
Caribbean), with negative effects on lending and
activity in those regions that extend beyond the
pure trade impacts of a slowing in European
growth.
Table 4 reports the results of an ECB simulation13
where an increase in risk aversion and an ensuing
decline in investor and business confidence cuts
into European growth by around 2 percentage
points, and generates similar impacts on GDP in
many developing countries as a result of reduced
exports and increased financial costs from
increased risk premia and falling asset values.
While authorities are taking steps to ensure
against a negative outcome, these persistent risks
are a reminder that the global economy has yet to
fully recover from the excesses of the pre-crisis
financial boom.
Indeed, additional problems and issues may not
have been revealed as yet. The very low long-
term interest rates engineered by high-income
central banks through both orthodox and
extraordinary measures such as quantitative
easing, may have allowed some firms and banks
to survive and prosper in some cases, even if not
all underlying structural problems have been
resolved. As central banks stop intervening in
Treasury-, mortgage- and corporate bond markets
and stricter financial regulations kick-in, long-
term interest rates are expected to rise, increasing
financing costs. Such higher costs may expose
vulnerabilities that until now have remained
hidden.
Moreover, as outlined in the January edition of
Global Economic Prospects 2010 (World Bank,
2010), higher long-term rates may be associated
with a temporary slowing of trend growth rates in
developing countries, as higher borrowing costs
are reflected in a less capital-intensive growth
path—an effect that is incorporated into the
baseline forecast.
Concluding remarks
The recovery from the unprecedented global
recession that followed the September 2008
financial crisis has gathered strength, and, despite
significant tensions and hurdles ahead, appears
likely to continue to mature over the coming
three years.
While the dynamic of recovery appears well
established and has spread from developing
countries to high-income economies, significant
challenges and risks remain. Strong growth in
developing countries, coupled with political
tensions in oil producing regions have once again
pushed oil prices to levels where further increases
could significantly curb economic growth.
Monetary policy has responded, but fiscal and
exchange-rate policy may need to play a bigger
role if inflationary pressures are to be contained.
High oil prices have contributed to high food
prices, with important negative consequences for
real incomes of the urban poor. So far, the worst
of these impacts has been avoided because
domestic food prices in developing countries
have not increased as much as international food
prices. But if the 2011/12 crop year disappoints,
as did the 2008/09 and 2010/11 years, then
pressures on the incomes and nutrition of poor
families can be expected to intensify.
The maturation of the cycle, and the gradual
withdrawal of the extraordinary measures put in
place to prevent a collapse of the global
economy, suggest that both short- and long-term
interest rates will rise. As they do, they are likely
to increase pressure on governments, firms- and
bank finances, potentially revealing weaknesses
that have remained hidden, given the ready
availability of cheap money. Should some of
these weaknesses emerge in economically
sensitive corners of the global economy, they
could bring serious consequences.
Global Economic Prospects June 2011

28
Notes
1. Global export volumes regained pre-crisis
levels, and stood 2.4 percent above pre-crisis
peaks as of February 2011. This has largely
reflected strong gains by developing
countries where merchandise exports stood 9
points above pre-crisis peaks in February.
High-income economies regained August
2008 levels in December 2010, and exports
are now on par with pre-crisis peaks.
2. See World Bank (2011a) for a description of
the methodology used to estimate ―no-crisis‖
levels of activity. Note that these capacity
utilization rates are statistically derived and
will differ from officially published sources.
They refer only to industrial production and
are distinct from the similar but ―whole-
economy‖ output gap.
3. Grains are the most important source of
calories in the diet of the poor, providing
between 80 and 90 percent of calories.
4. An additional 0.1mb/d of oil production was
shut in March due to unrest and strikes in
Yemen, Oman, Gabon and Côte d’Ivoire, but
market anxiety attaches the possibility of
larger disruptions to major oil producing
countries, including Nigeria in the run-up to
elections in April (about 1mb/d was
disrupted during the 2007 election
campaign).
5. IMF (2011) argues that loose monetary
policy may have contributed to these
conditions by lowering interest rates and
thereby reducing the cost of warehousing
stocks to facilitate speculation when future
prices are higher than spot prices.
6. Stock to-use ratios in major exporting
economies are used here to control for
distortions caused by large fluctuations in
recent years in the stocks of major
producing/consuming countries, but which
do not participate in global commodity
markets.
7. Not all of the food content of maize and
sugar used in biofuel production is lost.
About 1/3 of maize that is used in biofuel
production is returned to the food cycle as
feed grain.
8. Relative valuation measures (price-earnings,
price-to-book, price -to-sales, and dividend
yield) in developing countries had been
trading at a substantial discount relative to
high-income countries during 2009 and part
of 2010. However, the discount vanished by
the third quarter of 2010, when developing
countries even traded at a small premium
over high-income countries. Since then, the
pace of initial and secondary public
offerings in developing countries (and their
take-up by high-income investors) has eased.
In addition developing country stock
markets have stabilized.
9. New data for China suggest that the decline
in FDI in 2009 was less pronounced (37
percent) than earlier thought, and that the
rebound in 2010 was somewhat stronger (25
percent).
10. The IMF in its latest World Economic
Outlook (2011) projects that global
imbalances will rise somewhat over their
projection period, both reflecting an
assumed nominal depreciation of the
renmimbi viz-a-viz the dollar and a
significant pickup in Chinese exports as
output gaps in high-income countries
decline.
11. For example, the Chinese Central Bank has
raised its reserve requirements eight times
since November 2010.
12. In the World Bank, Global Simulation
Model (GSM), the initial effect of an oil
price shock mainly impacts on the system as
a terms of trade shock. For oil exporting
countries, there is a gain in real income, as
prices of merchandise exports rise. The
impact is strongest in counties where oil
exports represents a large share of GDP (for
example in Angola and Nigeria), and where
import propensities are relatively low.
Among oil exporting countries, the import
propensity is significantly higher in Vietnam
and Papua New Guinea, than in Gabon and
Venezuela, RB - thereby reducing the net
GDP impact in the latter for a similar size
Global Economic Prospects June 2011

29
income gain.
In high-income oil exporting countries, the
overall GDP impact is negative due to
negative impacts in Canada and the UK,
whose non-oil exports are negatively
affected by slowing global demand.
Excluding these two countries, the impact on
the remained of the high-income oil
exporting countries is positive, due to their
high import intensities. A similar factor
explains the negative impact for East Asia
and Pacific oil exporters as the negative
impact on Malaysian non-oil exports
overwhelms the positive impact of higher oil
revenues on Malaysian GDP (excluding
Malaysia, the net impact is positive).
13. The ECB scenario assumes a spike in risk
premia on European sovereign debt, higher
short-term and long-term interest rates, and a
reduction in European business and
consumer confidence
References
Baffes, John. 2010. ―More on the Energy/Non-
Energy Commodity Price Link.‖ Applied
Economics Letters. 17: 1555-1558
Congressional Budget Office. 2011. The Budget
and Economic Outlook: Fiscal years 2011 to
2021. January. Downloaded April 29, 2011
http://www.cbo.gov/doc.cfm?index=12039
Dalsgaard, Thomas, Chirstophe André and Pete
Richardson. 2001. ―Standard Shocks in the
OECD Interlink Model‖. OECD Economics
Department Working Paper. No. 306.
European Central Bank. 2011. ―Macroeconomic
adverse scenario for the 2011 EU-wide Stress
test: Specification and results‖. Annex 2 in
European Banking Authority. 2011. Overview
of the EBA 2011 banking EU-wide stress test.
ht tp:/ /www.eba.europa.eu/cebs/media/
Publications/Other%20Publications/2011%
20EU-wide%20stress%20test/EBA-ST-2011-
003--%28Overview-of-2011-EBA-EU-wide-
stress-test%29.pdf
International Monetary Fund. 2011. World
Economic Outlook. April.
Timilsina, Govinda R. and Shrestha, Ashish.
2010. ―Biofuels: Markets, Targets and
Impacts‖. World Bank Policy Research
Working Paper. No.6534
TEPCO. 2011. Power Supply and Demand
Outlook in this Summer and Measures (3rd
Release). May 13
United Nations. World Tourism Organization.
2011. ―UNWTO World Tourism Barometer‖.
February 2011. [www.unwto.org]
Walsh, James P. 2011. ―Reconsidering the Role
of Food Prices in Inflation‖. IMF Working
Paper. WP11/71.
World Bank. 2010. Global Economic Prospects:
Finance, Crisis and Growth.
World Bank. 2011a. Global Economic
Prospects: Navigating Strong Currents.
World Travel and Tourism Council. 2011
Tourism Impact Data and Forecast. May
2011. [www.wttc.org]
Global Economic Prospects June 2011


Global Economic Prospects June 2011: Subject Annex
Global industrial production has rebounded in
the fourth quarter of 2010 following the pause in
global growth in the third quarter, only to
moderate again by the end of the first quarter of
2011. The growth slowdown in the third quarter
appears to have mainly reflected an inventory
cycle, as underlying demand growth (proxied by
GDP) continued to expand at a more-than 1.5
percent annualized rate (figure IP.1). In
developing countries output accelerated
beginning in the fourth quarter of 2010, and by
the end of the first quarter of 2011, industrial
activity in developing countries was expanding
at a 13.4 percent annualized pace. In high-
income countries industrial production growth
decelerated sharply to 6.4 percent in the three
month to March, from 15.3 percent in the three
months to February, on account of a sharp 15.5
percent month-on-month decline in Japanese
industrial production in March. Excluding Japan,
growth in high-income countries was 7.9 percent
in the three months to March, up from 6.7
percent in the fourth quarter of 2010.
The acceleration in the seasonally adjusted
annualized rate of growth in developing
countries was broadly-based, with the strongest
pace recorded among countries in the East Asia
and Pacific (18.7 percent in March before easing
to 15 percent in April), and Latin America and
the Caribbean (10.3 percent). Growth in
industrial production in Europe and Central Asia
regions was 9.8 percent in the three months to
March before decelerating to 3.8 percent by
April, while production rose to 8.7 percent in
South Asia in the three months to March, and to
6.8 percent in the three months to February in
the 4 Sub-Saharan African countries reporting
data.
The good performance in industrial production
has been underpinned by buoyant domestic
demand in developing countries and a moderate
recovery in high-income consumer spending.
Slowly improving labor markets in several high-
income countries have contributed to a return to
solid retail sales volume growth. At the same
time, the expiration of various incentive
programs in both high-income and developing
countries has contributed to volatility. For
example, Chinese retail sales volumes growth
slowed to 11.4 percent by March 2011 from 17.8
percent a year earlier, in part because of the
expiry of new-car sales tax incentives.
Nonetheless, global retail sales has posted
positive annual growth for the last two years,
with gains in developing countries (in a range of
7 to 15 percent annualized) while growth in high
-income countries remained subdued (figure
Industrial Production Annex
Figure IP.1 Recent rebound in Industrial pro-
duction following mid-year pause reflects inven-
tory cycle
Source: Thomson/Reuters Datastream; World Bank.
-40
-30
-20
-10
0
10
20
-10
-8
-6
-4
-2
0
2
4
6
Q1-08 Q3-08 Q1-09 Q3-09 Q1-10 Q3-10 Q1-2011
World real GDP growth, quarterly ch% q/q saar. Sample of 50 high-income and developing countries
GDP left
IP right
Quarterly GDP growth, % (saar) Monthly industrial production growth, % (3m/3m saar)
Figure IP.2 Retail sales support growth
Source: Thomson Datastream and World Bank.
-10
-5
0
5
10
15
20
25
Jan-06 Nov-06 Sep-07 Jul-08 May-09 Mar-10 Jan-11
High-income
China
Developing countries, excl China
percent, y/y
31

Global Economic Prospects June 2011: Subject Annex
IP.2).
Many economies are now close to their pre-crisis
peaks in industrial production, with emerging
economies faring better than high-income
countries (first panel, figure IP.3a). Industrial
production in China is now more than 40 percent
above its pre-crisis peak, and 36 percent higher
for the East Asia region considered as a whole.
Production in South Asia continues to grow
strongly, and stands 21.4 percent higher than
before the crisis peak, while Latin America and
the Caribbean, Europe and Central Asia, and the
Middle East and North Africa have yet to exceed
earlier peaks levels.
Manufacturing capacity is now close to or above
trend levels in East Asia & Pacific, Latin
America and South Asia. In these regions the
recovery has entered a new more mature phase
where additional investment in productive
capacity will be necessary to sustain growth
ahead. Ample spare capacity remains in Europe
& Central Asia and the Middle East & North
Africa, with gaps estimated to be 14 percent and
around 12 percent respectively. Spare capacity
for the four countries in Sub-Saharan Africa for
which data is available is also large at 9.2
percent (second panel, figure IP.3b).
To date only limited data (through February) are
available for industrial production in the Middle-
East and North Africa region. In Tunisia
industrial production reportedly dropped 9.2
percent in the first quarter of 2011 over the same
period of 2010, and on a seasonally adjusted
annualized basis, output contracted 38 percent.
In Egypt industrial production was down 8.3
percent year-on-year in the first two months of
2011, and 51.5 percent on a seasonally adjusted
annualized rate relative to the previous two
months. Industrial production is likely to begin
to recover only modestly in following months.
Accounting for the impact of the Japanese
Earthquake, Tsunami and nuclear crisis
The earthquake and Tsunami in Japan have also
disrupted global industrial production. Current
estimates suggest that damage from the Tohoku
earthquake and Tsunami is significantly larger
than that sustained following the Kobe
earthquake in 1995. The impact of the Kobe
earthquake on Japanese and global economic
activity was relatively modest (a one-month
decline of 1.6 percent in Japanese industrial
production and of 8.4 percent in exports—
followed by a 14 percent increase—and no
discernible effect on quarterly GDP). If
anything, the boost to private and public
investment associated with the reconstruction
effort was a net positive for GDP growth (table
IP.1).
The current crisis is different because of the
much larger disruption to Japan’s electrical
Figure IP.3a Most countries are yet to reach their
pre-crisis industrial production peak
Source: Thomson Datastream and World Bank.
60
70
80
90
100
110
120
130
140
Jan-08 Jul-08 Jan-09 Jul-09 Jan-10 Jul-10 Jan-11
USA
China
Other developing countries
Japan
Other high-income countries
pre-crisis peak = 100
Figure IP.3b Industrial capacity utilization in Asia
and Latin America approaches trend rates
3.2 2.9 1.4
-9.2 -11.9 -14.4
-60
-40
-20
0
20
40
60
South Asia East Asia & Pacific
Latin Am. & Caribbean
Sub-Saharan Africa
Middle East & N. Africa
Europe & Central Asia
median percentage difference from long-term trend and within-region country sample-variation
32

Global Economic Prospects June 2011: Subject Annex
generating and distribution capacity, which has
forced Japanese utilities to institute rolling
blackouts that have contributed to plant
shutdowns. About ½ of the disruption to
electrical generating capacity concerns
geothermic generating capacity and is expected
to be fully restored in May, while lost nuclear
capacity may be permanent. Currently,
generating capacity in the Tokyo area, which
represents about 40 percent of Japanese GDP,
exceeds demand levels by almost 30 percent—
partly because of voluntary conservation efforts.
At the peak of the crisis capacity was reduced by
40 percent. TEPCO now expects to have 52m
KW hours of capacity in place by the end of
July, approximately 84 percent of peak summer
demand. For Japan as a whole, the projected
shortfall represents 3.8 percent of generating
capacity.
March data suggest that the economic impact of
the earthquake and tsunami was larger than
initially expected. Industrial production declined
a sharp 15.5 percent in March, retail sales
contracted an annual 8.5 percent, and machinery
and business equipment sales plunged 17
percent, while overall GDP declined 3.7 percent
(saar) in Q1.
After having declined 6.5 points in March to
46.5 the all-industry PMI plunged further in
April to 35 suggesting a sharp decline in output.
This reflects port closures, supply-chain
disruptions and suspended production at major
plants due to uncertain electricity supply—
affecting exports of automobiles, electronics, and
other industrial products. The disaster and
repeated large aftershocks appear to have cut
into the demand side as well. Partly out of
solidarity for those most immediately affected by
the crisis, many Japanese have cut back on
consumer demand (including electrical demand).
Japanese auto sales declined 30 percent
immediately following the quake, and output
was down 49.2 percent month-on-month in
March. Disruptions in the auto industry are
expected to last until the end of the second
quarter, and could result in a halving of output.
The disruption to industrial production has been
deep, but is likely to be relatively short-lived.
GDP is expected to decline in the second quarter
due to damaged infrastructure, closure of major
industrial plants, disruptions in energy supply,
shortages, and consumer restraint, before
bouncing back strongly in the third and fourth
quarters, as reconstruction efforts start (see main
text). The all-industry PMI has increased to 46
in May, suggesting a rebound in industrial output
from a very low base. Japanese output is
expected to pick up in H2 2011 (the Tankan
survey showed improved business sentiment for
May after a plunge in April). Nevertheless,
activity for the year will be flat, according to the
latest Consensus forecast.
International impacts are limited so far but
sectoral impacts are being felt. In the U.S.,
difficulties in securing parts caused total motor
vehicle production to decline 12.2 percent month
-on-month in April. A sharp decline in activity
would be expected to have an important impact
on Japan’s main trading partners, both as Japan-
sourced supplies become scarce and as demand
from Japan declines. Emerging Asia will be the
region most affected by the loss in economic
activity in Japan, as these countries trade heavily
with Japan and depend heavily on
manufacturing. The most affected economies
will be the ASEAN countries, followed by Korea
and Taiwan, China. China and India will also be
affected but less intensely (indeed, following the
quake, China’s purchasing manager index
actually improved –reflecting domestic
conditions).
Table IP.1 Impacts of the 1995 Kobe and 2011
Tohoku earthquakes
Source: World Bank; Various press reports and offi-
cial estimates.
Table Impacts of the 1995 Kobe and 2011 Tohoku earthquakes
Source: World Bank, various press reports and official estimates.
Kobe Tohoku
17-Jan-95 11-Mar-11
Dimension of tragedy
- size of tremor (Richter scale) 7.3 9.0
- Lives lost 6434 14,435
- Missing 11,601
- people left homeless 300000 450000
- Estimated Property Damage (% of GDP) 2.5 4-5
- Initial disruption to power system (% of generating capacity) 7.3
- Medium-term disruption to power system (% gen. cap.) 3.8
33

Global Economic Prospects June 2011: Subject Annex
Outlook
Both manufacturing and services purchasing
manager indexes1 (PMIs) have been rising
strongly at the beginning of 2011, but have
weakened starting in March reflecting, we
believe, temporary and one-off factors, including
the developments in Japan and weaker than
expected growth in the United States. The lower
PMI readings suggest that industrial production
growth will ease markedly in the current quarter
before reaccelerating in the second half of 2011,
on account of reconstruction efforts in Japan and
a lift from lower oil prices. More importantly,
outside Japan industrial production is expected
to grow at an above-trend pace, albeit
decelerating.
The sharp retreat in global PMI in March and
April to its lowest level since July 2009 comes
after very strong readings in January and
February. Global PMI outside Japan has also
declined, down 4 points to 54.1 by May, a
reading still consistent with near-trend growth.
The global new orders component excluding
Japan fell an even sharper 4.7 points in April,
but inched up 0.5 points in May. Most
components of the global manufacturing index
declined, and the employment index is now
higher than both the new orders and output
components. The services PMI indexes have also
declined sharply to 51 in April, after having
surged to 59.2 by February but has picked up
again in May to 52.5 (figure IP.4).
Industrial production in the euro area is expected
to perform well, supported by strengthening
consumer spending, robust business confidence
and accommodative monetary policy.
Nevertheless growth is expected to ease this
quarter, as indicated by recent PMI readings,
reflecting a slowdown in global trade expansion,
the effects of a stronger euro, and fiscal austerity
measures, and debt concerns among some
members. Industrial output is expected to expand
at a rate close to 5 percent in the second half of
2011, before easing to a more trend-like pace in
the outer years of the forecast horizon.
Among developing countries the latest PMI
readings suggest robust growth in manufacturing
output in India and South Africa, with more
moderate growth in Russia, Turkey, China, and
Brazil.
Although industrial production growth is
projected to surge in Japan during the second
half of the year due to reconstruction efforts,
elsewhere food and fuel inflation is cutting into
real incomes and is expected to contribute to an
easing in consumer demand growth and a
slowing of the industrial expansion. These
influences are already observable in recent data.
The annualized pace of real retail sales growth in
the United States slowed to 5.2 percent in the
first quarter of 2011 from 9.6 percent in the
fourth quarter of 2010.
Risks to the outlook
The overall outlook is subject to significant
risks, notably the possibility that the situation in
the Middle East and North Africa deteriorates,
causing oil prices to remain high or rise even
further. In this scenario rising input costs and
weaker consumer spending would likely lead to
weaker growth in industrial output in most
developing and high-income economies.
Growing capacity utilization ratios in many
developing countries may also restrict growth,
especially if inflationary pressures become more
marked – forcing an even more pronounced
tightening of monetary and fiscal policies
moving into 2012.
Figure IP.4 Global manufacturing PMI points
to deceleration in the broad global recovery
Source: JPMorgan.
30
35
40
45
50
55
60
65
Mar-09 Aug-09 Jan-10 Jun-10 Nov-10 Apr-11
Manufacturing output
New orders
Employment
points
34

Global Economic Prospects June 2011: Subject Annex
Finally, though the disruptive capital inflows to
several middle-income developing countries
have eased, they could return in force –
potentially resulting in further appreciation of
currencies and additional reductions to
competitiveness (and therefore growth) of
industry in these countries.
Notes
1. J.P.Morgan, Global All-industry PMI, May
2011 survey.
35

Global Economic Prospects June 2011: Subject Annex
The outlook for global trade
International trade has been volatile during the
current recovery, reflecting the wider inventory
cycle in global industrial production (see Main
text and Industrial Production annex). The
recovery in trade has been dominated by strong
import demand from developing countries,
which has accounted for more than half of the
increase in global imports. As the recovery
matures, support for trade is shifting from
temporary factors (government stimulus and re-
stocking of inventories) to more sustainable
drivers, notably a rebound in private sector
spending on capital goods and consumer
durables. Looking forward, world trade is
expected to continue expanding at close to 8
percent annual pace, above average in historical
context.
Trade volumes are surging again. After a
blistering pace of growth in the first half of
2010, global trade growth ground to a halt in the
third quarter, only to pick-up again strongly in
the fourth quarter. By March 2011 (latest data),
global merchandise trade volumes were
expanding at a 30 percent annualized rate
(3m/3m, saar), the fastest pace in over a decade
(figure Trade.1).
The rapid pace of trade growth partly reflects the
depth of the decline observed during the
recession. Despite faster growth rates, trade
volumes regained pre-crisis peak levels 32
months after the crisis, something achieved in
only 16 months following the previous major
slump in world trade in 2001 (figure Trade.2).
As of March 2011, global trade was 8.9 percent
above its pre-crisis peak, compared with 10.6
percent higher at the same stage in the previous
recovery. And in spite of recovery, global trade
volumes remain below trend levels (the level of
trade would have been if the crisis did not occur
and trade grew at its pre-boom average), though
developing countries have regained their trend
levels.
Developing country demand is at the heart of
the recovery in global trade. Import demand
from developing countries was responsible for
more than half of the growth of global trade
during the first half of 2010, and again during
the fourth quarter of 2010 and the first quarter of
2011. Like other regions (with the exception of
the United States) developing countries’ support
petered out in Q3-2010, but then rose strongly in
the fourth quarter (while U.S. imports declined).
Figure Trade.1 After decelerating in Q3, the
trade recovery has gathered pace again
Source: World Bank.
-50
-40
-30
-20
-10
0
10
20
30
40
50
2008M01 2008M07 2009M01 2009M07 2010M01 2010M07 2011M01
High IncomeDevelopingDeveloping ex. ChinaWorld
volumes, percent growth 3m/3m saar
Figure Trade.2 Recovery in current crisis lags
behind previous crisis
Source: World Bank.
0.6
0.7
0.8
0.9
1.0
1.1
1.2
1 3 5 7 9 11 13 15 17 19 21 23 25 27 29 31 33 35
From peak of April 2008
From peak of January 2001
Months
Peak volume = 1
Trade Annex
36

Global Economic Prospects June 2011: Subject Annex
For the first quarter of 2011, developing
countries accounted for nearly 50 percent (of
which China’s contribution alone was 25
percentage points) of the increase in global
import demand (figure Trade.3).
Developing country export performance has
shown considerable heterogeneity. Trade
volume growth in Asia has been extremely rapid.
Buoyed by strong growth in Pakistan and India,
the annualized pace of export growth in South
Asia reached a record 81.7 percent (3m/3m, saar)
in February 2011 and moderated to 74.9 percent
in March 2011 (figure Trade.4). Spurred by
strong performance in China, export volumes in
East Asia and the Pacific expanded at a 64.0
percent annualized pace in the 3 months to
January 2011 and moderating to 45 percent in
March 2011. Strong exports in Russia drove
volume growth in Europe and Central Asia to an
eight month peak of 15.5 percent (3m/3m saar)
by March 2011. And reflecting exchange rate
appreciation, export growth in the Latin America
and Caribbean region lags other developing
regions, having expanded at a 12.2 percent
annualized rate in the three months ending
March 2011.
The recovery in the dollar value of exports is
less advanced than that of volumes.
Notwithstanding the sharp rise in the price of
commodities in recent months, the dollar value
of exports has not recovered as far as volumes,
because many prices remain below their pre-
crisis peaks of 2008. As of January 2011, global
exports were 6.3 percent above their pre-crisis
peak in volume terms, but remained 5.7 percent
below earlier highs in dollar terms. Nevertheless,
price developments have favored commodity
exporters, in particular oil. metals and mineral
exporters. For example, the terms of trade
improvement for oil exporters in Europe and
Central Asia amounted to about 1.8 percent of
GDP, compared with a deterioration of 1.1
percent for oil importers in the same region
(figure Trade.5).
World trade growth is on more solid footing.
Capital goods exports have continued to
strengthen as the recovery matures, a sign of the
increasingly self-sustaining nature of the
recovery (figure Trade.6). During the recession,
capital goods imports fell by more than imports
of consumer durables and agricultural products
(although less than oil imports), as falling
demand and increasing uncertainty led
businesses to cut investment and run down
stocks. During the initial phases of the recovery,
growth in capital goods imports was driven by
massive government stimulus programs (most of
which had a heavy infrastructure component) as
well as a need for businesses to replenish their
Figure Trade.3 Contributions to global import
demand from selected regions and countries
Source: World Bank.
-10
-5
0
5
10
15
20
25
30
2010M01 2010M08 2011M03
Rest of Developing countriesChinaGermanyUSARest of High income countries Global
volume, percent growth 3m/3m saar
Figure Trade.4 South Asia leads in second phase
rebound in global trade
Source: World Bank.
-20
0
20
40
60
80
100
Jan-10 Mar-10 May-10 Jul-10 Sep-10 Nov-10 Jan-11 Mar-11
Europe and Central Asia
East Asia and Pacific
Latin America and Carribbean
South Asia
Middle East and North Africa
Percent growth, 3m/3m, saar
37

Global Economic Prospects June 2011: Subject Annex
stocks. Since that time, these temporary factors
have waned, and imports of capital goods by
businesses surged in the fourth quarter of 2010.
In the United States, for example, business
spending on equipment and software rose at a
7.7 percent annualized pace in the fourth quarter
– although it eased to just 1.8 percent growth in
the first quarter of 2011.
Recently, slowly improving labor market
conditions in high income countries have
boosted consumer goods imports, with trade in
these goods exceeding that of capital goods.
Consumer goods imports are now 4.6 percent
higher than their pre-crisis peak levels, while
capital goods imports remain 11.5 percent below
pre-crisis peak levels, partly reflecting the much
deeper trough they experienced (capital good
demand declined 35 percent during the crisis).
The global recovery also is becoming more
broadly based. High-income country exports
are now growing rapidly, though, consistent with
lower potential growth rates, not as quickly as
among developing countries. By March 2011
export volumes for high-income countries were
increasing at a 28.1 percent (3m/3m, saar) rate,
up from the 2.7 percent (3m/3m, saar) in July
2010. In contrast, developing countries’ export
volumes advanced at 33.4 percent (3m/3m, saar)
in March 2011, compared to a decline of 4.6
percent (3m/3m, saar) in September 2010.
Outlook and Risks
Global trade is expected to continue to grow
as the recovery matures. Though a moderation
of growth from the high first quarter figures is in
order, the expansion in global trade is projected
to remain above pre-crisis averages over the
forecast period. Overall, global merchandise
trade is anticipated to grow at about an average
of 7.6 percent over the forecast horizon (2011-
2013). Developing countries, which were at the
forefront of the global trade revival, will
continue to be important sources of demand.
However, with improvements in high-income
country labor markets, ongoing lax monetary
policy, and a rise in business and consumer
confidence, demand from high income countries
is expected to provide increasing support to
global trade growth.
Recent business surveys support the view that
global trade will continue to expand, at least for
the near term. Though the Global Purchasing
Manager’s Index, as reported by JP Morgan and
Markit, has fallen from its peak level in March,
it still remained in expansion territory in May,
including the sub-index for new export orders.
Moreover, the latest OECD Composite leading
indicators survey, designed to anticipate turning
points in economic activity relative to trend,
continues to point to expansion in most OECD
Figure Trade.5 The Recovery in Prices has Fa-
vored Oil Exporters
Source: World Bank.
-2 0 2 4 6 8 10
Sub Saharan Africa Oil Exporters
Europe and Central Asia Oil Importers
Middle East and North Africa
Latin America and the Carribean
Sub Saharan Africa Oil Importers
East Asia Pacific
Europe and Central Asia Oil exporters
South Asia
Terms of Trade Changes as a Share of GDP, percent
(%)
Figure Trade.6 Strong recovery in capital goods
imports but still below pre-crisis levels
Source: World Bank.
0.5
0.6
0.7
0.8
0.9
1.0
1.1
2008Q1 2008Q3 2009Q1 2009Q3 2010Q1 2010Q3
Agriculture
Capital and Industrial goods
Consumer goods
Oil
Values, 3mm imports
38

Global Economic Prospects June 2011: Subject Annex
countries even if at a lower pace- this should
inevitably provide support to further trade
growth.
The risk of a faltering in global economic
recovery. Nonetheless, significant risks to the
continued expansion in global trade remain. The
most significant risk is a faltering of the global
economic recovery. As outlined in the main text,
a key risk to the global recovery is the possibility
of higher oil prices – either due to continued
uncertainty in the Middle East, or because of a
major disruption to supplies. Though this
remains a “tail-probability” event, should it
occur, it could derail the recovery, since higher
oil prices would reduce incomes in oil-importing
countries, cutting into consumer and business
demand. A further $50/bbl increase in oil prices
could shave global GDP by 0.3 percent in 2011
and 1.2 percent in 2012. These could in turn
reduce global trade by 0.5-1.5 percent in 2011
and by between 1.9-6.0 percent in 2012. Other
risks to the global recovery include a possible
slowdown in growth from a tightening of
monetary policy in some of the large fast
growing developing economies and a resurgence
in the euro area sovereign debt crisis (see main
text).
Ramifications of the Japan earthquake on
global trade. The recent disaster in Japan is
another source of concern. Japan’s share of
global trade is less than 5 percent, so even a
recession there is unlikely to derail global trade
growth. However, individual countries could be
significantly affected. Non-oil exporting
countries whose exports to Japan account for a
sizeable share of their total exports and GDP, for
example Malaysia, Papua New Guinea, Vietnam,
Singapore, Thailand and the Philippines, will be
most affected. In addition, disruptions in the
global supply chain due to the situation in Japan
could affect trade in many products, which could
have major implications for industry (especially
where switching to other suppliers requires
significant re-tooling). Against this backdrop,
industries whose global supply chains are very
much dependent on critical supply of parts from
the North East part of Japan (Miyagi prefecture)
are likely to be the hardest hit. These could
include parts supplies in the semiconductor,
auto, camera recorders and office equipment
industries (figure Trade.7). Already in the U.S,
recent industrial production figures released
show that the total motor vehicles assembled
dropped from an annual rate of 9.0 million units
in March to 7.9 million units in April mainly on
account of disruptions to part supplies resulting
from the Japan earthquake.
While in the short-run Japanese industrial
production and exports are likely to fall, in the
medium term reconstruction will require a ramp
up in demand for capital goods and for the
industrial metals necessary to repair capital stock
and build new infrastructure. This new demand
from Japan could significantly boost exports
from the high-income countries that dominate
global exports of capital goods, as well as from
developing country metals exporters.
Global Imbalances. The onset of the global
crisis accelerated the narrowing of global
imbalances that had already begun in 2006.
Global imbalances (measured as the absolute
value of national current account balances
divided by global GDP) peaked at 5.6 percent of
global GDP in 2005 and fell to 3.9 percent in
2009 and to an estimated 3.3 percent in 2010.
The question is whether this is a short-run
change or a structural change brought about by
the crisis.
Figure Trade.7 Share of Japan’s exports in
World exports
Source: Comtrade
0% 5% 10% 15% 20% 25% 30% 35% 40% 45%
Parts for spark-ignition type engines nes (HS840991)
Automobiles piston engine > 1500 cc to 3000 cc (HS870323)
Parts of printers, copiers and facsimile (HS 844399)
Automobiles piston engine > 3000 cc (HS870324))
Television, digital, and video camera recorders (HS852580)
Tansmissions for motor vehicles (HS870840)
Excavators with a 360 revolving superstructure (HS842952))
Machines for making semiconductor devices (HS848620)
Tankers (HS890120)
Cargo vessels nes&oth vessels (HS8901090)
(average 2008-09)
39

Global Economic Prospects June 2011: Subject Annex
The future evolution of global imbalances
depends on a constellation of real and financial
forces, including exchange rate movements, the
extent to which developing country domestic
demand remains a major source of growth, and
the extent to which high-income countries rein in
government deficits and low interest rates as
their economies recover. To the extent that
surplus countries do not experience real effective
appreciations of their exchange rates, and that
recovering high-income countries maintain
current levels of government dis-saving and low-
interest rates, which encourage low private-
sector savings rates, the global imbalances that
characterized the early 2000s through 2007
could return.
Increased Protectionism. High unemployment
rates, global imbalances, and perceptions of
exchange rate undervaluation among trading
partners puts pressure on governments to take a
more protectionist stance on international trade,
with the potential to slow the expansion of trade.
These pressures have only heightened in the
aftermath of the global recession. The WTO
reports that between November 2009 and
October 2010, new trade restrictive measures
covering some 1.2 percent of global imports
were introduced.1 New trade restrictions
introduced since the commencement of the crisis
in 2008 have affected some 1.9 percent of total
trade. Though some of the measures were meant
to be temporary, so far only 15 percent of the
measures introduced have been removed. Most
of the measures that have been introduced affect
trade in base metals and products, machinery and
mechanical appliances, and transport equipment,
all of which are important in helping to rebuild
productive capacity to help sustain the recovery.
Further, Bown and others (2010), find that
increasingly such measures are being applied
within the context of South-South trade.2 They
observe that protectionism has been imposed
disproportionately by developing world
importers on developing world exporters,
notably China. Though the current application of
such protectionist measures remains limited, the
greater threat lies in the continued accumulation
of new restrictions, without repealing earlier
temporary ones, thereby leading to an increasing
share of trade affected by restrictive measures.
Notes
1. WTO, 2010. Overview of Developments in
the International Trading Environment. WT/
TPR/OV/13, World Trade Organisation,
Geneva.
2. Chad P.Bown and Hiau Looi Kee (2010)
“Developing Countries, New Trade Barriers,
and the Global Economic Crisis” in Mona
Haddad and Ben Shepherd (eds), Managing
Openness, The World Bank, Washington,
D.C.
40

Global Economic Prospects June 2011: Subject Annex
Recent trends in capital flows
International capital flows to developing
countries have slowed since October…
Gross capital flows (international bond issuance,
cross-border syndicated bank loans and equity
placements) to developing countries totaled $175
billion in the first four months of 2011, 24
percent less than the last four months of 2010
(figure FIN.1). Most of the decline was in equity
placement (foreign investment in IPOs and
follow-on offerings), which plummeted by 35
percent. There have been no major IPOs from
developing countries this year, after the record
breaking equity issuance of 2010. International
syndicated bank-loans remained subdued
compared with pre-crisis levels—although there
was a modest rebound in lending to Europe and
Central Asia (notably, Russia and Turkey) and
Sub-Saharan Africa (Nigeria and South Africa).
In contrast to equity placement and bank-
lending, international bond issuance by
developing countries was strong in the first
quarter, attaining the highest monthly level on
record in January. A combination of relatively
favorable pricing conditions and investor’s
continued search for yield led to a near record
pace of borrowing activity. Corporate borrowers
continued to dominate bonds with about 80
percent of year-to-date volume, with most issues
coming from companies in China, Emerging
Europe and Latin America. Chinese companies
issued a record volume of international bonds in
the first quarter of 2011, partly reacting to the
increased cost and rationing of domestic finance
following the government’s policies to curb
credit growth. The pace of issuance has slowed
considerably since January, partly reflecting the
impact of increased uncertainty in global
markets.
…as have the hot money flows, easing some of
the pressures for currency appreciation.
Portfolio investment—equity placement, foreign
investment in existing stocks and foreign
investors’ purchase of local debt securities, also
referred to as “hot money”—has eased since
early 2011 (figure FIN.2). Most of the decline
was in equity placements and foreign investment
in stock markets, as there were considerable
stock-market sell-offs during January and
February, aside from the sharp fall in equity
placement.
Growing concerns about sovereign debt in high-
income countries, inflation, political turmoil in
the Middle-East and North Africa, and high
Figure FIN.1 Gross capital flows have eased since
November
Source: Dealogic.
0
5
10
15
20
25
30
35
Jan-09 Jun-09 Nov-09 Apr-10 Sep-10 Feb-11
3-month moving average ($ billion)
Bond issuance
Equity placement*
Syndicated bank loans
*Foreign investment in IPOs and follow-on offerings
Figure FIN.2 Hot money flows slowed down since
October
Source: Central Banks and World Bank.
-6.0
-4.0
-2.0
0.0
2.0
4.0
6.0
8.0
2007 Q1 2008Q1 2009Q1 2010Q1 2011Q1e
Foreign portfolio investment flows*% of GDP
BrazilTurkeySouth AfricaIndia
*Equity placement, foreign investment in existing stocks and foreign investors’
purchase of local debt securities
Financial Markets Annex
41

Global Economic Prospects June 2011: Subject Annex
commodity prices have combined to slow the
pace of portfolio equity inflows to developing
countries. In addition, investors may also have
considered that market equity valuations had
reached maximum levels and started to take
profits. During the first quarter of 2011, there
was a net outflow of nearly $25 billion from
emerging market (EM) equity funds, compared
with a net inflow of $85 billion in 2010.
Similarly, foreign investors’ interest in emerging
market bonds (both in local and other currencies)
has also diminished considerably since October
2010 (figure FIN.3). And the EM fixed income
funds registered a net outflow in February with a
little improvement in March. Most of the decline
was in flows to EM local currency funds, which
have become quite popular in recent years, and
experienced record inflows in 2010 (see box
FIN.1: Domestic debt market developments in
emerging markets). The outflows from both EM
equity and fixed income funds do not necessarily
imply a net outflow in terms of balance of
payments financing, but highlights the easing in
these types of flows to developing countries.
Country specific factors also played an important
role in the slowing of capital inflows. South
Africa (in November) and Turkey (in December
and January) cut their policy interest rates—
reducing the attractiveness of the carry-trade
with these countries. The impact of the rate cuts
turned out to be temporary in Turkey, however.
After a slow down, foreign purchases of Turkish
local debt securities rose to a record $4.8 billion
in March. While Brazil increased the tax on
foreign investments twice in October, the fall-off
largely reflected at drop in IPO activity
following the record sale of Petrobras in
September 2010 that attracted large foreign
participation.
Several middle income countries experienced
sharp appreciation of their currencies in 2010
following the surge in capital inflows. With the
easing of these flows during the first quarter of
2011, the upward trend in real effective
exchange rates also moderated (Thailand) or
even reversed (South Africa and Turkey) (figure
FIN.4). Brazil (due to large FDI inflows) and
Mexico (flows into local debt securities) did not
experience large depreciations. Consistent with
the initial slowing of capital inflows, the pace of
reserve accumulation among developing
countries also slowed from 8 percent in 2010Q3
to 5 percent both in 2010Q4 and 2011Q1.
The fundamental conditions that underpin
capital flows to developing countries remain
strong…
Emerging markets entered 2011 with an
improved risk profile, as well as higher growth
prospects vis-à-vis the high income countries,
and policy interest rates that were rising. Despite
some recent increases (the ECB raised its
Figure FIN.3 Inflows to EM fixed income funds
have slowed down since October
Source: EPFR Global.
-2
-1
0
1
2
3
4
5
6
Jan-10 Apr-10 Jul-10 Oct-10 Jan-11
$ billion
"Blended" funds
Local currency funds
Hard currency funds
Figure FIN.4 Real effective exchange rate ap-
preciation in selected economies
Source: International Monetary Fund.
95
100
105
110
115
120
125
2010M01 2010M06 2010M11 2011M04
Brazil India
South Africa Turkey
Mexico
Index , January 2010 =100
42

Global Economic Prospects June 2011: Subject Annex
official rate by 25 basis points (bps) to 2 percent
in April 2011), policy interest rates in high-
income countries remain low, while those in
developing countries are rising. The rates in
emerging economies are expected to go up
further as these countries tighten monetary
policy in the face of heightening inflationary
pressures. This will likely increase interest rate
differentials in favor of developing country
assets—although this effect will be reduced if
and when high-income countries begin
withdrawing quantitative easing measures and
tighten more traditional monetary policy.
Policy interest rates for a number of developing
countries have been raised since mid-2009 as
strong economic activity has signaled a rapid
closing of output gaps and inflation has been
moving up. As the inflationary effects of higher
oil prices are more evident, policy makers will
undoubtedly look toward tightening monetary
policy. This is especially likely in Asia and Latin
America, where central banks are already
grappling with higher inflation amid stronger
growth and record food prices. Market-estimated
changes in policy rates point to further hikes in
official rates for most of emerging market
countries this year (figure FIN.5). Rising
inflation rates have been pushing real yields
down in countries with increasing inflation. Real
yields turned negative in several emerging
markets, including Russia and Thailand, making
local bond less attractive—though yields remain
positive in real terms if adjusted for the
expectation of currency appreciation.
…and developing countries continue to struggle
with mitigating the impact of high capital flows.
In an attempt to limit the high levels of capital
inflows and currency appreciation, Turkey
reduced its policy interest rate twice in
December 2010 (by 50 bps) and later in January
2011 (by 25 bps) bringing the rate to an all time
low. While this move surprised the markets and
led to portfolio equity outflows in December and
January, cross-border flows to local debt markets
remained strong. Nevertheless, Turkey’s real
effective exchange rate eased by 7 percent
between December and April 2011. Similarly,
South Africa lowered its policy rate by 50 bps on
November 13th, with some impact on portfolio
investment and the real exchange rate. Both
countries will find it difficult to maintain low
rates however, as they are facing increasing
inflationary pressures.
Other policy responses to mitigate the short-term
impacts of hot money flows have included the
introduction of capital controls, higher foreign
currency reserve requirements for banks,
minimum holding periods, or withholding taxes
on foreign investment in order to discourage
inflows; and improvements in the enforcement
of existing restrictions on cross-border inflows.
For example, Brazil raised its financial
operations (IOF) tax on foreign investment in
fixed income securities twice in 2010. The
impact of these hikes was limited and short-
lived, and they were followed by a further
increase in April. Brazil also announced that it
will extend the high tax rate on the renewal of
foreign loans with maturities of up to a year,
while a reintroduction of a 15 percent
withholding tax on federal securities is under
consideration.
Indonesia imposed a 1-month minimum holding
period on central bank money market certificates
in July 2010, and introduced new regulations on
the net foreign exchange positions of
Figure FIN.5 Accelerating inflation could lead to
a further monetary tightening
Source: Bloomberg and World Bank staff calcula-
tions.
0
50
100
150
200
250
300
350Change since 2009 low
Market estimated change between now and end of 2011
Change in of f icial interest rates (basis points)
43

Global Economic Prospects June 2011: Subject Annex
commercial banks. And Thailand implemented a
15 percent tax on interest income and capital
gains earned by foreign investors. And rather
than new measures, China announced that it will
intensify enforcement of the existing measures
on capital inflows.
The IMF published a report in April 2011
providing a framework for managing the impact
of high capital flows (IMF, 2011a). The report
suggests that, if possible, countries should first
respond to higher capital inflows by letting their
exchange rates appreciate, easing monetary
policy and tightening fiscal policy. If that is not
possible, countries are urged to first use controls
that do not discriminate between foreign and
domestic investors, for example limits on foreign
currency borrowing by local banks or minimum
holding periods. According to the framework,
measures that discriminate against foreign
investment, such as taxes on foreign capital
inflows imposed by Brazil, should be a last line
of defense. At the same time, the report
recommends that the use of controls should be
proportional to the economic risk, that they
should be withdrawn when they are no longer
needed; and importantly, that countries should
bear in mind the costs of using them.
FDI inflows have gained momentum since the
last quarter of 2010...
Foreign Direct Investment (FDI) inflows gained
momentum in the last quarter of 2010 (figure
FIN.6). FDI flows in early part of 2010 were
likely restrained by uncertainty concerning the
global recovery. This uncertainty has since
eased—especially concerning growth in
developing countries—and cross-border mergers
and acquisitions (M&A) transactions (which
react more quickly to changing economic
conditions than greenfield investment) in
developing countries accelerated in the second
half of the year.
FDI inflows to developing countries increased
by 24 percent in 2010, a relatively modest gain
(less than the rise in other capital flows to
developing countries) considering its 36.5
percent decline in 2009. The rebound in FDI
Box FIN.1. Domestic debt market developments in emerging countries
Domestic debt markets in developing countries have grown markedly over the past decade as many countries
shifted from external to local currency financing to lower the volatility of their debt service given their more flexi-
ble exchange rate regimes. This shift is particularly true for government bond issuers as domestic public debt now
accounts for more than 80 percent of the total public
debt for developing countries (box figure FIN.1). In
recent years, local-currency bond markets have ex-
panded considerably in several countries—among them
Brazil, Colombia, China, India, Malaysia, Mexico,
South Africa, and Turkey (World Bank 2009). Growing
interest from local investors—particularly from pension
funds—has played a key role in the development of do-
mestic debt markets in developing countries.
With extraordinarily easy monetary policy in the high-
income countries, international investors are also in-
creasingly drawn to emerging market local currency
bonds, with higher yields and prospects of capital gains
arising from currency appreciation. As a result inflows
to fixed-income funds focusing on developing countries
reached a record $65 billion in 2010, with the overall
allocation biased toward local currency funds (figure
FIN.3 in the text). Despite the recent fall-off, foreign
purchases have continued in Latin America, with Mex-
ico posting record $12 billion inflows through March
this year.
Box figure FIN.1 External and domestic public
debt in developing-countries
Source: JP Morgan.
0
10
20
30
40
2000 2002 2004 2006 2008 2010e
Domestic External
% of GDP
44

Global Economic Prospects June 2011: Subject Annex
inflows in 2010 was much stronger than the
World Bank’s January estimate of 15 percent
growth (Global Economic Prospects 2011a),
mainly because of large revisions by China to its
historic and 2010 FDI numbers (box FIN.2). For
developing countries excluding China, the
rebound in 2010 was slightly above 10 percent.
Most of the increase in FDI inflows in 2010
came from higher reinvested earnings. Income
generated by FDI projects in developing
countries increased 26 percent in 2010,
compared to its level in 2009. Multinationals
invested 30 percent of this income back into
developing country operations in 2010,
accounting for 35 percent of FDI inflows. FDI
was also supported by increased South-South
flows—particularly from Asia. With the sharp
decline of FDI outflows from high-income
countries since the crisis, investment from other
developing countries rose to 34 percent of total
inflows in 2010, up from 25 percent in 2007.
Cost of borrowing is on the rise
Long-term yields in developing countries are
facing pressures from rising long-term rates in
high-income countries…
The implicit yield on emerging market sovereign
bonds (EM spread + U.S. 10 year treasury yield)
has risen 50 bps since September 2010, mainly
due to upward movements in high-income
country long-term sovereign yields (figure
FIN.7). Long-term interest yields for
government bonds rose since early September
2010 in the United States (60 bps), Japan (25
bps) and the European Union (74 bps), reflecting
rising government debt, higher inflationary
expectations and perhaps reduced demand as the
impact and extent of quantitative easing slows.
Figure FIN.6 FDI inflows for selected economies
Source: The World Bank.
0
20
40
60
80
100
120
2009Q1 2009Q3 2010Q1 2010Q3 2011Q1p
$ billion
Box FIN.2 China revised up capital account numbers for 2005-2010.
China’s State Administration of Foreign Exchange (SAFE) revised the capital account in their balance of pay-
ments report following implementation of a new accounting method. Much of the adjustment is in FDI inflow
numbers, which are revised up between 20-75 percent for the period 2005-2010 (see Box figure). SAFE cited
better accounting for reinvested earnings by multina-
tionals as the main reason for the upward revision. This
portion of FDI does not cross the border, and hence
may not be fully recorded in government reports.
According to the new estimates, FDI inflows to China
rebounded strongly by 62 percent in 2010, reaching
$185 billion. The largest increase was in the financial
sector (300 percent) followed by the real estate sector
(78 percent), reaching $12 billion and $21 billion, re-
spectively. Nonetheless, the manufacturing sector re-
mains the main recipient of FDI inflows to China.
Manufacturing received $70 billion in 2010, 50 percent
more than in 2009. With the revisions, China now ac-
counts for 30 percent of total FDI inflows to develop-
ing countries, compared to an estimated one-fourth in
previous statistics.
Box figure FIN.2 FDI inflows to China
Source: China’s State Administration of Foreign Ex-
change.
0
50
100
150
200
2005 2006 2007 2008 2009 2010
Old Revised
$ billion
45

Global Economic Prospects June 2011: Subject Annex
Developing country spreads have remained in a
tight range despite ongoing geopolitical unrest
and economic uncertainties. The events in the
Middle East and North Africa region led to a
widening in spreads only within the region and
among the most affected countries. Credit risk
(as reflected in 5-year CDs spreads) for Egypt,
Bahrain and Saudi Arabia widened between 50-
150 bps immediately after the turmoil in late
January and February, but most stabilized in
March. Meanwhile, concerns related to the
European debt crisis reemerged in early March,
when International Credit Rating Agencies
downgraded ratings of Greece, Spain and
Portugal, citing worries about their ability to
reach their fiscal adjustment targets, in some
cases linked to political stability concerns. CDs
spreads for these economies rose following the
downgrades.
While Japanese stocks plummeted following the
March 11 earthquake, the impact of the crisis on
world financial markets has been limited.
Developing countries were little affected by
increases in risk aversion owing to the
difficulties in Europe and Japan—sovereign
bond spreads for the emerging markets as a
group remained within a tight range through the
end of April 2011 (figure FIN.8).
...and are expected to go up further.
Going forward, emerging market yields are
expected to increase amid rising long-term yields
in high-income countries. Spreads for
developing countries might also widen, as the
trend decline in risk premiums partly reflects the
very low policy rates and quantitative easing in
high-income countries (Hartelius et al 2008).
These easy monetary conditions have suppressed
the price of risk in both high-income and
developing countries, and prompted a search for
yield similar to that observed in the pre-crisis
period. Developing country spreads are sensitive
to U.S. Treasury yields. A jump in Treasury
yields, for example because of a sudden phase-
out of quantitative easing, could spark a sharp
widening of spreads on emerging market debt. A
more gradual policy tightening is likely to result
in a more modest and short-lived widening of
spreads.
Tighter financial regulation may also contribute
to higher long-term interest rates, and will likely
increase the cost of capital, potentially hindering
trade finance in the medium term.
Changes in the financial regulatory landscape
that have been implemented, and that are being
discussed both at the national and global level,
would tend to raise the cost of bank lending and
should be reflected in higher long-term interest
rates. In the United States, the June 2010 Dodd-
Frank bill forbids future government bailouts of
banks; places limits on risk-taking by financial
institutions, and introduces new clearing and
Figure FIN.7 The implicit yield on EM sovereign
bonds is up
Source: JP Morgan.
0
2
4
6
8
10
12
Jan-03 Jan-05 Jan-07 Jan-09 Jan-11
Yield on 10-year US treasury note
Implicit yield on EM sovereign bonds
PercentPercent
Bond spread
(EMBIG composite index)
Percent
Figure FIN.8 EMs spreads have remained in a
tight range despite the rising geopolitical risk
Source: JP Morgan.
220
240
260
280
300
320
340
360
380
Apr-10 Jul-10 Oct-10 Jan-11 Apr-11
EMBIG Spread (basis points)
46

Global Economic Prospects June 2011: Subject Annex
trading requirements for CDS markets. A revised
international agreement (Basel III) seeks to
strengthen banks’ resilience to systemic stresses,
by raising capital requirements and imposing
stricter definitions of what constitutes bank
capital. While the proposals incorporate a
generous phase-in period, with capital ratios to
be raised gradually, and linear phasing out of
ineligible securities between 2013 and 2019,
there remains uncertainty related to the
implementation of these requirements across
countries. The impact of Basel III on trade
finance is expected to be significant (box FIN.3
Impact of Basel III: Trade finance may become a
casualty).
Higher borrowing costs could reduce both the
level and the growth of GDP.
Higher capital costs due to increased long-term
interest rates and less abundant capital are likely
to cause firms to invest less, which will reduce
the amount of capital employed in the economy
and lower GDP levels from what they would
have been had capital costs remained low.
During the transition period from a high capital
usage regime to a lower capital usage regime, the
rate of growth of potential output in the economy
will slow.
Simulations suggest that higher capital costs
could lower developing country GDP growth by
between 0.2 and 0.7 percentage points over a
period of between 3 and 5 years. Global
Economic Prospects 2010 estimated that the
substitution away from capital intensive
techniques would reduce potential output in
developing countries over the medium term by
between 3 and 5 percent and potentially by as
much as 8 percent—depending on how much
long-term interest rates rise.
Developing countries can mitigate the costs of
the tightening of global financial conditions
through strengthening regional and domestic
institutions.
Inefficiency of domestic financial sectors
resulting from corruption, weak regulatory
institutions, poor protection of property rights,
and excessive limits on competition can make
borrowing costs in developing countries 1,000
bps higher than in high-income countries.
Improvements in the policies and institutions
Box FIN.3. Impact of Basel III: Trade finance may become a casualty
The Basel Committee on Banking Supervision, which sets rules that national banking regulators implement, an-
nounced a comprehensive reform package in September 2010 that raises capital requirements and, for the first
time, sets global standards for overall borrowing, known as leverage, and liquidity. The “Basel III” rules are de-
signed to make banks more resilient and prevent a repeat of the financial crisis, but several provisions combine to
make trade finance, already a low-margin business, much less profitable. Basel III’s implementation could have
unintended consequences for trade financing through the proposed leverage ratio, which would require banks to
set aside 100 percent of capital for any off-balance-sheet trade finance instruments, such as letters of credit. This is
five times more than the 20 percent credit conversion ratio used for trade finance in Basel II. New capital regula-
tions would also require banks to set aside capital for one year for any instrument, even though that security may
carry a maturity of under a year. Most trade finance instruments have maturities of about 90 days: this would triple
the capital cost of such instruments.
Such higher capital requirements are likely to depress trade finance. According to Standard Chartered Bank, the
new regulations would lead to trade finance becoming 15 to 37 percent more expensive, with volumes falling by 6
percent—which implies a $270 billion a year reduction in global trade and a 0.5 percent fall in global gross do-
mestic product. Developing countries would be particularly affected by a fall in trade finance. Trade finance is an
important source of working capital, particularly for small and medium-sized enterprises. And developing coun-
tries rely heavily on international banks for trade finance. In 2010, the largest rebound in capital flows was in short
-term debt, which reached $122 billion, and was for the most part trade finance (World Bank 2011).
There is some question as to whether this rise in capital requirements is necessary for trade finance, which is usu-
ally collateralized and has low default risk. The International Chamber of Commerce has published a study that
examined the trade finance activity of nine global banks from 2005 to 2009, which together arranged 5.2 million
transactions accounting for $2.5 trillion. It found that only 1,140 of those transactions defaulted. Of the 2.8 million
transactions arranged during the crisis in 2008 and 2009, only 445 defaulted (0.02 percent).
47

Global Economic Prospects June 2011: Subject Annex
governing the financial sector can thus have a
significant impact on domestic borrowing and
capital costs in developing countries. Such
changes have the potential to outweigh any
negative effect of higher costs for internationally
sourced capital. Simulations suggest that if
developing countries continue to improve
policies and other fundamentals, so that their
interest spreads fall by an average of 25 bps a
year, they would more than offset the long-term
effects of the financial crisis—potentially
yielding a 13 percent increase in long-term
potential output and increases in potential output
growth of about 0.3 percent per year by 2020.
Developing countries may also further increase
domestic savings by following closely their
comparative advantages in their industrial
upgrading and diversification (Lin 2007).
Prospects
Despite their recent moderation, international
capital flows to developing countries are
projected to rise further over the forecast period.
Cross-border flows to developing countries are
projected to increase further in nominal terms
over the medium-term, but at a slightly slower
pace than GDP growth, reaching $1.1 trillion
(3.8 percent of GDP) by 2013 (figure FIN.9).
Much of the increase is expected to be in FDI
inflows. FDI inflows to resource rich economies
and to developing countries with rapidly
expanding domestic markets are expected to
recover more firmly in 2011. Bank flows might
also rise as the deleveraging cycle has largely
come to an end. However, bank lending is
expected to remain lower than pre-crisis levels
due to approaching regulatory changes.
Other capital inflows that led the initial rebound
in 2010 have started to stabilize (or even decline)
as the expected monetary tightening in high-
income countries and inflationary pressures in
emerging markets dampens demand for
emerging market assets. Short-term debt and
portfolio investment flows in particular, may
face considerable weakening or sudden reversals
(table FIN.1). When quantitative easing in
advanced countries is phased out and global
liquidity conditions begin to tighten (or risk
aversion rises), developing country local bond
markets could be adversely affected, as carry-
trade related flows to developing countries slow.
Similarly, there may be a contraction in short-
term debt flows by 2013 with speculative flows
falling, and with trade-related portion hindered
by regulatory changes.
Downside risks for the outlook are still
considerable, however. First and most immediate
is the European debt crisis. While its impact on
developing countries has been limited and
temporary so far, an unexpected or disorderly
resolution of the debt problem might prompt
broad-based risk-aversion in global financial
markets driving capital flows toward safe-haven
assets. This could lead to a sharp reversal in
capital flows to developing countries, with a
potentially disproportionate impact on countries
in developing Europe and Central Asia, whose
economies are more closely tied to those in high-
income Europe. Second, international capital
flows are sensitive to the policy stance in high-
income and developing countries. If high-income
countries shift toward tighter policy more
quickly, or if markets become increasingly
concerned by the buildup of debt and central
bank liabilities, longer-term interest rates may
begin to rise quickly—raising the cost of capital
for developing countries and likely weakening
flows faster than expected. In fact, a recent IMF
study shows that an unanticipated 5 bps rise in
U.S. real interest rates might cause a 1/2
percentage point (pp) reduction in net flows
(inflows minus outflows) in the first quarter and
Figure FIN.9 Further increase in capital flows
Source: The World Bank.
48

Global Economic Prospects June 2011: Subject Annex
1.25 pps cumulative reduction in two years (IMF
2011b). The impact is projected to be larger in
countries with higher financial linkages with
United States.
With higher oil prices and increased debt-
financing requirements, several oil importing
economies will remain vulnerable to sudden
changes in global markets
Although the impact on credit risk was limited,
the events in the Middle East and North Africa
resulted in a sharp increase in oil prices. And
many oil importing countries now face higher
import bills and current account deficits. In
addition, developing countries issued
international bonds valued at $180 billion in
2010, and entered 2011 with $855 billion in
short-term debt. As a result, external financing
needs (current account projections and
amortization of external debt) for developing
countries increased from $0.8 trillion (3.5
percent of GDP) to $0.9 trillion (3.9 percent of
GDP).
While international debt market conditions have
been robust so far in 2011, high external
financing needs make countries vulnerable to
Table FIN.1 Net capital flows to developing countries
$ billions
Source: The World Bank Note:
e = estimate, f = forecast
/a Combination of errors and omissions and transfers to and capital outflows from developing countries.
2004 2005 2006 2007 2008 2009 2010e 2011f 2012f 2013f
Current account balance 195.2 318.8 450.3 469.1 440.6 284.4 264.5 219.6 159.9 163.1
as % of GDP 2.4 3.3 4.0 3.4 2.6 1.7 1.4 1.0 0.6 0.6
Financial flows:
Net private and official inflows 342.2 502.9 656.3 1132.1 771.1 633.8 930.2
Net private inflows (equity+debt) 366.3 567.0 725.9 1132.1 743.3 557.4 857.8 892.7 963.5 1065.3
Net equity inflows 243.6 379.2 497.0 664.9 561.2 498.1 633.2 674.1 733.9 839.8
..Net FDI inflows 206.7 311.7 389.3 529.8 614.4 390.0 485.4 555.0 603.6 696.2
..Net portfolio equity inflows 36.9 67.5 107.7 135.1 -53.2 108.2 147.8 119.1 130.3 143.6
Net debt flows 98.6 123.8 159.3 467.2 209.9 135.6 297.0 218.6 229.6 225.5
..Official creditors -24.1 -64.0 -69.6 0.0 27.8 76.4 72.4
....World Bank 2.4 2.7 -0.2 5.2 7.3 17.7 19.3
....IMF -14.7 -40.2 -26.7 -5.1 10.0 26.5 16.3
....Other official -11.8 -26.6 -42.6 0.0 10.6 32.2 36.8
..Private creditors 122.7 187.8 228.9 467.2 182.1 59.2 224.6 218.6 229.6 225.5
....Net M-L term debt flows 69.8 113.3 145.0 283.0 196.1 52.8 104.1
......Bonds 34.3 48.3 31.7 88.2 24.1 51.1 66.5
......Banks 39.7 70.3 117.9 198.5 176.8 3.2 37.6
......Other private -4.1 -5.3 -4.7 -3.7 -4.8 -1.6 0.0
....Net short-term debt flows 52.9 74.5 83.9 184.2 -14.0 6.4 120.5
Balancing item /a -137.5 -406.9 -458.6 -509.5 -733.5 -271.1 -524.4
Change in reserves (- = increase) -399.9 -414.8 -647.9 -1091.7 -478.2 -647.0 -670.3
Memorandum items
Net FDI outflows 46.1 61.6 130.5 148.7 207.5 153.9 210.0
Workers' remittances 159.3 191.8 226.3 278.2 325.0 307.6 324.7 348.6 374.5
As a percent of GDP
2004 2005 2006 2007 2008 2009 2010p 2011f 2012f 2013f
Net private and official inflows 4.3 5.3 5.8 8.1 4.6 3.9 4.8
Net private inflows (equity+debt) 4.6 5.9 6.4 8.1 4.4 3.4 4.4 3.9 3.8 3.8
Net equity inflows 3.0 4.0 4.4 4.8 3.3 3.1 3.3 3.0 2.9 3.0
..Net FDI inflows 2.6 3.3 3.4 3.8 3.7 2.4 2.5 2.4 2.4 2.5
..Net portfolio equity inflows 0.5 0.7 1.0 1.0 -0.3 0.7 0.8 0.5 0.5 0.5
..Private creditors 1.5 2.0 2.0 3.3 1.1 0.4 1.2 1.0 0.9 0.8
49

Global Economic Prospects June 2011: Subject Annex
sudden reversals in capital markets and to a
possible increase in borrowing costs. Countries
such as Russia, Brazil, Indonesia and Turkey are
susceptible to these types of risks (the first three
because of high debts, the last because of its high
debt and large current account deficit). These
risks are further accentuated when a large share
of external financing comes in the form of
relatively volatile portfolio equity and debt flows
(Brazil, Indonesia, and Turkey) (figure FIN.10).
References:
Hartelius, K., K. Kashiwase, and L.E. Kodres
(2008), “Emerging market Spread Compression:
Is it Real or is it Liquidity?”. IMF working paper
08/10, January, Washington DC.
International Monetary Fund (2011a), “Recent
Experiences in Managing Capital Inflows—
Cross-Cutting Themes and Possible Policy
Framework”, Washington DC.
International Monetary Fund (2011b), “World
Economic Outlook: Tensions from the Two-
Speed Recovery: Unemployment, Commodities,
and Capital Flows” April 2011, Washington DC.
Lin, Justin Yifu (2007) “Economic
Development and Transition: Thought, Strategy
and Viability,” Marshall Lectures (Cambridge
University), October 31-November 1, 2007.
World Bank (2009), “Global Development
Finance 2009: Charting a Global Recovery”,
Washington DC.
World Bank (2011), “Global Economic
Prospects: Navigating Strong Currents” January
2011, Washington DC.
Figure FIN.10 External vulnerability
Source: International Monetary Fund and World
Bank.
-10
-8
-6
-4
-2
0
2
4
6
-50 0 50 100
External financing needs to FX reserve ratio (%)
Port
folio
and
Ban
king
(%G
DP)
201
0
TR
PL
CL
BG
IN
ZAID
MY RU PE
PH
CN THBR
50

Global Economic Prospects June 2011: Subject Annex
Overview
Commodity prices have surged since their lows
during the depth of the financial crisis (figure
Comm.1). Since end-2008, energy prices have
more- than doubled, but still remain well below
their former peaks. Metals prices are up almost
170 percent while agriculture and food prices are
77 and 60 percent higher, respectively.
The 2010/11 spike in commodity markets has
been driven by a recovery in demand and
numerous supply constraints. Adverse weather
(droughts and heavy rains) in many regions has
affected several agriculture markets, as well as
coal and metals production. Political unrest,
mainly in North Africa and the Middle East, has
resulted in a loss of oil supply—and fears of
further disruptions have pushed oil prices even
higher. And in so far as these commodity
indexes reflect dollar prices, the depreciation of
the dollar has also contributed to their rise.
Between July 2010 and April 2011, the dollar
has depreciated 12.9 percent against the euro and
7.7 percent against a broader group of trading
partners.
Crude oil prices, which were stable during the
first three quarters of 2010 (averaging $77/bbl),
began to rise as demand growth accelerated and
stocks fell late in the year. In 2011, prices rose
sharply and exceeded $116/bbl in April
following the loss of 1.3mb/d of Libyan oil
exports (and smaller losses elsewhere). Fears of
further disruptions in major oil producing
countries have also underpinned prices. The loss
of Libyan light/sweet crude tightened distillate
markets, which were further aggravated by the
loss of distillate exports from Japan following
the earthquake that damaged refineries. OPEC‘s
spare capacity is mainly medium-sour crude,
thus the challenge will be to replace light/sweet
crude to manufacture sufficient distillate to meet
increasingly stringent low-sulfur regulations.
Crude oil prices are expected to remain elevated
in the near term until product markets are in
better balance to meet summer demand, and
fears of further crude oil disruptions subside.
Metals and minerals prices recovered sharply in
2009 due to strong demand and restocking in
China. While Chinese demand growth slowed in
2010 it was offset by stronger growth elsewhere,
mainly in the OECD. By February, prices of
metals exceeded their May 2008 peak by 4
percent, with tin and copper reaching all-time
highs due to supply constraints. Other metals
markets have been less supply constrained, in
particular aluminum, where China is a net
exporter. Prices are expected to strengthen
further in 2011 as demand recovers, notably
from China.
Agricultural prices began to rise sharply in mid-
2010 due to adverse weather conditions (notably
drought conditions in Central Europe which saw
Russia‘s wheat crop decline by 25 percent), and
in the case of raw materials, strong demand.
High energy prices have also played a role, both
by diverting agricultural land to biofuel
production, but also as higher fuel and fertilizer
prices pushed up production costs.
Overall, agricultural prices increased 45 percent
between June 2010 and February 2011 and as of
May 2011, they were 6.4 percent above their
June 2008 peak. By May, raw materials prices
were 33 percent above their 2008 peak due to
Global Commodity Markets Annex
Figure Comm.1 Key price indices
Source: World Bank.
0
100
200
300
400
500
Jan-04 Jan-05 Jan-06 Jan-07 Jan-08 Jan-09 Jan-10 Jan-11
Energy Metals Food
$US nominal, 2000=100
51

Global Economic Prospects June 2011: Subject Annex
record high prices for cotton and rubber on
strong demand and supply shortfalls. Beverage
prices were almost 30 percent above peaks
owing to weather-related shortages of Arabica
coffee supplies and political disruption of cocoa
supplies in Côte d‘Ivoire. High sugar prices have
pushed the ―other‖ food category to 12 percent
above its earlier peak. Grains and edible oils
prices remain below their former peaks on
improving supply conditions for many of these
commodities, although stocks remain relatively
low.
Most commodity prices are set to remain high in
2011 and to weaken only modestly through to
2013, reflecting continued robust demand, low
stocks and ongoing supply constraints in some
cases. Crude oil prices are expected to average
$107/bbl in 2011 and weaken slightly over 2012-
13, assuming that political unrest in North Africa
and the Middle East is contained. Metals prices
are expected to rise by 20 percent in 2011 on
persistently strong demand, led by China, and
weak supply response for some metals, notably
copper and tin. Food prices in 2011 are expected
to average 20 percent above 2010 levels as well,
on the assumption of a normal crop year and no
further rises in oil prices (table Comm.1).
The risks to this price forecast are mostly to the
upside. The spread of political unrest in the
Middle East and North Africa could push crude
oil prices much higher in the shorter term,
especially if there is disruption to a major oil
producer. Stronger demand from China could
boost metals prices by more than currently
expected, and continued supply constraints could
further aggravate markets. Given low stock
levels, agricultural (and especially food) prices
will remain sensitive to adverse weather
conditions and energy prices. Moreover, at
current or higher oil prices, biofuels production
becomes an increasingly attractive use of land
and produce, likely increasing the sensitivity of
food to oil prices. Downside risks mainly entail
slower demand growth and more favorable
supplies.
Energy: overview and outlook
Crude oil prices were fairly stable through the
first three quarters of 2010, averaging $77/bbl,
reflecting ample stocks and OPEC production
restraint amid strong demand growth (3.3
percent or 2.8mb/d for 2010) versus an average
1.3mb/d over the past decade. In the fourth
quarter of 2010, prices began to rise due to an
acceleration in demand growth to 3.8 percent
and declining stocks; prices averaged $90/bbl in
December.
Oil demand in high-income OECD countries
which had been declining since the fourth
quarter of 2005, advanced by 1.2 percent or
0.6mb/d; while demand in non-OECD countries
increased 5.7 percent or 2.3mb/d–with Chinese
demand representing about 1mb/d. In the first
quarter of 2011, global oil demand was 2.3
percent higher than a year earlier, with year-over
-year growth rates expected to ease to near 1.5
percent (1.3mb/d) consistent with the long-term
trend of the past decade (figure Comm.2).
Figure Comm.2 World Oil demand
Source: IEA and World Bank
-4
-3
-2
-1
0
1
2
3
4
1Q03 1Q05 1Q07 1Q09 1Q11
Other
Other Asia
China
OECD
mb/dTable Comm.1 Key nominal price indices
(Actual and forecasts, 2000=100)
Source: World Bank
2005 2006 2007 2008 2009 2010 2011 2012
Energy 188 221 245 342 214 271 362 345
Non-Energy 149 190 233 275 209 267 321 284
Agriculture 133 150 180 229 198 231 277 230
Food 134 147 185 247 205 224 265 222
Beverages 137 145 170 210 220 254 286 238
Raw Materials 131 160 175 196 169 237 304 247
Metals & Minerals 179 275 339 336 222 337 406 395
Fertilizers 163 169 240 567 293 280 349 283
MUV 110 112 117 125 118 121 127 123
Actual Forecast
52

Global Economic Prospects June 2011: Subject Annex
Most of the increase in oil demand was met from
increased production by non-OPEC producers
and through reductions in inventories. OPEC
output growth in recent months has been limited
as the cartel has sought to support prices at
below their recent amplified levels.
Non-OPEC output increased 2.0mb/d since
2008, reflecting both the exploitation of new
fields and more intensive production from
existing ones made more profitable by higher
prices. The biggest increases came from the
United States, Russia, China, Brazil, Colombia,
Kazakhstan, Azerbaijan, Canada, and Oman, as
well as from a sizeable increase in biofuels.
Partially offsetting these gains were large
production losses in the North Sea and Mexico.
OPEC production increased 1.9mb/d since April
2009 (prior to the loss in Libya), but still remains
below its peak levels of 31.9mb/d in mid-2008.1
Most of the increase has taken place in Saudi
Arabia, Iraq, the UAE, and Nigeria (figure
Comm.3).
Despite a drawdown of inventories, global
stocks remain high—though outside of the
United States, inventory levels at the end of
winter were at the lower end of their 5-year
range (figure Comm.4).
Political turmoil adds to price volatility
The spikes observed in 2011 mainly reflect
political developments in North Africa and the
Middle East, which resulted in the loss of 1.6mb/
d in Libyan oil production and 1.3mb/d in
exports. Some damage to facilities and oil fields
occurred, and it is widely expected that exports
will be curtailed for some time. In addition more
than 0.1mb/d of crude oil production was shut
down in March from unrest and strikes in
Yemen, as well as smaller volumes in Oman,
Gabon and Côte d‘Ivoire—all non-OPEC
countries. Just as importantly, oil prices were bid
up by fears of larger supply disruptions in major
OPEC oil producers.
The supply response from other OPEC countries
has been limited—mainly because of weak
demand for the medium-sour crude that OPEC
has in spare capacity (the lost Libyan production
is light, sweet and distillate-rich crude oil), and
because the supply disruption occurred during
the seasonal downturn in demand due to refinery
maintenance.
Nevertheless, the pickup in global demand has
drawn-down OPEC‘s spare capacity (excluding
Libya, Iraq, Venezuela and Nigeria) to 4mb/d,
down from more than 5mb/d at the end of 2010.
Because of the loss of Libyan distillate-rich
sweet crudes, distillate markets worldwide has
tightened. As refinery demand picks up in the
second quarter to meet summer demand, further
upward pressure on high-quality crudes is likely.
Outlook
Oil prices are expected to remain elevated as
long as physical supplies are disrupted and fears
persist of larger disruptions from political unrest
in oil producing countries. The loss of Libyan
light sweet, crude will continue to affect product
Figure Comm.3 World oil production
Source: IEA
25
30
35
40
45
50
55
Jan-00 Jan-02 Jan-04 Jan-06 Jan-08 Jan-10 Jan-12
mb/d
Non-OPEC
OPEC
Figure Comm.4 OECD oil inventories and oil price
Source: IEA, World Bank
10
30
50
70
90
110
130
45
50
55
60
65
1Q00 4Q02 3Q05 2Q08 1Q11
days forward consumption
Brent (right axis)
$/bbl
Inventories
53

Global Economic Prospects June 2011: Subject Annex
markets, especially as increasingly stringent
regulatory rules on refined products further
intensify demand for light, sweet crude.
In the baseline projection, oil production is
assumed to normalize toward the end of 2011,
and oil prices are anticipated to decline gradually
toward $80/bbl in real terms by 2020. This
implies a nearer-term price profile of $107.2/bbl
in 2011, easing only modestly to $98.7/bbl by
2013. Yet, individual prices may move within a
wide range from each other, as has been the case
during the past six months (box Comm.1).
At these prices, there are no resource constraints
far into the future. At $80/bbl in real terms,
production of Canadian tar sands are profitable
and reserves from this source are second only to
those of Saudi Arabia in crude oil. Such elevated
prices should also serve to both foster production
Box Comm.1 Different prices for different fuels
The recent run up in crude oil prices has been associated with an unusual divergence between the price of West
Texas Intermediate oil (WTI) and Brent and Dubai crude oil prices. Historically, WTI has traded at a premium of
about $1.30/bbl to Brent, but toward the end of 2010 the WTI price began falling below the Brent price because of
a build-up in crude-oil inventories in Cushing Oklahoma, the delivery point for WTI oil in NYMEX futures con-
tracts. Currently WTI oil is trading at about 90 percent of the Brent price (box figure Comm.1a).
The increase in inventories was mainly due to the inflow of Canadian crude through the new Keystone pipeline,
and has little outlet except through refinery processing in Cushing. Bottlenecks are likely to continue until new
pipeline capacity to the Gulf coast is available (2013), and from Alberta to the Pacific coast (2015).
The other major price divergence, which has been more durable, has been between oil prices and natural gas
prices. Whereas the former have increased nearly fourfold since 2000, natural gas prices linked to oil (in Europe
and Japan) have increased only 160percent, while those in the fully competitive U.S. market are essentially un-
changed. Relatively lower natural gas prices reflect increases in supply from both new liquefied natural gas (LNG)
capacity and unconventional shale gas. LNG capacity, which allows gas to be transported by sea, is projected to
increase more than 50 percent between 2009 and 2013. In the United States, natural gas from shale-gas reserves
has been growing rapidly due to new extraction techniques, which have not only pushed down U.S. natural gas
prices, but also reduced prospective global demand for LNG.
Growing supplies of unconventional gas are expected to keep U.S. natural gas prices well below oil prices. Al-
ready, U.S. natural gas now costs less than coal. Contract prices in Europe and Japan, which are tied to oil prices,
are expected to come under downward pressure as end-users increasingly push to tie these prices more closely to
spot prices for natural gas (box figure Comm.1b).
Over time, these large gaps between oil and natural gas prices can be expected to induce shifts in consumption
from oil to natural gas, reducing demand for oil, and as a result reducing price pressures.
Box figure Comm.1a Brent/WTI price differential
Source: World Bank
-$5
$0
$5
$10
$15
$20
Apr-09 Aug-09 Nov-09 Feb-10 May-10 Aug-10 Dec-10 Mar-11
US$/bbl
Box figure Comm.1b Energy prices
Source: World Bank
0
5
10
15
20
25
Jan-00 Jan-02 Jan-04 Jan-06 Jan-08 Jan-10 Jan-12
Crude oil
LNG Japan
Europe Gas
US Gas
Coal Australia
$/mmbtu
54

Global Economic Prospects June 2011: Subject Annex
of alternative renewable energies and induce
demand-side substitution toward other less
expensive forms of energy.
The main impediments to supply growth are
above-ground policies and conditions, i.e.,
taxation, access, environmental constraints, and
geopolitical risk.
Risks to the oil outlook
On balance, short term risks are on the upside
likely to emanate from further supply
disruptions. Large supply-shocks can have
significant impacts on oil prices and economic
activity, as in the past. Environmental issues
may curb non-OPEC production growth in bio-
sensitive or resource-intensive areas, e.g.,
offshore, oil sands, and shale-rock fracturing
(these sources account for more than one-third of
global oil supplies).
OPEC production policies can also affect price
levels. In the past, the group has taken
aggressive action to rein-in production when
prices fall, but has taken only limited action
when prices rise, choosing instead to accept the
windfall gains.
An additional risk to energy prices is the longer
term impact of the Fukushima nuclear accident.
Nuclear energy has played a key role in global
energy consumption. Its contribution increased
from of 1.6 percent during the 1970s to 6.3
percent during 2000-08 (table Comm.2). During
this period crude oil‘s share declined from 44.7
to 35.0 percent. In effect, the decline in crude oil
was compensated almost equally by increases in
natural gas and nuclear power. A combination of
reduction in the share of nuclear and the likely
environmental pressures in crude oil and coal
may indeed exert additional pressure in energy
prices over the longer term.
Metals: overview and outlook
Metals and minerals prices have recovered
strongly in the last two years due to robust
demand, with the aggregate price index in May
2011 up 155 percent since its recession-induced
lows of December 2008. Strong price increases
were observed in markets that experienced
supply constraints. For example, copper and tin
reached all-time nominal highs in 2011 (up 220
and 200 percent, respectively from their 2008/09
lows) (figure Comm.5). Most metals prices have
at least doubled, but price increases were more
moderate for those where supplies were ample as
in the case of aluminum.2
Table Comm.2 Shares of global energy consumption
(percent of total)
Source: IEA and World Bank
1971-80 1981-90 1991-2000 2001-08
Crude Oil (total) 44.7% 38.3% 36.6% 35.0%
Natural Gas 16.3% 18.2% 19.9% 20.8%
Coal and Coal Products 24.5% 25.5% 23.7% 24.9%
Nuclear 1.6% 4.8% 6.5% 6.3%
Combustible Renewables and Waste 10.6% 10.7% 10.5% 10.0%
Hydro/Other 2.3% 2.5% 2.8% 2.9%
Figure Comm.6 World metals consumption
Source: World Metal Statistics
0
10,000
20,000
30,000
40,000
2000 2002 2004 2006 2008 2010
OECD China Rest of world
'000 tons
Figure Comm.5 Copper and aluminum prices
Source: .World Bank.
0
2,000
4,000
6,000
8,000
10,000
Jan-00 Jan-02 Jan-04 Jan-06 Jan-08 Jan-10 Jan-12
Copper
Aluminum
$/ton
55

Global Economic Prospects June 2011: Subject Annex
The recovery in metals during 2009 was led by
large restocking in China, world‘s largest metal
consumer (figure Comm.6). As can be seen for
aluminum (which accounts for nearly half of
world consumption of the six base metals),
China‘s demand growth surged in 2009, with
significant volumes for restocking, providing the
key driver to prices. Demand in China slowed in
2010 but this was offset by strong demand
elsewhere, particularly in developed countries,
also for restocking (figure Comm.7).
Most metals inventories in 2011 are relatively
high, and have increased as China‘s import
demand has slowed (figure Comm.8). For some
metals, prices are in ‗contango‘ (future prices
above near-by prices) and a large portion of
stocks are tied up in warehouse financing
arrangements and not available to the market—
which gives an appearance of market tightness
and has helped support prices. Inventories are
expected to remain high until China‘s import
demand strengthens.
Outlook
Over the past decade, global metals markets
have struggled to meet the strong demand
particularly from China, especially in the copper
and nickel markets (box Comm.2). As a result
prices have increased to ration demand and
balance the market.
The causes of the supply shortfall are numerous.
Inadequate investment early-on has played a
role, especially given the long lead times
required for new mines. Because of years of low
prices and limited expansion, the industry also
suffered shortages of skilled labor, equipment
and materials during the upturn—which have
pushed up costs. In addition, technical problems,
strikes, and geopolitical risk prevented new
projects form moving ahead quickly.
Looking forward, supply is expected to be more
elastic—partly because of higher prices, which
have boosted the industry‘s large cash flow, and
is expected to generate record capital
expenditures in 2011.
In the copper sector, where supply has been
very tight, development of new ‗greenfield‘ and
‗brownfield‘ projects is expected to deliver
sufficient capacity to meet moderate demand
growth over the medium term. Much of the
incremental supply will be in South America and
in Africa‘s copper belt, i.e., Zambia and the
Democratic Republic of Congo. High copper
prices have also increased recycling and induced
substitution toward other, cheaper products
(mainly aluminum and plastics). These trends
are expected to push the copper balance into
surplus later in 2012 and beyond.
The global market for aluminum is expected
to remain in surplus for the foreseeable future.
The addition of new capacity and prospects for
the reactivation of idle capacity threatens prices
in the near term. New plants in China, India, the
Middle East and Russia are expected to exploit
low-cost power sources and minimize the
upward pressure on aluminum prices from
Figure Comm.7 Aluminum consumption growth
Source: CRU
-750
-500
-250
0
250
500
750
1,000
Jan-07 Jan-08 Jan-09 Jan-10 Jan-11
Other China
thousand tons
Figure Comm.8 Copper prices and LME stocks
Source: Datastream
0
100
200
300
400
500
600
2,000
4,000
6,000
8,000
10,000
12,000
Jan-05 Jan-06 Jan-07 Jan-08 Jan-09 Jan-10 Jan-11
$/ton '000 tons
copper price
LMEstocks (right axis)
56

Global Economic Prospects June 2011: Subject Annex
higher oil prices. A key uncertainty for supply
concerns Chinese authorities‘ efforts to restrain
power consumption in the sector, which may
slow the pace of new aluminum plants or result
in the closure of older plants.
The nickel market is expected to move into
surplus this year and beyond as a wave of new
capacity hits the market. Several large-scale
projects in Brazil, Madagascar, New Caledonia,
and Papua New Guinea, as well as smaller
projects elsewhere, are coming on line that are
the lagged result of earlier price hikes. In
addition, supply will be bolstered by recovering
production from strikes in Canada and the steady
growth of nickel pig iron in China. One potential
uncertainty for the nickel industry comes from
new plants ‗High Pressure Acid Leach‘ (HPAL)
processes, a complex technology that has
resulted in severe production problems in the
past.
Box Comm.2: China, global metal demand, and the super-cycle hypothesis
Chinese demand has been the key driver of metal demand over the past decade (see figure Comm.8). China is
clearly in an extremely metals-intensive phase of its development. Compared with other developing countries at
similar income levels, the metals intensity of China‘s GDP is well above average (for example, China‘s copper
and aluminum intensity were 1.8 and 4.1 kgs per $1,000 of real GDP for 2007-09, compared with world averages
of 0.4 and 0.7, respectively.)
Between 2000 and 2010 Chinese consumption of the main base metals (aluminum, copper, lead, nickel, tin, and
zinc) rose by 16 percent per annum. Consumption for the rest of the world was flat for the decade. Currently China
accounts for 41 percent of global refined metal consumption (box figure Comm.2a).
Indeed, metal consumption by China during the past decade has been so strong that it effectively reversed the
global metal intensity (metal consumption per unit of GDP), a turnabout that continues today. For example, global
metal intensity in 2010 was the same as in the early 1970s (box figure Comm.2b). On the contrary, food and en-
ergy intensities continued their downward trend.
Many observers looking at the extremely robust demand for commodities over the past decade, and the rapidly
rising metals intensity of the Chinese economy, argue that commodity demand will continue to outstrip supply
resulting in a super-cycle where prices stay very high for an extended period (perhaps for a few decades). Such
risk seems particularly acute if China continues to increase its metals intensity, or if other developing countries
begin to follow a metals intensive development strategy – something that has not as yet occurred.
Super-cycles of this nature have taken place in the past rather albeit infrequently (e.g., the industrial revolution in
the United Kingdom. and the early 1900s in the United States). Several authors have argued that some metals
(especially copper and iron ore) may be going through a super-cycle period because of Chinese demand (see Heap
2005 and Jerrett and Cuddington 2008).
If such a super cycle endures, high prices will be needed to curb demand and generate sufficient supplies to bring
the market into balance, and also to stimulate alternative technologies and materials.
Box figure Comm.2a Global metal consumption
growth, 2000-10
Source: World Metal Statistics and World Bank
-4,000
0
4,000
8,000
12,000
16,000
20,000
Alum Copper Lead Nickel Tin Zinc
Rest of world China OECD
'000 tons
Box figure Comm.2b Global commodity intensity
Source: World Bank
Energy
Metals
Food
0.65
0.75
0.85
0.95
1.05
1971 1974 1977 1980 1983 1986 1989 1992 1995 1998 2001 2004 2007 2010
Commodity intensity index
57

Global Economic Prospects June 2011: Subject Annex
Overall, metals prices are expected to rise in
2011 compared with 2010, owing to increasing
demand, but are expected to ease thereafter, as
new capacity comes on line and keeps markets in
surplus. A key risk to the forecast is continued
difficulties within the industry delivering
adequate supply to the market, whether related to
operations, technology, labor, or government
policy.
Agriculture: overview and outlook
By early 2011 most agricultural prices either
reached or exceeded their summer 2008 peaks.
In April 2011, the agricultural price index
averaged 12 percent above its June 2008 peak,
while the food index has just matched its 2008
peak. Beverages (tea, cocoa, and coffee) and raw
materials are 31 and 57 percent above their 2008
highs.
Yet, the 2010/11 price spike differs from the one
in 2007/08 in a number of respects.
1. It is more uniform in terms of commodities
involved, in that it includes most food
commodities (grains and edible oils, except
for rice), beverages, and raw materials. The
2007/08 spike (led by crude oil and
fertilizers) saw food and grains prices
increase, largely reflecting the surge in rice.
2. The current increase is less steep in the sense
that the percent change in 2011:Q1 from a
year ago are much smaller than occurred in
2008:Q2 when measured over the same
period (figure Comm.9).
3. The supply conditions for grains that led to
the 2010/11 spike were less binding than the
conditions that led to the 2007/08 spike. The
rice market has been very stable—rice is a
thinly traded commodity and politically
sensitive for food security, especially in East
Asian countries.
4. The recent price spike did not trigger as broad
a policy reaction—apart from the Russian
wheat export ban in the summer of 2010.
Martin and Anderson (2011) estimated that
45 percent of the increase in rice prices and
30 percent of the increase in wheat prices
during the 2007/08 price spike was due to
insulating trade measures.
Grain prices, especially maize and wheat, began
rising in the summer of 2010 when it became
apparent that wheat production in Eastern
Europe and Central Asia and was going to be
seriously affected by the heat wave running
through the region at that time. In the event,
countries in the region—which between 2005-
2009 accounted for almost a quarter of world
wheat exports—were only to supply half of that
amount. Later maize prices rose as it became
clear that the U.S. crop would disappoint. As a
result, the maize stock-to-use ratio declined to
0.15 from the 0.18 average of 2007-09.
By April 2011, maize prices had surpassed their
June 2008 highs by 12 percent while wheat
prices were just 4 percent short of their 2008
peak. Rice prices, however, have been relatively
stable, trading in a band of $450-$550/ton during
the past two years—a wide band by historical
standards but narrow when comparing rice to
other commodities during 2008.
Edible oils prices rose more than 40 percent in
the first quarter of 2011 from a year earlier,
almost reaching their June 2008 all time highs in
February 2011. In addition to suffering sporadic
weather-induced production shortfalls
(especially soybean oil in South America and
palm oil in South-East Asia) and diversion for
biodiesel production in Europe, a key factor
behind the price rally has been strong demand.
Figure Comm.9 The price spikes of 2007/08 and 2010/11
Source: World Bank
0 50 100 150 200
Fertilizer
Metals
Raw material
Beverages
Grains
Food
Agriculture
Non-energy
Energy
2010/11 2007/08
58

Global Economic Prospects June 2011: Subject Annex
Unlike grains, where demand tends to be
relatively stable after incomes reach a certain
level, per capita demand for edible oils continues
to rise even in high income countries, as a rising
share of food consumed is prepared in
professional establishments and in packaged
form, both of which are oils consuming
processes.
Beverage prices increased in 2010/11, unlike in
2008 when their prices were relatively stable.
The coffee market—especially arabica coffee—
experienced tight supplies and strong demand
while the hike in cocoa prices reflected political
instability in Côte d‘Ivoire (which accounts for
almost 40 percent of global cocoa supplies).
The cotton market suffered from tight supplies
(in addition to a partial export ban imposed by
India to protect its domestic textile industry).
Strong demand, especially by middle income
countries, contributed to high price as well.
Cotton prices experienced, perhaps, the sharpest
increase in history of the sector; they exceeded
$5.00/kg in March 2011, up 350 percent from
two years ago. And natural rubber prices
reached historic highs due to weather-related
supply disruptions in South-East Asia rubber
producing countries (accounting for almost all
global production), strong tire demand from
emerging markets, and high oil prices (natural
rubber competes with synthetic rubber) a by-
product of crude oil.
Despite high oil prices, fertilizer prices—a key
input to the production of food commodities—
declined 5 percent in 2010 due to ample supply
and relatively stable natural gas prices (nitrogen
fertilizer is made directly from natural gas).
Outlook
Agricultural prices increased 17 percent in 2010,
slightly exceeding their 2008 levels. They are
expected to gain an additional 20 percent in
2011; such increase assumes that prices will ease
somewhat during the second half of 2011.
Specifically, for 2011 wheat and maize prices
are expected to average 34 and 45 percent higher
than 2010 levels, while rice prices are
anticipated to remain almost unchanged.
Soybean and palm oil prices are expected to be
18 and 22 percent higher, respectively.
A number of assumptions underpin this outlook.
First among these is that crude-oil prices
stabilize and begin to decline. Second, it is
assumed that the 2011/12 crop year is a normal
one. Actual outturns will depend importantly on
Figure Comm.10 Global balance of key grains
Source: U.S. Department of Agriculture (May 11, 2011
update).
Note: years refer to crop years (e.g., 2011 refers to 20011/12
400
500
600
700
800
900
0%
10%
20%
30%
40%
2000 2001 2002 2003 2004 2005 2006 2007 2008 2009 2010 2011
Maize
Stock-to-use ratio - Lef t axis Production (1000 MT)
300
350
400
450
500
0%
10%
20%
30%
40%
2000 2001 2002 2003 2004 2005 2006 2007 2008 2009 2010 2011
Rice
Stock-to-use ratio - Lef t axis Production (1000 MT)
400
500
600
700
0%
10%
20%
30%
40%
2000 2001 2002 2003 2004 2005 2006 2007 2008 2009 2010 2011
Wheat
Stock-to-use ratio - Lef t axis Production (1000 MT)
59

Global Economic Prospects June 2011: Subject Annex
oil prices and weather. Either another poor crop
year or a further hike in oil prices could result in
significantly higher prices for many
commodities.
During its first assessment for the 2011/12 crop
year (published in early May), USDA projected
that global production of maize will rise 6.4
percent, wheat by 3.3 percent and rice by 1.4
percent (figure Comm.10). Yet, because of
continued tight inventory positions, the USDA
argued that prices may remain ―volatile with
tight exportable supplies of corn and wheat. In
contrast, the rice world supplies are relatively
abundant.‖ The report also noted that uncertainty
continues to cloud these projections because of
delayed maize plantings in the United States,
reduced U.S. winter wheat production, continued
dryness in the EU, and wet conditions in Canada.
Energy is a particularly important determinant of
agricultural prices and hence an important risk
for higher food prices. While low stocks and
poor crops were the major factors underpinning
last year‘s price hikes, the nearly 60 percent
increase in food prices since the 1990s has more
to do with the 3-fold increase in energy prices
that has occurred during that time.
Energy feeds into food prices through three main
channels: (i) as a cost of production (fuel for
agricultural machinery and transporting produce
to markets); (ii) indirectly through fertilizer and
other chemical costs (e.g., nitrogen-based
fertilizers are made directly from natural gas),
and (iii) via competition for land and produce
from biofuels—maize in the United States,
edible oils in Europe and sugar cane in Brazil
(Box Comm.3). Indeed, agriculture is more than
four times more energy intensive an activity than
manufacturing, with the ratio varying across
countries depending on crops raised and
intensity of fertilizer use (figure Comm.11).
Econometric estimates suggest that for every 10
percent increase in energy prices, food prices
will rise by between 2 and 3 percent (Baffes
2009). In fact, this is almost exactly what has
been observed: with the 223 percent increase in
the average oil price between the period 1986-
2002 and 2003-2010 is associated with a 50
percent increase in the average food prices index
(figure Comm.12).
Risks to the food price outlook
In an effort to evaluate the sensitivity of food
price forecasts to the quality of future crops and
oil prices, several simulations were run. Table
Comm.3 reports results based on a reduced form
econometric model that explains grain prices as a
function of cost factors (including oil), and
weather events (proxied by deviations of output
from trend increases and stock-to-use ratios to
allow for non-linear effects when stock levels are
low). Other variables include exchange rates,
interest rates, time trend as a proxy for technical
change, and income growth.
This work suggests that a weather-induced
Figure Comm.11 Energy intensity of agriculture
and manufacture
Source: GTAP preliminary release 0, version 6.
0 5 10 15 20
Turkey
India
Brazil
China
EU-12
Canada
US
SSA
DEVELOPING
HIGH INCOME
WORLD
Manufacture
Agriculture
Cost of energy component measured in 2007, percent
Figure Comm.12 Energy and agricultural prices:
1986-2010
Source: World Bank
0
100
200
300
400
1986 1989 1992 1995 1998 2001 2004 2007 2010
nominal indices, 2000=100nominal indices, 2000=100
Agriculture
Energy
223 % up
50 % up
60

Global Economic Prospects June 2011: Subject Annex
production shortfall on the order of 5 percent
(equivalent to one standard deviation reduction
in global output) can be expected to induce an
increase in grain prices of between 2 and 8
percent. And a 50 percent increase in crude oil
prices above the baseline of $107/bbl, would
induce grain prices increases on the order of 6
and 14 percent. Under a scenario where the
2011/12 crop year proves disappointing and oil
prices rise by $50/bbl, grain prices could rise
between 9 and 22 percent above the baseline
scenario.
If any of these scenarios materialize, it will have
important budgetary implications for food
importing countries as well as poverty
implications for consumers who spend a
substantial part of their disposable income on
food. Consider, for example, that the 2010/11
grain price increases may have pushed as many
as 44 million people into poverty according to
World Bank latest estimates (World Bank,
2011a).
In addition to higher prices, volatility in
commodity prices, especially food commodities,
is an issue of increasing concern. For example,
during the November 2010 summit, leaders of
the G-20 requested that all international financial
institutions and research organizations to work
with key stakeholders ―to develop options for
G20 consideration on how to better mitigate and
manage the risks associated with the price
volatility of food and other agriculture
commodities, without distorting market
behavior, ultimately to protect the most
vulnerable‖ (see G-20 Report on Price Volatility
2011).
Although it is analytically challenging to
distinguish factors that affect price volatility
from those affecting price levels, the increasing
role of investment fund activity during the past
few years (sometimes referred to as the
―financialization of commodities‖) is often cited
as a key factor behind the price variability
observed during the past few years. It has been
estimated that as of the end of 2010 as much as
$380 billion was invested in commodities, three
Box Comm.3 The role of biofuels
The mandated increase in the quantity of high-income crops and cropland dedicated to biofuel production (chiefly
ethanol-based corn in the United States, and edible oil-based biodiesel in Europe) and the more or less simultane-
ous rise in food prices, suggests another mechanism by which energy prices are affecting food prices.
During 2010/11, 28 percent of the U.S. maize crop went to biofuel production (in fact, 40 percent of the US maize
crop went for biofuel use; however, 30 percent of that went back to the feed industry, resulting in a net of 28 per-
cent). Although that corresponds to about 11 percent of global maize production, it‘s magnitude is comparable to
the global exports of maize. Indeed, most studies concur that the U.S. biofuel mandate was the largest demand-side
factor in the run up of grain prices during the 2007/08 price spike (Timilsina and Shrestha 2010).
Perhaps more important than their historic role in shaping the rise in food prices—to the extent that important food
crops like maize are economically viable alternative sources of energy―their comportment will cease to be that of
a typical agricultural product, where price fluctuations are mainly the result of supply shocks (demand remaining
relatively stable), and become more like an industrial commodity, especially at current high energy prices. For
example, estimates suggest that maize-based ethanol and edible oil-based biodiesel biofuels may become profit-
able even without mandates at oil prices between $80-$100/bbl (U.S. Government Accountability Office 2009).
Table Comm.3 Food Prices: History, baseline, and
upside risks ($US per ton)
Source: World Bank
Year Wheat Maize Rice Soybeans Palm oil
2006 192 123 305 269 478
2007 255 164 326 384 780
2008 326 223 650 523 949
2009 224 166 555 437 683
2010 224 186 489 450 901
2011 300 270 500 530 1,100
2012 250 230 480 450 900
2011 306 279 518 547 1,186
2012 255 238 497 464 970
2011 336 294 573 602 1,337
2012 280 251 550 511 1,094
Historical Prices
Baseline
5% production shortfall (compared to baseline)
5% production shortfall and 50% increase in energy prices (compared to baseline)
61

Global Economic Prospects June 2011: Subject Annex
quarters of which in energy markets, compared
to less than $20 billion at the beginning of the
decade.
The relationship between investment fund
activity and commodity prices is a hotly debated
topic. Some have argued that such funds have
sufficiently large weight to unbalance the market
thus impairing the price discovery mechanism
(e.g., Soros 2008, Berg 2011). However, others
have praised these investment vehicles claiming
that they inject liquidity in commodity markets
(e.g., Verleger 2010, Sanders and Irwin 2010).
Despite such contrasting views, the empirical
evidence is, at best, weak.
As was discussed in the January 2011 edition of
GEP (World Bank 2011b, p. 26), ―Despite the
‗smoking gun‘ … most studies have failed to
establish a link between these investment and
rise in commodity prices.‖ The report also noted
that more recent academic papers and analysis
are increasingly leaning towards the view that
these new investment vehicles may have been
responsible for at least part of the post-2005
volatility in commodity prices. Indeed, a number
of academic studies have shown just that (see,
for example, Singleton 2011, Silvennoinen and
Thorp 2010, Tang and Xiong 2010).
Movements in domestic food prices
The discussion so far has focused on price
movements in US$ terms. However, what
matters most to consumers is the price they pay
for their food basket. It is not uncommon for
prices paid by consumers to differ considerably
from international prices, at least in the short
run. Reasons include exchange rates movements,
trade policies that often insulate domestic
markets, large distances of domestic trading
centers form ports adding considerably to
marketing costs, quality differences, and
different composition of the food basket.
Figure Comm.13 depict changes in domestic
wholesale prices of key food commodity price
indices (weighted by the country‘s caloric intake
from such commodities). The period chosen is
based on a comparison between 2009:Q1 (the
post-financial crisis low price) and 2010:Q4, (the
most recent data available for 35 countries). In
addition to maximizing the numbers of countries
included in the sample, the period was chosen in
order to capture most of the 2010/11 food price
spike.
During this period, the real (U.S. CPI-deflated)
U.S. dollar-based World Bank food price index
increased 34 percent. Yet, the results show
that—with the exception of Asian countries
where real wholesale prices moved in synch with
world prices—in both Latin America and the
Caribbean and Sub-Saharan Africa regions, real
Figure Comm.13 Price changes—2009:Q1 to
2010:Q4
Source: World Bank
-40 -20 0 20 40 60 80 100
ChadKenya
RwandaBurkina FasoMozambique
NigerUgandaNigeria
CameroonMali
DjiboutiCape Verde
BurundiSudan
WORLDBenin
Africa
-20 0 20 40 60 80 100
Honduras
Nicaragua
Guatemala
Bolivia
Dominican Republic
Colombia
Peru
Mexico
Panama
Brazil
WORLD
Argentina
Latin America and the Caribbean
-5 0 5 10 15 20 25 30 35 40
Belarus
Cambodia
Armenia
China
India
Azerbaijan
WORLD
Thailand
Bangladesh
Asia
62

Global Economic Prospects June 2011: Subject Annex
prices either increased modestly or declined. It
should be noted that results do not necessarily
imply that domestic price movements move
independently of world prices. The apparent
weak correlation between world and domestic
prices most likely reflect low pass-through.
To identify the degree of pass-through, an error-
correction model was used to estimate the pass-
through price elasticities for wheat, rice, and
maize. The countries included in the analysis
were categorized into three groups: little pass
through, where less than 10 percent of
international price variability is transmitted into
domestic prices, moderate pass through, with
transmission between 10 and 40 percent, and
high pass-through, with more than 40 percent
transmission (figure Comm. 14).
A number of interesting results emerged from
the analysis. First, more countries exhibited very
little pass-through compared to moderate or high
pass-through combined; this is consistent with
the results discussed earlier. Second, price pass-
through is higher in rice than maize and wheat.
Third, countries that exhibited high pass-through
in one commodity are likely to have high pass-
through in the other commodities as well (e.g.,
Argentina, South Africa, Thailand, Uganda).
To summarize, pass-through results based on
both econometric estimates and the ones based
on simple price change calculations gave a rather
mixed picture from both a country and a
commodity angle. From a country policy
perspective, the results suggest that, to the extent
possible, policy responses should not focus
entirely on short run price movements observed
in international markets. Instead policies should
target specific commodity sectors and, above all,
target the portions of the population with the
highest probability of being affected.
The policy dimension of low pass-through
Low pass-through may reflect the fact that some
countries insulate their domestic food (and fuel)
markets by introducing or increasing existing
subsidies or taxes. In addition to their
distortionary impact on both domestic and world
market level, subsidies in these countries may
face fiscal sustainability issues. Indeed, taxpayer
-funded subsidies in OECD countries increased
considerably—between 2000-04 and 2005-09,
transfers from taxpayers to consumers of
agricultural products increased by more than 25
percent (from $24.6 to $31.0 billion). From a
fiscal sustainability perspective, however, more
important are fuel subsidies which during 2010
reached globally an estimated $250 billion, up
from $60 billion in 2003 (Coady et al 2010).
From a policy perspective, addressing insulating
trade policies should be a priority, for at least
two reasons. In addition to constraining domestic
supply response at the time it is most needed,
such policies amplify the cycles in world prices,
thus destabilizing global markets with negative
consequences to countries that play by the rules
and, more importantly, the ones that do not have
the fiscal space to protect the poorest segments
of their populations.
Other avenues to pursue should include adequate
funding for research and development in order to
arrest the decline in productivity growth
observed during the past decade as well as
minimizing post-harvest losses, very common in
poor countries, especially in Sub-Saharan Africa.
Policies and investments addressing the likely
impact of permanent shifts in weather patterns,
and improving food aid are areas of concern as
well. Detailed policies and investment strategies
addressing some of these issues were discussed
Figure Comm.14 Domestic prices of key commodi-ties do follow world price signals in many countries
Source: World Bank
0
5
10
15
20
25
Rice Maize Wheat
less than 10% between 10% and 40% higher than 40%
Number of countries
63

Global Economic Prospects June 2011: Subject Annex
at the Development Committee meeting during
the 2001 joint World Bank/IMF Spring meetings
(World Bank 2011c).
References
Baffes, John (2010). ―More on the Energy/Non-
Energy Commodity Price Link.‖ Applied
Economics Letters 17: 1555-1558.
Berg, Ann (2011). ―The Rise of Commodity
Speculation: From Villainous to Venerable.‖ In
Safeguarding Food Security in Volatile Global
Markets, ed. Adam Prakash. Food and
Agriculture Organization of the United Nations:
Rome.
Coady, David, Robert Gillingham, Rolando
Ossowski, John Piotrowski, Shamsuddin
Tareq, and Justin Tyson (2010). ―Petroleum
Product Subsidies: Costly, Inequitable, and
Rising.‖ IMF Staff Position Paper.
International Monetary Fund: Washington DC.
Heap, Alan (2005). ―China—The Engine of a
Commodities Super Cycle.‖ Citigroup Smith
Barney, New York City.
G-20 Report on Volatility (2011). ―Price
Volatility in Food and Agricultural Markets.‖
Policy report with contributions by FAO,
IFAD, IMF, OECD, UNCTAD, WFP, the
World Bank, the WTO, IFPRI, and the UN-
HLTF. May 3.
Jerrett, Daniel and John T. Cuddington (2008).
―Broadening the Statistical Search for Metal
Price Super Cycles to Steel and Related
Metals.‖ Resources Policy 33: 188-195.
Martin, Will and Kym Anderson (2011). ―Export
Restrictions and Price Insulation during
Commodity Price Booms.‖ Policy Research
Working Paper 5645. Washington DC: The
World Bank.
Sanders, Dwight R. and Scott H. Irwin (2010). ―A
Speculative Bubble in Commodity Futures
Prices? Cross-Sectional Evidence.‖ Agricultural
Economics 41:25-32.
Silvennoinen, Annastiina and Susan Thorp (2010).
―Financialization, Crisis, and Commodity
Correlation Dynamics.‖ Mimeo, Queensland
University of Technology and University of
Technology, Sydney.
Singleton, Kenneth J. (2011) ―Investor Inflows
and the 2008 Boom in Oil Prices.‖ Mimeo,
Graduate School of Business, Stanford
University.
Soros, George (2008). ―Testimony before the U.S.
Senate Commerce Committee Oversight:
Hearing on FTC Advanced Rulemaking on Oil
Market Manipulation.‖ Washington, DC, June 3.
http://www.georgesoros.com/files/SorosFinal
Testimony.pdf
Tang, Ke and Wei Xiong (2010). ―Index
Investment and the Financialization of
Commodities.‖ Mimeo, Renmin University
and Princeton University.
Timilsina, Govinda and Ashish Shrestha (2010).
―Biofuels: Markets, Targets, and Impacts.‖
Policy Research Working Paper 5364.
Washington, DC: The World Bank.
US Government Accountability Office (2009).
Biofuels: Potential Effects and Challenges of
Required Increases in Production and Use.
Report GAO-09-446. Washington, D.C.
Verleger, Phillip (2010). ‖Don‘t Kill the Oil
Speculators.‖ International Economy: The
Magazine of International Economic Policy
Winter 2010, 64-66.
World Bank (2011a). Food Price Watch. April
14.
World Bank (2011b). Global Economic
Prospects: Navigating Strong Currents.
Washington DC: World Bank.
World Bank (2011c). ―Responding to Global
Food Price Volatility and its Impact on Food
Security.‖ Development Committee Paper,
DC2011-0002. Washington DC: World Bank.
World Bank (2009). Global Economic
Prospects: Commodities at the Crossroads.
Washington DC: World Bank.
64

Global Economic Prospects June 2011: Subject Annex
Notes
1. OPEC countries account for 72 percent of
the world‘s known oil reserves (Oil and Gas
Journal, Dec. 6, 2010). However, OPEC‘s
production share of total world liquid fuels is
just below 40 percent and its share of crude
oil production is 33.5 percent. With OPEC‘s
spare capacity at about 6 mb/d (December
2010) and substantial known reserves, the oil
market does not appear afflicted by resource
scarcity. Indeed, oil production continues to
grow in both OPEC and non-OPEC regions.
2. The divergence between copper and
aluminum prices during the past decade has
been driven mainly by China, world‘s largest
copper importer. Because of various
operational and project development
problems, the industry has struggled to keep
pace with demand. Meanwhile China has
developed substantial aluminum smelting
capacity and is a net exporter of aluminum.
Bauxite, the raw material to produce
aluminum, is one of the most abundant
minerals.
65

Global Economic Prospects June 2011: Subject Annex
Rising commodity prices have made a major
contribution to the increase in headline inflation
rates, which are close to- or have breached the
upper limit of central banks’ targeted bands in
many countries.
However local food prices in developing
countries have not increased as much as
international food prices. Notwithstanding the 47
percent increase in the dollar prices of
internationally traded food commodities between
June 2010 and February 2011, local food price
indexes in developing countries have risen by
only 7.9 percent over the same period. In part,
this discrepancy reflects the depreciation of the
dollar; the wider range of food commodities
consumed locally; and weak pass through of
internationally traded food prices to local prices.
In developing countries in Sub-Saharan Africa
and South America the pass through was less
than 10 percent in: 67 percent of countries for
rice, 69 percent for maize, and 70 percent for
wheat. Government subsidies, price controls,
weak infrastructure, and low import dependency
impede pass through, while it tends to be higher
in countries with closer links to international
markets and limited government intervention
(e.g. South Africa).
Annual inflation rates have increased in a large
number of developing countries over the past
year. More than half of developing countries
now have annual inflation in excess of 5 percent,
with one in five countries reporting inflation in
excess of 10 percent. Meanwhile the share of
countries with inflation rates in the range of 2.5
percent to 5 percent has also increased.
Headline inflation accelerated by more than 3
percentage points in one in four developing
countries between March 2010 and March 2011,
compared to more than one in five during the
previous year (figure INFL.2). One in five
countries have also seen inflation decline by
more than 1 percentage point over the March
2010 to March 2011 period.
However, the extent of the pick up in inflation
for most countries has been relatively modest,
with inflation rates in more than half of
developing countries still below average
inflation recorded in the pre-crisis period
(January 2000 through August 2008). Inflation is
less than 2 percentage points higher than that
average in 80 percent of countries.
Inflation in high-income countries is rising
but remains at relatively low levels. Prices in
high-income OECD countries were 3.2 percent
higher in April 2011 than a year earlier, an
Figure INFL.2 Change in inflation rate over the
past year
Source: The World Bank.
0
10
20
30
40
50
60
-1 0 1 2 3 More
March-11 March-10percentage points
# of countries
Figure INFL.1 Headline inflation has accelerated in
developing countries over the past year
Source: The World Bank.
0
5
10
15
20
25
30
0 2.5 5 7.5 10 More
March-11 March-10
# of countries
y/y, percent
Inflation Annex
66

Global Economic Prospects June 2011: Subject Annex
increase of 1.3 percentage points. The energy
price component of the CPI index was up 10.4
percent, down slightly from the 10.6 percent
increase recorded in March, while the food price
component was up 3 percent (year-on-year in
April, 2011) (figure INFL.3). In the euro area,
headline inflation was 2.8 percent (y-o-y) in
April, well above the 2 percent ECB targeted
rate, in part due to rising energy prices. In the
United States, headline inflation was 3.2 percent
by April, pushed higher by energy prices up 19
percent and a weaker dollar (down by more-than
9 percent in nominal effective terms since June
2010). Headline inflation was up yet more
strongly in other high-income countries,
including Australia, Canada, Korea and Sweden.
The rise in headline inflation in high-income
OECD countries has had a limited impact on
inflationary expectations to date, and core
inflation has increased gradually to 1.9 percent
as of April 2011, from 1.1 percent in the year-
earlier period (to 1.3 percent in the United States
and 1.5 percent in the euro zone).
Headline inflation in developing countries has
accelerated recently to 6.9 percent by April
2011, from a 6 percent in April 2010, as
international food and fuel prices stabilized
recently. Food inflation exceeded 9 percent by
February 2011 in developing countries.1 Median
headline inflation for these countries was slightly
lower at 5.6 percent, reflecting the fact that
inflation momentum in some of the larger
middle-income countries, whose inflation rates
have larger weights in the overall index is close
to 6.9 percent (figure INFL.4). In developing
countries, rising food and fuel prices, and in
some cases tightening manufacturing capacity
and lagging policy normalization, have
combined to push headline inflation higher. But,
most recently, monthly inflation rates have eased
in both high-income and developing countries.
Inflation momentum is strong. From a three
month over three month perspective, the pace of
annualized inflation in both high-income and
developing countries has been accelerating until
just recently and exceeded year-over-year
Figure INFL.4 Inflation accelerates in most devel-
oping regions on higher food and energy prices
Source: The World Bank.
Figure INFL.3 Core inflation in high-income
OECD countries remains contained as inflation-
ary expectations remained anchored
Source: OECD.
-15
-10
-5
0
5
10
15
20
25
-4
0
4
8
Jan-00 Sep-01 May-03 Jan-05 Sep-06 May-08 Jan-10
EnergyAll items
Food
Core inflation
Median, ch% (y/y)
Figure INFL.5 Headline inflation pressures have
picked up since mid-2010 but are easing
Source: The World Bank.
-8
-4
0
4
8
12
16
Jan-05 Dec-05 Nov-06 Oct-07 Sep-08 Aug-09 Jul-10
High income
Developing
Headline inflation 3m/3m saar
-2
0
2
4
6
8
10
12
14
16
Jan-07 Sep-07 May-08 Jan-09 Sep-09 May-10 Jan-11
Europe and Central Asia
East Asia and Pacific
South Asia
Middle East and North Africa
Latin America and the Caribbean
Sub Saharan Africa
Annual headline inflation, median
67

Global Economic Prospects June 2011: Subject Annex
measures. At the global level, the annualized
pace of monthly inflation was 5 percent (3m/3m
saar) in the three months to April 2011, with
prices rising at a 4.3 percent annualized rate in
high-income countries and a 6.7 percent rate in
developing countries (figure INFL.5). Although
this momentum measure of inflation is lower in
high-income countries than in developing
countries, it has accelerated more quickly in high
-income countries (up 4.7 percentage points
versus 1.8 percentage point). This stronger
acceleration likely reflects quicker pass-through
of higher international fuel prices in high-income
countries, and is observed despite the lower
weight of food and fuel in the CPI basket in
these economies (figure INFL.6 and figure
INFL.7a). More recently however momentum
has eased in developing countries, with a broad-
based deceleration across income groups and
regions. Among developing regions, the easing
of inflationary pressures is most pronounced in
the East Asia & Pacific, and the Europe &
Central Asia regions. The deceleration is less
well established in South Asia and in Latin
America and the Caribbean, while monthly
inflation is rising in the Middle-East & North
Africa and Sub-Saharan Africa (figure
INFL.7b).
In addition to the inflationary pressures coming
from higher international commodity prices
capacity constraints in many middle-income
countries have added to price pressures. In
Brazil, headline inflation accelerated to 6.5
percent in April, while in China inflation was
more than 5.3 percent (y-o-y), up 2.2 percentage
points from a year earlier, as food inflation
spiked to over 10 percent. Recent decisions to
allow domestic gasoline and diesel prices to rise
could push inflation as much as 0.5 percentage
points higher. In India, year-on-year inflation
continues to remain elevated and has surprised to
the upside in March and April 2011 (9 and 8.7
percent respectively) due to accelerating non-
food inflation and higher energy prices, and a
surge in coal prices in April. There have been
sharp upward revisions for three consecutive
months, suggesting that actual inflation in March
and April could be even higher.
In Thailand, core inflation surprised to the
Figure INFL.7a Headline inflation rates, ch%,
year-on-year
Source: The World Bank.
0
4
8
12
16
High-income East Asia & Pacific
Europe & Central Asia
Latin America & Caribbean
Middle East & N. Africa
South Asia Sub-Saharan Africa
Jan-09
Jan-10
Apr 11 or latest
Headline inflation rates, ch%, year-on-year
Figure INFL.7b Headline inflation rates
Source: The World Bank.
-5
0
5
10
15
20
High-income East Asia & Pacif ic
Europe & Central Asia
Latin America & Caribbean
Middle East & N. Africa
South Asia Sub-Saharan Africa
Jan 2009
Jan 2010
Apr 2011 or latest
Headline inflation rates, ch%, 3m/3m saar
Figure INFL.6 Weight of food in the CPI basket
Source: IMF.
0 10 20 30 40 50
EAP
MNA
High income
ECA
SAS
Parts per 100
68

Global Economic Prospects June 2011: Subject Annex
upside in May as well, rising to 2.5 percent year-
on-year, suggesting that higher energy and food
prices are starting to have second round effects,
while tighter labor markets are also putting
upward pressure on producer prices. In
Indonesia, annual headline inflation stood at 6.2
percent in April, before easing to 6 percent in
May, while core inflation rose to a 19-month
high of 4.6 percent in April and remained at that
level in May. While policy is being tightened in
all of these countries, both fiscal and monetary
policy remain accommodative, leading to higher
risks that headline CPI changes seep into core
inflation, given strong domestic demand and
elevated capacity utilization rates (see Walsh,
2011 for a discussion, suggesting that
commodity prices should not be excluded from
core measures of inflation in developing
countries).
Outlook
Prospects for inflation in developing countries
will vary depending on industrial capacity
utilization rates, exchange rate movements and
the policy stance. However, risks to inflation are
to the upside, and inflation could overshoot the
upper limits of central-bank targeted ranges in a
number of countries-- that show signs of
overheating and where monetary and fiscal
policy tightening are behind the curve. Even if
the prices of internationally traded food and oil
stabilize in the second half of 2011, domestic
food and fuel prices are expected to continue to
rise in many developing countries, reflecting
delayed pass-through to local markets and
increased pressures from higher fuel prices from
the costs of fertilizers and transportation. As
outlined in the main text, in the current
economic context it is entirely possible that both
food and fuel prices rise further.
Headline CPI momentum suggests that inflation
will accelerate further in most developing
regions, in particular in South Asia, Sub Saharan
Africa, the Middles East and North Africa; and
to a lesser degree in Latin America, Europe and
Central Asia and East Asia and the Pacific.
Moreover, high food and fuel prices are starting
to impact inflationary expectations, which in
turn may increase pressure on wages, especially
in the emerging economies, where labor markets
are tightening (figure INFL.7). If policy
tightening fails to bring inflationary expectations
(figure INFL.8) down, we could see the
beginnings of an inflationary spiral.
Notes
1. For example, the weight of food in the CPI
basket is 40 points of 100 parts in South
Asia, and over 30 in East Asia and Pacific
(median value for Thailand, Malaysia, and
the Philippines) and MENA. Data for Sub-
Saharan African countries is not available
but for example in Ghana the weight of food
in the CPI basket is 44, while in Cote
d’Ivoire it is 24.8. In comparison in high-
income countries the median weight of food
in the CPI basket is 16 parts per 100 parts.
Figure INFL.8 Expectations for inflation rates
twelve months forward are rising
Source: Datastream, Banco central do Brasil.
0
5
10
15
20
25
30
35
40
0
4
8
Jan-08 Sep-08 May-09 Jan-10 Sep-10 May-11 Jan-12
BrazilArgentina
USAUK
Argentina
USAUK
Chile
Mexico
Percent
69


Global Economic Prospects June 2011: Regional Annex
Recent developments
High frequency indicators suggest that growth in
the East Asia and Pacific region growth has
started moderating as most economies in the
region are operating at—or near full capacity,
and a gradual withdrawal of monetary and fiscal
stimulus combined with a moderation in growth
of high-income countries will dampen growth
going forward. Real GDP growth of 8.3 percent
a year is anticipated over 2011-13 for East Asia
(rates of 8.5, 8.1, and 8.2 percent respectively).
This follows growth of an estimated 9.6 percent
in 2010. Excluding China, the rebound was even
more pronounced, increasing from 1.5 percent in
2009 to an estimated 6.8 percent in 2010; but
growth is expected to stabilize at slightly lower
rates of around 5.5 percent over 2011-2013.1
A strong recovery in GDP, production and
trade. The post-crisis rebound in 2010 was
faster than the recovery from previous crisis
episodes in East Asia, including after the 1997-
98 Asian financial crisis (figure EAP.1). It was
also broadly based, with five countries in
developing East Asia growing by 7 or more
percent during 2010, including Thailand and
Malaysia, the only middle-income countries in
the region where GDP had contracted in 2009.
Real GDP is estimated to have grown by 7.8 and
7.2 percent respectively in these countries in
2010, driven equally by domestic demand
(supported by expansionary fiscal and monetary
policies) and external demand. In the
Philippines, a surge in consumer and business
optimism, in part due to the presidential
elections, and stronger and more robust growth
in worker remittances were additional factors
that underpinned the country’s fastest growth in
more than three decades. Much of the region’s
rebound reflected the solid macroeconomic
foundations that existed before the crisis:
plentiful fiscal space, low external and
government debt, and strong balance sheets of
companies and commercial banks.
The pace of recovery in GDP (which was
particularly strong during 2010) is forecast to
slow over 2011-2013. This growth cycle has
been accentuated by the evolution of industrial
production activity, but with important
differences in the depth of post-crisis troughs
within the region, and the extent to which output
has recovered to pre-crisis levels or growth
trends (figure EAP.2). As of April 2011
industrial production levels in the region stood
East Asia and the Pacific
Figure EAP.1 The post-crisis rebound in 2010 was faster
than the recovery from East Asian crisis
Source: World Bank.
0.8
0.9
1.0
1.1
1.2
1.3
1.4
1.5
1.6
1997/2008 1998/2009 1999/2010 2000/2011 2001/2012 2002/2013
GDP following the 1997-98 Asian f inancial crisis
GDP following the 2008-09 Global f inancial crisis
East Asia crisis, 1997 = 1 and Global crisis, 2008 = 1
Figure EAP.2 China leading recovery in industrial pro-
duction
Source: World Bank.
-60
-40
-20
0
20
40
60
80
2007M01 2007M07 2008M01 2008M07 2009M01 2009M07 2010M01 2010M07 2011M01
China
EAP (excl China)
Thailand
Indonesia
Percent, 3m/3m saar
71

Global Economic Prospects June 2011: Regional Annex
34.2 percent higher than the 2008-peak (defined
as the maximum monthly industrial production
level attained during calendar 2008) (figure
EAP.3). Compared with the level of production
that would have been observed in the absence of
a boom and bust cycle between 2005 and 2009,
the region’s production is now about 3 percent
above underlying trend levels (figure EAP.4).
Thailand represents an important exception to
this trend, as industrial production there has
struggled to catch up with underlying trend
growth due to structural impediments.
The regions’ good performance in production
has been supported by buoyant domestic demand
in most developing countries, moderate recovery
in high-income consumer spending, and
restocking that started at the end of 2010. Even
though there is a lot of noise in the January-
February data due to the Chinese Lunar New
Year, there are indications that growth is
slowing, as Chinese retail sales softened in
February – largely on the back of weaker auto
sales as incentives were withdrawn. East Asia is
operating near full capacity, which means
industrial production growth is bound to
moderate to potential growth rates; while further
downside pressures may arise from monetary
tightening in countries where inflationary
pressures are building, such as in China and
Indonesia. Several countries (e.g. Indonesia,
Malaysia and Thailand), also experienced strong
currency appreciation as a result of rapid and
robust capital inflows. However, with the
exception of Indonesia, the real appreciation has
been more or less in line with real changes in the
Chinese Renminbi, hence the impact on external
competitiveness has been relatively limited.
As in the case of industrial production,
commencing from the final quarter of 2010,
trade entered a second rebound phase. This
interval differs somewhat from the previous
rebound, in that recovery is being driven less by
temporary factors (stimulus, restocking etc.) and
more by stronger consumer demand (including
from high-income countries). Latest figures
indicate that, although economic growth might
be slowing somewhat, export growth rates were
nearly as strong as the exceptional pace
experienced in phase I of the recovery.
China’s export performance is to a large degree
shaped by high-income country import demand,
while the rest of developing East Asia’s exports
tends to respond to Chinese demand (figures
EAP.5 and EAP.6). The Japanese economy
remains a very important trade partner for the
developing East Asia region and the impact of
the Japanese earthquake/tsunami/nuclear crisis is
expected to cut into growth more sharply than
the 1995 Kobe disaster, as electricity disruption
and the pull-back in consumer spending that has
been associated with the first weeks of the
current post-crisis period will negatively impact
on Japan’s growth. Retail sales during March
were down 8.5 percent from a year ago,
Figure EAP.3 Industrial production has surpassed previ-
ous peaks
Source: World Bank.
-30
-20
-10
0
10
20
30
40
50
2008M01 2008M06 2008M11 2009M04 2009M09 2010M02 2010M07 2010M12 2011M05
EAP
China
Thailand
Indonesia
Percent
Figure EAP.4 But remains below trend in Thailand
Source: World Bank.
-35.0
-30.0
-25.0
-20.0
-15.0
-10.0
-5.0
0.0
5.0
10.0
15.0
2008M01 2008M06 2008M11 2009M04 2009M09 2010M02 2010M07 2010M12 2011M05
EAP
China
Thailand
Indonesia
Percent
72

Global Economic Prospects June 2011: Regional Annex
machinery and business equipment sales were
down 17 percent. For the car industry,
disruptions are expected to last until the end of
the second quarter, potentially reducing output
by one-half. So far, regional impacts have been
limited, with slower growth in the initial quarter
of at most 0.5 percentage points for countries
with closest trade ties (Malaysia, Vietnam and
Thailand). As discussed in the main text and in
the industrial production annex, the impact of
this disaster could be substantial and potentially
long(er) lasting.
As far as demand in other high-income
economies are concerned, U.S. import growth
has recently tapered off, but fortunately, demand
conditions in Europe have been improving (see
trade annex). Notwithstanding the global
recovery and demand for Chinese goods, the
Chinese trade balance declined rapidly from a
surplus of $40 billion in January 2009 to deficit
of about $2.1 billion in February 2011, but
recovered to a surplus of $22.6 billion in April
2011. With demand in high income countries
returning toward levels consistent with output
following the global crisis, the Chinese current
account surplus is expected to remain at much
lower levels than in the recent past (figure
EAP.7).
Inflationary pressures building. Consumer
price inflation accelerated in East Asia during
the second half of 2010, due to a surge in food
and other commodity prices, robust domestic
demand and the lagged effects of a still loose
(though tightening) monetary policy (figure
EAP.8). International food prices (see
commodities annex) have increased significantly
as have local prices of vegetables and other
produce. For example, despite a drop in
international rice prices, local rice prices have
risen in Indonesia and Lao PDR. Nonetheless,
with international food prices forecast to ease
toward the second half of 2011 and into 2012,
food inflation should slow later in the forecast
period. But even with (food) inflation forecast to
slow, prices will remain high, negatively
Figure EAP.5 Chinese exports strongly correlated with
high-income country import demand
Source: World Bank.
-60
-40
-20
0
20
40
60
80
2007M01 2007M07 2008M01 2008M07 2009M01 2009M07 2010M01 2010M07 2011M01
Chinese exports
High-income countries imports
Percent, 3m/3m saar
Figure EAP.6 Chinese imports (mostly processing and/
or consumption related) drives East Asia and the
Pacific (excl China) exports
Source: World Bank.
-80
-60
-40
-20
0
20
40
60
80
100
2007M01 2007M07 2008M01 2008M07 2009M01 2009M07 2010M01 2010M07 2011M01
Chinese imports
EAP (excl China) exports
Percent, 3m/3m saar
Figure EAP.7 Chinese current account surplus to stabi-
lize at lower levels as global imbalances subside
Source: World Bank.
-4.0
-3.0
-2.0
-1.0
0.0
1.0
2.0
3.0
4.0
-4
-2
0
2
4
6
8
10
12
1990 1992 1994 1996 1998 2000 2002 2004 2006 2008 2010 2012
Chinese Current Account Balance (% of GDP)
Global output gap (RHS)
Percent
73

Global Economic Prospects June 2011: Regional Annex
impacting on the poor—because of food’s
substantial weighting in the region’s consumer
basket.
Although non-food inflation has remained
moderate, there is a risk in some countries that if
the current loose monetary policy setting
continues for an extended period, inflationary
pressures from food may instigate a wage-price
spiral, which over time could push up non-food
inflation, hamper competitiveness and slow
growth.
Moderate improvement in fiscal balances.
Historically, counter-cyclical fiscal policy
management has been well executed, with fiscal
balances tending to moderate the business cycle
(figure EAP.9). In the current context, however,
fiscal balances in the region improved by only
0.2 percent of GDP during 2010. Discretionary
expenditures added to boost demand during the
crisis have by and large not been withdrawn, due
to concerns about the strength of the global
recovery, and adherence to earlier spending
commitments. As a result, almost all of the small
improvement in fiscal balances has been cyclical
and related to improved revenues, while rough
estimates suggest that structural fiscal balances
have actually deteriorated during 2010.
Sharp rebound in foreign direct investment.
Net foreign direct investment (FDI) inflows to
East Asia increased by more-than 60 percent
from $138 billion in 2009 to an estimated $225
billion in 2010, with the bulk of the inflow
destined for China (table EAP.1). Net FDI
inflows to China increased by 62 percent in
2010, with the surge driven by buoyant growth
prospects, strong investor sentiment and large
interest differentials between China and high-
income countries. According to revised estimates
from China’s State Administration of Foreign
Exchange (SAFE), FDI inflows into China
rebounded strongly from $114 billion in 2009 to
$185 billion in 2010. The largest increase was in
the financial sector (300 percent) followed by the
real estate sector (78 percent), reaching $12
billion and $21 billion, respectively.
Manufacturing remains the main recipient of
FDI inflows into China. The sector received $70
billion in 2010, 50 percent more than in 2009.
With the revisions, China now accounts for 30
percent of total FDI inflows to developing
countries compared with one-fourth previously.
Aggregate portfolio flows to the region remained
relatively stable between 2009 and 2010, but
private debt flows more-than doubled from $58
billion in 2009 to $116 billion in 2010, partly
reflecting private borrowers in the real-estate
sector turning to external lenders after been shut
out of domestic credit markets as the authorities
tightened domestic credit conditions.
Pace of exchange rate appreciation has
slowed. Despite exchange rate market
intervention, and measures to deter inflows and
Figure EAP.8 Food inflation exerting upward pressure
on total inflation
Source: World Bank.
-5
0
5
10
15
20
2005M01 2005M10 2006M07 2007M04 2008M01 2008M10 2009M07 2010M04 2011M01
EAP: Food
EAP: Non-Food
EAP: Total
Percent (y-o-y)
Figure EAP.9 Counter-cyclical fiscal management has
been well executed, but more tightening might have been
needed in 2010
Source: World Bank.
-4
-3
-2
-1
0
1
2
3
4
5
6
-4.0
-3.5
-3.0
-2.5
-2.0
-1.5
-1.0
-0.5
0.0
0.5
1.0
1990 1992 1994 1996 1998 2000 2002 2004 2006 2008 2010
EAP: Fiscal balance (% of GDP)
EAP: Output gap (RHS)
Percent
74

Global Economic Prospects June 2011: Regional Annex
encourage capital outflows, the region’s
currencies appreciated sharply during 2010. As
capital inflows have slowed somewhat since late
in that year (see Finance Annex), the pace of
nominal appreciation for the recipients of the
largest capital inflows has also subsided.
However, with inflation on the rise, real
appreciation pressures remain, albeit also
subsiding somewhat. Thus far, currency
appreciation has not hampered the recovery, as
the region continues to benefit from strong
productivity growth.
Medium-term outlook
Growth in the East Asia and Pacific region is
projected to remain strong, with GDP gains
easing from 9.6 percent in 2010 to 8.5 and 8.1
percent in 2011 and 2012 respectively, before
increasing somewhat to 8.2 percent by 2013
(table EAP.2). The region has benefitted from
the global economic recovery and the baseline
forecast provides for further benefits –
particularly as activity in high-income countries
that were severely affected by the 2008-09
global financial and economic crisis normalizes.
The projected slowing in growth mainly reflects
economies operating at or near full capacity and
an expected gradual tightening of monetary and
fiscal policies over the coming 18-24 months,
which should temporarily slow growth to
slightly below potential, before GDP
reaccelerates marginally again towards potential
growth by 2013.
The direct contribution of net trade to overall
GDP growth is anticipated to be only marginally
positive over the forecast period – a sharp
turnaround from negative 4.1 percent in 2009,
but significantly smaller than the 2.6 percent net
trade contribution observed over the 2005 –
2008 boom period. These earlier net trade
benefits were largely associated with
unsustainable global excess demand, particularly
in high income countries. As global economic
activity normalizes and global disequilibria
unwind, the net trade contribution to regional
growth is forecast to be smaller going forward.
Aggressive policy stimulus underpinned private
Table EAP.1 Net capital flows to East Asia and the Pacific
Source: World Bank.
$ billions
2003 2004 2005 2006 2007 2008 2009 2010e 2011f 2012f 2013f
Current account balance 69.8 87.9 174.8 297.5 426.3 467.2 360.8 358.3 320.2 358.9 401.1
as % of GDP 3.1 3.3 5.8 8.2 9.3 8.1 5.8 4.8 3.6 3.6 3.5
Financial flows:
Net private and official inflows 76.4 127.0 209.0 238.4 303.9 210.5 226.5 378.2
Net private inflows (equity+private debt) 83.6 132.2 212.3 247.7 307.8 211.6 222.8 374.5 371.1 383.7 413.5
..Net private inflows (% GDP) 3.7 5.0 7.0 6.8 6.7 3.6 3.6 5.0 4.2 3.8 3.6
Net equity inflows 69.3 89.7 168.1 207.9 233.9 206.6 168.2 262.2 282.1 300.7 342.5
..Net FDI inflows 56.8 70.4 142.4 151.7 198.8 213.9 138.4 225.2 255.1 267.7 305.5
..Net portfolio equity inflows 12.5 19.3 25.7 56.2 35.1 -7.3 29.9 37.0 27.0 33.0 37.0
Net debt flows 7.1 37.3 40.9 30.6 70.0 3.9 58.3 116.0
..Official creditors -7.2 -5.2 -3.2 -9.3 -3.8 -1.1 3.7 3.7
....World Bank -1.5 -1.9 -0.6 -0.4 -0.3 1.2 2.2 1.8
....IMF -0.5 -1.6 -1.6 -8.5 0.0 0.0 0.1 0.1
....Other official -5.2 -1.7 -1.0 -0.4 -3.5 -2.3 1.4 1.8
..Private creditors 14.3 42.5 44.2 39.9 73.9 5.0 54.5 112.3 89.0 83.0 71.0
....Net M-L term debt flows -9.8 9.1 9.3 14.8 18.5 16.2 -0.8 22.9
......Bonds 1.8 9.6 10.1 3.9 0.7 0.2 8.4 16.4
......Banks -8.5 1.7 1.6 12.2 18.1 18.3 -8.7 6.5
......Other private -3.1 -2.1 -2.3 -1.3 -0.3 -2.3 -0.5 0.0
....Net short-term debt flows 24.1 33.4 34.8 25.1 55.4 -11.2 55.4 89.4
Balancing item /a -6.4 22.2 -166.1 -240.8 -189.2 -245.3 -52.5 -397.0
Change in reserves (- = increase) -139.8 -237.1 -217.7 -295.1 -541.0 -432.4 -534.8 -339.5
Memorandum items
Workers' remittances 32.3 40.0 50.3 57.4 71.0 85.4 86.2 92.5 98.8 106.7
75

Global Economic Prospects June 2011: Regional Annex
consumption, which advanced by an estimated
7.1 percent in 2010. With policy expected to
become a bit tighter, household consumption
growth is likely to remain at around 7 percent in
2011, before recovering to around 8 percent
towards the end of the forecast period. Similarly
government spending contribution to growth will
wane somewhat, as policy stimuli are
withdrawn, while private investment spending
eases in response to slower aggregate demand.
China’s real GDP expanded by 10.3 percent in
2010, up from 9.1 percent in 2009 (table EAP.3).
Stronger growth was driven by rising activity in
most segments of the economy, in part as a result
of loose credit conditions and a government-
backed stimulus package that boosted
investment.2 However, growth momentum
slowed throughout 2010, with year-on-year
growth falling from 11.9 percent in the first
quarter to 9.6 percent in the third quarter, before
picking up somewhat to initial estimates of 9.7
percent in the first quarter of 2011. The
contribution of net external trade to GDP growth
eased in the fourth quarter. Export volumes
outpaced import volumes substantially in the
first three quarters of 2010, but as domestic
demand accelerated, import volumes have risen,
which along with high oil and other imported
commodity prices has reduced the Chinese trade
balance. The slowing GDP growth trend is
expected to continue, with growth viewed to
Table EAP.2 East Asia and the Pacific forecast summary
Source: World Bank.
Est.
98-07a2008 2009 2010 2011 2012 2013
GDP at market prices (2005 US$) b 7.9 8.5 7.4 9.6 8.5 8.1 8.2
GDP per capita (units in US$) 7.0 7.6 6.6 8.7 7.7 7.3 7.4
PPP GDP c 7.8 8.4 7.4 9.6 8.5 8.0 8.5
Private consumption 5.9 7.5 7.3 7.1 7.0 7.3 7.7
Public consumption 7.9 8.6 6.6 7.1 6.8 6.7 6.6
Fixed investment 9.3 9.1 19.2 11.9 11.0 9.2 9.9
Exports, GNFS d 13.6 7.1 -10.1 21.9 11.4 10.5 12.0
Imports, GNFS d 11.8 4.6 -1.8 18.8 12.6 10.9 13.3
Net exports, contribution to growth 1.4 1.6 -4.1 2.2 0.4 0.6 0.3
Current account bal/GDP (%) 4.4 8.1 5.8 4.8 3.6 3.6 3.5
GDP deflator (median, LCU) 5.2 7.8 2.0 4.6 5.5 4.5 4.2
Fiscal balance/GDP (%) -2.1 -0.5 -3.1 -2.8 -1.9 -1.3 -0.9
Memo items: GDP
East Asia excluding China 4.6 4.7 1.5 6.8 5.3 5.6 5.7
China 9.1 9.6 9.1 10.3 9.3 8.7 8.8
Indonesia 4.1 6.0 4.6 6.1 6.3 6.5 6.5
Thailand 4.5 2.5 -2.3 7.8 3.7 4.2 4.3
(annual percent change unless indicated otherwise)
a. Growth rates over intervals are compound average; growth contributions, ratios and the GDP
deflator are averages.
b. GDP measured in constant 2005 U.S. dollars.
c. GDP measured at PPP exchange rates.
d. Exports and imports of goods and non-factor services (GNFS).
e. Estimate.
f. Forecast.
Forecast
76

Global Economic Prospects June 2011: Regional Annex
slow to 9.3 percent in 2011, as stimulus spending
comes to an end and policy tightening leads to a
slowdown in growth in property investment.
And as strong growth acceleration in high-
income countries moderates, it will dampen
China’s export growth. But consumption should
be buoyed by rising employment and wages,
even as higher (food) inflation will suppress
purchasing power to a degree. Growth of 8.7 and
8.8 percent is anticipated for 2012 and 2013
respectively. Such slower growth (when
compared to the average 11.2 percent over 2005-
Table EAP.3 East Asia and the Pacific country forecasts
Source: World Bank.
Est.
98-07 a2008 2009 2010 2011 2012 2013
Cambodia
GDP at market prices (2005 US$) b 8.8 6.7 -1.9 6.7 6.5 6.5 6.6
Current account bal/GDP (%) -4.2 -10.2 -8.3 -11.0 -11.8 -10.9 -11.0
China
GDP at market prices (2005 US$) b 9.1 9.6 9.1 10.3 9.3 8.7 8.8
Current account bal/GDP (%) 4.4 9.6 6.0 5.1 3.6 3.8 3.8
Fiji
GDP at market prices (2005 US$) b 2.0 0.2 -3.0 0.6 1.3 0.7 1.2
Current account bal/GDP (%) -6.3 -18.3 -8.4 -6.8 -7.9 -7.7 -8.2
Indonesia
GDP at market prices (2005 US$) b 4.1 6.0 4.6 6.1 6.3 6.5 6.5
Current account bal/GDP (%) 3.1 0.0 1.9 0.9 1.4 0.5 0.1
Lao PDR
GDP at market prices (2005 US$) b 6.4 7.3 6.4 8.4 8.6 7.6 7.3
Current account bal/GDP (%) -10.6 -18.7 -13.5 -8.6 -9.4 -10.6 -11.1
Malaysia
GDP at market prices (2005 US$) b 5.1 4.7 -1.7 7.2 4.8 5.0 5.1
Current account bal/GDP (%) 12.5 17.5 16.5 13.6 14.2 13.5 13.9
Mongolia
GDP at market prices (2005 US$) b 6.4 8.9 -1.3 6.1 10.3 7.6 22.9
Current account bal/GDP (%) -2.9 -12.9 -9.0 -15.2 -15.1 -13.6 1.9
Papua New Guinea
GDP at market prices (2005 US$) b 1.7 6.7 4.5 7.6 5.8 5.1 5.3
Current account bal/GDP (%) 3.3 8.8 -8.5 -6.5 0.0 -2.3 -2.7
Philippines
GDP at market prices (2005 US$) b 4.4 3.7 1.1 7.3 5.0 5.4 5.5
Current account bal/GDP (%) 0.7 2.2 5.5 5.0 4.2 3.2 1.7
Thailand
GDP at market prices (2005 US$) b 4.5 2.5 -2.3 7.8 3.7 4.2 4.3
Current account bal/GDP (%) 4.7 0.8 8.3 4.8 3.6 3.2 3.6
Vanuatu
GDP at market prices (2005 US$) b 2.5 6.3 4.0 4.5 4.1 4.2 4.3
Current account bal/GDP (%) -9.3 -9.0 -8.1 -7.3 -6.4 -6.6 -7.1
Vietnam
GDP at market prices (2005 US$) b 6.6 6.3 5.3 6.8 6.0 6.8 7.2
Current account bal/GDP (%) -1.4 -11.9 -6.3 -4.0 -2.7 -3.7 -3.9
(annual percent change unless indicated otherwise)
World Bank forecasts are frequently updated based on new information and changing (global)
circumstances. Consequently, projections presented here may differ from those contained in
other Bank documents, even if basic assessments of countries’ prospects do not significantly
differ at any given moment in time.
Samoa; Tuvalu; Kiribati; Korea, Democratic People's Republic; Marshall Islands; Micronesia,
Federate States; Mongolia: Myanmar; N. Mariana Islands; Palau; Solomon Islands; Timor-Leste;
and Tonga are not forecast owing to data limitations.
a. Growth rates over intervals are compound average; growth contributions, ratios and the GDP
deflator are averages.
b. GDP measured in constant 2005 U.S. dollars.
c. Estimate.
d. Forecast.
Forecast
77

Global Economic Prospects June 2011: Regional Annex
2010), is largely due to weaker contributions
from net exports (when compared to the boom
period) and slower investment growth.
Consumer price inflation in China reached 5.4
percent (y-o-y) in March 2011, before declining
marginally to 5.3 percent in April. About two-
thirds of this increase was attributable to food
prices, which have been driven by problematic
weather domestically and by hikes in
international food prices. Going forward,
upstream price pressures may continue to build
because of the hikes in oil and industrial
commodity prices. As discussed in the
Commodity Annex, international food prices are
forecast to moderate. The baseline forecast
therefore incorporates a moderation in food price
inflation in the coming 12 months, which should
offset the rise in non-food inflation, resulting in
a slowdown in headline CPI inflation.
Indonesian inflation also started to rise in mid-
2010, as consumer prices reflected food supply
shocks and an accommodating policy stance
(figure EAP.10). Inflation in domestic grain
prices, primarily rice, reached almost 30 percent
year-on-year in December 2010. Headline
inflation moved up to 7 percent while the rate of
increase of prices in a "poverty basket" of goods
consumed by the poor rose to 13 percent. With
the onset of the harvest season and imports of
rice by the State Logistics Agency, domestic rice
and food prices have declined. Bank Indonesia
has also embarked on a process of normalizing
rates, following earlier increases in reserve
requirements, and the rupiah has continued to
appreciate. While headline inflation has come
down, core inflation has been increasing
gradually. Inflation is anticipated to rise to an
average of 6.3 percent in 2011, slightly above
Bank Indonesia’s 4-6 percent target range.
Indonesia was less severely affected by the 2008
-09 global recession than many East Asian
countries largely because of a relatively limited
exposure to external trade shocks (plus the
commodity focus of the export mix) along with
strong initial conditions and supportive monetary
and fiscal policy responses. Economic growth
accelerated in 2010, with real GDP expanding by
6.1 percent in the year as a whole and by 6.9
percent year-on-year in the fourth quarter, the
fastest quarterly growth pace in six years. Private
consumption will remain a major driving force
over the forecast period, while investment
strength is set to be supported by the shift in
government spending towards capital
expenditures and the real impact of the recent
FDI upsurge.
Quarterly growth in the Thai economy
rebounded strongly in the second half of 2010,
helping to register growth of 7.8 percent in the
year. But with the rebound in the past, the pace
of growth is expected to slow to a more subdued
3.7 percent in 2011. Although domestic political
uncertainty will continue it is not expected to
greatly influence the growth outlook. Japanese
multinational corporations plays a significant
role in the Thai economy, and the impact of the
Japanese earthquake on auto and electrical and
electronics supply chains (these two sectors
account for over 40 percent of Thai exports)
could hamper Thai exports and overall economic
performance. Rising commodity prices –
particularly those of agricultural produce - have
raised export earnings, while the rising farm
incomes have supported growth in domestic
demand. But fuel (diesel) and fertilizer costs
have also risen sharply, thereby eroding the
income gains, while rising costs have put upward
pressure on inflation. In order to accelerate
growth to structurally higher levels, Thailand
Figure EAP.10 Food price increases have contributed
to rising inflation in Indonesia
Source: ILO, World Bank.
-10
-5
0
5
10
15
20
25
2001M01 2002M09 2004M05 2006M01 2007M09 2009M05 2011M01
Indonesia: Food
Indonesia: Non-Food
Indonesia: Total
Percent (y-o-y)
78

Global Economic Prospects June 2011: Regional Annex
will have to raise the share of fixed investment
in GDP, and improve education outcomes.
Economic growth in Malaysia is expected to
remain strong and on a sustainable growth path
in the forecast period. After real GDP gains of
7.2 percent in 2010, growth is expected to come
in around 5 percent per annum over 2011-2013.
Fiscal policy played a key role in the post-crisis
recovery, but GDP growth sputtered in the third
quarter of 2010 as domestic demand growth
slowed – largely due to intensified fiscal
consolidation efforts, which dampened public
consumption. Fixed investment spending also
came under pressure, reflecting public
expenditure cutbacks as well as uncertainties
about economic prospects. Private consumption,
however, remained strong, underpinned by a
vibrant job market, high commodity prices and
consumer lending. Although inflationary
pressures have been rising in Malaysia, CPI
gains remain moderate, and monetary policy
continues to renormalize. Continued current
account surpluses and a positive interest rate
differential with the United States over the
forecast period should support the ringgit.
The Philippine economy rebounded sharply in
2010, as GDP expanded by 7.3 percent - the
fastest pace since the mid-1970s, with both
industry and services recording strong growth.
The pace of economic expansion is expected to
slow to 5.0 percent in 2011, as global growth
moderates, and to average 5.4 percent over 2012
and 2013. Growth will benefit from increased
remittances from Filipinos working overseas
which will support private consumption. Despite
the remarkable growth turnaround, domestic
unemployment remains structurally high, and
there have been some (though inadequate) trickle
-down benefits to the poor, with the depth of
poverty and income distributions improving
between 2006 and 2009.
After growing 5.3 percent in 2009, Vietnam’s
economy expanded 6.8 percent in 2010—the
fastest pace in 3 years. The rapid recovery has
been bolstered by robust domestic demand,
which benefitted from a healthy increase in
remittances, higher levels of investment
supported by strong FDI, and a strong revival in
exports as global demand recovered. Looking
forward, GDP growth is forecast to average 6.7
percent over 2011-2013. But despite the
encouraging growth outlook, policymakers will
face stiff challenges in the near term, as they will
need to ensure that the recovery remains on track
as expansionary fiscal measures are withdrawn
amidst building inflationary pressures. The
consumer price index has risen by more than 10
percent year-on-year in the past four months,
with the most recent (February, 2011) figure at
12.3 percent. Although the Central Bank (State
Bank of Vietnam) tightened monetary policy in
February 2011, increases in subsidized retail
prices for fuel and electricity are likely to
continue to put upward pressure on inflation, as
will the recent devaluation of the dong.
Growth in Cambodia is expected to remain
strong, as the country’s exports benefit from
European Union preferential tariffs, while
consumption picks up and investment benefits
from the continued rebound in FDI. Growth in
Fiji, which has become increasingly dependent
on tourism, has been disappointingly slow over
the last four years, and the government needs to
move ahead with several structural reforms to
accelerate growth. In Lao PDR, real growth is
forecast to remain robust over the forecast
period, with both natural resources (hydropower
and sustained mining extraction) and
manufacturing sectors to drive growth over the
forecast period. Papua New Guineas’ strong
economic performance since 2007 is forecast to
continue, albeit at slower rates than the estimated
7.6 percent in 2010 over the forecast period with
growth averaging 5.4 percent over 2011-2013,
with growth benefitting from resurgent minerals
production and investment in new projects.
Risks
Despite a generally optimistic assessment for
East Asia’s economic prospects, and though the
region’s improved immune system has passed
the test during the global financial crisis, there
are still a number of risks that have the potential
to derail the growth outlook.
79

Global Economic Prospects June 2011: Regional Annex
Developments in the Middle East have
contributed to higher oil prices and still have the
potential of further disruption on commodity
price volatility than is currently appreciated in
the baseline. And given the links between energy
and food prices, these developments in the
Middle East could have implications that extend
well beyond energy.
In several countries rising food and fuel prices
and the pass through to inflation remains a
concern – particularly if these increases spill
over to other sectors. Already, inflation is now
above central bank targets and/or official
projections in China and Indonesia, while it has
surged to double digits in Vietnam. Although
monetary stimulus is gradually been withdrawn
in the region, there is a risk that inflationary
pressures may be building faster than provided
for in the baseline.
As authorities in the region tighten monetary
policy and interest rates rise, many currencies
will continue to experience pressure for
appreciation. And still strong capital inflows
(albeit lower than recent highs) in response to
higher interest rate differentials could lead to
excess credit expansion, complicating the task of
combating inflationary pressures.
The region’s public finances have emerged from
the global downturn in relatively good shape.
But the strong rebound in growth and the rapid
closing of output gaps to the extent that domestic
demand surpasses potential output in many
countries is putting additional stress on monetary
authorities in combating inflationary pressures.
Furthermore, an over-reliance on the region’s
central banks to rein-in inflation is likely to
attract even more (potentially destabilizing)
capital inflows. A better balance between
monetary and fiscal policy tightening will not
only be more effective in preventing overheating
of some economies, but will also be less
disruptive to economic activity in tradable
sectors.
Among the longer term risks, (see March 2011
East Asia and Pacific Update for a more detailed
discussion), inequality is on the rise in several
countries, most notably in China. This is
contributing to social tensions and those left
behind represent a significant waste of human
potential. Policies to broaden access to higher
levels of education, facilitate labor mobility, and
connect leading and lagging regions will serve to
simultaneously stem rising inequality and
accelerate the pace of economic development
and poverty reduction.
Over the longer term the region faces
fundamental challenges related to environmental
sustainability, energy security and climate
change. As a result of fast economic growth and
rapid urbanization over a prolonged period of
time, energy consumption has more than tripled
over the past three decades and is likely to
double in the next 20 years. As a result, the
region is home to some of the world’s most
polluted cities. To sustain growth, policy will
need to actively encourage a shift towards the
usage of clean(er) energy by increasing energy
efficiency, low-carbon technologies in power
generation and the building of low-carbon cities.
Notes:
1 For a more detailed discussion and a
complete overview of regional and country
developments, see ―Securing the present,
shaping the future‖, East Asia and Pacific
Economic Update 2011, Volume 1. The
World Bank, March 2011.
2 China is discussed in more detail in the
China Quarterly Update—see ―Quarterly
Update‖ The World Bank, April 2011.
80

Global Economic Prospects June 2011: RegionalAnnex
GDP growth in developing Europe and Central
Asia1 rebounded to an estimated 5.2 percent in
2010, following a 6.5 percent contraction in
2009 (table ECA.1 and figure ECA.1). Limited
credit growth, the deleveraging of household-
sector balance sheets and continued industrial
sector restructuring following the easy-credit
excesses of the boom period are expected to
continue weighing on GDP. Because of that,
output is projected to expand at a relatively
subdued (by developing countries’ standards)
growth rate of 4.7 percent in 2011 and averaging
4.5 percent during 2012 and 2013. These
aggregate figures hide significant variation
across countries within the region, with those
most affected during the above-average credit
growth period performing least well, while
resource-rich economies are benefitting from
high commodity prices.
Europe and Central Asia
Figure ECA.1 A deep recession followed by a rela-
tively modest recovery
Source: World Bank.
-8.0
-6.0
-4.0
-2.0
0.0
2.0
4.0
6.0
8.0
10.0
2000 2001 2002 2003 2004 2005 2006 2007 2008 2009 2010 2011 2012 2013
Yearly percent GDP Growth (in volume terms)
Europe and Central Asia
High Income Countries
Developing Countries
Table ECA.1 Europe and Central Asia forecast summary
Source: World Bank.
Est.
98-07a2008 2009 2010 2011 2012 2013
GDP at market prices (2005 US$) b 5.4 4.0 -6.4 5.2 4.7 4.4 4.6
GDP per capita (units in US$) 5.4 3.9 -6.5 5.2 4.7 4.3 4.5
PPP GDP c 5.6 4.5 -6.6 5.0 4.5 4.5 4.5
Private consumption 6.3 6.6 -5.7 3.9 4.9 4.3 4.1
Public consumption 2.5 3.2 1.8 1.1 2.8 2.6 2.1
Fixed investment 8.8 6.6 -16.7 7.6 9.5 8.4 8.1
Exports, GNFS d 7.2 3.1 -7.3 9.5 6.6 5.9 6.3
Imports, GNFS d 10.2 8.7 -24.3 9.2 9.2 7.3 6.9
Net exports, contribution to growth -0.3 -2.0 6.4 0.4 -0.5 -0.3 0.0
Current account bal/GDP (%) 2.6 0.6 0.7 0.9 -0.1 -1.8 -1.4
GDP deflator (median, LCU) 11.2 12.4 3.5 7.8 10.9 5.8 6.4
Fiscal balance/GDP (%) -2.1 1.7 -5.4 -3.2 -0.5 -0.2 -0.4
Memo items: GDP
Transition countries e 6.2 5.3 -7.0 3.8 4.2 4.1 4.3
Central and Eastern Europe f 4.7 6.1 -7.1 0.0 2.4 3.8 4.0
Commonwealth of Independent States g 6.5 5.2 -7.0 4.5 4.5 4.2 4.3
Russia 6.3 5.2 -7.8 4.0 4.4 4.0 4.1
Turkey 3.7 0.7 -4.8 8.9 6.1 5.1 5.3
Romania 4.3 7.1 -7.1 -1.2 1.6 3.7 4.0
(annual percent change unless indicated otherwise)
a. Growth rates over intervals are compound average; growth contributions, ratios and the GDP
deflator are averages.
b. GDP measured in constant 2005 U.S. dollars.
c. GDP measured at PPP exchange rates.
d. Exports and imports of goods and non-factor services (GNFS).
e. Transition countries: f + g below.
f. Central and Eastern Europe: Albania, Bosnia and Herzegovina, Bulgaria, Georgia, Kosovo,
Lithuania, Macedonia, FYR, Montenegro, Romania, Serbia.
g. Commonwealth of Independent States: Armenia, Azerbaijan, Belarus, Kazakhstan, Kyrgyz
Republic, Moldovia, Russian Federation, Tajikistan, Turkmenistan, Ukraine, Uzbekistan.
h. Estimate.
i. Forecast.
Forecast
81

Global Economic Prospects June 2011: RegionalAnnex
Recent developments
The recession in Europe and Central Asia was
much deeper than elsewhere in the developing
world, because substantial trade and financial
market linkages with high-income Europe.
Overall, regional industrial production, which
had been growing at a 6.2 percent pace in the
four years before the crash, fell 10 percent in
2009–more than three times as much as in other
developing regions. Partly as a result of this,
output only regained pre-crisis levels at the end
of 2010, versus mid-2009 for the rest of the
developing world.
As of the first quarter of 2011, industrial
production in the region was expanding at a 9.3
percent annualized pace. If sustained, such an
expansion should begin to close the still large 20
percent gap between current activity levels and
those that might have been observed if the boom
and bust not occurred. Progress at the sub-
regional level has been mixed, with Russian
(which represents over 50 percent of the region’s
total industrial product) growth of 8.3 percent
during 2010 underperforming the regional
aggregate, and well below the impressive
performance of Turkey, up 13.2 percent in 2010
(figure ECA.2). As a whole, seasonally adjusted
industrial production in the region grew almost
8.0 percent, ranging from an over 19 percent
increase in Lithuania for the 12 months ending
March 2011 to a 5.3 percent contraction in
Kazakhstan (for the 12 months ending April
2011).
Much of the initial impetus for recovery in
Europe and Central Asia reflected the region’s
strong export performance, that saw real
merchandise exports expanding at a 25 percent
annualized pace during the final three months of
2010. Lithuania and Romania, exporters of
manufactured goods to the EU market, recorded
some of the fastest growth rates (a more than 40
percent increase during the final 3 months of
2010), while economies in the Southern
Caucasus and Central Asia sub-region, such as
Armenia and Uzbekistan, reported the slowest
export growth rates (figure ECA.3).
The acceleration in regional trade reflects the
Figure ECA.2 Only by end-2010 industrial pro-
duction regained pre-crisis activity levels and re-
mains well below earlier trends
Sources: World Bank.
70
75
80
85
90
95
100
105
110
115
120
2008M06 2008M09 2008M12 2009M03 2009M06 2009M09 2009M12 2010M03 2010M06 2010M09 2010M12
Industrial production index, in constant USD, seasonally adjusted (2008:06=100)
Developing countries (ex. ECA)
Europe and Central Asia
Romania
Russia
Turkey
Source: World Bank
Figure ECA.3 Regional exports outpaced other
developing countries, reflecting growing market
share in high-income and Chinese markets
Source: World Bank, IMF.
60
70
80
90
100
110
120
130
2008M06 2008M09 2008M12 2009M03 2009M06 2009M09 2009M12 2010M03 2010M06 2010M09 2010M12
Exports index, in constant USD, seasonally adjusted (2008:06=100)
Developing Countries
Europe and Central Asia
High Income Countries
World
0
5
10
15
20
25
30
35
40
45
50
EU -of which, to Germany China
Share of total Europe & Central Asia exports to specific markets
2005
Jan-Nov 2010
82

Global Economic Prospects June 2011: RegionalAnnex
global recovery, but also the increased trade ties
of several countries in the region towards faster
growing economies inside and outside the
region. Between 2005 and 2010, the share of the
exports of countries going to the Commonwealth
of Independent States2 (CIS) and Russia was
broadly stable, while shares going to Turkey, the
EU (notably, Germany) and China increased
significantly (by more than 55 percent in the
case of China: figure ECA.3).3
This overall pattern has particular sub-regional
dimensions. The EU is a more important trading
partner for the western CIS, the Southern
Caucasus and countries like Albania, Bosnia and
Herzegovina, FYR Macedonia, Kosovo,
Montenegro and Serbia, while China is a
relatively more relevant trade partner for
countries in Central Asia (albeit the EU still
remains, on aggregate, the largest trade partner
of this sub-region).
The combination of growing exports volumes
and rising commodity prices, especially oil, has
contributed to a large fall in the region’s trade
deficit, from $3.6 billion at end 2010 to $0.7
billion in early 2011. Higher oil prices were
reflected in a sharp increase in the trade surplus
of oil exporters, from $10 billion in August 2010
to $14 in December, and a deterioration among
oil importers, from a $-13 to $-16 billion trade
deficit over the same period (figure ECA.4).
Despite the depth of the recession and the
massive disruption to the construction industry
and still large industrial sectors of the regional
economy, unemployment rose relatively little
from 7 percent in 2007 to a peak of 9.3 percent
in 2009 and has fallen relatively rapidly, coming
in at 8.6 percent at the end of 2010, a
nevertheless still elevated level that makes it a
ongoing cause for concern. The regional
aggregate is significantly influenced by
developments in Russia, Turkey and Ukraine
(figure ECA.5), which represent two thirds of
the region’s total population. Unemployment in
these countries rose by 2.6 percentage points
between 2008 and 2009, before falling by 1.5
percentage points between 2009 and 2010. In
the remaining countries of the region
unemployment averages 15.6 percent of the
labour force (ranging from close to full formal
employment in places like Belarus and
Tajikistan4 to as much as 45 percent
unemployment in Bosnia and Herzegovina).
Developments in these countries have been
equally varied, but there not only the average
unemployment rate was considerably higher
previous to the crisis, it actually rose somewhat
during 2010.
As observed elsewhere (see main text and
Financial annex), private capital inflows into
Europe and Central Asia, which were strong in
the second and third quarters of 2010 eased in
the fourth quarter of that year and into 2011 (for
Figure ECA.5 Unemployment down
Sources: IMF.
2
4
6
8
10
12
14
16
18
M6 2008 M8 2008 M10 2008 M12 2008 M2 2009 M4 2009 M6 2009 M8 2009 M10 2009 M12 2009 M2 2010 M4 2010 M6 2010 M8 2010 M10 2010 M12 2010 M2 2011
Umployment, percent
Romania
Russia
Turkey
Source: World Bank
Figure ECA.4 Rising commodity prices improve
oil exporter’s trade balances
Sources: World Bank.
-25
-20
-15
-10
-5
0
5
10
15
20
25
2000M01 2002M01 2004M01 2006M01 2008M01 2010M01
Oil importers
Oil exporters
3 month moving average of trade balance, billions of $
83

Global Economic Prospects June 2011: RegionalAnnex
the year as a whole they were still up 88 percent,
table ECA.3). The decline in portfolio flows was
most evident in Turkey, and roughly coincided
with the authorities’ decision to lower interest
rates in an effort to deter capital inflows being
attracted by high-interest rate differentials, while
restricting credit growth by simultaneously
raising reserve requirements. Russia experienced
significant outflows, despite high and rising
energy prices (figure ECA.6). FDI flows
increased the most in Ukraine, reflecting the
recapitalization of banks, while they declined
more in Kazakhstan and Romania. Significant
improvements will likely be delayed until the
regional recovery matures further and until there
are substantial improvements in the region’s
investment climate.5
Rising food prices following the extreme
drought in the summer of 2010 contributed to a
pickup in inflation in the region during 2010.6
Food prices rose at a 12 percent annualized pace
in the three months ending September 2010,
which contributed, with a lag, to an acceleration
in overall inflation to a 7.6 percent annualized
rate in the fourth quarter of the year. Year-over-
year, all-goods inflation picked up from 6.3
percent in June 2010, to 7.6 percent in the fourth
quarter of the year. Inflation now exceeds 10
percent in almost forty percent of the countries
in the region, but it has been easing as the
inflationary impact of the 2010 higher food
prices fades (figure ECA.7). However, the recent
rise in oil prices is likely to yield a second
acceleration, which may be exacerbated by
planned increases in regulated prices in Belarus
and Ukraine (and, in the case of Belarus, by a
devaluation of the currency).
Remittances are both an important source of
foreign currency for several countries in the
region and an important source of income for
households, and therefore an important
determinant of domestic demand. Remittances
are around 10 percent of GDP for countries like
Armenia and Bosnia and Herzegovina, and
between 18 and 35 percent of GDP for Albania,
the Kyrgyz Republic, Moldova and Tajikistan.
After falling by almost a quarter between 2008
and 2009, they rose by a meager 1.3 percent in
2010. Looking forward, high commodity prices
and stronger growth in migration destination
countries are expected to contribute to a 7.5
percent increase in remittances in 2011 and a
9.4 percent increase in 2012 (table ECA.2).
Fiscal and monetary policy
Monetary authorities in the region have
responded to the uptick in inflation by tightening
monetary policy via both higher interest rates
(Belarus, Russia, three times in the case of the
later, and four times already in the case of the
former) and increased reserve requirement
(Turkey). Despite rising policy rates, foreign Figure ECA.6 Hot money flows easing
Source: World Bank, CBR.
-5.0
-4.0
-3.0
-2.0
-1.0
0.0
1.0
2.0
3.0
4.0
5.0
2007 Q1 2007 Q3 2008Q1 2008Q3 2009Q1 2009Q3 2010Q1 2010Q3 2011Q1e
Turkey
Russia
Net foreign portfolio investment flows, % of GDP
Figure ECA.7 Inflationary impulse from food
prices appears to be easing
Source: World Bank.
0
2
4
6
8
10
12
14
16
18
2005M01 2005M07 2006M01 2006M07 2007M01 2007M07 2008M01 2008M07 2009M01 2009M07 2010M01 2010M07 2011M01
All 3m/3m saar
All Year-over-year
Food y-o-y
Food 3m/3m saar
Rate of inflation
84

Global Economic Prospects June 2011: RegionalAnnex
capital inflows to the region have declined and
upward pressure on exchange rates eased (figure
ECA.8). Domestic bank credit has started to
grow again, but so far at moderate rates.
The rebound in commodity prices during the
course of 2009 and 2010 helped to reduce
government deficits among regional energy
exporters from -5.4 percent of GDP in 2009 to -
2.4 percent in 2010. Declines among importers
were also noticeable, as increased activity helped
restore government coffers at the same time as
initial attempts towards discretionary fiscal
consolidation were announced (especially among
EU members). These broad aggregates hide
significant differences at the national level,
where government balances range from double
digit surpluses in Azerbaijan to almost double
digit deficits in post-conflict Kyrgyz Republic. A
few countries bucked the deficit reduction trend
(figure ECA.8), like Belarus, but the country’s
stock of public debt to GDP is still low, at
around 25 percent in 2010 (the largest share in
the region is to be found in the Kyrgyz Republic,
at 63 percent). Bulgaria also experienced an
increase in the cash fiscal deficit, nevertheless
fiscal adjustment in that country continued
through a reduction in previously accrued and
unpaid obligations.
Outlook
GDP in developing Europe and Central Asia
grew an estimated 5.2 percent in 2010, a modest
rebound given the steep decline in activity that
preceded it, but one which nevertheless served to
Table ECA.2 Workers’ remittances, compensation of employees, and migrant transfers, credit (US$ mil-
lion)
2003 2004 2005 2006 2007 2008 2009 2010p 2011f 2012f
All developing countries 137,500 159,258 191,779 226,297 278,181 324,972 307,569 324,714 348,576 374,501
Europe and Central Asia 11,597 15,998 23,262 28,397 39,332 45,832 35,433 35,879 38,681 42,308
% of developing countries 8.4 10.0 12.1 12.5 14.1 14.1 11.5 11.0 11.1 11.3
All developing countries 23.9% 15.8% 20.4% 18.0% 22.9% 16.8% -5.4% 5.6% 7.3% 7.4%
Europe and Central Asia 8.2% 37.9% 45.4% 22.1% 38.5% 16.5% -22.7% 1.3% 7.8% 9.4%
LDCs (UN-classification) 13.9% 12.9% 11.0% 18.5% 22.9% 32.8% 5.2% 5.8% 10.9% 7.3%
Fragile States 26.5% 8.4% 8.2% 12.6% -2.1% -9.1% 7.5% 6.7%
Small States 12.6% -1.3% 22.8% 27.8% 31.3% -11.4% 8.4% 7.8%
Source: World Bank
Workers' remittances, compensation of employees, and migrant transfers, credit (US$ million)
Growth (%)
Figure ECA.8 Exchange rates begin to fall, at the same time that the budgetary position becomes more
sustainable
Source: World Bank, IMF.
-10.0
-5.0
0.0
5.0
10.0
15.0
20.0
Azerbaijan Kazakhstan Russia Uzbekistan Lithuania Romania Turkey Ukraine Belarus Bulgaria
2009
2010
Budget balance as a % of GDP
80
85
90
95
100
105
110
115
120
125
M1 2009
M2 2009
M3 2009
M4 2009
M5 2009
M6 2009
M7 2009
M8 2009
M9 2009
M10 2009
M11 2009
M12 2009
M1 2010
M2 2010
M3 2010
M4 2010
M5 2010
M6 2010
M7 2010
M8 2010
M9 2010
M10 2010
M11 2010
M12 2010
M1 2011
M2 2011
Nominal exchange rate to the USD (index, January 2009=100)
Georgia
Moldova
Romania
Russian Federation
Serbia
Turkey
85

Global Economic Prospects June 2011: RegionalAnnex
reduce unemployment and improve fiscal
positions. Ongoing household and banking-
sector restructuring is expected to continue to
constrain growth, with GDP projected to expand
by 4.7 percent in 2011, and by around 4.5
percent in 2012 and 2013. While these growth
rates are close to estimates of the region’s
potential growth rate, growth is not likely to be
strong enough to make significant inroads into
the spare capacity generated by the crisis. As a
result, unemployment, although declining, is
projected to remain relatively high throughout
the projection period.
Overall, the external sector is projected to
contribute between -0.5 and 0 percent to overall
growth during the projection period. Among oil
exporters, the additional revenues from higher
prices are expected to boost domestic demand
and imports, such that in volume terms the
external sector subtracts somewhat from growth
in the economy. On the other hand, given strong
growth in other developing regions and the
projected firming of the recovery in high-income
Europe, the pick-up in regional manufacturing
export volumes is expected to continue
outpacing imports among oil importing
countries.
Higher commodity prices will increase current
account balances for commodity-rich countries
in the region, while having the opposite effect
among importers. However, revenues are
projected to leak into additional spending and
imports relatively quickly such that by 2013
current account surpluses of oil exporters, which
reached 5.5 percent of GDP in 2010, are
projected to return to 2.3 percent of GDP.
Current account deficits among oil importers are
projected to exceed -6 percent of GDP in 2011
and to improve only slightly to around -5.7
percent of GDP in 2013.
Higher commodity prices should boost
government revenues in resource-rich countries
in the region, reducing government deficits from
-2.5 of GDP in 2010 to a surplus of 1.1 of GDP
by 2013. At the same time, improving activity
levels and ongoing fiscal consolidation measures
are projected to reduce government deficits in oil
Table ECA.3 Net capital flows to Europe and Central Asia
Source: World Bank.
$ billions
2003 2004 2005 2006 2007 2008 2009 2010e 2011f 2012f 2013f
Current account balance 20.3 36.7 48.5 37.6 -14.1 13.3 14.1 22.3 -8.3 -76.9 -69.6
as % of GDP 2.0 2.8 2.9 1.8 -0.5 0.4 0.5 0.7 -0.2 -1.8 -1.4
Financial flows:
Net private and official inflows 81.0 99.9 127.8 218.2 410.4 262.1 89.8 132.1
Net private inflows (equity+private debt) 85.8 107.2 156.2 248.9 413.5 251.0 57.6 108.4 146.9 176.1 190.4
..Net private inflows (% GDP) 8.5 8.0 9.3 12.0 15.5 7.6 2.2 3.5 4.0 4.1 3.9
Net equity inflows 25.3 43.7 57.8 104.6 160.2 145.0 90.0 83.4 96.9 116.1 135.4
..Net FDI inflows 23.8 41.9 51.1 92.3 133.2 160.1 85.1 76.4 90.9 107.1 124.4
..Net portfolio equity inflows 1.5 1.8 6.7 12.3 27.0 -15.1 5.0 7.0 6.0 9.0 11.0
Net debt flows 55.8 56.2 70.0 113.6 250.2 117.1 -0.2 48.7
..Official creditors -4.7 -7.3 -28.4 -30.7 -3.0 11.1 32.2 23.7
....World Bank -0.2 1.0 -0.7 0.2 0.2 0.7 2.8 2.2
....IMF -2.0 -5.9 -9.8 -5.8 -5.0 6.2 20.2 10.5
....Other official -2.5 -2.5 -18.0 -25.1 1.8 4.2 9.3 11.0
..Private creditors 60.5 63.5 98.4 144.3 253.3 106.0 -32.5 25.0 50.0 60.0 55.0
....Net M-L term debt flows 34.0 52.2 80.0 108.9 177.5 121.3 5.3 24.0
......Bonds 7.3 14.4 16.6 32.3 55.9 16.2 -1.7 13.5
......Banks 27.1 39.0 64.7 77.5 122.6 105.7 7.3 10.5
......Other private -0.4 -1.3 -1.3 -0.8 -1.0 -0.6 -0.4 0.0
....Net short-term debt flows 26.5 11.3 18.4 35.4 75.7 -15.3 -37.7 6.9
Balancing item /a -52.3 -67.7 -89.3 -84.2 -170.2 -333.3 -77.9 -107.2
Change in reserves (- = increase) -49.1 -68.8 -87.0 -171.6 -226.1 57.8 -26.0 -47.2
Memorandum items
Workers' remittances 11.6 16.0 23.3 28.4 39.3 45.8 35.4 35.9 38.7 42.3
Note :
e = estimate, f = forecast
/a Combination of errors and omissions and transfers to and capital outflows from developing countries.
86

Global Economic Prospects June 2011: RegionalAnnex
importers from -4.4 percent of GDP in 2010 to
about -2.1 percent of GDP in 2013.
Russia, the largest regional economy, is set to
grow by around 4.2 percent yearly over the
forecast period, fueled in part by higher oil
revenues. Improving employment prospects are
projected to bring unemployment down to
around 6 percent in 2013 and this, together with
higher oil revenues, should be reflected in a
larger contribution from domestic consumption
and investment demand to growth. Parliamentary
elections in late 2011, and Presidential ones
during the first quarter of 2012 may result in
some election-year spending that could reduce
the large but mainly cyclically induced expected
improvement in the general government balance.
The limited diversification of the economy and
constraints to the increase of energy-related
exports remain key medium-term challenges that
are expected to prevent output from expanding
much more than 4 percent per annum over the
projection period. As a result, much of the
additional oil-revenue is expected to fuel an
increase in demand that will be met by increased
imports, so that the country’s current account
surplus is projected to decline to around 1.4
percent by 2013.
Growth in Turkey, the second largest developing
economy in the region, which rebounded
sharply in 2010 when the economy grew by 8.9
percent, is forecast to grow by a still robust 5.5
percent average over the forecast period.
Turkey's large current account deficit, and its
high oil import bill, at around 5 percent of GDP,
represent a source of vulnerability, should
investor sentiment sour or oil prices rise (see
scenario in main text).
Growth among the European Union’s members
in developing Europe (Bulgaria, Lithuania and
Romania) is projected to accelerate to around 3.4
percent during the projection period, aided by
the relatively diversified nature of these
economies, significant EU and IMF support
programs, and the recovery in the euro area.
Lithuania is also projected to benefit from the
robust performance of the Polish economy (now
a high-income country). Although these
countries have so far not been affected by
concerns about high-income Europe fiscal
sustainability, contagion via financial sector
links remains a possibility — placing a premium
on restoring an adequate degree of fiscal space to
their public finances.
The countries of the Western part of the
Commonwealth of Independent States (Belarus,
Moldova and Ukraine) are projected to grow by
an average of 4 percent between 2011 and 2013.
However, these economies face significant
potential downside risks, given their large
current account deficits (Belarus and Moldova),
and their relatively undiversified economies
(and, in the case of Belarus, by its over-reliance
on the Russian market for its exports). Ukraine
is also susceptible to external shocks, notably
from higher energy prices. Medium-term growth
is expected to be constrained to around 4.3
percent because of weak productivity growth
tied in part to the undiversified nature of the
economy and lack of competition.
In Central Asia, GDP in Kazakhstan (over two
thirds of the sub-regional GDP) is set to expand
by around 5.7 percent yearly during the next
three years on the back of high commodity
prices and deepening links with other developing
Asian economies. The sub-region will do even
better, growing by 6.1 percent. Strong
commodity prices should contribute to improved
public and external balances among the sub-
regional resource exporters — Kazakhstan,
Turkmenistan and Uzbekistan (Tajikistan is also
a significant cotton exporter). The Kyrgyz
Republic and Tajikistan are projected to make
inroads into their large external and fiscal
deficits, thanks in part to significant remittances
receipts and official aid, linked in the Kyrgyz
Republic to post-conflict reconstruction efforts.
Albania, Bosnia and Herzegovina, FYR
Macedonia, Kosovo, Montenegro and Serbia are
anticipated to grow by around 4.5 percent during
the next three years, supported by their close
economic ties with the recovering EU, including
significant financial and technical support.
Despite improved growth, these economies are
expected to continue to suffer on average from
87

Global Economic Prospects June 2011: RegionalAnnex
Table ECA.4 Europe and Central Asia country forecasts
Source: World Bank.
Est.
98-07a2008 2009 2010 2011 2012 2013
Albania
GDP at market prices (2005 US$) b 5.5 7.7 3.3 3.5 4.0 4.5 5.0
Current account bal/GDP (%) -6.2 -14.6 -16.0 -12.4 -10.8 -9.5 -7.9
Armenia
GDP at market prices (2005 US$) b 9.6 6.8 -14.1 2.1 4.6 4.3 4.2
Current account bal/GDP (%) -8.6 -11.6 -15.8 -13.9 -11.6 -10.3 -9.3
Azerbaijan
GDP at market prices (2005 US$) b 14.2 10.8 9.3 5.0 4.2 4.1 4.4
Current account bal/GDP (%) -7.2 35.6 21.6 25.7 25.8 22.4 21.5
Belarus
GDP at market prices (2005 US$) b 6.9 10.2 0.2 7.6 2.5 3.0 4.0
Current account bal/GDP (%) -3.9 -8.6 -13.0 -15.6 -9.3 -9.1 -9.3
Bulgaria
GDP at market prices (2005 US$) b 4.8 6.2 -5.5 0.2 2.9 3.4 3.9
Current account bal/GDP (%) -8.7 -22.9 -8.9 -1.0 -2.1 -2.4 -2.7
Georgia
GDP at market prices (2005 US$) b 6.6 2.3 -3.8 6.4 5.5 5.3 5.0
Current account bal/GDP (%) -9.8 -25.3 -11.2 -9.6 -10.8 -9.7 -8.1
Kazakhstan
GDP at market prices (2005 US$) b 8.3 3.3 1.2 7.0 5.7 5.5 5.8
Current account bal/GDP (%) -2.7 4.7 -3.8 2.9 5.2 4.4 3.9
Kosovo
GDP at market prices (2005 US$) b 6.9 2.9 4.0 5.7 5.2 4.9
Current account bal/GDP (%) -22.8 -25.0 -24.8 -28.8 -29.3 -26.9
Kyrgyz Republic
GDP at market prices (2005 US$) b 3.9 8.4 2.3 -1.4 5.0 6.0 6.4
Current account bal/GDP (%) -8.4 -14.6 2.0 -3.6 -10.8 -9.2 -5.0
Lithuania
GDP at market prices (2005 US$) b 5.8 2.9 -14.7 1.3 3.8 3.9 3.5
Current account bal/GDP (%) -8.5 -12.3 4.4 1.9 -1.0 -2.6 -2.5
Moldova
GDP at market prices (2005 US$) b 4.1 7.8 -6.0 6.9 4.2 4.5 4.8
Current account bal/GDP (%) -8.4 -17.3 -9.3 -10.5 -10.7 -10.3 -10.8
Macedonia, FYR
GDP at market prices (2005 US$) b 2.6 4.8 -0.7 0.8 2.9 3.7 4.2
Current account bal/GDP (%) -5.3 -12.8 -6.7 -2.9 -4.9 -5.1 -4.7
Romania
GDP at market prices (2005 US$) b 4.3 7.1 -7.1 -1.2 1.6 3.7 4.0
Current account bal/GDP (%) -7.0 -11.9 -4.3 -4.2 -5.1 -5.4 -5.7
Russian Federation
GDP at market prices (2005 US$) b 6.3 5.2 -7.8 4.0 4.4 4.0 4.1
Current account bal/GDP (%) 9.5 6.2 3.9 5.0 3.5 0.5 1.4
Serbia
GDP at market prices (2005 US$) b 3.3 5.5 -3.1 1.8 3.0 5.0 5.5
Current account bal/GDP (%) -7.4 -17.6 -6.9 -7.1 -7.3 -6.5 -5.7
Tajikistan
GDP at market prices (2005 US$) b 8.1 7.9 3.8 6.5 5.7 5.0 5.0
Current account bal/GDP (%) -3.8 -7.6 -5.9 2.2 -4.3 -6.4 -6.1
Turkey
GDP at market prices (2005 US$) b 3.7 0.7 -4.8 8.9 6.1 5.1 5.3
Current account bal/GDP (%) -2.4 -5.7 -2.2 -6.6 -7.7 -7.3 -6.9
Ukraine
GDP at market prices (2005 US$) b 5.9 2.1 -14.8 4.2 4.0 4.5 4.6
Current account bal/GDP (%) 3.2 -7.1 -1.5 -2.0 -3.1 -3.4 -3.6
Uzbekistan
GDP at market prices (2005 US$) b 5.2 9.0 8.1 8.5 8.0 7.8 7.5
Current account bal/GDP (%) 7.8 13.0 3.1 8.3 13.2 11.1 11.4
(annual percent change unless indicated otherwise)
World Bank forecasts are frequently updated based on new information and changing (global)
circumstances. Consequently, projections presented here may differ from those contained in other
Bank documents, even if basic assessments of countries’ prospects do not significantly differ at any
given moment in time.
Bosnia and Herzegovina, Turkmenistan, Montenegro are not forecast owing to data limitations.
a. Growth rates over intervals are compound average; growth contributions, ratios and the GDP
deflator are averages.
b. GDP measured in constant 2005 U.S. dollars.
c. Estimate.
d. Forecast.
Forecast
88

Global Economic Prospects June 2011: RegionalAnnex
very large and persistent formal unemployment,
limited state capacity and relatively fragile fiscal
and external positions (covered by remittances
and FDI inflows), which are set to improve only
slightly through the forecast horizon.
The economies of the South Caucasus sub-
region are expected to expand by an average of
4.5 percent over the next three years, due to
higher commodity prices and on the back of the
recoveries in the EU and in Russia. Oil-fueled
Azerbaijan is project to grow by a robust 4.2 and
to experience improvements in its external and
fiscal positions. Although both Armenia and
Georgia are projected to enjoy growth of,
respectively, around 4.3 and 4.9 percent going
forward, both these economies will remain
sensitive to changes in sentiment given persistent
double-digit current account and budget deficits.
Risks
Although the forces of recovery in the global
economy and in developing Europe and Central
Asia are well established, there are a number of
important evolving tensions that have the
potential to disrupt the relatively robust recovery
that is projected for the region.
Continued uncertainties and political tensions in
the Middle-East and North Africa or a further
disruption to oil supplies could send oil prices
even higher. Simulations reported in the main
text suggest that growth among regional oil
exporters could accelerate by between 0.1 and
2.0 percentage points in the 2011-2013 period if
tensions were to give rise to a sustained $50
increase in oil prices. The estimated 0.5 to 0.6
percentage point reductions in regional oil
importers growth between 2011 and 2013 is
somewhat less severe than for oil importers
elsewhere, partly because of offsetting benefits
of higher remittances and increased imports from
regional oil exporters, which represent around 60
percent of the regional economy.
A second major risk for the region centers on the
evolution of the fiscal sustainability crisis in
high-income Europe. So far, these challenges
have had limited impact in countries in
developing Europe and Central Asia—with
spreads having increased relatively little and
capital flows recovering in line with domestic
conditions. Should events in high-income
Europe force banks to repatriate capital or just
reduce the pace at which regional profits are
reinvested, capital flows to the region could dry
up —with potentially large negative effects on
those countries with high-levels of debt and/or
large current account deficits.
Finally, the region was buffeted by a very poor
crop year in 2010. If domestic production does
not improve, a second year of disappointing
harvests could reinforce recent upticks in
inflation —possibly even resulting in second-
round effects that would increase inflation
expectations, especially if combined with the
direct effects of the energy price shock, forcing a
further tightening of monetary policies and
increasing the already daunting challenges of
recovering from the excesses of the boom
period.
Notes:
1. For the purposes of this report, the
developing Europe and Central Asia region
is comprised of only low- and middle-
income countries (22 in total). Thus the
aggregate excludes high-income Western
European countries (among which Croatia,
the Czech Republic and Hungary), but
includes low- and middle-income EU
member states (Bulgaria, Lithuania and
Romania).
2. The CIS is a loose organization that includes
most of the countries from the former Soviet
Union, notably Armenia, Azerbaijan,
Belarus, Georgia, Kazakhstan, Kyrgyz
Republic, Moldova, Russia, Tajikistan,
Turkmenistan, Ukraine and Uzbekistan.
Turkmenistan discontinued its membership
of the CIS as of 26 August 2005, and is now
an associate member, while Georgia has left
the group in August 2009. Ukraine has never
ratified the CIS Treaty,
3. The ongoing creation process of a Customs
89

Global Economic Prospects June 2011: RegionalAnnex
Union between three members of the so-
c a l l e d ― E u r a s i a n E c o n o m i c
Community‖ (EurAsEC), namely Belarus,
Kazakhstan and Russia may conceivably
increase the regional share of intra-CIS trade
(albeit possibly at the cost of welfare-
reducing trade diversion).
4. Low measured unemployment likely reflects
hidden unemployment due to limited
economic restructuring in Belarus, and
imperfect official statistics in Tajikistan
5. The World Bank’s ―Doing Business‖
indicator, a useful proxy for investment
climate, shows that, while the region broadly
stagnated between 2010 and 2011 (the
average value for the aggregate indicator
remained at 78, or over twice the EU
average), each of the three largest regional
economies worsened their relative positions
(and Russia by a significant 7 slots).
6. See also ―Rising Food and Energy Prices in
Europe and Central Asia‖ (World Bank
2011) for an analysis of the regional effects
of increasing commodity prices.
90

Global Economic Prospects June 2011: RegionalAnnex
Recent developments
The Latin American and Caribbean region has
rebounded strongly from the global crisis of
2008-09, growing 6.0 percent in 2010 compared
with a 2.1 percent contraction in 2009. Strong
growth in Argentina, Brazil, and Peru boosted
growth in South America to 6.5 percent after a
mild contraction in 2009. Central America
(including Mexico), the area in the region most
affected by the crisis has yet to reach the level of
output recorded before the crisis, having
expanded 5.2 percent in 2010 after a 5.5 percent
contraction in 2009. The rebound in growth in
Central America reflects mainly a strong
rebound in the Mexican economy, which is
closely linked to the United States. The
Caribbean region recorded the weakest growth in
Latin America at 3.8 percent, after a modest 0.5
percent in 2009.
Industrial production growth picked up in the
first quarter of 2011, growing at more than a 10
percent seasonally adjusted annualized rate (or
saar) boosted by strong domestic demand and
Latin America and the Caribbean
Table LAC.1 Latin America and the Caribbean forecast summary
Source: World Bank.
Est.
98-07a2008 2009 2010 2011 2012 2013
GDP at market prices (2005 US$) b 2.9 4.0 -2.1 6.0 4.5 4.1 4.0
GDP per capita (units in US$) 1.6 2.7 -3.4 4.7 3.2 2.8 2.7
PPP GDP c 2.9 4.3 -2.0 5.9 4.7 4.2 4.1
Private consumption 3.2 5.1 -0.8 5.8 4.6 4.0 3.9
Public consumption 2.2 3.0 4.3 3.9 3.7 4.4 4.3
Fixed investment 3.4 8.7 -10.4 11.9 7.0 7.8 6.7
Exports, GNFS d 5.2 1.4 -10.1 12.5 6.6 6.1 6.1
Imports, GNFS d 5.5 7.7 -15.5 22.5 7.9 7.8 7.1
Net exports, contribution to growth -0.1 -1.7 1.7 -2.5 -0.6 -0.7 -0.6
Current account bal/GDP (%) -0.9 -0.8 -0.6 -1.5 -1.4 -1.9 -2.3
GDP deflator (median, LCU) 5.8 8.0 4.0 5.0 5.2 5.6 5.4
Fiscal balance/GDP (%) -2.9 -0.9 -4.0 -3.0 -2.2 -2.3 -2.0
Memo items: GDP
LAC excluding Argentina 3.1 3.8 -2.4 5.7 4.3 4.1 4.0
Central America e 3.5 1.8 -5.5 5.2 4.4 4.1 4.2
Caribbean f 4.4 3.3 0.5 3.8 4.1 4.3 4.0
Brazil 2.6 5.2 -0.7 7.5 4.2 4.1 3.8
Mexico 3.4 1.5 -6.1 5.5 4.4 4.1 4.2
Argentina 3.0 6.8 0.9 9.2 6.3 4.2 4.3
(annual percent change unless indicated otherwise)
a. Growth rates over intervals are compound average; growth contributions, ratios and the GDP
deflator are averages.
b. GDP measured in constant 2005 U.S. dollars.
c. GDP measured at PPP exchange rates.
d. Exports and imports of goods and non-factor services (GNFS).
e. Central America: Costa Rica, Guatemala, Honduras, Mexico, Nicaragua, Panama, El
Salvador.
f. Caribbean: Antigua and Barbuda, Belize, Dominica, Dominican Republic, Haiti, Jamaica, St.
Lucia, Trinidad and Tobago, St. Vincent and the Grenadines.
g. Estimate.
h. Forecast.
Forecast
91

Global Economic Prospects June 2011: RegionalAnnex
import demand from other developing countries,
China in particular, and more recently from high
-income countries where consumer spending has
started to recover at a moderate pace. The
recovery has been supported to a great extent by
strong increases in output and employment in
non-traded sectors, including services.
In seasonally adjusted annualized terms
acceleration in industrial production growth was
particularly pronounced in several resource-rich,
globally integrated economies, including
Argentina (close to 11 percent), and Mexico
(close to 9 percent). Growth in Central America
strengthened to close to 9 percent, boosted by
strong external demand. In other countries the
recovery is more muted or industrial production
remains stagnant (figure LAC.1).
Reflecting both differences in initial conditions
going into the crisis and in the pace of recovery,
output gaps across the region vary widely.
Manufacturing capacity utilization is now above
trend levels for the region as a whole, with the
recovery entering a new more-mature phase,
where additional investment in productive
capacity will be necessary to sustain growth
ahead. Spare capacity has been completely re-
absorbed in Uruguay, Peru, Brazil and Colombia
due to strong growth in 2010 and relatively
shallow slowdowns in 2009. Industrial output
gaps have closed in Mexico, and remain positive
in Argentina, but are expected to close in the
course of 2011 (figure LAC.2). Economic slack
remains an issue in the Caribbean economies and
Central America, partly because of their reliance
on remittances and tourism from the United
States and—to a lesser extent—Europe, where
the recovery has been relatively slow. Although
output in the region as a whole is now 2.2
percent below its pre-crisis peak level, in a few
countries it has exceeded that benchmark.
The rebound in industrial production has been
mirrored in trade volumes, which have also
strengthened in the three months ending in
March 2011. The biggest rebound was in
regional import demand, which preceded the
pickup in exports. Latin American imports now
stand 4 percent above earlier pre-crisis peaks,
reflecting a strengthening in regional domestic
demand--retail sales were up year-on-year 15.3
percent in Argentina, 8.5 percent in Brazil, 5.5
percent in Colombia in February, and
momentum is particularly strong in some of
these economies. Widespread currency
appreciation (notably in Brazil and Mexico) has
contributed to this result, as have stronger wages
in some cases.
The rebound in imports was followed by an
acceleration in regional export growth to a 9.2
percent annualized pace in the three months to
March 2011, mainly reflecting strong exports by
Argentina, Brazil, Colombia, and Mexico (figure
LAC.3). Export volumes are now roughly 1.1
percent above pre-crisis peaks, and exceed the
pre-crisis peak by 9.2 percent in Brazil. In
Figure LAC.1 Industrial output annualized growth re-
mains strong in Latin America
Source: Thomson Datastream and World Bank.
-40
-30
-20
-10
0
10
20
30
Jan-08 Aug-08 Mar-09 Oct-09 May-10 Dec-10
Central America Commodity exporters LAC
3m/3m %-change, volumes, seasonally adjusted annualized rates
Figure LAC.2 Industrial capacity utilization in Latin
American countries
Source: Thomson Datastream and World Bank
-39.1
-19.8
-9.6-2.6 -1.6 0.7
0.8 5.7 5.810.4
-60
-40
-20
0
20
40
60
Ecua
do
r
Chi
le
Arg
enti
na
Nic
arag
ua
Ven
ezue
la
Mex
ico
Bra
zil
Co
lom
bia
Uru
gua
y
Peru
percentage difference from long-term trend
92

Global Economic Prospects June 2011: RegionalAnnex
Central America, including Mexico, volumes are
closing on pre-crisis peaks. The increase in both
export revenues and imports is much stronger on
account of rising commodity prices for some
main export and import commodities.
Capital flows have returned to selected
economies in search of higher yields and are
putting upward pressures on select currencies
(box LAC.1). Net private inflows rose to 4.8
percent of GDP in 2010, after falling to 3.7
percent of GDP in the year of the crisis, but are
still shy of the 6.0 percent of GDP recorded in
2007. The largest increase was recorded in FDI
inflows, up 57.4 percent, while net portfolio
equity inflows increased by almost 30 percent to
$54 billion. Net lending by banks totaled $7.4
billion, after an outflow of $5.6 billion the
previous year, while short-term debt flows
amounted to $16.6 billion.
A large pipeline of sovereign and commercial
bond issuance has run through the region in the
first months of 2011. Mexico took advantage of
historically low U.S. interest rates and sold $1.5
billion of bonds due in 2040 during April, its
second dollar issue in two months, pushing its
share of regional offerings to 65 percent.
Figure LAC.3 Trade growth reaccelerates in Latin
America and the Caribbean
Source: World Bank.
-50
-30
-10
10
30
50
70
Jan-07 Sep-07 May-08 Jan-09 Sep-09 May-10 Jan-11
Exports
Imports
Volumes, ch% 3m/3m saar
Table LAC.2 Net capital flows to LAC
Source: World Bank. Note: e = estimate, f = forecast /a Combination of errors and omissions and transfers to and capital outflows from developing countries.
$ billions
2003 2004 2005 2006 2007 2008 2009 2010e 2011f 2012f 2013f
Current account balance 8.1 20.2 32.4 44.0 9.9 -35.8 -22.2 -67.1 -78.6 -112.8 -141.7
as % of GDP 0.4 0.9 1.2 1.4 0.3 -0.8 -0.6 -1.5 -1.4 -1.9 -2.3
Financial flows:
Net private and official inflows 62.2 57.2 85.2 66.2 217.5 177.2 166.7 240.4
Net private inflows (equity+private debt) 57.5 67.3 116.6 86.1 218.5 170.7 147.5 220.0 237.1 243.3 258.1
..Net private inflows (% GDP) 3.1 3.1 4.4 2.8 6.0 4.0 3.7 4.8 4.3 4.2 4.1
Net equity inflows 46.6 65.3 84.4 83.0 138.2 118.2 115.2 169.9 174.1 181.3 199.1
..Net FDI inflows 43.3 65.9 72.2 72.0 109.4 127.9 73.6 115.9 130.1 132.3 147.1
..Net portfolio equity inflows 3.3 -0.6 12.2 11.0 28.8 -9.7 41.6 54.0 44.0 49.0 52.0
Net debt flows 15.7 -8.1 0.8 -16.8 79.2 59.0 51.5 70.5
..Official creditors 4.7 -10.2 -31.3 -19.9 -1.1 6.5 19.2 20.4
....World Bank -0.4 -1.0 -0.7 -3.4 -0.1 2.4 6.6 6.2
....IMF 5.6 -6.3 -27.6 -12.1 0.0 0.0 0.4 0.2
....Other official -0.4 -2.9 -3.0 -4.4 -1.0 4.1 12.2 14.0
..Private creditors 10.9 2.0 32.2 3.1 80.3 52.5 32.3 50.1 63.0 62.0 59.0
....Net M-L term debt flows 9.2 -0.9 16.4 5.2 47.6 48.4 34.1 40.9
......Bonds 16.7 3.1 20.6 -11.9 13.4 7.5 40.3 33.5
......Banks -7.0 -3.8 -3.9 17.7 34.6 41.4 -5.6 7.4
......Other private -0.5 -0.1 -0.3 -0.6 -0.4 -0.5 -0.5 0.0
....Net short-term debt flows 1.8 3.0 15.7 -2.1 32.7 4.1 -1.8 16.6
Balancing item /a -34.6 -52.0 -83.3 -54.7 -89.6 -91.2 -92.5 -110.6
Change in reserves (- = increase) -35.6 -25.4 -34.4 -55.5 -137.8 -50.1 -52.0 -62.7
Memorandum items
Workers' remittances 36.9 43.4 49.8 58.9 63.0 64.5 56.6 57.6 62.5 68.4
93

Global Economic Prospects June 2011: RegionalAnnex
Furthermore international investors bought $21
billion of peso-denominated debt in the six
months through March. And Argentina’s
companies and provinces sold $1.5 billion worth
of bonds in the first quarter, a record since 2001
when the government defaulted on $95 billion of
obligations and more-than double the $597
million sold a year ago.
Inflationary pressures are rising in several
economies on higher food and fuel prices, strong
domestic demand, rising wages, and increasingly
limited spare capacity. Headline inflation rates
are near the upper ends of central bank target
ranges in many inflation-targeting economies.
Indeed, inflation accelerated to 6.5 percent
during April in Brazil (year-on-year) matching
the upper-limit of the inflation target range. In
Peru, inflation accelerated to the fastest pace in
almost three years, while Uruguay’s consumer
price inflation picked-up to 8.6 percent, the
fastest pace in four years, and well above the
upper limit of the inflation target range of 3 to 7
percent (figure LAC.4).
In most economies the build-up in inflationary
pressures stems from significant increases in
international fuel and food prices. Additionally,
Brazil, Peru, and Argentina are operating at
almost full capacity, and face the risk of cost-
Box LAC.1 Impacts of and policy responses to strong capital inflows and strong real credit growth
Strong economic performance in the major economies of the region, low interest rates in high-income countries,
and interest differentials favoring Latin American assets, have attracted large capital inflows. And along with
strong export revenues in commodity-exporting countries, this has resulted in strong upward pressure on selected
currencies. In real-effective terms, the Brazilian real and the Mexican peso have appreciated sharply, reducing the
external competitiveness of their exports.
To limit short-term volatile capital inflows, countries have implemented a combination of macro policies
(monetary, exchange rate policies, and fiscal policies). To stem currency appreciation, which in some cases had
started in the pre-crisis period, some countries have intervened in foreign exchange markets. As foreign exchange
market interventions were proving increasingly costly and ineffective in stemming currency appreciation, and as
massive sterilization efforts led in selected cases to rising interest rate differentials which where attracting still
more capital inflows, countries also resorted to some measures of capital control. Argentina, Brazil, Chile, Colom-
bia, Mexico, and Peru have intervened in the foreign exchange markets, while Chile, Colombia, Mexico and Peru
have also increased ceilings for foreign pension fund investments. Furthermore Brazil has introduced IOF taxes on
financial transactions, short-term loans and issuance of securities. It is now charging a 6 percent levy on interna-
tional debt sales and loans with an average minimum maturity of up to 360 days, after having tripled a tax on for-
eigners’ purchases of fixed-income securities in October 2010 in a bid to stem the appreciation of the real.
Countries have also taken steps to manage credit growth in a bid to ease domestic demand and prevent overheat-
ing, by increasing reserve requirements (Brazil, Colombia, Peru), as real credit growth has been expanding very
rapidly in selected economies (14 percent in Brazil and 20 percent in Colombia).
Rapid credit growth increases the risk that in the event of growth slowing down abruptly, banks’ balance sheets
will come under pressure. Some countries in the region have already implemented measures to strengthen balance
sheets and capital by raising countercyclical capital requirements, and capital requirements for credit operations
(Brazil), requiring tighter loan-loss provisions (Bolivia, Colombia, Peru), limiting the net open positions of finan-
cial institutions (Brazil, Colombia, Mexico, Peru), and through counter-cyclical provisioning (Bolivia, Colombia,
Peru, Uruguay).
Source: Crowe 2011, Moreno 2011
Figure LAC.4 Annualized inflation in the three months
to April exceeds the upper limit of the targeted band in
three of the five inflation targeting economies in LAC
Source: World Bank, Central Banks.
-2
0
2
4
6
8
10
-2
0
2
4
6
8
10
Brazil Chile Mexico Colombia Peru
Upper Limit Inflation momentum, saar Lower Limit
percent, 3m/3m saar
94

Global Economic Prospects June 2011: RegionalAnnex
push inflation. Indeed, wages in Argentina were
rising at a record pace in January. Demand-pull
inflation is also a source of concern in countries
like Brazil, where domestic demand remains
buoyant. Moreover, la Nina-related supply side
shocks have compounded the effects of imported
food inflation, in countries like Colombia and
Venezuela. Inflation remains relatively subdued
in many economies, including in Mexico, Chile,
and Peru.
Most inflation-targeting countries in the region
have begun to normalize monetary policy
(Mexico is a notable exception). Brazil’s central
bank hiked its benchmark rate 125 basis points
to 12.00 percent over the past three meetings as
inflation is nearing the upper limit of the targeted
range; while Peru raised policy rates ten times to
4.25 percent (figure LAC.5). Nevertheless, in
many cases policy has not kept pace with
inflation and how effective these measures will
depend critically on what has happened to
inflationary expectations. At the moment,
despite hikes in nominal interest rates, real
interest rates deflated by actual inflation remain
low and even negative in some countries. The
task of adopting the appropriate monetary policy
is being complicated in selected economies by
the surge in capital inflows, which is putting
pressure on currencies to appreciate and which
lead to increased liquidity in the economy to the
extent that these flows are intermediated by the
financial sector.
Relative to the pre-crisis period, the currencies
of Ecuador, Colombia, Chile, Peru and Brazil
have appreciated in nominal effective terms,
between 2.5 and 11 percent, while Venezuela
and Argentina recorded some of the strongest
depreciations. Meanwhile real effective
exchange rates have appreciated by more than 10
percent relative to the pre-crisis period in
Bolivia, Brazil, Costa Rica, Guyana, and
Uruguay, while depreciating in Mexico and
Argentina. Nevertheless given relatively stable
nominal exchange rate and high inflation rates
the Argentine peso appreciated strongly in 2010
and in the early months of 2011. In the first four
months of 2011 the currencies of Brazil,
Colombia, and Mexico have appreciated in
nominal effective terms by between 3.5 and 4.5
percent. In some cases like Brazil and Colombia,
the currencies are considered overvalued, while
in others like Argentina currencies are estimated
to be weaker than warranted by medium-term
fundamentals.
Many countries that saw increased pressures on
currencies intervened in the exchange markets,
including Argentina, Brazil, Chile, Colombia,
and Mexico. International reserves rose $37.6
billion to reach $657.1 billion by the end of the
first quarter. Some countries have also
introduced higher ceilings to foreign investment
of pension funds, including Chile, Colombia,
Mexico, and Peru (Crowe et al. 2011, Moreno
2011). Several countries, including Brazil and
Peru have resorted to capital controls to ease the
pressure on currencies.
After deteriorating on average by nearly 3
percent of GDP in the crisis year, as
governments engaged in counter-cyclical
spending, fiscal balances improved last year in
most developing Latin American and Caribbean
countries, on average by more than 1 percent of
GDP. Government balances deteriorated more in
small economies and island economies. General
government balances are expected to continue to
improve this year, by an estimated 0.8
percentage points of GDP, helped in large part
by commodity windfall for commodity
exporters. General government balances are
expected to deteriorate in Paraguay and Ecuador,
Figure LAC.5 Central banks in Latin America have
started the monetary tightening cycle
Source: National Agencies through Datastream
0
2
4
6
8
10
12
14
16
30-May 30-Jan 30-Sep 31-May 31-Jan
Mexico
Brazil
Colombia
Chile
Peru
short-term policy interest rates, percent
95

Global Economic Prospects June 2011: RegionalAnnex
among others, as growth decelerates and/or
prices of main commodity exports weaken. In
Argentina’s government balances are expected to
deteriorate as government spending grows faster
than government revenues, particularly in 2011,
an election year. In Haiti the government deficit
is projected to deteriorate sharply to 5.3 percent
of GDP in 2011, after a surplus of 2.2 percent of
GDP in 2010. Continued weak growth and
increased discretionary spending is expected to
cause deficits in some countries to deteriorate
further in 2011.
Nevertheless fiscal policies are becoming pro-
cyclical in some countries,1 and tightening is
required especially in countries that have very
little spare capacity and that show signs of
overheating. For these countries, but even for
those where deficits have receded, policy will
need to take special care to ensure that the fiscal
space that allowed policy to respond counter-
cyclically in the most recent crisis is recreated.
This, such that should another crisis arise, fiscal
policies will once again be in a position to
respond. Corrected for cyclical impacts on
spending and revenues, the structural deficit in
Argentina is estimated to be above 3 percent of
potential GDP, in Brazil it is estimated at 2.5
percent, while in Guyana it is more than 5
percent of GDP. Structural deficits are lower in
Chile and Peru, at around 1.5 percent of GDP.2
Brazil has signaled that it will rebalance its
policy mix to help fight inflation. Quasi-fiscal
expenditures remain a problem for Brazil
however, and public banks need to contain loan
expansion to help anchor inflationary
expectations. The government announced a 50
billion reais spending cut for 2011, with 68
percent to come from reductions in discretionary
spending, and the remainder to come from
limiting increases in mandatory expenditure.
Improved economic performance in high-income
countries and higher employment helped tourism
and remittances recover from the 2009 slump.
The recovery in remittances was modest in 2010,
but due to the depreciation of the U.S. dollar, in
local currency terms, remittances have fallen
slightly in many countries. Strong economic
performance in Latin America has also boosted
tourist arrivals and to a lesser extent, tourism
revenues, which tend to lag in a recovery. Still,
this has been a positive for growth, especially in
countries that rely heavily on tourism revenues.
Tourism arrivals increased the most in South
America, up 10.4 percent to 23.5 million,
followed by Central America, where arrivals
rose 8.3 percent to 8.3 million, while growth in
the Caribbean region lagged at 3.9 percent, with
a total of 20.3 million tourist arrivals.3 In the first
quarter of 2011 tourism arrivals were up 15
percent in Latin America and the Caribbean.
Current account balances deteriorated in the
Latin America and Caribbean region by 0.9
percent of GDP in 2010 to a deficit of 1.5
percent of GDP. Current account balances
remained relatively stable in the Caribbean
region and deteriorated by 0.24 percentage
points in Central America. Stronger currencies
and rapidly growing domestic demand help
explain in part the deterioration in current
account balances. In selected economies the
deterioration in the services balance has played a
significant role in the deterioration of current
account positions (for example in Brazil).
Medium-term outlook
After a strong 2010 recovery from the 2009
economic slump, Latin America and the
Caribbean is expected to grow at a somewhat
slower pace in 2011. Growing capacity
constraints, and high fuel and food prices that
cut into real incomes, as well as a gradual
tightening of fiscal and monetary policies are all
factors that are expected to contribute to the
slowdown (figure LAC.6).
Growth in Brazil is expected to ease from the 7.5
percent recorded in 2010, to 4.2 percent in 2011
and around 4.0 percent in 2012 and 2013, as the
economy is operating near full capacity, labor
market conditions are tight, and wages are
starting to increase faster than productivity. The
46 percent real effective exchange rate
appreciation observed since January 2009, is
expected to continue to weigh on industrial
production, both because of weaker exports and
96

Global Economic Prospects June 2011: RegionalAnnex
increased import demand. Capital flows are
projected to be boosted by an increase in FDI
(FDI is projected to reach $55 billion this year),
even as market sensitivity and government
policy serves to dampen more volatile equity and
debt-creating flows.
In Mexico, economic activity should slow mildly
to 4.4 percent in 2011, and 4.1 percent in 2012,
before picking up slightly to 4.2 in 2013. Higher
energy prices are projected to cut into consumer
demand in both Mexico and the United States,
with the latter impact slowing Mexican export
growth. Argentina’s economy is projected to
slow this year to 6.3 percent following a
remarkable 9.2 percent gain last year as bounce-
back effects recede. Prospects for 2012 and 2013
are for a further slowing of growth as capacity
constraints begin to be felt, but outturns will
depend importantly on efforts to improve the
country’s productive potential. Colombia’s
economy is expected to expand by about 4.7
percent in 2011, picking-up slightly from 4.3
percent recorded in 2010, before easing
marginally in 2012 to 4.4 percent and further to
4.2 percent in 2013. There are downside risks to
the forecast, as consumer demand is showing
signs of weakness, evidenced in weaker retail
sales and worsening consumer confidence.
Chile and Venezuela will be also see an
improvement in economic performance relative
to the previous year, while Peru should be the
star performer of the region, expanding by 7
percent in 2011, on the back of strong domestic
demand, expansionary fiscal policy and
consumption tax cuts, before easing to a more
sustainable pace of 5.2 percent by 2013.
Venezuela’s economy should recover this year,
after a two-year recession, but growth will
remain anemic, at less than 2 percent, as the
business environment continues unattractive for
private investors; inflation remains elevated, and
supply bottlenecks undermine economic
performance.
Growth in Central America excluding Mexico is
expected to accelerate to 4 percent in 2011, and
to average about 4.1 percent over the 2012-2013
period, as labor markets in the high-income
countries improve only gradually. Stronger
external demand will underpin growth over the
forecasting horizon, but remittances will grow
only modestly as labor income of migrants in the
United States and Spain advance only
moderately, and as unemployment remains
relatively elevated. Poor infrastructure, shortages
of skilled labor, expensive electricity and
unreliable energy supply will hinder growth in
the region.
Economic activity in the Caribbean will
accelerate marginally to 4.1 percent in 2011, in
large part due to continued strong growth in the
Dominican Republic and rebound in growth to
8.7 percent in Haiti on reconstruction efforts.
Meanwhile growth in other countries in the
region will be more subdued as remittances and
tourism are yet to show signs of moderate
recovery. Uncertainties regarding the strength of
the global recovery among U.S. investors have
resulted in major tourism and large-scale
investments being put on hold. Jamaica will be
one of the weakest performers in the region, due
to structural weaknesses and over-dependence on
the United States. The Dominican Republic,
which accounts for 40 percent of output in the
Caribbean region is expected to grow close to 5
percent in 2011 and record slower growth of 4.3
by 2013. Growth in the Caribbean is expected to
accelerate marginally to 4.3 percent in 2012
before easing to 4 percent in 2013.
Figure LAC.6 Growth in Latin America and
Caribbean to decelerate over the next two years
Source: World Bank.
-8
-6
-4
-2
0
2
4
6
8
10
12
2003 2004 2005 2006 2007 2008 2009 2010 2011 2012 2013
LACCentral America (incl. Mexico)
The Caribbean
GDP, percent change
97

Global Economic Prospects June 2011: RegionalAnnex
Current accounts are expected to deteriorate in
the economies that operate close to capacity and
which experienced currency appreciation, as
imports become cheaper. Commodity exporters
should continue to see improvements in their
current account balances, on account of stronger
growth in commodity revenues.
Despite the recent rise in oil prices, as a result of
the political upheavals in the Middle East and
North Africa, income effects in many oil-
importing developing countries are expected to
be relatively small due, to the partially offsetting
effects of high non-oil commodity prices.
Resource-rich oil importers in the region will see
their terms of trade improve slightly (0.2 percent
of GDP), as higher export prices for metals and
grains offset the negative impact induced by
higher imported oil prices. Saint Vincent and the
Grenadines, Dominica, Saint Lucia, Nicaragua,
Honduras, and Jamaica will see the largest terms
of trade losses, in excess of 3.5 percent of GDP
(figure LAC.7). Oil exporting countries will see
income gains of 2.0 percent of GDP, while the
region as a whole will see positive gains
estimated at 0.98 percent of GDP.
Risks
Perhaps the most important downside risk facing
the region is that the surge in oil prices will dent
global economic growth, as inflationary
pressures will take a heavier toll on consumer
spending worldwide. Most economies in Latin
America face the challenge of fine-tuning
monetary policy to help anchor inflationary
expectations and keep inflation rates within a
targeted range without dampening recovery. If
the authorities fail to bring inflation under
control in the near term, sharper monetary
tightening is the likely course of action, with
negative consequences for economic growth in
2012 and 2013.
The recent political upheavals in the Middle
East, while not having a direct impact on growth
for the region have increased the risks of further
hikes in energy prices, which will negatively
affect growth in oil-importing countries in the
region, and in particular growth in Central
America, excluding Mexico, and the Caribbean.
The impact of a sustained $50 per barrel increase
in oil prices is expected to slow growth by 0.3
percentage points in 2012 and 0.4 percentage
points in 2013 in Latin America and the
Caribbean (excluding Mexico), although the
impacts very by country (see Table 3 in the main
text).
And with food prices at elevated levels, any
disruption in supply risks pushing food prices up
further fueling inflation, cutting into household
purchasing power and increasing the poverty
count, and fueling social tensions. Failure to
bring inflation under control could result in
sharper tightening of monetary and fiscal policy,
which could result in a sharper slowdown in
economic activity.
Selected economies in the region face the risk of
overheating as they face strong commodity
prices and high capital inflows that underpin
strong domestic demand. If policymakers in the
region fail to rebuild policy buffers, vulnerability
to future crisis would be much increased.
Furthermore if exit from the fiscal stimulus is
delayed, countries will rely more on monetary
tightening to keep inflation under control.
The economic fallout from the earthquake and
tsunami that hit Japan will likely have a negative
impact on FDI flows, given that Japan is an
important source of FDI for countries like Brazil.
Another risk facing the emerging economies in
Figure LAC.7 The terms of trade impacts in 2011
Source: World Bank.
-6 -4 -2 0 2 4 6 8 10
St. Vincent & GrenadinesDominica
St. LuciaNicaraguaHonduras
JamaicaGuyana
El SalvadorHaiti
BelizeDominican Rep.
Costa RicaGuatemala
UruguayBrazil
MexicoPeru
ChileArgentina
BoliviaEcuador
ParaguayVenezuela
share of 2010 GDP, percent
98

Global Economic Prospects June 2011: RegionalAnnex
the LAC region is that of an abrupt reversal of
portfolio flows, which could result in sharp
depreciations of currencies. A disorderly
unwinding of the fiscal sustainability issue in
Europe represents a risk to economic activity in
the Latin America and Caribbean region through
trade and financial linkages.
Table LAC.3 Latin America and the Caribbean country forecasts
Est.
98-07a2008 2009 2010 2011 2012 2013
Argentina
GDP at market prices (2005 US$) b 2.2 6.8 0.9 9.2 6.3 4.2 4.3
Current account bal/GDP (%) 1.3 2.1 2.8 0.8 0.4 -0.6 -0.9
Belize
GDP at market prices (2005 US$) b 5.4 3.8 0.0 2.0 2.1 2.4 2.8
Current account bal/GDP (%) -13.1 -10.7 -9.4 -2.7 -8.6 -6.6 -5.8
Bolivia
GDP at market prices (2005 US$) b 2.8 6.1 3.4 4.2 4.4 4.5 4.2
Current account bal/GDP (%) 0.8 12.0 4.7 4.8 3.7 4.3 3.8
Brazil
GDP at market prices (2005 US$) b 2.8 5.2 -0.7 7.5 4.2 4.1 3.8
Current account bal/GDP (%) -1.2 -1.7 -1.5 -2.6 -2.6 -3.3 -3.6
Chile
GDP at market prices (2005 US$) b 3.4 3.7 -1.7 5.2 6.1 5.0 4.5
Current account bal/GDP (%) 0.3 -1.9 1.6 1.9 0.8 0.2 -1.8
Colombia
GDP at market prices (2005 US$) b 3.1 2.7 1.5 4.3 4.7 4.4 4.2
Current account bal/GDP (%) -1.4 -2.9 -2.2 -3.1 -1.9 -2.6 -2.8
Costa Rica
GDP at market prices (2005 US$) b 4.7 2.6 -1.3 4.2 4.0 4.2 4.5
Current account bal/GDP (%) -4.6 -9.3 -1.9 -3.6 -4.2 -4.3 -4.7
Dominica
GDP at market prices (2005 US$) b 1.6 3.5 -0.3 1.0 1.9 2.6 2.8
Current account bal/GDP (%) -19.0 -36.4 -28.3 -26.9 -30.2 -26.4 -24.7
Dominican Republic
GDP at market prices (2005 US$) b 4.9 5.3 3.5 7.8 5.1 4.9 4.3
Current account bal/GDP (%) -1.4 -9.9 -4.6 -8.2 -8.7 -6.0 -5.4
Ecuador
GDP at market prices (2005 US$) b 3.1 7.2 0.4 3.6 3.1 3.2 3.6
Current account bal/GDP (%) -0.1 2.0 -0.5 -3.4 -3.1 -3.4 -3.8
El Salvador
GDP at market prices (2005 US$) b 2.6 2.4 -3.5 0.7 2.5 3.0 3.2
Current account bal/GDP (%) -3.1 -7.2 -1.8 -2.5 -4.4 -3.3 -3.6
Guatemala
GDP at market prices (2005 US$) b 3.4 3.3 0.6 2.5 3.1 3.3 3.0
Current account bal/GDP (%) -5.4 -4.5 -0.1 -2.2 -3.4 -3.8 -4.1
Guyana
GDP at market prices (2005 US$) b 1.7 2.0 3.3 3.5 4.6 5.1 5.6
Current account bal/GDP (%) -8.7 -9.9 -7.7 -9.5 -10.7 -21.0 -19.3
Honduras
GDP at market prices (2005 US$) b 4.0 4.0 -2.1 2.8 3.2 3.8 4.0
Current account bal/GDP (%) -6.7 -12.9 -3.8 -6.2 -6.9 -6.5 -6.5
Haiti
GDP at market prices (2005 US$) b 0.6 0.8 2.9 -5.4 8.7 9.0 8.3
Current account bal/GDP (%) -22.4 -11.9 -3.9 -3.4 -4.3 -4.8 -5.1
Jamaica
GDP at market prices (2005 US$) b 1.6 -0.5 -3.0 -1.1 1.7 2.2 2.4
Current account bal/GDP (%) -7.8 -19.6 -10.4 -8.4 -8.7 -8.0 -6.0
(annual percent change unless indicated otherwise) Forecast
99

Global Economic Prospects June 2011: RegionalAnnex
Source: The World Bank.
Notes:
1. World Bank, LAC Success put to the test,
April 2011.
2 IMF, World Economic Outlook, April 2011.
3 UN World Tourism Organization, January
2011.
References
Crowe, C., G. Dell’Ariccia, D. Igan, and P.
Rabanal, 2011. “Policies for Macro-Financial
Stability: Options to Deal with Real Estate
Booms.” IMF Staff Discussion Note SDN/11/02,
February.
International Monetary Fund. 2011. World
Economic Outlook. April.
Moreno, R., 2011. “Policymaking from a
macroprudential perspective in emerging
markets.”
BIS Working Papers No. 336, January.
Walsh, James P. 2011. ―Reconsidering the Role
of Food Prices in Inflation‖. IMF Working Paper.
WP11/71.
World Bank, 2011. “LAC Success put to the
test”.
World Travel and Tourism Council. 2011
Tourism Impact Data and Forecast. April 2011.
[www.wttc.org]
(annual percent change unless indicated otherwise) Est.
98-07a 2008 2009 2010 2011 2012 2013
Mexico
GDP at market prices (2005 US$) b 2.8 1.5 -6.1 5.5 4.4 4.1 4.2
Current account bal/GDP (%) -1.9 -1.5 -0.7 -0.5 -0.8 -1.0 -1.0
Nicaragua
GDP at market prices (2005 US$) b 3.4 7.5 -5.6 5.1 3.1 3.5 4.0
Current account bal/GDP (%) -18.0 -25.8 -12.9 -15.5 -16.2 -16.2 -15.7
Panama
GDP at market prices (2005 US$) b 4.8 10.7 2.4 4.5 7.4 6.8 6.0
Current account bal/GDP (%) -5.5 -11.7 -0.2 -11.2 -12.4 -11.8 -11.9
Peru
GDP at market prices (2005 US$) b 4.1 9.8 0.9 8.8 6.9 6.1 5.2
Current account bal/GDP (%) -1.1 -3.7 0.2 -1.4 -2.2 -3.1 -3.0
Paraguay
GDP at market prices (2005 US$) b 1.9 5.8 -3.8 15.3 5.5 4.6 4.3
Current account bal/GDP (%) -0.1 -1.8 0.3 -3.2 -4.0 -4.0 -3.1
St. Lucia
GDP at market prices (2005 US$) b 2.0 0.8 -3.6 1.1 3.7 3.7 3.1
Current account bal/GDP (%) -18.5 -35.2 -14.4 -16.7 -27.0 -21.6 -18.5
St. Vincent and the Grenadines
GDP at market prices (2005 US$) b 4.2 1.1 -1.1 -2.1 3.1 2.9 3.6
Current account bal/GDP (%) -20.4 -39.2 -33.8 -33.2 -36.2 -33.4 -32.7
Uruguay
GDP at market prices (2005 US$) b 0.8 8.5 2.6 8.5 5.2 5.7 4.1
Current account bal/GDP (%) -1.0 -4.8 0.7 0.6 -1.4 -2.0 -2.4
Venezuela, RB
GDP at market prices (2005 US$) b 2.8 4.8 -3.2 -1.5 1.6 2.2 2.4
Current account bal/GDP (%) 8.5 12.0 2.6 5.0 7.6 6.6 4.7
World Bank forecasts are frequently updated based on new information and changing (global)
circumstances. Consequently, projections presented here may differ from those contained in
other Bank documents, even if basic assessments of countries’ prospects do not significantly
differ at any given moment in time.
Barbados, Cuba, Grenada, and Suriname are not forecast owing to data limitations.
a. Growth rates over intervals are compound average; growth contributions, ratios and the GDP
deflator are averages.
b. GDP measured in constant 2005 U.S. dollars.
c. Estimate.
d. Forecast.
Forecast
100

Global Economic Prospects June 2011: RegionalAnnex
Recent developments
Before the start of the political upheaval in
the Middle East and North Africa, developing
countries of the region had been poised to
improve economic performance over 2011-12,
returning to GDP gains of near 5 percent.1
Indeed, lack of tight international connections in
finance and non-oil goods trade allowed
developing Middle East and North Africa2 to
experience less adverse effects from the financial
crisis and global recession of 2008-09 than other
developing regions. But recovery in 2010
disappointed, with regional growth falling below
expectations to 3.1 percent, the slowest growth
among developing regions in a year of buoyant
gains for developing economies.
The Arab Spring. Revolutions and unrest have
disrupted economic activity across almost every
country in the region over the first months of
2011, and will continue to restrain growth in a
number of countries at least for the year, and
potentially for more. For those parts of the
region where unrest has been less marked, higher
oil prices (linked tightly to developments in the
Middle East and North Africa) will be a boon for
some and a drag on growth for others. And
higher food prices will exact an increasing toll
on external balances across all countries.
Economic and social impacts are likely to be
substantial in the short term as production, trade,
services and other elements of economic activity
slip; and fiscal revenues, tourism and FDI
receipts come under increasing pressure.
Consumers will be further affected as inflation
heats up, tied among other factors to
developments in oil and food prices.
Taking current- and anticipated developments
for 2011 into consideration, a comparison of the
January 2011 projections with revised forecasts
prepared in April, yields a sobering conclusion.
GDP growth for the developing region is likely
to suffer a 3.1 percentage point mark-down for
the year, from gains of 4.9 percent expected in
January to 1.8 percent anticipated in April.3
Those economies hardest hit include Egypt
(down 4.5 percentage points), Tunisia (3.3
points) and Jordan (1.5 points) (figure MNA.1).
Political-economy developments in countries
where protests- and authorities‘ responses
occurred earliest—Tunisia and Egypt—could
play a strong role in shaping other outturns in the
region. And as evidenced from the first months
of 2011, there are a variety of political responses
across the Arab world. Progress may be more
likely in countries like Tunisia, as well as in the
monarchies (Jordan and Morocco) where popular
pressure will continue to have well-established
channels in which to be expressed. In the broader
view of the World Bank, if these political events
and economic externalities are followed by
sound transitions to better governance structures,
in looking forward, they should provide a unique
opportunity to change Middle East and North
Africa‘s political and social landscape (table
MNA.1).4
The parameters of political and economic
disturbance in 2011. With the exception of
several GCC economies, every country in the
region has been affected—to varying degrees by
Middle East and North Africa
Figure MNA.1 GDP growth marked down by 3.1 points
in 2011 for developing Middle East and North Africa
Source: Middle East and North Africa Poverty Reduction
and Economic Management Unit, World Bank.
0 2 4 6
GCC
Algeria
Developing Oil exporters
Tunisia
Jordan
Egypt
Diversified economies
Developing MENA
Forecast of January 2011 Forecast of April 2011
GDP growth in percent
101

Global Economic Prospects June 2011: RegionalAnnex
the Arab Spring. Among important observed and
anticipated economic developments for 2011:
Oil prices are likely to remain high amid the
Libyan crisis and market fears of potential
supply disruptions tied to unrest in larger oil
exporters;
Oil exporters that are less troubled by protest
(e.g. Algeria, Kuwait, Oman, Qatar, Saudi
Arabia and the UAE) will likely see windfall
gains from higher oil prices—but net fiscal
revenues will be reduced by use of funds for
financial packages intended to address social
unrest;
Oil importers will suffer—especially those that
choose to provide energy and food subsidies.
Higher food prices will accentuate inflation
pressures.
Egypt, Tunisia, Libya, and potentially Syria,
will be most affected, as continued uncertainty,
economic disruption and lapse in tourism
revenues dampens growth in the former two,
while Libya—and to a lesser degree, Syria—
may face prospects of prolonged violence or
civil war. Those countries which have
experienced the longest protests will suffer
lower growth- with investment coming to be
particularly adversely affected.
Developing Middle East and North Africa’s
growth edged lower in the second half of
2010—and for the year. Early indicators for
2011 point to a substantial slowdown.
The initial strong rebound in global trade and
production, particularly among the regions‘ main
Euro Area trading partners, and rising oil prices
underpinned GDP gains for developing Middle
Table MNA.1 Middle East and North Africa forecast summary
Source: World Bank.
Est.
98-07a2008 2009 2010 2011 2012 2013
GDP at market prices (2005 US$) b 4.1 3.7 2.8 3.1 1.9 3.5 4.0
GDP per capita (units in US$) 2.6 1.9 1.1 1.5 0.2 1.9 2.3
PPP GDP c 4.3 4.1 3.1 3.0 1.7 3.6 4.0
Private consumption 4.4 5.1 4.5 4.4 3.2 3.5 4.2
Public consumption 3.2 9.1 12.6 8.3 8.6 7.3 7.0
Fixed investment 6.0 7.7 1.0 -3.8 -2.4 3.4 5.9
Exports, GNFS d 5.2 4.6 -4.9 4.6 3.7 4.4 2.0
Imports, GNFS d 7.1 11.4 -7.8 3.6 2.4 6.9 7.1
Net exports, contribution to growth -0.2 -2.2 1.0 0.4 0.5 -0.7 -1.7
Current account bal/GDP (%) 7.5 7.7 -1.1 1.4 5.6 5.7 4.3
GDP deflator (median, LCU) 4.8 12.2 3.0 5.5 11.5 7.3 5.3
Fiscal balance/GDP (%) -1.0 -0.3 -4.1 -4.3 -3.2 -2.3 -1.8
Memo items: GDP
MENA Geographic Region e 3.8 4.4 1.5 3.2 2.8 3.8 4.1
Resource poor- Labor abundant 4.1 6.6 4.8 4.5 2.5 4.0 5.0
Resource rich- Labor abundant 4.2 1.8 1.4 2.2 1.4 3.2 3.2
Selected GCC Countries f 3.4 5.3 0.0 3.3 4.0 4.2 4.3
Egypt 4.3 7.2 4.7 5.2 1.0 3.5 5.0
Iran 4.9 1.0 0.1 1.0 0.0 3.0 3.0
Algeria 3.5 2.4 2.4 3.3 3.7 3.6 3.5
(annual percent change unless indicated otherwise)
a. Growth rates over intervals are compound average; growth contributions, ratios and the
GDP deflator are averages.
b. GDP measured in constant 2005 U.S. dollars.
c. GDP measured at PPP exchange rates.
d. Exports and imports of goods and non-factor services (GNFS).
e. Geographic region includes high-income countries: Bahrain, Kuwait, Oman and Saudi
Arabia.
f. Selected GCC Countries: Bahrain, Kuwait, Oman and Saudi Arabia.
g. Estimate.
h. Forecast.
Forecast
102

Global Economic Prospects June 2011: RegionalAnnex
East and North Africa during the first half of
2010. But a world-wide ―growth pause‖ in
production during the third quarter- and
slumping demand in Europe during the second
half of 2010 came to the fore (see Main Text)
and dampened the region‘s non-oil exports to
Europe, slowed tourism arrivals from earlier
heady rates while crimping remittance flows to
the Maghreb and Egypt in particular. These
developments preceded the start of popular
unrest in early 2011.
Industrial production for the diversified
economies (proxied in some cases here by
electricity generation) slowed from rapid gains
in early 2010 to fall fairly sharply during the first
quarter of 2011.5 Egyptian cement production for
example, traced a path of output responding to
easing domestic and foreign demand, from
growth of 20 percent in late 2009 to declines
averaging 15 percent over the first quarter of
2011; on a smoothed basis, cement output
dropped 11.3 percent in March (3mma, y/y). In
contrast, the decline in Egyptian electricity
generation highlights the initial effects of the
reform demonstrations in Cairo and the attendant
broader disruption to economic activity, halving
from robust 8 percent gains in early 2010 to
below 4 percent the first quarter (figure
MNA.2a)
Among other diversified economies,
manufacturing production in Tunisia performed
well until late 2010, but by March 2011 had
fallen 9.3 percent on a smoothed basis (y/y),
with output of textiles and clothing declining at a
steeper 15 percent rate. Lebanon highlights a
case of faltering production growth over the
course of the second half of 2010, due to a
cyclical decline after a period of unprecedented
boom, especially in construction and real estate.
Developments in the region and uncertainty
regarding political developments in the country
yielded a falloff in electricity generation of 3.3
percent in the first quarter (y/y); Jordan‘s path of
recuperating output growth became more volatile
but re-crossed the line to positive growth in
March (figure MNA.2b).
Merchandise trade. Market conditions have been
difficult for the diversified group, with main
export destinations in the European Union
undergoing generally sluggish GDP growth and
weak demand for exports from the region. But
most recent data suggests a renewal of export
growth for several countries, a favorable note in
the current environment. Almost mirroring
production trends, Egyptian exports shifted from
growth near 25 percent at the start of 2010 to
modest decline in February 2011, but of
encouragement, to a sharp upturn in March
reaching an 11 percent smoothed year-on-year
pace. Exports of Lebanon dropped by 8 percent
as of March, down from 20 percent gains in the
Figure MNA.2a Egypt: Early indicators of disrup-
tion to economic activity
Source: Egypt CAPMAS, through Haver Analytics.
1
2
3
4
5
6
7
8
9
-15
-10
-5
0
5
10
15
20
25
Jan-09 Apr-09 Jul-09 Oct-09 Jan-10 Apr-10 Jul-10 Oct-10 Jan-11
Egypt IP cement [Left] Egypt IP electricity [Right]
ch% 3mma, yr-on-yr
Figure MNA.2b: Activity begins to falter in other diversified economies as well
Source: National Agencies through Haver Analytics.
-10
-5
0
5
10
15
Jan-09 Apr-09 Jul-09 Oct-09 Jan-10 Apr-10 Jul-10 Oct-10 Jan-11
Tunisia IP Jordan IP Lebanon IP Electricity
ch% 3mma yr-on-yr
103

Global Economic Prospects June 2011: RegionalAnnex
spring of 2010. For Tunisia, textiles and clothing
shipments declined by some 7.5 percent in
March (smoothed, y/y)—likely a combination of
supply difficulties in production and weaker
demand in export markets. But overall exports
are reviving quickly to a 15 percent pace as of
April. Conditions have been difficult for
Morocco and Jordan, but both countries have
seen exports perform buoyantly, in a 20 to 30
percent range, due to strong global demand for
phosphates (inputs to fertilizers and other goods
and materials) (figure MNA.3).
Tourism—a mainstay for the region exerting
negative economic effects in 2011. For Lebanon,
Morocco, Tunisia, Jordan and Egypt, as well as
GCC-members Bahrain and the United Arab
Emirates, international tourism constitutes a key
contributor to GDP, with fiscal revenues
benefitting as well. Tourism is a key driver for
local employment growth directly—and through
second-round effects—while spurring domestic
and foreign investment in tourism and related
facilities. For the GCC economies, tourism is
providing an important path for diversification.
Before the onset of the political uprising, tourism
in the broader Middle East and North Africa
region was booming, with arrivals in 2010 up by
10.2 percent to 98 million persons; and for the
country sample in figure MNA.4a, a jump of 11
percent to 37 million arrivals (figure MNA.4a).
This represented an impressive rebound from the
2009 recession, with tourist arrivals improving
from 3.5 percent growth in the previous year.
Performance in Egypt was particularly vibrant,
with a 17.5 percent gain in arrivals and 16.5
percent jump in receipts.
Looking at developments in 2011, with data
covering just a few months of the year, tourism
Figure MNA.4a Middle East and North Africa
tourism boomed in 2010
Source: United Nations World Tourism Organization and National Agencies.
0
5,000
10,000
15,000
20,000
25,000
30,000
35,000
40,000
2000 2001 2002 2003 2004 2005 2006 2007 2008 2009 2010
Tunisia
Morocco
Lebanon
Jordan
Egypt
tourist arrivals ('000)
Figure MNA.4b Tourism’s contribution to GDP was large in several Middle East and North Africa coun-tries (2010)
Source: World Travel and Tourism Council and World Bank..
0 3 5 8 10
Saudi Arabia
Algeria
Middle East
Syria
United Arab Emirates
Bahrain
North Africa
Egypt
Jordan
Tunisia
Morocco
Lebanon
Direct contribution to GDP in percentage points
Figure MNA.3 Exports from the diversified econo-
mies generally slacken in the second half of 2010
and into early 2011
Source: National Agencies through Haver Analytics,
Tunisia: INS, Morocco: Customs, Egypt: CAPMAS,
and Jordan: DoS.
-50
-38
-25
-13
0
13
25
38
50
2009M01 2009M06 2009M11 2010M04 2010M09 2011M02
Tunisia
Morocco
Egypt
Jordan
export values in US dollars, ch% 3mma, yr on yr
104

Global Economic Prospects June 2011: RegionalAnnex
arrivals appear to have fallen dramatically. Both
Egypt and Tunisia, for example, have reported a
45 percent decline in arrivals between the first
quarter of 2011 and the like period of 2010. Such
large-scale falloff in arrivals (and related
receipts), if sustained could exact a heavy toll on
growth in countries where tourism contributes a
substantial share of GDP (figure MNA.4b).
Estimates of the direct contribution of tourism to
GDP appearing in the figure are produced by the
World Travel & Tourism Council (WTTC), an
industry group working closely with the United
Nations World Tourism Organization
(UNWTO).6 In addition to the direct impact of
tourism on the economy, second-round effects
can be quite large, as tourism is a labor intensive
sector with many interconnections with other
branches of the economy; and in recent years
tourism has attracted much related investment,
both domestically and from abroad.
The less-than-favorable tourism reports from
Egypt and Tunisia to date, together with
preliminary projections of a potential 18 percent
drop in tourism-related receipts during Egypt‘s
FY-20117, would imply (using WTTC impact
factors) a 1.1 percent direct loss in GDP for the
year. Second-round and induced effects could
carry GDP lower by an additional 1.1 points—an
adverse tourism contribution to GDP of 2.2
percentage points. As earlier noted, Egypt‘s
growth—pre-to-post the beginnings of the ‗Arab
Spring‘—had been marked down by 4.5 points
(see figure MNA.1), implying non-tourism
related factors (disruptions to production and
other economic activity) may account for the
remaining 2.3 points of the slowdown. A similar
range of assumptions for tourism revenues/
arrivals in Tunisia, Morocco, Jordan or Lebanon
would likely result in broadly similar outturns.
Worker remittance flows to the developing
region faltered during the global recession of
2009 (as remittances did for all developing
regions) by some 7 percent to $32.2 billion, as
employment conditions in host countries in
Europe, the GCC and elsewhere deteriorated.8
Hardest hit at the time were Egypt and Yemen,
each facing a decline of more-than 18 percent.
As recovery advanced within the region and
abroad in the first half of 2010, remittances for
the year grew by 6.5 percent (with Egypt up 8.1
percent to $7.7 billion) stronger than the 5.6
advance for developing countries in aggregate.
Looking forward, the World Bank‘s Migration
and Remittances Unit expects Egypt to garner a
modest 0.8 percent gain during 2011, while
remittance inflows to Tunisia are seen to drop by
2.5 percent. For developing Middle East and
North Africa overall remittances increase 3.5
percent, slowest among developing regions, with
stronger recovery in 2012 (5.4 percent)—still
sub-par contrasted with the region‘s historic
standards (average growth of 14 percent over
2000-2008).9
Large shifts in international prices and terms
of trade carry differing effects across the
region.
Heightened market uncertainty regarding oil
supply accentuated by the outage of Libyan
crude, served to increase the price of benchmark
Brent oil to above $120/bbl in April 2011, a 33
percent increase from December 2010 levels,
with the World Bank average price registering
$116/bbl for the month (figure MNA.5 and
Commodity Annex).10 A number of commodity
analysts suggest that about $20/bbl of the
increase in price relates to tension in the region;
the remainder reflects strong world demand for
oil. Given the continued fluidity of the political
economy in the region, the outlook for crude oil
Figure MNA.5 Wheat, maize and sugar double from recent troughs....oil increases 3-fold
Source: World Bank.
50
100
150
200
250
300
350
400
450
500
550
Jan-04 Jan-05 Jan-06 Jan-07 Jan-08 Jan-09 Jan-10 Jan-11
Crude Oil
Wheat
Maize
Sugar
Index Jan-2004=100
105
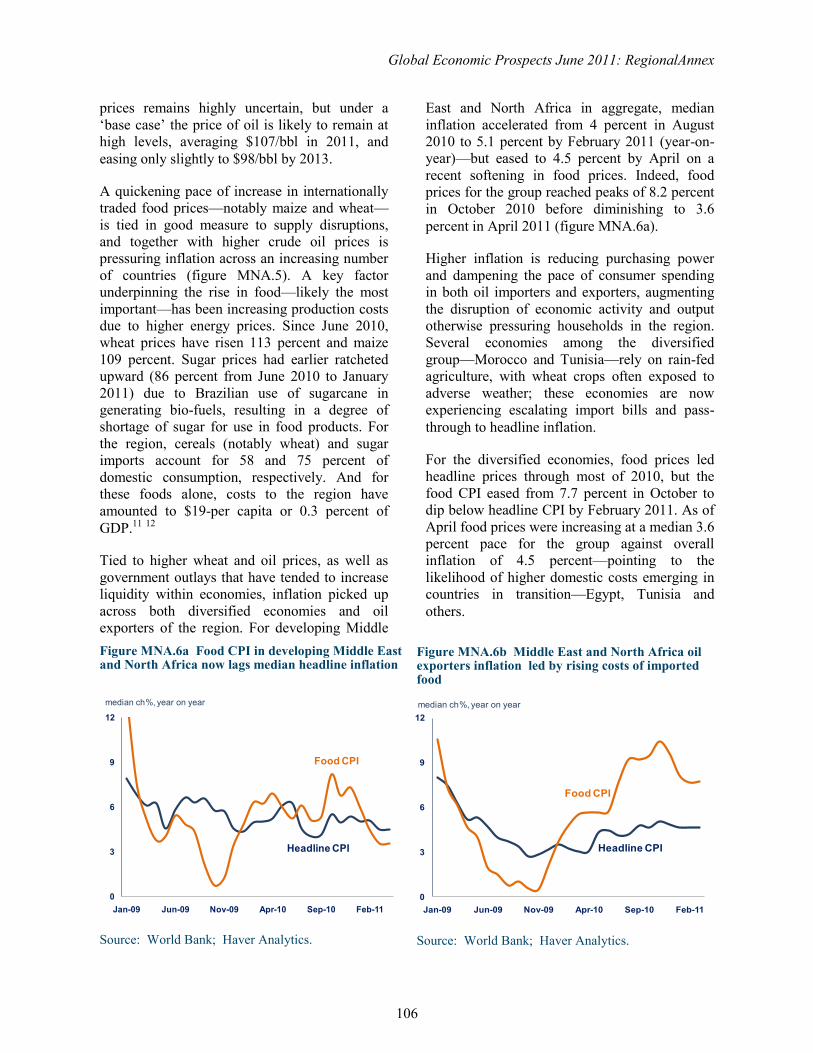
Global Economic Prospects June 2011: RegionalAnnex
prices remains highly uncertain, but under a
‗base case‘ the price of oil is likely to remain at
high levels, averaging $107/bbl in 2011, and
easing only slightly to $98/bbl by 2013.
A quickening pace of increase in internationally
traded food prices—notably maize and wheat—
is tied in good measure to supply disruptions,
and together with higher crude oil prices is
pressuring inflation across an increasing number
of countries (figure MNA.5). A key factor
underpinning the rise in food—likely the most
important—has been increasing production costs
due to higher energy prices. Since June 2010,
wheat prices have risen 113 percent and maize
109 percent. Sugar prices had earlier ratcheted
upward (86 percent from June 2010 to January
2011) due to Brazilian use of sugarcane in
generating bio-fuels, resulting in a degree of
shortage of sugar for use in food products. For
the region, cereals (notably wheat) and sugar
imports account for 58 and 75 percent of
domestic consumption, respectively. And for
these foods alone, costs to the region have
amounted to $19-per capita or 0.3 percent of
GDP.11 12
Tied to higher wheat and oil prices, as well as
government outlays that have tended to increase
liquidity within economies, inflation picked up
across both diversified economies and oil
exporters of the region. For developing Middle
East and North Africa in aggregate, median
inflation accelerated from 4 percent in August
2010 to 5.1 percent by February 2011 (year-on-
year)—but eased to 4.5 percent by April on a
recent softening in food prices. Indeed, food
prices for the group reached peaks of 8.2 percent
in October 2010 before diminishing to 3.6
percent in April 2011 (figure MNA.6a).
Higher inflation is reducing purchasing power
and dampening the pace of consumer spending
in both oil importers and exporters, augmenting
the disruption of economic activity and output
otherwise pressuring households in the region.
Several economies among the diversified
group—Morocco and Tunisia—rely on rain-fed
agriculture, with wheat crops often exposed to
adverse weather; these economies are now
experiencing escalating import bills and pass-
through to headline inflation.
For the diversified economies, food prices led
headline prices through most of 2010, but the
food CPI eased from 7.7 percent in October to
dip below headline CPI by February 2011. As of
April food prices were increasing at a median 3.6
percent pace for the group against overall
inflation of 4.5 percent—pointing to the
likelihood of higher domestic costs emerging in
countries in transition—Egypt, Tunisia and
others.
Figure MNA.6b Middle East and North Africa oil exporters inflation led by rising costs of imported food
Source: World Bank; Haver Analytics.
0
3
6
9
12
Jan-09 Jun-09 Nov-09 Apr-10 Sep-10 Feb-11
Food CPI
median ch%, year on year
Headline CPI
Figure MNA.6a Food CPI in developing Middle East and North Africa now lags median headline inflation
Source: World Bank; Haver Analytics.
0
3
6
9
12
Jan-09 Jun-09 Nov-09 Apr-10 Sep-10 Feb-11
median ch%, year on year
Headline CPI
Food CPI
106

Global Economic Prospects June 2011: RegionalAnnex
Among oil exporters, headline and food price
inflation have ramped-up much faster, given
exceptionally high import dependence for food
and feedstuffs in a number of economies (figure
MNA.6b). For oil exporters (developing as well
as GCC), food prices continue to lead overall
CPI, with the former standing 7.8 percent above
year-earlier levels in March 2011; the later up
4.7 percent. Food price increases span a wide
range from Bahrain (2.7 percent in March (y/y)),
Saudi Arabia (5 percent), Kuwait (10 percent), to
Iran (26 percent). Price developments in Iran,
especially since December 2010, are due to a
combination of international food price hikes
and a removal of domestic subsidies.
Terms of trade developments for Middle East
and North African groups are tightly linked to
international price movements and the
underlying commodity composition of goods
trade. For the diversified economies, the direct
impact of the first ―food crisis‖ of 2008 cost the
group some 2.2 points of GDP (with Jordan an
exception) as prices ratcheted much higher. But
the loss was more-than offset during the global
recession of 2009 for most countries with
softening oil and food prices. During 2010 and
2011, the terms of trade are anticipated to
deteriorate in Jordan, Lebanon, and Morocco,
with both oil and food prices rising. The
diversified economies in aggregate are likely to
face a fairly moderate decline of 0.8 percentage
points of GDP in 2010-11 (figure MNA.7a).
In contrast with the differentiation of terms of
trade displayed across the diversified group, the
aggregate of oil exporters (including GCC)
experienced cumulative gains of 16.2 percent of
GDP over 2010-11, 6.2 percent- and a large 10
favorable movement in 2011 and 2012
respectively (figure MNA7.b). The run-up in
hydrocarbons receipts as a share of oil exporter‘s
GDP in 2011 exceeds that of the last boom year
of 2008 at 42 percent versus 40 percent. Whether
the large boost to domestic incomes will result in
stronger GDP growth, will depend on the policy
of the authorities in the current environment, to
save or dispense the windfalls via subsidies or
public works projects. It will also depend on the
import propensity of the new spending. Evidence
over 2011 to date suggests that substantial
portions of these funds will be expended
domestically.
FDI and portfolio flows to the region likely to
fall sharply amid rising risk aversion.
Foreign direct investment (FDI) inflows to the
developing region, increasingly originating in
the GCC economies, had been a welcome source
of new capital, attracted not only to tourism and
related facilities but also to industry (oil and gas,
and other), services (telecoms) and real estate
(table MNA.2). Countries tending to benefit
most from FDI were Egypt, Tunisia, Morocco
and to a lesser degree, Jordan and Lebanon. At
peak dollar volumes in 2008, FDI amounted to
$29.3 billion or 3.1 percent of regional GDP.
Figure MNA.7a Several diversified economies suffer terms of trade losses in 2010-11
Source: World Bank.
-3
-2
-1
0
1
2
3
4
5
Jordan Lebanon Morocco Egypt
2009 2010 2011
change in termns of trade as a share of GDP (%)
Figure MNA.7b Oil exporters enjoy two years of windfall revenues in 2010-11
Source: World Bank.
-10
-5
0
5
10
15
2009 2010 2011
Change in terms of trade as a share of GDP (%)
107

Global Economic Prospects June 2011: RegionalAnnex
Capital flows to developing Middle East and
North Africa held up exceptionally well during
the recession of 2009 and over the course of
2010 (figure MNA.8), amounting to $26 billion
in 2009, an increase of $6 billion, and the
equivalent of 0.6 points of GDP. Other flows
stepped up to offset a $4 billion falloff in FDI
during 2010—including issuance of sovereign
bonds from among others Tunisia and Lebanon,
and an increase in official lending to the region.
Following the onset of political disturbance,
financial market risk premia increased, implying
tighter financing conditions for sovereign- and
corporate borrowers. Spreads on Egyptian
sovereign credit default swaps (CDSs) increased
by 100 to 150 basis points through February and
March 2011. Equity bourses were hard hit from
Egypt to Dubai (UAE) to Morocco, with MSCI
dollar-based indexes dropping by double digits.
Egypt‘s market capitalization plummeted 14.5
percent during the week before the exchange was
closed on January 28.
Financial projections for 2011-2013 prepared by
the World Bank suggest a sharp falloff in net
capital flows in 2011, followed—under
assumptions of a gradual equilibration of
political conditions in the region—by fairly rapid
resumption of flows to reach recent pre-turmoil
levels by 2013 (table MNA.2). In particular, FDI
is seen to almost-halve from $20-to $10.7 billion
in 2011, as GCC and other investors adopt a
‗wait and see‘ perspective to political–economy
developments. Indeed, the focus of the GCC,
less affected by political unrest and bolstered
with new revenues, may turn ―inward‖ for a time
to bolster domestic demand and infrastructure
investment. The recently announced $20-billion
Gulf Development Program for Bahrain and
Oman is an example of this emerging trend.
Net private flows in 2011 are viewed to drop by
a substantial 83 percent to $4.1 billion from $28
Table MNA.2 Capital flows to the Middle East and North Africa
Source: World Bank.
$ billions
2003 2004 2005 2006 2007 2008 2009 2010e 2011f 2012f 2013f
Current account balance 34.7 49.5 58.9 68.9 74.2 70.5 -10.8 15.4 68.1 74.2 60.2
as % of GDP 8.2 10.2 10.7 10.8 9.6 7.7 -1.1 1.4 5.6 5.7 4.3
Financial flows:
Net private and official inflows 13.5 13.0 19.4 14.4 29.4 21.1 27.8 28.0
Net private inflows (equity+private debt) 15.6 16.4 22.4 25.7 28.4 22.9 25.5 25.1 4.1 22.1 29.6
..Net private inflows (% GDP) 3.7 3.4 4.0 4.0 3.7 2.5 2.7 2.3 0.3 1.7 2.1
Net equity inflows 10.2 10.4 19.2 28.2 25.5 29.7 25.6 21.5 11.0 17.9 23.2
..Net FDI inflows 10.0 9.7 16.8 27.2 27.6 29.3 24.4 20.1 10.7 17.4 22.6
..Net portfolio equity inflows 0.2 0.7 2.4 1.0 -2.1 0.4 1.2 1.4 0.3 0.5 0.6
Net debt flows 3.4 2.6 0.2 -13.7 3.9 -8.6 2.2 6.5
..Official creditors -2.1 -3.4 -3.0 -11.2 1.1 -1.8 2.3 2.9
....World Bank -0.3 -0.6 0.0 -0.8 1.0 -0.3 0.9 1.8
....IMF -0.6 -0.5 -0.7 -0.2 -0.1 -0.1 -0.1 -0.1
....Other official -1.2 -2.3 -2.3 -10.3 0.2 -1.4 1.4 1.2
..Private creditors 5.4 5.9 3.2 -2.5 2.8 -6.8 -0.1 3.6 -6.9 4.2 6.4
....Net M-L term debt flows 0.9 2.7 2.9 -1.7 -0.7 -2.7 -1.7 5.0
......Bonds 0.7 2.8 2.5 0.8 0.7 -0.8 0.5 2.3
......Banks -0.2 0.0 1.3 -1.3 -0.2 -0.5 -1.2 2.7
......Other private 0.4 0.0 -0.9 -1.2 -1.2 -1.3 -0.9 0.0
....Net short-term debt flows 4.6 3.2 0.3 -0.8 3.5 -4.2 1.6 -1.4
Balancing item /a -25.1 -47.8 -39.3 -45.5 -55.6 -48.2 7.3 -32.0
Change in reserves (- = increase) -23.2 -14.7 -38.9 -37.8 -48.0 -43.4 -24.2 -11.3
Memorandum items
Workers' remittances 20.5 23.2 25.1 26.5 32.1 36.0 33.6 35.6 36.9 38.9Note :
e = estimate, f = forecast
/a Combination of errors and omissions and transfers to and capital outflows from developing countries.
108

Global Economic Prospects June 2011: RegionalAnnex
billion in 2010—a falloff equivalent to 2.1
percent of regional GDP. Thereafter, a revival of
FDI is hoped to lead private flows back into a
range near $20 billion, with new opportunities
for investment emerging in the region. Clearly
risks to this projection are numerous, and in
particular, a more extended period of time may
be required before international and local risk
aversion regarding the region is diminished.
Economic developments and policy among the
diversified economies. 13
A stronger start to 2010, and a sufficiently
diverse set of outturns across countries, meant
that GDP growth for the diversified group
faltered by just 0.3 points from 2009 outturns to
4.5 percent in 2010—still notable as a 0.4
percentage point mark-down from earlier
expectations.
Until recent political events, the Egyptian
economy showed strong signs of recovery
from the global recession, during which
Egypt‘s GDP advanced 4.7 percent against an
increase of 1.9 percent for all developing
countries. Consumer spending and increasing
activity in construction, tourism and
communications were driving forces for
growth, which moved up to 5.2 percent in
2010. Egypt is facing a more prolonged period
of political uncertainty with signs emerging
during early 2011 of disruptions to production,
widening trade deficits, falling tourism and
weaker worker remittances; FDI flows are
likely to decline substantially. Unemployment
reached 11.9 percent during the first quarter of
2011, and may increase further as a result of
disruptions to activity, but also as some
183,000 overseas workers have returned– and
are continuing to return from Libya.14 Against
this background, GDP growth is anticipated to
drop sharply to 1 percent in 2011. Recent
reports regarding financial support from
international organizations and bilateral donors
is encouraging.
The Tunisian revolution, removal of former
President Ben Ali and dissolution of the ruling
party and Parliament have been significant
developments. GDP is anticipated to be hard
hit by declines in production and in services
activity (tourism), such that growth of 1.5
percent is a likely outturn for 2011. The
interim government has undertaken short-term
measures to support business and the labor
market; and a with $1 billion multi-donor
package the financial situation should remain
manageable.
In Jordan, political tensions are occurring
while economic recovery remains weak. GDP
growth of 3.1 percent characterized 2010,
based on weak consumption and a drop in
public investment. In February, Moody‘s and
S&P both downgraded Jordan‘s debt outlook
rating, raising the cost of capital for the
Kingdom. To address social concerns the King
launched initiatives related to corruption and
improving governance and the government
increased social spending and subsidies on the
order of 2.1 percent of GDP. In Lebanon, the
government of National Unity formed in
November 2010, collapsed on January 12,
2011 blocking further policymaking. Still the
economy grew by a rapid 7 percent in 2010 on
the back of domestic demand fueled by foreign
financial inflows. A key risk is that traditional
Lebanese political rifts could re-emerge amid
the regional unrest of 2011.
And in Morocco, the King announced
potentially significant constitutional and
political reforms in response to a series of
popular protests in more-than 52 cities during
late February 2011. The announced proposals
Figure MNA.8 FDI viewed to halve from $20- to
$10 billion in 2011
Source: World Bank.
0.0
0.5
1.0
1.5
2.0
2.5
3.0
3.5
-25
-15
-5
5
15
25
35
2008 2009 2010 2011 fcst
Portfolio flows
FDI
Official creditors
Medium-term debt
Short-term Debt
Share of GDP %
net capital f lows to developing MENA regionbillions USD [L] and %GDP [R]billions USD % of GDP
109

Global Economic Prospects June 2011: RegionalAnnex
appear to be short of the youth movement‘s
demands, but are supported by political parties.
The economic outlook remains generally
favorable with a sustainable macro- and
financial framework. GDP growth could pick
up in 2011 based on gains in domestic
demand, in part funded by increased subsidies
for food and fuel.
Oil exporter’s windfall eclipses 2007-08.
Middle East and North African developing and
GCC oil exporters15 appear set to eclipse the
hydrocarbon revenue windfalls of 2007-08
during the course of 2011 (figure MNA.9). The
cumulative increase in oil export receipts over
2010-11 amounts to $370 billion or 37 percent of
oil exporter-GDP, with total revenues expected
to peak at $845 billion in 2011. Several large
exporters (including Saudi Arabia) have begun
to advance production modestly to offset the loss
of Libyan crude, and combined with the 36
percent gain in crude oil price for the year,
resulting export receipts are anticipated to
increase within a range of $85 billion for Saudi
Arabia to $10 billion in Oman. The aggregate
result contrasts with top receipts of $735 billion
during 2008, with the buildup in revenues having
accrued to $245 billion over 2007-08.
Within the region, such massive revenue gains
for oil exporters offer authorities the means to
increase spending of various forms to mitigate
the potential for protest and social unrest. Saudi
Arabia for example, pledged to provide
unemployed Saudi nationals with financial
support for a year, helping its young population
cope with structurally high unemployment. The
Saudi Government issued a number of such
orders with a total cost of SR135 billion ($36
billion) for the first year; possibly accumulating
to $100 billion over 10 years.
Developing oil exporters face economic as well
as social challenges against a broadly
favorable international background
The group of developing oil exporters in the
region, Algeria, Iran, Syria, and Yemen, form a
group of economies troubled by political protest
and/or forms of repression on the part of
authorities over a range of intensity (from most
severe in Yemen and Syria, to latent popular
dissatisfaction in Iran, and to a lesser degree in
Algeria). Growth for the aggregate of oil
exporters dipped from 2.2 percent in 2009 to 1.4
percent in 2010. Gains across the group ranged
from 1 percent in Iran to 3.3 percent in Algeria,
with Yemen an exception, as the coming online
of an LNG train boosted growth to 8 percent in
the year. OPEC members GDP gains were
dampened by constraints in hydrocarbons output
in support of price targets, but were supported by
stronger growth in non-oil GDP. All oil
exporters benefited from the 28 percent gain in
oil prices in 2010 (to $79/bbl from $62/bbl in
2009).16
Although protests in Algeria have not
coalesced into revolutionary style movements
as in some neighboring countries, Algeria‘s
anticipated $72 billion in crude oil and natural
gas exports in 2011 remains somewhat
vulnerable to political unrest which could
disrupt shipments. GDP gains in 2010 were
grounded in moderate advances for the oil
sector and non-oil growth of some 5.3
percent—reflecting strong multiplier effects
associated with public infrastructure programs.
Authorities have mitigated the chances of
unrest by increasing food subsidies and
microcredit loans; adding public sector jobs
and promising more sustainable employment
in other sectors of the economy. Though
Figure MNA.9 Middle East and North Africa oil
revenues build by $370 billion over 2010-11
Source: World Bank-COMTRADE and Interna-tional Energy Agency.
0
100
200
300
400
500
600
700
800
900
2005 2006 2007 2008 2009 2010 2011 2012 2013
Saudi Arabia UAE Iran Qatar
Kuwait Algeria Oman Bahrain
Yemen Syria
billions U.S. dollars
110

Global Economic Prospects June 2011: RegionalAnnex
spending has added a degree of stress to the
fiscal position, new oil revenues should more-
than compensate in the near term. With OPEC
likely to expand output over the next years,
Algeria should be well placed to participate
more fully in energy markets, while keeping
domestic demand buoyant.
The recent upturn in unrest in the Middle East
appears to have briefly reinvigorated Iran’s
‘Green Movement‘, however there was no
substantial effects on the economy as protests
were quickly suppressed. Despite
improvements in global oil markets, Iran‘s
growth has weakened over the last two years
as a result of a major tightening of monetary
policy in mid-2008 that led to a slowdown in
growth in 2009; a large-scale subsidy reform
program that went into effect in December
2010, and the effects of the 4th round of
international sanctions against the country
taking hold. GDP growth registered a meager
0.1 percent during 2009, and remained weak at
a 1 percent gain in 2010. The approved 2011
budget contains a major fiscal stimulus
package that pushes budgetary spending up
sharply (46 percent), to counter subsidy
reforms and sanctions, putting additional
pressures on already accelerating inflation.
Syria (more recently) and Yemen have joined
Libya closer to the fulcrum of popular protest
and severe, violent repression by authorities in
the region. Economic developments will likely
move into second-tier consideration until some
form of resolution is found to the violence and
civil-war like conditions in Yemen and
repression by Syrian authorities. Neither
country is a major exporter of crude oil (Syria
about $4 billion) and Yemen just commencing
gas production and exports amounting to $8
billion in 2010.
Medium-term outlook
Political economy developments within the
region appear likely to result in less disruption to
economic activity in those oil-exporting
economies least exposed to unrest and more
aggressive popular calls for reforms. At the same
time, the international environment has come to
favor Middle East and North African oil
exporters with terms of trade moving largely
against regional oil importers, but intensified for
all countries by the surge in international grains
prices.
As highlighted in figure MNA.10, the net result
of regional and international developments is a
strong compression of GDP growth for the
aggregate of developing countries in the region,
moving down by 1.2 percentage points between
2010 and 2011 to 1.9 percent. The step-down in
growth for oil exporters (0.6 points in the year)
to 1.4 percent, compounds the sharper downturn
for diversified economies (2 points), dominated
by markdowns from pre-‗social revolution‘
projections for several countries (figure MNA.1
earlier). The diversified economies in aggregate
are expected to fall from growth of 4.5 percent in
2010 to 2.5 percent in 2011.
Differences in current account balances between
the groups for 2011 are presented in table
MNA.3—with oil exporter surpluses rising from
5.4-to 12.6 percent of GDP from 2010 to 2011,
vis-à-vis increased deficits of some 0.8 points for
the diversified economies to 4.8 percent of GDP.
On fiscal accounts, deficits increase to more-than
7 percent of GDP in 2011 for the diversified
exporters given the drain on government
revenues associated with declining tourism and
potentially increased subsides to cover higher
food and fuel costs; for developing oil exporters,
fiscal deficits narrow by 1.7 points to 0.5 percent
of GDP.
Political economy transitions will be crucial for
the economic outlook. Under the assumption that
some form of ―normalization‖ takes place across
countries—a revival in domestic demand
becomes feasible, as does the ability of
economies to participate in a rebound in
international activity, through goods trade,
tourism and investment flows. On these grounds
views for GDP growth over 2012-13 are
moderately optimistic for the developing region-
-though still below pre-‗Arab Spring‘
expectations—at 3.5 and 4 percent respectively.
Regional growth in this phase is likely to be
111

Global Economic Prospects June 2011: RegionalAnnex
driven by the diversified economies, 4 and 5
percent gains over the period respectively, led by
5 percent advances in Egypt by 2013, and by
improvements in performance for Morocco,
Jordan, Lebanon and Tunisia to similar rates of
growth. Domestic demand contributes fully 7.8
points of growth in these years, with net exports
influenced by a catch-up in import demand,
dampening GDP gains by about 3.3 percentage
points. Developing oil exporters experience a
more modest growth pickup to 3.2 percent in
2012-13 powered by public spending programs
in both Algeria and Iran. As the current run-up in
oil prices turns to a modest gradual decline over
the period current account surplus for the group
eases from 12.6 percent of GDP in 2010 to 9.7
percent by 2013, in part due to strong import
growth tied to large infrastructure and social
development programs.
Figure MNA.10 Growth returns to 4 percent by
2013 under favorable assumptions
Source: World Bank.
0
1
2
3
4
5
Diversified Exporters Developing Oil Exporters
Developing MENA
2010 2011 2012 2013
percent change
Table MNA.3 Middle East and North Africa country forecasts
Source: World Bank.
Est.
98-07a2008 2009 2010 2011 2012 2013
Algeria
GDP at market prices (2005 US$) b 3.5 2.4 2.4 3.3 3.7 3.6 3.5
Current account bal/GDP (%) 28.9 20.0 0.3 9.4 17.8 17.4 12.0
Egypt, Arab Rep.
GDP at market prices (2005 US$) b 4.3 7.2 4.7 5.2 1.0 3.5 5.0
Current account bal/GDP (%) 0.9 -0.9 -2.3 -2.0 -2.9 -2.4 -2.0
Iran, Islamic Rep.
GDP at market prices (2005 US$) b 4.9 1.0 0.1 1.0 0.0 3.0 3.0
Current account bal/GDP (%) 10.3 15.7 4.2 6.0 14.5 14.0 12.0
Jordan
GDP at market prices (2005 US$) b 5.6 7.6 2.3 3.1 3.5 4.0 5.0
Current account bal/GDP (%) -2.3 -9.6 -5.1 -4.3 -8.0 -6.8 -6.0
Lebanon
GDP at market prices (2005 US$) b 2.8 9.3 8.5 7.0 4.8 5.0 6.0
Current account bal/GDP (%) -17.5 -13.7 -21.5 -15.4 -15.6 -15.6 -15.0
Morocco
GDP at market prices (2005 US$) b 3.7 5.6 4.9 3.3 4.4 4.5 5.0
Current account bal/GDP (%) 1.4 -5.2 -5.0 -4.2 -4.0 -3.5 -3.0
Syrian Arab Republic
GDP at market prices (2005 US$) b 2.9 4.5 6.0 3.2 1.7 3.0 3.0
Current account bal/GDP (%) 3.0 0.3 -5.7 -4.4 -5.3 -4.8 -4.5
Tunisia
GDP at market prices (2005 US$) b 4.5 4.5 3.1 3.7 1.5 3.5 4.5
Current account bal/GDP (%) -2.8 -3.8 -2.9 -4.8 -6.2 -4.0 -3.8
Yemen, Rep.
GDP at market prices (2005 US$) b 3.5 3.6 3.9 8.0 3.0 4.0 4.0
Current account bal/GDP (%) 2.5 -4.6 -10.7 -4.4 -4.0 -4.0 -3.4
(annual percent change unless indicated otherwise)
World Bank forecasts are frequently updated based on new information and changing (global)
circumstances. Consequently, projections presented here may differ from those contained in
other Bank documents, even if basic assessments of countries’ prospects do not significantly
differ at any given moment in time.
Djibouti, Iraq, Libya, West Bank and Gaza are not forecast owing to data limitations.
a. Growth rates over intervals are compound average; growth contributions, ratios and the
GDP deflator are averages.
b. GDP measured in constant 2005 U.S. dollars.
c. Estimate.
d. Forecast.
Forecast
112

Global Economic Prospects June 2011: RegionalAnnex
Risks
Among the numerous challenges facing the
region at this critical time, are wide variations in
the set of possible political-economy outturns
that could result from the series of reform
movements and differing responses of
authorities over 2011, from lower growth
scenarios associated with limited or unsuccessful
reform, to higher growth scenarios linked to
deeper and swift changes. The outturns of such
developments in the Middle East and North
Africa would carry effects well beyond the
geographic boundaries of the area, as the oil
market (for one) would act as a powerful channel
for transmission to the global economy.
The ongoing fiscal crisis in the Euro Area
presents an external risk for the region, which if
continued or intensified would imply a longer
period of sub-par exports and growth for the
Maghreb economies. Moreover, if risk
perceptions regarding the broader Middle East
and North Africa region have ―hardened‖ due to
safety and other concerns, a risk that the flow of
tourist arrivals from Western Europe might be
lost for an extended period of time is one of
concern.
And should oil prices remain at higher levels for
a longer period of time, emergence of newer
energy sources (affordable at prices over $100/
bbl oil equivalent), such as solar/ocean,
Canadian tar sands, U.S. shale gas and
improvements to enhanced recovery techniques
could yield faster-than earlier anticipated
competitive pressures for hydrocarbon exports in
the medium to longer terms.
Notes:
1. Global Economic Prospects: ―Navigating
Strong Currents‖. The World Bank. January
2011. Internet. And ―Sustaining the
Recovery and Looking Beyond‖, A Regional
Economic Outlook. Middle East and North
Africa Region. The World Bank, January
2011.
2. The low-and middle income countries of the
region included in this report are Algeria,
The Arab Republic of Egypt, The Islamic
Republic of Iran, Jordan, Lebanon, Morocco,
the Syrian Arab Republic, Tunisia and
Yemen. Data is insufficient for the inclusion
of Djibouti, Iraq, Libya and the West Bank
and Gaza. The high-income economies
included here are Bahrain, Kuwait, Oman
and Saudi Arabia. Data is insufficient for the
inclusion of Qatar and the United Arab
Emirates. The group of developing oil
exporters includes Algeria, the Islamic
Republic of Iran, the Syrian Arab Republic
and Yemen. The diversified economies of
the region (oil importers) may be usefully
segmented into two groups: those with
strong links to the GCC (Jordan and
Lebanon), and those with strong EU links
(The Arab Republic of Egypt, Morocco and
Tunisia).
3. See ―Middle East and North Africa
Economic Recovery Weakened in the Midst
of Arab Uprisings‖, A Regional Economic
Update. Middle East and North Africa
Region. The World Bank. April 2011.
4. See Arab World Brief: Shamshad Akhtar.
Vice President, World Bank, Middle East
and North Africa region. February 2011.
5. The types of growth rates discussed in this
section and throughout the report, and
appearing in accompanying figures—range
from simple year-over-year (y/y) percentage
change: gy/y=((Xt/Xt-12))-1)*100; a ‗smoothed‘
yr/yr rate, which helps to even out volatility
to highlight underlying trends: sgr=(((average
(Xt-2:Xt)/(average (Xt-14:Xt-12))-1)*100, and a
seasonally adjusted annualized rate (saar)
which annualizes (i.e. multiplies– or raises to
the power-4) the relationship between
consecutive 3-month averages to obtain a
clearer picture of most recent trend
developments. saar=(((average(Xt-2:Xt)/(average
(Xt-5:Xt-3))**4)-1)*100.
6. See ‗World Tourism Impact Data‘. World
Travel & Tourism Council (WTTC).
London. 2011. www.wttc.org for definitions
of ‗direct-, indirect, and induced‘ impacts of
113

Global Economic Prospects June 2011: RegionalAnnex
tourism on the national economy. And
‘UNWTO World Tourism Barometer‘.
United Nations‘ World Tourism
Organization. Madrid. April 2011.
7. World Bank preliminary projections. Middle
East and North Africa Poverty Reduction
and Economic Management Unit. May 2011.
8. Worker remittances as presented in this
report are sourced from the World Bank‘s
Migration and Remittances Unit (DEC/
PREM). The definition of ‗remittances‘
compiled by the Unit differs from that of the
IMF‘s Balance of Payments (BOP)
construct: in particular, to the BOP transfer
item ‗worker remittances‘ is added BOP
factor income items ‗compensation of
employees‘ and ‗migrant transfers‘ (on both
the credit and debit sides). Data is reported
as gross receipts (credit) or payments (debit)
presented in calendar-year U.S. dollars.
9. See ‗Migration and Remittances Factbook
2011‘. World Bank. Migration and
Remittances Unit. November 2010.
10. The World Bank average price of crude oil is
a simple average of Brent, Dubai, and WTI
benchmarks.
11. Middle East and North Africa ‗Knowledge
and Learning Note‘. Number 38. World
Bank. Middle East and North Africa
Department. March 2011.
12. It should be noted that the high price of
sugar on international markets served to shift
Brazilian producers of sugar cane from
directing output toward ethanol production,
to the refined sugar market. Indeed, Brazil is
now importing ethanol from the United
States as an additive to local fuels.
13. ‗Economic Monitoring Notes‘. World Bank.
Middle East and North Africa Department.
Spring 2011.
14. As of March 14, 2011.
15. The group is comprised of all GCC members
(including Qatar and UAE), Algeria, Iran,
Syria and Yemen. Data for Iraq and Libya is
not available at this time.
16. Expressed as World Bank average price.
114

Global Economic Prospects June 2011: RegionalAnnex
Recent developments
After growing a robust 9.3 percent during
calendar year 2010, activity in South Asia
moderated in the first quarter of 2011—pointing
to a projected slowdown in aggregate regional
growth to a still buoyant 7.5 percent in 2011.
This slowdown partly reflects macroeconomic
policy tightening aimed at curbing stubbornly
high price pressures and reducing large fiscal
deficits. Tighter financing conditions have
contributed to a moderation in private
investment growth, while private consumption
growth has been hit by high and rising food and
fuel inflation. The moderate compression of
domestic demand has been partly offset by
strong exports, as countries in South Asia have
benefited from robust import demand in
developing countries, recovering demand in high
-income countries and resilient worker
remittances inflows (table SAR.1).
The regional economic slowdown in 2011
mainly reflects a fall-off in activity in India,
which represents about 80 percent of South
Asia‟s GDP, where growth is projected to ease
to 8 percent in FY2011/2012 from 8.8 percent in
FY 2010/11 (box SAR.1). The slowdown stems
from a moderation in domestic demand, as
elevated inflationary pressures have cut into
disposable incomes and household spending¸
and as more restrictive monetary conditions have
contributed to a dampening of investment
activity. In particular, investment growth
decelerated sharply in Q1-2011 to 0.4 percent
from 7.8 percent in Q4-2010 and 14.1 percent
South Asia
Table SAR.1 South Asia summary forecasts
Source: World Bank.
Est.
98-07a2008 2009 2010 2011 2012 2013
GDP at market prices (2005 US$) b,f 6.0 5.9 6.2 9.3 7.5 7.7 7.9
GDP per capita (units in US$) 4.4 4.5 4.8 7.9 6.1 6.4 6.6
PPP GDP d 6.0 5.8 6.3 9.0 9.5 7.7 7.7
Private consumption 4.9 6.8 6.4 7.0 5.9 5.6 5.9
Public consumption 3.9 16.9 13.6 2.8 6.7 5.4 4.8
Fixed investment 9.5 5.6 3.9 14.3 9.4 12.6 13.1
Exports, GNFS e 14.1 13.7 -6.3 12.7 11.3 11.7 12.4
Imports, GNFS e 9.3 24.8 -6.5 3.2 8.8 10.5 11.6
Net exports, contribution to growth -0.2 -3.7 0.6 1.7 0.1 -0.2 -0.4
Current account bal/GDP (%) -0.4 -3.3 -1.7 -2.4 -2.8 -2.6 -2.4
GDP deflator (median, LCU) 5.7 8.4 7.5 9.8 8.8 8.6 7.0
Fiscal balance/GDP (%) -7.1 -7.3 -8.9 -8.3 -7.4 -6.9 -6.6
Memo items: GDP at market prices f
South Asia excluding India 4.5 4.8 3.9 5.0 4.7 4.7 5.2
India 6.4 4.9 9.1 8.8 8.0 8.4 8.5
at factor cost - 6.8 8.0 8.5 8.2 8.5 8.6
Pakistan 5.0 1.6 3.6 4.1 2.5 3.9 4.3
Bangladesh 5.1 6.2 5.7 5.8 6.2 6.4 6.6
(annual percent change unless indicated otherwise)
a. Growth rates over intervals are compound average; growth contributions, ratios and the GDP
deflator are averages.
b. GDP measured in constant 2005 U.S. dollars.
c. GDP figures are presented in calendar years (CY) based on quarterly history for India. For
Bangladesh, Nepal and Pakistan, CY data is calculated taking the average growth over the two
fiscal year periods to provide an approximation of CY activity.
d. GDP measured at PPP exchange rates.
e. Exports and imports of goods and non-factor services (GNFS).
f. National income and product account data refer to fiscal years (FY) for the South Asian
countries, while aggregates are presented in calendar year (CY) terms. The fiscal year runs
from July 1 through June 30 in Bangladesh and Pakistan, from July 16 through July 15 in
Nepal, and April 1 through March 31 in India. Due to reporting practices, Bangladesh, Nepal,
and Pakistan report FY2009/10 data in CY2010, while India reports FY2009/10 in CY2009.
Forecast
115

Global Economic Prospects June 2011: RegionalAnnex
for 2010 overall (year-on-year). At the sectoral
level, a recent good harvest buoyed agricultural
production, following poor crops on low rainfall
with the 2009 monsoon. In contrast, industrial
output growth was weak in early-2011.
Economic growth in Pakistan—the region‟s
second largest economy (representing about 15
percent of regional GDP)—significantly lags
much of South Asia, and is projected to slow to
2.5 percent in FY2010/11 (ending June-2011)
from 4.1 percent in FY2009/10, reflecting the
devastating flooding across much of the country
in July and August 2010. The easing of GDP
growth is also tied to worsening security
conditions, heightened political uncertainty,
stalled policy implementation, and extensive
infrastructure bottlenecks. While whole year
growth numbers are expected to be weak,
activity has begun to firm recently, as the effects
of the 2010-flooding (which affected an
estimated one-fourth of agricultural productive
capacity) wear off, supported by a surge in
exports in early-2011, and an upswing in worker
remittances inflows.
Real GDP growth in Sri Lanka remains buoyant,
but has decelerated in early-2011, due to floods
Box SAR.1 GDP reporting practices—market price versus factor cost and calendar year versus fiscal year
There are a number of measures of economic output—including gross domestic happiness as reported in Bhutan.
Most governments report headline GDP at market prices in calendar-year terms. In South Asia, many govern-
ments report data on a fiscal-year basis using factor costs to weight output rather than market prices. The Indian
government reports data in two different ways: factor cost and market prices, both in fiscal-year terms—although
it places greater emphasis on the factor-cost measure. Importantly, although these measures are consistent, they
can yield large differences.
The differences arise because the weights attached to sectoral growth rates differ, depending on which measure
you use. The factor-price measure weights output using prices that are net of indirect taxes less subsidies in a base
year, while the market-price measure uses weights that are based on the actual market prices observed in a base
year. If the underlying growth rates of sectors with relatively high net tax-rates are different from those of sectors
with relatively low net tax-rates in the base year, then there will be a systematic and persistent difference between
real GDP growth measured at factor cost and GDP measured at market prices. Indeed such persistent differences
between real GDP growth at market prices and at factor cost are observable across most countries that publish
both data, including Brazil, Australia and Germany, for example. In India, this difference is historically about 0.3
percentage points over the past twenty years, and by even more in recent years.
There are a number of reasons why countries choose to report different headline measures. Only a small subset of
countries (Egypt, Indonesia, Iran, and much of South Asia), report headline GDP at factor cost, in part reflecting
that agricultural sectors remain important drivers—albeit typically declining—to their growth outturns. Similarly,
countries often report data in fiscal years (instead of calendar years), as this often reflects the given country‟s crop
year.
For the purposes of this report, GDP growth is provided at the country level at market prices in both calendar-year
terms and fiscal-year terms for South Asia, while all regional aggregates are provided at market prices in calendar
-year terms. The use of GDP at market prices in calendar-year terms enables ready comparison and aggregation
across countries. This is because the vast majority of governments outside of South Asia report headline GDP at
market prices—as it tends to be easier to monitor (and more reliable) given tax receipts, for example. Addition-
ally, fiscal years can vary significantly across countries. For example, India‟s fiscal year runs from April 1
through March 31 and Nepal‟s fiscal year runs from July 16 through July 15.
India's real GDP growth at market prices and factor cost, in calendar year- and fiscal year-terms
2003 2004 2005 2006 2007 2008 2009 2010
Market Price 6.9 7.9 9.2 9.4 10.1 6.2 6.8 10.3
Factor Cost 7.4 7.2 9.2 9.6 9.7 6.1 8.5 9.0
2003-04FY 2004-05FY 2005-06FY 2006-07FY 2007-08FY 2008-09FY 2009-10FY 2010-11FY
Market Price 8.4 8.3 9.3 9.3 9.8 4.9 9.1 8.8
Factor Cost 8.5 7.5 9.5 9.6 9.3 6.8 8.0 8.5
Sources: Central Statistics Office, India and The World Bank.
Note: For years 2006 and 2005-06FY onward, the base year is 2004-05FY. For prior years, the base year is 1999-2000FY.
116

Global Economic Prospects June 2011: RegionalAnnex
that damaged a significant share of this year‟s
early crop. GDP growth in 2010 (calendar year)
registered 8 percent and has been strongly
underpinned by the peace dividend following the
end of the decades-old civil war. The recovery
was led by private consumption and investment.
Agricultural output growth was boosted by the
return to production of previously fallowed land
with the cessation of fighting, while services
activity benefitted from an upsurge in tourism.
Activity in the first few months of 2011 has
slowed due to waning of these rebound effects
from the end-of-conflict and more normal
growth rates in agriculture (aside from the
negative impact of floods).
Afghanistan‟s GDP (on a fiscal year basis) is
expected to have grown 8.2 percent in
FY2010/11 (ending June-2011), down from an
unsustainable 20.1 percent increase in
FY2009/10 that was driven by a record harvest
(following a long period of drought) and an
upswing in donor grants. Output this year
continues to be bolstered by reconstruction and
strong aid inflows, which are reflected in a
robust expansion of services (including
transport) and vibrant construction activity.
Nepal also experienced a moderation in activity
in early-2011. Ongoing political uncertainty
attached to the post-conflict transition to a new
government has extended into its fourth year,
with law and order problems, continued
extensive infrastructure bottlenecks (particularly
widespread load-shedding and unreliable power
delivery) projected to limit real GDP growth to
3.5 percent in FY2010/2011 (ending mid-July-
2011), down from 4.6 percent in FY2009/10.
GDP growth has been picking up in Bangladesh,
where private consumption spending has been
supported by higher private sector credit growth
and public- and private-sector wage increases.
However, the strong boost to consumer incomes
from worker remittances in 2009 (up 17.1
percent in dollar terms that year) has given way
to a much more modest 2.7 percent gain in 2010,
reflecting falling net outmigration since 2009
and fewer remitters following last year‟s return
of workers from several gulf states. At the
sectoral level, rising agricultural output reflects
good harvests, and strengthened industrial
production has been buoyed by a revival in
garment exports. However, Bangladesh‟s output
continues to be constrained by widespread power
supply outages, which are expected to limit GDP
gains to 6.2 percent FY2010/11 (ending June-
2011) from 5.8 percent in FY2009/10.
Among the remaining economies in South Asia,
Bhutan‟s real GDP is firming, underpinned by
construction of additional hydropower projects,
and to a lesser extent by a revival in tourism. In
FY2010/2011 GDP growth is projected to rise to
8.3 percent, up from 6.9 percent in 2009/10,
(ending June-2010). The recovery in the
Maldives appears to have firmed slightly in early
-2011 with strong tourism arrivals. In 2011,
GDP growth is projected to accelerate to 5
percent (calendar year) following 4.8 percent in
2010. Tourism is expected to remain the key
driver for growth, supported by a 17.4 percent
expansion of capacity (number of beds) at end-
2010 and robust growth in arrivals stemming
from diversification to faster-growing new
markets. In particular, China surpassed the
United Kingdom in 2010 as the largest source of
tourists to the Maldives.
Inflationary pressures are elevated across South
Asia reflecting various factors, including higher
international food and fuel prices, tight capacity
utilization, and past macroeconomic loosening,
which have led to elevated inflation expectations
and higher core prices (figure SAR.1). High
international fuel and food prices are key factors
in South Asia because of its heavy reliance on
imports of oil and some staples, such as edible
oils. Additionally, food represents a large share
(about 40 percent) of the regional household
consumption basket, a key concern from a
poverty perspective.
In particular, international wheat and edible oils
prices have surged, while rice prices have
remained more stable. Afghanistan, the Maldives
and Sri Lanka—where at least one-third of
domestic consumption of grains (including rice,
wheat, pulses) and edible oils is imported—are
most exposed to an imported pass-through of
117

Global Economic Prospects June 2011: RegionalAnnex
higher international commodity prices (figure
SAR.2). Indeed, reliance on imported edible oils
is high across the region, where at least two-
thirds of consumption is imported (in
Afghanistan, Bangladesh, India, Pakistan, and
Sri Lanka, for which data is available). Some
countries are self-reliant in key staples, such as
Bangladesh, India and Nepal, where rice-imports
represent a very small share of consumption (2
percent or less). Notably, the short-run pass-
through (monthly) of international grain prices is
generally low in South Asia, partly reflecting
administered prices. For example, in India,
wheat prices have remained well-below
international prices, compared to near complete
pass-through in Bangladesh.
The strength of the recovery in South Asia partly
explains the persistence of inflation in the
region, as little spare capacity remains. Although
estimates of potential output can vary depending
on methodology and assumptions—especially
for countries with ongoing conflict, such as
Pakistan, or coming out of conflict, such as Sri
Lanka—measures across sources for many of the
region‟s economies (Afghanistan, Bangladesh,
India, Sri Lanka) suggest output gaps narrowed
(or closed) in 2010, which has likely contributed
to price pressures. In addition, a series of local
one-off factors have contributed to price
pressures including: the economic disruptions
from flooding in Pakistan (during the second
half of 2010) and Sri Lanka (early-2011); the
partial liberalization of petroleum prices in India
(mid-2010); and the raising of administered
petrol prices elsewhere in the region (including
Bhutan, the Maldives, and Pakistan). A recent
devaluation of the Maldives‟ currency, following
the introduction of an exchange rate band around
the Rufiyaa/US-dollar peg (R12.85/$1) of plus
or minus 20 percent, has also contributed to a
resurgence of inflation in that country.
To rein-in domestic demand and inflationary
pressures, monetary authorities have initiated
policy rate hikes in Bangladesh, India, and
Pakistan, with the Reserve Bank of India having
started raising rates in March 2010. Despite
these measures, real policy interest rates are
negative—or remain looser than they were prior
to the crisis (figure SAR.3). Unfortunately,
bringing inflation back down will be
complicated by the trend rise in inflation over
the past decade, which has contributed to an
increase in inflationary expectations in recent
years. Household surveys in India, for example,
indicate that consumers‟ inflation expectations
have increased over the last four years (from 5.8
percent in Q4-2006 to 13.1 percent in Q4-2010
for year-ahead inflation), and have recently
jumped by 1.2 percentage points in the second
half of 2010 (figure SAR.4).1
Despite the steps taken earlier to reduce fuel
subsidies, the pass-through of higher
international energy prices is incomplete,
Figure SAR.2 Imports of rice, wheat and edible oils as a
share of domestic consumption
Source: U.S. Department of Agriculture and World Bank.
0
20
40
60
80
100
120
140
Nepal India Pakistan Afghanistan Bangladesh Sri Lanka*
%-shares, 2008/9-2010/11period averages, zeros indicate no data available, ranked by wheat
Rice Wheat Edible oils
Sources: World Oil, U.S. Department of Agriculture and The World Bank*Sri Lanka's wheat imports as a share of consumption is above 100% due to re-exports
Figure SAR.1 South Asia’s inflationary pressures
sharply exceed other developing countries in post-
crisis years
Sources: Thomson Reuters and World Bank.
2
4
6
8
10
12
2000 2001 2002 2003 2004 2005 2006 2007 2008 2009 2010
median annual percent change, CPI
Developing Countries
South Asia
118

Global Economic Prospects June 2011: RegionalAnnex
increasing subsidization costs and contributing
to fiscal deficits (figure SAR.5). The region‟s
large general government budget deficits are also
complicating efforts to restrict domestic demand
and reduce inflation. South Asia‟s aggregate
fiscal deficit continues to outstrip those of other
developing regions. And, despite progress
toward fiscal consolidation in some countries
(India, Maldives and Sri Lanka) in 2010, general
government deficits remain very high, at 8.8
percent of GDP in India for FY2010/11, 20.7
percent in the Maldives for CY2010, and 7.9
percent in Sri Lanka for CY2010. Large outlays
for interest payments are slowing progress
toward fiscal consolidation, and—while
improving in some countries (Afghanistan,
Maldives, and Sri Lanka, for example)—the
region‟s low tax base makes consolidation
particularly challenging.
Elsewhere in the region, fiscal balances have
deteriorated. In Pakistan—after rising to 6.3
percent of GDP in FY2009/10—the deficit
continued to expand in the first half of
FY2010/11 tied to flood-related outlays, high
power-sector subsidies and increased defense
spending. In Bhutan, the fiscal deficit rose to an
estimated 4.4 percent of GDP in FY2010/11, as
the government continues to plow money into
development and infrastructure projects
(including roads, financial services and
information technology) that are only partly
funded by the Tala hydroeclectic project revenue
stream. In Bangladesh, the deficit rose to 4.9
percent in 2010/11, due to large outlays for
investment in power generation and higher
subsidies. Sizeable foreign aid inflows and
improved revenue performance helped contain
Nepal‟s deficit to a relatively modest 2.8 percent
of GDP and helped Afghanistan retain a surplus
of 0.6 percent of GDP.
Given high inflation rates—currencies in South
Asia appreciated in real effective (trade-
weighted and inflation adjusted) terms, with the
Figure SAR.4 India's household inflation expectations
have increased
Sources: Reserve Bank of India and World Bank.
3
5
7
9
11
13
15
17
Q3-2006 Q2-2007 Q1-2008 Q4-2008 Q2-2009 Q1-2010 Q4-2010
Current perceived
1-Year Ahead
Actual CPI
Linear (Current perceived)
Linear (1-Year Ahead)
Linear (Actual CPI)
mean inflation rates for given survey quarter, y/y percent growth rates
Figure SAR.3 Real lending rates remain expansionary
in India and Pakistan, despite monetary policy tighten-
ing
Sources: Economist Intelligence Unit and World Bank.
-16
-12
-8
-4
0
4
8
12
16
Jan-06 Aug-06 Mar-07 Oct-07 May-08 Dec-08 Jul-09 Feb-10 Sep-10
lending interest rate minus CPI, annual growth rates, percent
Bangladesh
India
Pakistan
Sri Lanka
Figure SAR.5 Elevated food and fuel prices are likely
to weigh on fiscal balances and might delay consolida-
tion
Source: World Bank.
-9
-8
-7
-6
-5
-4
-3
-2
-1
0
1
2
South Asia High-Income countries
Middle East and North
Africa
East Asia and Pacific
Latin America and
Caribbean
Sub-Saharan Africa
General government balances, percent share of GDP
2007 2010 2013
119

Global Economic Prospects June 2011: RegionalAnnex
largest increases in Pakistan and Nepal, where
currencies stood about 15 percent above mid-
2008 levels at end-2010. Bangladesh‟s real
effective exchange rate had appreciated strongly
as well, but depreciated during much of 2010
and ended the year 12 percent above pre-crisis
levels. In India and Sri Lanka, real effective
exchange rate appreciation has been less
pronounced, about half the rates of appreciation
across the rest of the region (8 percent and 6
percent, respectively, over the same period).
Despite headwinds implied by appreciating
currencies, regional merchandise export volume
growth accelerated sharply in the second half of
2010 (figure SAR.6). As the global growth
recovery has deepened, external demand for
South Asia has firmed, with volume growth
given an extra impetus following a shift in
export market composition toward higher-
growth developing countries (China) and away
from traditional export markets in slower-
growing Europe and the United States (figure
SAR.7). In India, the value of exports rose by
37.5 percent year-on-year to reach $245 billion
in FY2010/11, exceeding the $200 billion
government target. Among other factors, this
strong performance reflects the success of the
government's strategy to expand export markets
in emerging economies, particularly in Latin
America and Asia. Regional merchandise import
volume growth remained robust as well, which
in combination with higher import prices led to a
modest deterioration in the region‟s trade deficit
from 6.2 percent of GDP in 2009 to 6.4 percent
of GDP in 2010.
Tourism receipts rebounded in 2010 following
the 2009 downturn with nearly all countries in
the region registering a recovery (Bhutan, India,
Maldives, Nepal, and Sri Lanka). Sri Lanka in
particular posted a 46 percent upsurge in tourist
arrivals following the end of civil war in 2009.
In general, higher regional tourist arrivals
reflected recovery in high-income Europe and
vibrant growth in developing East Asia,
especially China.
Worker remittance inflows to South Asia rose in
U.S.-dollar terms by 8.2 percent in 2010 to $81
billion, helping to offset sizeable trade deficits,
remaining a critical source of foreign exchange.2
However, when measured in local currency
terms, remittances inflows to the region grew by
only 4.1 percent in 2010, while high inflation
rates meant that the real value of these inflows
declined by 3.9 percent.
The pick-up in the dollar value of remittances
was strongest in Sri Lanka, where they increased
24 percent in 2010—reflecting increased inflows
through official channels and the boost in
confidence following the end of the civil war. In
Nepal, the dollar value of remittances expanded
Figure SAR.6 South Asia's merchandise goods exports
recover following sharp deceleration in mid-2010
Sources: Thomson Datastream and World Bank.
-60
-40
-20
0
20
40
60
80
100
Jan-07 Aug-07 Mar-08 Oct-08 May-09 Dec-09 Jul-10 Feb-11
3m/3m, %-change, seasonally adjusted annualized rates, long-term average=1991-2010
Developing excl. South Asia South Asia
High Income Countries World long-term average
Figure SAR.7 Shift toward developing country export markets buoys South Asia's export growth as demand slackens in high-income countries
Sources: CEIC and World Bank.
0
5
10
15
20
25
30
35
40
Developing countries European Union United States
percent share of South Asia's merchandise exports
2000-2004 2005-2009 2010
120

Global Economic Prospects June 2011: RegionalAnnex
17 percent, supported in part by vibrant growth
in India, a key source-country for Nepalese
remittances. In India, the uptick in the dollar
value of remittances inflows was more modest
(7.4 percent), reflecting larger shares of Indian
migrants in high-income countries that have yet
to fully recover from the financial crisis.
Elsewhere in the region, remittances inflows
moderated sharply in 2010 (in dollar terms) by
2.7 percent in Bangladesh, following 19.4
percent growth in 2009. The deceleration
appears to partly reflect a delayed impact of the
decline in the net outflow of migrants, which
nearly halved during the first half of 2009 and
continued to decline in 2010 and into early-2011.
South Asia‟s current account deficit deteriorated
in early 2011, reflecting higher oil import bills
and strong, albeit moderating, import volume
growth. Helping to contain the deterioration in
external balances, the region recorded strong
export volume growth in early-2011 (led by
India, Pakistan and Sri Lanka)—supported by
strong external demand from China. During
calendar year 2011, the regional current account
deficit is projected to expand to 2.8 percent as a
share of GDP from 2.4 percent in 2010. In part
this reflects a projected shrinking of
Bangladesh‟s current account surplus, due to a
stronger pace of growth in imports over exports,
falling terms of trade (driven by rising
international food and fuel prices) and a major
slowdown in worker remittances receipts.
Indeed, deterioration in the current account
prompted the government of Bangladesh to seek
IMF funding to help maintain business and
investor confidence. While FDI to the region has
fallen (India and Pakistan), the regional current
account deficit is expected to continue to be
covered by significant foreign exchange reserve
holdings, particularly in India, and sustained
capital inflows.
Capital Flows
Net private capital inflows to South Asia
expanded by an estimated 12.3 percent in 2010
to $76.6 billion, driven by a doubling (110
percent growth) in portfolio equity inflows (table
SAR.2). As a share of GDP, however, inflows
fell to 3.8 percent from 4.2 percent—roughly
half the peak share (7.8 percent) recorded in
2007 when inflows reached $113.3 billion. South
Asia accounts for a small share (10 percent in
2010) of total private capital inflows to
developing countries, in part reflecting more
shallow financial markets—with the exception
of equities (India). Capital inflows to South Asia
rose in the third quarter of 2010, after which they
fell-off in the fourth quarter and into early-2011,
very much in line with the overall trend in flows
to developing countries in aggregate.
The composition of South Asia‟s inflows has
shifted markedly since the onset of the global
crisis, led by a sharp contraction in FDI
inflows—which are down 50 percent in 2010
from the 2008-peak. This compositional shift
also reflects a recovery in portfolio equity
inflows, which have expanded 19 percent above
the 2007-peak as of 2010. In comparison, for the
rest of the developing countries FDI inflows are
down by only 18 percent as of 2010 from the
2008-peak (including a 52 percent decline posted
by Europe and Central Asia). Portfolio inflows
to South Asia are more in line with
developments in the rest of the developing
world, standing 12 percent above 2007 peaks as
of 2010. As a share of FDI inflows to developing
countries in aggregate, South Asia captured 5
percent, roughly in line with those captured by
Sub-Saharan Africa and the Middle East and
Africa.
In contrast, South Asia attracts a
disproportionately large share of total portfolio
inflows to all developing countries, equivalent to
28 percent in 2010, for example (or 1.5 percent
of South Asia‟s GDP versus about 0.8 percent
for other developing countries). While these
flows are more volatile than FDI flows, South
Asia has generally accounted for a relatively
large share of the total, and for 2010 exceeded
the shares of portfolio inflows accounted by
other regions, with the exception of Latin
America and the Caribbean (with 35 percent in
2010) and just above East Asia and Pacific (24
percent in 2010). Investors have been drawn to
South Asia‟s relatively liquid equity markets—
notably in India, where its companies have
121

Global Economic Prospects June 2011: RegionalAnnex
continued to issue ADRs (American Depository
Receipts) and GDRs (Global Depository
Receipts) in recent years (in contrast to China for
example, where companies have stopped ADR
and GDR issuances). In comparison to equities,
South Asia‟s bond markets—including in
India—are much less developed, thus effectively
channeling foreign investors into equities.
Elsewhere, flows to Latin America and the
Caribbean tend to be more concentrated in bonds
and flows to Europe and Central Asia—prior to
the global crisis—were more concentrated in
banking instruments.
India continues to account for the bulk of
portfolio inflows to the region, which are
channeled largely through institutional investors
(which tend to squeeze out individuals). Foreign
equity inflows into India reached a record $44.8
billion in 2010, exceeding the previous peak of
2007 before the market crash of 2008. The
increased participation of many foreign mutual
funds in the country has contributed to the
success of many new issues by Indian
companies, such as the mega, public sector
offering of Coal India. In 2010 IPOs were nearly
double the level in 2009, with 47 percent of the
funds flowing to the energy sector. After India,
Sri Lanka and Pakistan also attract significant
equity inflows. Following the end of the civil
war in Sri Lanka of 2009 capital inflows have
surged, contributing to the Colombo Stock
Exchange‟s boom returns of 96 percent in dollar
terms in 2010, registering the largest gains in the
world in the year.
FDI to India, the region‟s main recipient, fell by
nearly one-third in 2010. In January 2011, FDI
continued to decline sharply, down nearly by
half from January 2010. This weak FDI
performance has occurred despite India‟s strong
growth. A confluence of factors may have
contributed to the sharp decline, which has
prompted the government of India to form a
panel to investigate possible causes.
Nevertheless, it appears that increased regulatory
scrutiny of the sources of FDI has contributed to
a fall-off in flows tied to „round-tripping‟ (to
avoid taxes, for example) via offshore accounts.
Flows from Mauritius and Cyprus—which
together account for two-fifths of flows to
India—contracted markedly in 2010, by 60
Table SAR.2 Net capital flows to South Asia
Source: World Bank.
$ billions
2003 2004 2005 2006 2007 2008 2009 2010e 2011f 2012f 2013f
Current account balance 12.5 -1.2 -15.1 -16.8 -17.6 -49.9 -28.0 -49.6 -60.3 -60.9 -63.2
as % of GDP 1.6 -0.1 -1.5 -1.5 -1.2 -3.3 -1.7 -2.4 -2.8 -2.6 -2.4
Financial flows:
Net private and official inflows 14.5 21.2 28.5 76.6 117.7 61.4 77.7 88.3
Net private inflows (equity+private debt) 18.6 21.5 25.6 73.1 113.3 52.8 68.2 76.6 103.1 107.3 118.3
..Net private inflows (% GDP) 2.4 2.4 2.5 6.3 7.8 3.5 4.2 3.8 4.8 4.5 4.5
Net equity inflows 13.5 16.8 23.6 36.4 68.4 32.9 58.8 67.2 73.1 82.8 92.3
..Net FDI inflows 5.4 7.8 11.2 26.0 32.3 48.7 38.3 24.2 36.1 43.8 51.3
..Net portfolio equity inflows 8.0 9.0 12.4 10.4 36.1 -15.8 20.5 43.0 37.0 39.0 41.0
Net debt flows 1.0 4.4 4.9 40.2 49.3 28.5 18.8 21.1
..Official creditors -4.1 -0.3 2.9 3.5 4.4 8.6 9.5 11.7
....World Bank -2.3 2.3 2.3 2.0 2.0 1.4 2.1 3.9
....IMF -0.1 -0.3 0.0 -0.1 -0.1 3.2 3.6 3.8
....Other official -1.8 -2.4 0.6 1.6 2.4 4.0 3.8 4.0
..Private creditors 5.1 4.7 2.0 36.7 44.9 19.9 9.3 9.4 30.0 24.5 26.0
....Net M-L term debt flows 3.1 4.0 -0.2 19.9 32.0 12.0 10.3 3.2
......Bonds -3.7 3.9 -2.8 6.4 10.7 1.7 1.7 -2.6
......Banks 6.8 0.5 2.8 13.5 21.3 10.3 8.6 5.8
......Other private 0.0 -0.3 -0.2 -0.1 0.0 0.0 0.0 0.0
....Net short-term debt flows 2.0 0.7 2.3 16.8 12.9 7.9 -1.0 11.1
Balancing item /a 10.0 7.6 -6.6 -18.2 3.7 -37.8 -11.0 -30.4
Change in reserves (- = increase) -36.9 -27.6 -6.8 -41.7 -103.8 26.3 -38.6 -8.3
Memorandum items
Workers' remittances 30.4 28.7 33.9 42.5 54.0 71.6 75.1 81.2 88.7 93.8Note : Only for Afghanistan, Bangladesh, Bhutan, India, Maldives, Nepal, Pakistan and Sri Lanka.
e = estimate, f = forecast
/a Combination of errors and omissions and transfers to and capital outflows from developing countries.
122

Global Economic Prospects June 2011: RegionalAnnex
percent and 78 percent, respectively. In contrast,
total inflows to India excluding these countries
contracted by only 8 percent. Similarly, some
projects were delayed for environmental
compliance issues. For example, South Korean
steel giant POSCO suffered a setback when the
Environment Ministry delayed the operation of
its $12 billion steel project in Orissa in mid-
2010. U.K.-based Vedanta‟s investment of
around $9 billion was also halted in 2010, as it
had breached environmental regulations in the
mining sector. Other countries in the region
generally rank below India in international
investor surveys, with Afghanistan often ranked
near the bottom, helping to explain relatively
weak FDI inflows to South Asia. Remarkably,
Pakistan—where security concerns remain a key
hindrance—captures a similar share of FDI
relative to GDP as India and has exhibited the
same pattern of declining FDI inflows as India
over recent years (figure SAR.8).
Government debt is elevated across the region—
reflecting the impact of long-term structural
fiscal deficits—and exceeds the average for
developing countries in aggregate (except for
Afghanistan) (figure SAR.9). As of FY2009-10,
debt as a share of GDP in the Maldives (96
percent), Sri Lanka (82 percent) and India (73
percent), sharply exceeded the average for
developing countries (37 percent). Indeed, South
Asia‟s government debt is more closely in line
with that of high-income countries (91 percent),
although the upward trajectory since the onset of
the financial crisis is not as pronounced in South
Asia as in high-income countries—with the
marked exception of the Maldives.
Medium-term outlook
Regional GDP growth is projected to continue to
record strong growth outturns averaging 7.7
percent in calendar terms and at market prices
from 2011 through 2013, off 1.6 percentage
points from the 9.3 percent outturn of 2010—but
1.7 percentage points above the pre-crisis
decadal average from 1998 through 2007. The
deceleration from 2010 reflects progressive
tightening of monetary policy and fiscal
consolidation aimed at a quelling excess demand
and inflationary pressures, reducing
unsustainably large fiscal deficits and containing
deterioration in external balances. Aside from
dampening private sector demand, fiscal
consolidation is expected to lead to a slowing of
public sector consumption.
In combination with macro-policy tightening,
improving crop production (Pakistan and Sri
Lanka) and an expected moderation in
international fuel prices over the balance of 2011
should foster some easing of inflationary
pressures ahead. But, deceleration in prices is
projected to be slow given incomplete pass-
Figure SAR.8 India and Pakistan FDI inflows as a share of
GDP lag other developing countries
Sources: .UNCTAD and World Bank
0.0
1.5
3.0
4.5
2003 2004 2005 2006 2007 2008 2009 2010e
percent share of GDP
India
Pakistan
Developing countries, excl. South Asia
Figure SAR.9 Government debt in South Asia exceeds
average for emerging markets -- except in Afghanistan
Sources: CEIC, IMF Fiscal Monitor Jan-2011, and World Bank.
0
10
20
30
40
50
60
70
80
90
100
Afghanistan Nepal Bangladesh Pakistan Bhutan India Sri Lanka* Maldives* Emerging* High-income*
Total government debt, percent share of GDP for fiscal years (*calendar years 2008 and 2009)
2007-08 2009-10
123

Global Economic Prospects June 2011: RegionalAnnex
through of higher international prices thus far,
particularly for fuel prices. An expected normal
crop year (2011/2012) in much of the region and
relatively high regional stocks are providing a
buffer for grain prices and import demand in
2011 (table SAR.3).3 However, South Asia is
facing the current upturn with some weaker
initial conditions compared with the 2007-2008
upswing—given less fiscal space and higher
inflation—which is posing additional challenges
in addressing risks of increased poverty and
malnutrition rates.
External demand for goods and services is
projected to moderate in 2011, given policy
normalization and fiscal consolidation across
most of South Asia‟s export markets, along with
a natural deceleration in demand growth as
global demand converges back to trend
production levels. Accordingly, the pace of
growth of tourism activity is projected to
moderate in 2011, as arrivals from high-income
countries, particularly from Europe, are expected
to slow. However, the slowdown in arrivals from
Europe is being partially offset by still strong
growth from developing East Asia and high-
income Middle Eastern economies. Deceleration
in domestic demand growth will be reflected in a
moderation in South Asia‟s imports in 2011.
However, given the deterioration in the terms of
trade (as higher oil prices weigh on the region‟s
import bill) the current account deficit is
projected to expand in 2011.
The recent rise in oil prices is projected to
translate into significant terms of trade
deterioration for South Asia, compared with oil
importers in most other developing regions, with
the exception of the Middle East and North
Africa (figure SAR.10). Price changes are
expected to reduce real incomes in South Asian
countries by about 1.1 percent of GDP, largely
due to higher oil prices, and partly offset by
increases in other commodities. For example,
South Asia‟s cotton producers (such as India) are
likely to see marked gains in their terms of trade,
as cotton prices are projected to rise by one-
third, whereas textile exporters (such as
Bangladesh, which imports cotton) are likely to
see greater deterioration in their terms of trade.
Remittances are projected to rise 9.1 percent in
2011 in dollar terms, up slightly from 8.2 percent
growth in 2010 (growing substantially below pre
-crisis boom rates, when they averaged 30
percent over 2007 and 2008), and help provide a
cushion to the deterioration in the regional
current account balance (figure SAR.11). In
particular, worker transfers to South Asia from
the high-income Gulf Cooperation Council
(GCC) countries (most of the region‟s 9 million
migrants work in these countries) are projected
to firm with strengthened activity tied to higher
oil-rents, which is boosting labor demand in the
oil producers (figure SAR.12).4 The countries
most affected by political upheaval in the Middle
East (Egypt, Libya, Syria, Tunisia, and Yemen)
are not large migrant host-countries for South
Asia, so the net impact on migrant labor demand
and remittances appears positive.
Table SAR.3 South Asia’s grain supply and demand balances
Sources: U.S. Department of Agriculture (11 May 2011) and World Bank.
1,000 metric tons, unless otherwise noted
2004/2005 2005/2006 2006/2007 2007/2008 2008/2009 2009/2010 2010/2011 2011/2012
Production 251,472 263,234 264,995 284,200 289,168 278,943 290,733 298,683
y-o-y % growth -0.6 4.7 0.7 7.2 1.7 -3.5 4.2 2.7
Ending stocks 18,710 20,729 23,117 26,134 40,767 45,389 45,581 43,406
y-o-y % growth -20.6 10.8 11.5 13.1 56.0 11.3 0.4 -4.8
% share of use* 7.8 8.4 9.2 9.9 15.7 17.5 16.6 15.4
Domestic consumption * 240,445 245,368 251,370 262,857 260,328 259,012 275,288 282,363
y-o-y % growth -0.6 2.0 2.4 4.6 -1.0 -0.5 6.3 2.6
* Excludes feed consumption.
Countries = Bangladesh, India, Nepal, Pakistan, Sri Lanka.
124

Global Economic Prospects June 2011: RegionalAnnex
GDP growth (in calendar year terms) in South
Asia is projected to gain momentum
incrementally in 2012 and 2013 to 7.7 percent
and 7.9 percent, respectively, from an expected
7.5 percent in 2011, led by firming private sector
activity, as inflationary pressures diminish and
enable monetary authorities to pursue less
restrictive stances in the outer years. In
particular, investment is expected to firm as
tighter monetary conditions are projected to
contribute to an easing of inflation expectations
and as fiscal consolidation fosters greater access
to credit. Additionally, large programmed
investment and reconstruction projects in
Afghanistan, Bangladesh, Bhutan, India and Sri
Lanka should support acceleration of GDP
growth in the outer years, boosting productivity
and potential output. External demand is
projected to strengthen incrementally in 2012
and 2013—assuming continued increased market
penetration to faster growing developing
countries—and be supportive of growth as well,
as large high-income export markets begin to
stabilize macroeconomic conditions.
The region‟s relatively strong projected growth
path—reaching 7.9 percent in 2013 compared
with the 6.0 percent average from 1998 through
2007 (compound growth rate)—is projected to
be led by India, Sri Lanka and Bangladesh,
where acceleration of investment activity is
expected to support higher growth outturns. In
contrast, Pakistan and Nepal are expected to lag,
given continued political challenges and
associated macro-policy slippage. Indeed, GDP
growth in Pakistan is not projected to recover to
above the pre-crisis decadal average of 5.0
percent during the forecast period (table SAR.4).
Risks
The region has witnessed a build-up in price
pressures and is bumping up against potential
output, which suggests that it needs to address
supply constraints through higher investment.
However, large fiscal deficits and public sector
Figure SAR.10 Projected terms of trade impacts in 2011
for oil-importing countries (by region)
Sources: UN Comtrade and World Bank.
-2.0 -1.5 -1.0 -0.5 0.0 0.5 1.0
Sub-Saharan Africa
Latin America & Caribbean
Europe & Central Asia
East Asia & Pacific
South Asia
Middle East & North Africa
percent share of GDP
Figure SAR.12 Most migrant workers from South Asia
are based in the high-income Gulf Cooperation Council
countries of the Middle East
Source: World Bank, Migration and Development Brief No. 16, April 2011.
0
500
1,000
1,500
2,000
2,500
3,000
3,500
Bahrain Oman Qatar Kuwait UAE Saudi Arabia
thousands
Sri Lanka
Pakistan
Nepal
India
Bangladesh
Figure SAR.11 Growth of worker remittances inflows to
South Asia projected to level off in 2011
Source: World Bank, Migration and Development Brief No. 16, April 2011.
-15%
-10%
-5%
0%
5%
10%
15%
20%
25%
30%
35%
40%
2005 2006 2007 2008 2009 2010e 2011f
annual percent change
Developing countries, excl. South Asia South Asia
125

Global Economic Prospects June 2011: RegionalAnnex
debt may be crowding out private sector
investment, which is likely being pressured by a
relatively poor business climate and relatively
shallow domestic financial markets (such as
small corporate bond markets). As a
consequence, demand is being channeled into
higher prices and deteriorating current account
balances. In this context, pursuing policy
normalization is critical and failure to bring
public finances and monetary policy into line
could undermine growth projections and
progress toward South Asia‟s urgent
development objectives, including an expansion
of infrastructure spending and potential output.
Inflation remains a key downside risk to growth,
as policymakers face numerous challenges in
reducing price pressures. If inflation remains
elevated, unless offset by exchange rate
depreciation (itself an inflationary impulse) it is
likely to begin eating into the region‟s
international competitiveness and discourage
foreign investment—creating headwinds to gains
in productivity. Elevated international
commodity prices are also a negative risk factor,
particularly given political resistance to reducing
subsidies. In countries such as India that
maintain price controls on food, farmers are not
fully participating in the global upswing in
prices. Higher monetary policy interest rates
Table SAR.4 South Asia country forecasts
Source: World Bank.
Est.
98-07a2008 2009 2010 2011 2012 2013
Calendar year basis b
Bangladesh
GDP at market prices (2005 US$) c 5.0 6.3 6.0 5.8 6.0 6.3 6.5
Current account bal/GDP (%) 0.2 1.4 3.5 2.5 -0.5 -1.3 -1.7
India
GDP at market prices (2005 US$) c 6.4 6.2 6.8 10.3 8.1 8.4 8.5
Current account bal/GDP (%) -0.3 -2.6 -2.0 -2.7 -2.8 -2.5 -2.3
Nepal
GDP at market prices (2005 US$) c 3.4 6.2 5.3 4.5 4.1 3.7 4.1
Current account bal/GDP (%) -1.7 3.0 -2.0 -2.8 -2.9 -2.7 -2.6
Pakistan
GDP at market prices (2005 US$) c 4.9 3.6 2.6 3.9 3.3 3.2 4.1
Current account bal/GDP (%) -0.8 -9.6 -2.5 -1.3 -2.4 -2.5 -2.7
Sri Lanka
GDP at market prices (2005 US$) c 4.4 6.0 3.5 8.0 7.5 6.8 6.4
Current account bal/GDP (%) -3.2 -9.8 -0.7 -3.5 -4.9 -4.7 -4.2
Fiscal year basis b
Bangladesh
Real GDP at market prices 5.1 6.2 5.7 5.8 6.2 6.4 6.6
India
Real GDP at market prices 6.4 4.9 9.1 8.8 8.0 8.4 8.5
Memo: Real GDP at factor cost - 6.8 8.0 8.5 8.2 8.5 8.6
Nepal
Real GDP at market prices 3.4 6.1 4.4 4.6 3.5 4.0 4.2
Pakistan
Real GDP at market prices 5.0 1.6 3.6 4.1 2.5 3.9 4.3
World Bank forecasts are frequently updated based on new information and changing (global)
circumstances. Consequently, projections presented here may differ from those contained in
other Bank documents, even if basic assessments of countries’ prospects do not significantly
differ at any given moment in time.
Afghanistan, Bhutan, Maldives are not forecast owing to data limitations.
a. Growth rates over intervals are compound average; growth contributions, ratios and the GDP
deflator are averages.
b. National income and product account data refer to fiscal years (FY) for the South Asian
countries with the exception of Sri Lanka, which reports in calendar year (CY). The fiscal year
runs from July 1 through June 30 in Bangladesh and Pakistan, from July 16 through July 15 in
Nepal, and April 1 through March 31 in India. Due to reporting practices, Bangladesh, Nepal,
and Pakistan report FY2009/10 data in CY2010, while India reports FY2009/10 in CY2009. GDP
figures are presented in calendar years (CY) based on quarterly history for India. For
Bangladesh, Nepal and Pakistan, CY data is calculated taking the average growth over the two
fiscal year periods to provide an approximation of CY activity.
c. GDP measured in constant 2005 U.S. dollars.
d. Estimate.
e. Forecast.
(annual percent change unless indicated otherwise) Forecast
126

Global Economic Prospects June 2011: RegionalAnnex
aimed at crimping price pressures, however,
could also prompt a rise in capital inflows and
complicate monetary policy—emphasizing the
need for fiscal consolidation.
Persistently large budget deficits also pose
important downside risks to growth, by
crowding out private investment and
contributing to excess demand. Fiscal slippage is
contributing to inflationary pressures and limits
policy options in the event of future crises
through limited fiscal space. Regional deficit
(and debt) problems will need to be resolved by
simultaneous reforms on both revenues and
expenditures along with reforms to support
expansion of the private sector, including
deepening financial markets. Efforts to reduce
deficits are being hampered by South Asia‟s
weak revenue collection and a small tax base,
while large food-, fuel- and fertilizer subsidies
are hindering progress toward cutting
expenditures.
Key external downside risks are tied to
uncertainty in the Middle East and North Africa.
If political turmoil leads to sustained high oil
prices, South Asia‟s oil import bill and price
pressures could rise further, while a spreading of
turmoil to GCC countries could undermine
confidence and economic growth in the Middle
East and North Africa, and result in sluggish or
even falling remittances inflows. Already, recent
political tensions have intensified efforts within
the GCC to replace migrant workers with
nationals, which if it were to spread, could curb
remittances flows to South Asia.
Expansion of the sovereign-debt crisis in the
Euro Area represents another important external
downside risk, particularly if the crisis were to
spread to larger Euro Area economies that would
lead to weaker goods and services exports,
worker transfer receipts and capital inflows for
South Asia. The Euro Area represents about one-
fourth of South Asia‟s merchandise export
market, of which Germany and France account
for 40 percent and 20 percent, respectively.5 A
spreading of the Euro Area crisis could
negatively impact the tourism sectors among the
smaller South Asian economies, particularly in
the Maldives and Sri Lanka.
Notes:
1. The Reserve Bank of India‟s Inflation
Expectations Survey of Households
conducted in Q4-2010 (Round 22) shows
households expect inflation to increase 130
basis points to 13.1 percent from the
perceived current rate of 11.8 percent—
compared with the expected 11.9 percent
inflation rate from the Q2-2010 survey
(Round 20), (1-year-ahead expected rates).
2. Nepal, Bangladesh, and Sri Lanka, were
among the top 15 recipients of remittances in
2009—with inflows representing the
equivalent of 23.8% of GDP in Nepal,
11.8% in Bangladesh, 8% in Sri Lanka,
5.4% in Pakistan and 3.6% in India.
3. Sources: India‟s Meteorological Department
(April 2011 first monsoon forecast for
2011/12), and U.S. Department of
Agriculture (May 2011).
4. Over two-thirds of South Asia‟s migrant
workers are based in Saudi Arabia (3.3
million) and the U.A.E. (2.9 million).
5. “European Sovereign Debt Crisis: Links to
the South Asia Region”. December 2010.
Francis Rowe, et al.
127

Global Economic Prospects June 2011: RegionalAnnex
Sub-Saharan Africa
Recent developments
Growth in Sub-Saharan Africa rebounded
sharply in 2010. Supported by the global
economic recovery and developments on the
domestic front, GDP in Sub-Saharan Africa
grew by 4.8 percent in 2010—up from the 2
percent advance of 2009 and just shy of the
region’s 5 percent pre-crisis average growth
(figure SSA.1). Excluding South Africa, the
largest economy in the region, Sub Sahara Africa
grew by 6.0 percent, one of the fastest growth
rates among developing regions.
Recovery in exports. African export revenues,
which had fallen to some 51 percent of their pre-
crisis August 2008 levels by January 2009, had
almost recovered by November 2010, reaching
93 percent of earlier peaks. Much of the increase
was due to the surge in commodity prices (see
Commodity annex) as in volume terms, exports
increased by a moderate 7.5 percent in 2010.
Among the biggest winners from the terms of
trade changes were the oil exporters in the
region, with incomes gains of upwards 10
percent of GDP in Angola, Congo, and Gabon.
Among oil importers in the region the picture
was mixed. In general, exporters of commodities
whose price increases were higher than the
increase in crude oil prices also benefitted
(figure SSA.2). This includes exporters of
metals such as copper (Zambia), as well as
exporters of agriculture products such as rubber
(Liberia), and cotton (Burkina Faso, Benin, and
Mali). However, even though the prices of the
principal merchandise exports of many oil
importing Sub- Saharan countries improved in
2010, they still suffered a deterioration in their
terms of trade, as in general, the recovery in
prices was not sufficient to compensate for the
Figure SSA.3 Impact of terms of trade on growth is
mixed
Source: World Bank.
Figure SSA.1 Growth in Sub Saharan Africa re-
bounds close to Pre-Crisis Average
Source: World Bank.
0.0
1.0
2.0
3.0
4.0
5.0
6.0
7.0
8.0
2000 2001 2002 2003 2004 2005 2006 2007 2008 2009 2010
Sub Saharan AfricaSub Saharan Africa ex. South AfricaPre-Crisis Average
Percent growth GDP
Figure SSA.2 Terms of trade changes in SSA coun-
tries
Source: World Bank.
-10 -5 0 5 10 15 20
SeychellesCape Verde
ComorosEritrea
NamibiaMalawi
RwandaEthiopiaBurundi
Central African RepublicSouth Africa
SwazilandTanzania, United Rep.
UgandaCameroon
SudanCote d'Ivoire
MaliNigeriaAngola
Mauritania
Terms of Trade Changes as Share of GDP (%)
128

Global Economic Prospects June 2011: RegionalAnnex
sharp rebound in oil prices. Nonetheless, the
impact of terms of trade changes on growth in
2010 remains mixed as stronger growth was
associated with countries that recorded both
favorable as well as unfavorable terms of trade
changes, implying that there is more to the Sub
Saharan African growth story than developments
in commodity prices (figure SSA.3).
Rebound in capital flows. Thanks to recovery in
the global economy, as well as an increasing
recognition by investors of the opportunities
presented in a rapidly growing developing
region, net private capital inflows to Sub
Saharan Africa increased from $35.8bn in 2009
to an estimated $41.1bn in 2010 and are
projected to rise to $48.6bn in 2011 (figure
SSA.4 and table SSA.3).
The leading destination of FDI inflows, in value
terms, is to the capital intensive mining sector.
Indeed, higher commodity prices and the global
competition to secure supplies of commodities
have spurred investments globally in the natural
resource sector. Sub Saharan Africa, a region
with a high proportion of known mineral
resources with great potential for further
development is benefitting from this trend. This
has been facilitated by improvements to
regulatory regimes in some countries. Capital
raisings by African resource companies are
reported to have increased by 240 percent
compared to 2009.1 Much exploratory activity
has been ongoing in several countries during
2011, with new discoveries and production
coming on stream (table SSA.1).
These resource flows have supported growth by
creating new jobs, increasing government
revenues and helping to finance current account
deficit. Yet in countries with poor governance
and weak institutions, the natural resource sector
which exists as an enclave in many countries,
can be a deterrent to growth, as rents generated
by the sector are appropriated by the elite
minority, often leading to conflict. This so-called
resource-curse need not be the norm. Twenty-
one Sub-Saharan countries have sought to
maximize the potential benefit from resource
exploitation and reduce the potential for
corruption by joining the Extractive Industries
Transparency Initiative. Five are currently
considered compliant to the initiative (the
Central African Republic, Ghana, Liberia, Niger,
and Nigeria), while another 16 countries are
candidates.
Even though, natural resources and energy are
the most important destination for Sub-Saharan
FDI by value, combined they represent only 16
percent of the total number of new FDI projects.2
Motivated by higher GDP growth rates, fast
growing populations and a rising middle class,
the bulk of new investment projects were in the
non-natural resources sector. Developments in
the telecommunications (box SSA.1) and retail
Table SSA.1 Recent mineral discoveries and pro-
duction
Source: Africa Mining, various issues.
Discoveries in Q1 2011
Natural Resource Country
Oil Ghana (West Cape Three points)
Gold Tanzania (Handeni region)
Iron Ore Liberia (Bopulu and Timbo)
Manganese Gabon (Ndjole)
Diamond Sierra Leone (Tongo)
Natural gas Tanzania (offshore)
New Production to come on stream in 2011
Natural Resource Country
Coal Mozambique
Oil Ghana
Copper Zambia (Konkola North)
Manganese Gabon
Figure SSA.4 Net private capital inflows to Sub
Sahara Africa rebounds after crisis
Source: World Bank.
0
10
20
30
40
50
60
70
80
2003 2004 2005 2006 2007 2008 2009 2010 2011 2012 2013
Forecasts
($ bn)
129

Global Economic Prospects June 2011: RegionalAnnex
sectors epitomize the interest in non-extractive
industries in the region. In retail for instance,
large South African retail firms have been busy
opening up shopping malls across the region.
Walmart, the world’s largest retailer, is currently
in the process of acquiring MassMart, a South
African chain with operations in 14 countries in
the region.
Portfolio equity flows to Sub Saharan Africa rose
by 10 percent in 2010, reaching $11 billion. The
strong growth performance of Sub Saharan
African countries over the last decade (5 percent
per year) coupled with increasing political
stability and reforms that have lowered barriers
to entry, have begun to place Sub Saharan
African countries on the radar screens of
portfolio equity managers. This is evidenced in
the recent establishment of a number of Africa-
focused private equity funds (table SSA.2). Not
surprisingly, South Africa receives the largest
share of such inflows. However other
economies, including Nigeria, with its fast
growing economy and large population; Kenya,
which is often viewed as the gateway to the $84
billion East African economy, and Ghana, with
its stable political environment and fast growing
economy, are of particular interest.
Box SSA.1: Recent Developments in the Telecoms Sector in Sub Saharan Africa – a booming sector
Sub Saharan Africa is the region with one of the fastest growing mobile phone markets (International Telecom-
munications Union, 2010), partly because of the weak penetration of fixed-lines but also due to the pace of ur-
banization—the fastest compared to other regions. An estimated 40 million new mobile cellular subscriptions
were added in 2010, and as much of the population remains unserved, the potential for further growth remains
strong.
The telecommunications sector is one of the strongest recipients of foreign direct investment flows to the region.
In 2011 there have been a number of announcements to that effect. MTN, the giant South African telecommuni-
cations company, has announced plan to invest $1 billion in Nigeria (Sub Saharan Africa’s biggest mobile phone
market) and a further $150 million in Zambia. In March 2011, Etisalat, a UAE telecommunications company,
announced that it had sealed an agreement for a $680m syndicated loan from eight Nigerian banks. Movitel
(Vietnamese company), Mozambique’s third biggest mobile phone operator, also announced plans to invest
$120 million to build new base stations.
Government policies are supporting these FDI inflows through improvements to regulatory regimes, including
opening up the sector to further competition. In the last year, for example, operating licenses have been granted
to new entrants to the telecommunications sector in Congo (Brazzaville), Ghana, Liberia, Malawi, Mozambique,
and network charges by regulators have been reduced.
These developments, and the arrival of high speed undersea fiber optic broadband cables on the coast of Africa,
are a boon to the sector but also the broader economy as they generate significant productivity spillovers. In both
East and Western Africa a ―price war‖ is ongoing between rival telecoms operators, and in some cases service
charges have dropped by more-than 50 percent – lowering costs for business (and personal) customers. Innova-
tions such as Kenya’s pioneering mobile money scheme (M-PESA), Ethiopia’s Commodity Exchange, which
uses mobile technology to provide real time information to farmers across the country, and Ghana’s mPedigree
app, which allows patients to check the authenticity of medicines, are only a few examples of how investment in
the telecoms sector is supporting innovation and growth in the region.
A recent study finds that increasing access to mobile telephone networks by 1 percent translates into a 0.5 per-
cent increase in real GDP per capita (Djiofack and Keck, 2009). In Nigeria, for instance, though the telecommu-
nications sector share in GDP was about one-quarter of that of the oil sector, its direct contribution to GDP
growth was higher than the oil sector’s in 2010.
Table SSA.2 Africa Focused Funds
Source: Africainvestor, November December 2010.
Fund
size ($m)
ECP Africa Fund 613
Pan African Investment Partners II 492
Aureos Africa Fund 381
Leapfrog Microfinance Inclusion
Fund
136
Evolution One Fund 91
Africinvest Financial Sector 43
130

Global Economic Prospects June 2011: RegionalAnnex
South Africa also dominated bond flows to the
region, accounting for almost all of the $4.7
billion in regional bond sales during 2010.
However, with an estimated $93 billion annual
infrastructural deficit, and a funding gap of $31
billion, a number of countries in Sub Saharan
Africa (Ghana, Kenya, Tanzania, Zambia)
continue to express interest in tapping the euro-
bond market. In January 2011, Nigeria issued a
$500 million debut Eurobond, which was
oversubscribed. In March 2011 Zambia received
a ―B+‖ credit rating from international credit
rating agencies. Several other countries are
revamping their laws to tap into the nearly $1
trillion Islamic financial market. Senegal has
indicated that it plans to raise $200m in Islamic
financing in 2011. Increasingly, foreign
investors are participating in local bond markets,
notwithstanding the foreign exchange risk.
Ghana’s February 2011 auction of GHS 400
million ($263m), in 3-year bonds attracted
significant global interest and was
oversubscribed by 88 percent. Kenya auctioned a
9-year infrastructure bond worth 31.6 billion
shillings ($380m) in August 2010, and the
country is likely to continue to tap the market in
2011. Indeed, local currency bond supply in Sub
Saharan Africa is estimated to have increased
from $7bn in the 1990s to almost $20bn by
2008. Improving liquidity is also supporting the
extension of the yield curve in a number of
countries, with Nigeria offering 20-year
maturities and Kenya up to 30-year maturities.3
Domestic demand reinforced growth
prospects for Sub-Saharan Africa. While the
increase in external demand supported GDP
growth, domestic demand accounted for more
than all of the growth in the region) in 2010.
Although exports increased 7.5 percent thereby
supporting growth, imports increased by even
more (9.1 percent), boosted by a solid 4.9
percent rise in consumer demand. Hence, the net
exports contribution to growth was negative.
Table SSA.3 Net capital flows to Sub-Saharan Africa
Source: World Bank.
$ billions (April 2011)
2003 2004 2005 2006 2007 2008 2009 2010p 2011e 2012f 2013f
Current account balance
as % of GDP
Financial flows:
Net private and official
inflows 14.6 24.0 33.0 42.4 53.2 38.9 45.3 51.1
Net private inflows
(equity+private debt) 13.2 21.7 33.9 44.4 50.7 34.3 35.8 41.1 48.6 56.1 70.4
..Net private inflows (%
GDP) 3.0 4.0 5.3 6.0 5.9 3.5 3.9 3.8 4.1 4.4 4.8
Net equity inflows 14.0 17.7 26.1 37.0 38.7 28.9 40.2 34.8 39.1 44.2 55.3
..Net FDI inflows 13.3 11.0 18.0 20.2 28.5 34.5 30.3 23.8 32.1 35.2 45.3
..Net portfolio equity
inflows 0.7 6.7 8.1 16.8 10.1 -5.6 10.0 11.0 7.0 9.0 10.0
Net debt flows 0.6 6.4 6.9 5.4 14.6 10.0 5.1 16.3
..Official creditors 1.4 2.3 -0.9 -1.9 2.5 4.6 9.5 10.0
....World Bank 2.2 2.5 2.4 2.2 2.4 1.9 3.1 3.4
....IMF 0.0 -0.1 -0.4 -0.1 0.1 0.7 2.2 1.8
....Other official -0.8 0.0 -2.9 -4.1 0.0 2.0 4.1 4.8
..Private creditors -0.8 4.0 7.9 7.4 12.1 5.5 -4.4 6.3 9.5 11.9 15.1
....Net M-L term debt flows
0.9 2.7 4.8 -2.0 8.0 0.8 5.6 8.1
......Bonds 0.4 0.6 1.3 0.3 6.7 -0.7 1.9 3.4
......Banks 1.2 2.4 3.8 -1.7 2.1 1.7 2.9 4.7
......Other private -0.7 -0.3 -0.3 -0.7 -0.8 -0.1 0.8 0.0
....Net short-term debt flows
-1.7 1.4 3.0 9.4 4.0 4.6
-
10.0 -2.1
Balancing item /a -4.1 -4.6
-
33.5
-
26.0
-
20.4
-
11.1
-
28.7 -38.5
Change in reserves (- =
increase) -3.5
-
21.7
-
19.9
-
32.5
-
27.0
-
10.9 1.9 -6.1
Memorandum items
Workers' remittances 6.0 8.0 9.4 12.7 18.6 21.3 20.8 21.0 22.0 24.0
131

Global Economic Prospects June 2011: RegionalAnnex
Robust consumer demand were supported by
higher farm incomes from favorable harvests in
much of the region in 2010 (box SSA.2);
increased activity in the mining sector and robust
growth in the services sector and a relatively low
inflation environment—all of which served to
boost real incomes.
Improved access to consumer credit (especially
in South Africa, where interest rates were at
record lows) and stable remittance inflows ($21
billion in 2010) also helped underpin consumer
demand. And, in a virtuous circle, that strong
demand has been an important factor luring in
new investments into the retail, banking and
telecommunication sectors, creating new well
paid jobs and improving overall productivity.
Associated increases in tax revenues supported
by higher aid inflows contributed to a 5.5
percent increase in public consumption, even as
fiscal balances in the region improved by 1
percentage point from a deficit of 5.1 percent of
GDP in 2009 to 4.1 percent in 2010. Countries
that benefitted the most from the positive terms
of trade changes also had a better turnaround in
their fiscal balances.
Though overall growth in Sub Sahara Africa
remains strong, there is significant
heterogeneity across region. An encouraging
Box SSA.2: The Agriculture Sector in Sub Saharan Africa – Unrealized potential
The agricultural sector, the largest employer in many Sub Saharan African economies, an important foreign ex-
change earner, and the sector with the greatest potential for poverty reduction was also providing support to
growth in several countries in 2010. Studies have found that growth originating in the agricultural sector is two-to-
four times as effective as non-agricultural growth in reducing poverty (WDR, 2008), since some 75 percent of the
poor live in rural areas. 4
However, while the past 40 years has witnessed remarkable progress in global agricultural production, with per
capita world food production growing by 17 percent and aggregate world food production up by 145 percent, agri-
cultural production in Sub Saharan Africa is 10 percent lower than it was in 1960. Land productivity in Africa is
estimated at 42 percent and 50 percent of that in Asia and Latin America, respectively. Factors accounting for low
yields in Sub Saharan Africa include the fact that only 4 percent of Africa's crop area is irrigated compared to 39
percent in South Asia, and fertilizer usage is less than 10 percent of the world average. Further, mechanization
remains low with an average of only 13 tractors per 100 square kilometers, compared to a world average of 200
tractors per square kilometers. In part this underinvestment in the agricultural sector reflects a weak policy suppor-
tive environment. 5
Indeed much of agricultural production is mostly weather dependent. In 2010, where weather patterns were mostly
favorable, good harvests kept food prices in check, even amidst the surge in global food prices. In the Southern
Africa region bumper harvests were recorded in Malawi, Zambia and South Africa, with the latter reaching a thirty
-year record high maize output of 12.8 million tonnes. These favorable weather conditions are unlikely to repeat
themselves regularly, hence for output growth to be sustained other yield enhancing techniques need to be em-
ployed. Already in 2011 agricultural output is being hampered in East Africa by poor rains, thus cutting into
growth prospects for the region.
Nonetheless there a number of recent encouraging developments in the Sub-Saharan African agriculture sector
worth highlighting. One prominent example is the transformation of Malawi from a food importer with depend-
ence on food aid to a food self sufficient and net exporter over the past five years, thanks to a government sup-
ported farmer input program. Other Sub Saharan countries including Ghana, Zambia, Nigeria, Rwanda and Tanza-
nia are implementing programs of their own. However, if not managed well, fiscal sustainability could be compro-
mised.
With about 60 percent of the world’s uncultivated arable land in Africa and very low yields there exists significant
opportunities to scale-up production. By one estimate, if cereal yields were to be doubled to two tons per hectare –
still half of the average in the developing world – Africa would grow an extra 100 million tons a year of food. This
would be roughly equivalent to adding another US corn belt to world food production, helping moderate world
food price increases, shifting Africa to a major food surplus region and helping eradicate hunger and poverty. 6
The benefits of an increase in yields with out improvements to both hard and soft infrastructure to allow the in-
creased output to reach the relevant markets will however curtail the benefits.
132

Global Economic Prospects June 2011: RegionalAnnex
aspect of the trend rise in Sub Saharan Africa
growth rates has been the extent to which
almost all countries have seen significant
improvements in their growth. Strong Sub-
Saharan growth does not reflect extremely high
growth rates by one or two countries, but solid
growth in several economies (figure SSA.5),
with the highest growth rates comparable to
those of other fast growing developing
economies (figure SSA.6). Only two economies
grew by less than 2 percent in 2010, while the
bulk registered solid growth rates of between 2
and 6 percent, 30 percent of countries in the
region enjoyed real GDP growth rates of more
than 6 percent. Across sub-regions growth was
strongest in West Africa (6.5 percent) powered
by Nigeria’s robust growth (7.9 percent) and
supported by Ghana’s 7.7 percent gains in the
year. GDP growth in East Africa was almost as
strong, with Ethiopia (7 percent), Rwanda (7.5
percent), Tanzania (7 percent) and Kenya (5.6
percent) all recording robust gains.
In contrast, growth for most Central African
economies registered below the regional
average, save for Congo (Brazzaville) with
growth of (9.1 percent), thanks to new oil that
came on stream, thus making it the fastest
growing economy in sub Saharan Africa in 2010.
Though growth rates in several Southern African
countries (Botswana, Malawi, Mozambique, and
Zambia) exceeded 6 percent, slower growth in
Angola, Southern Africa’s largest economy
(excluding South Africa) dampened growth for
the sub-region. South Africa, the largest
economy in the region, grew at a 2.8 percent
pace in 2010.
Growth among the large economies. South
Africa’s tepid recovery has been driven by
higher consumer spending, with business
investment lagging in the recovery. Consumer
spending has been buoyed by an accommodative
monetary policy, with the repo rate at 30-year
lows in nominal terms. The lower cost of
borrowing lent support to spending on consumer
durables, while broader consumer spending was
supported by above-inflation wage increases
gained by South Africa’s unionized workers, and
to a lesser extent the wealth effects associated
with the recovery in asset prices. Increased
government spending on infrastructure, social
sectors and wages is also providing stimulus to
the recovery. In 2010, government consumption
expenditure increased by 4.6 percent. On a more
somber note, low business confidence and long
running labor disputes caused private investment
spending to fall for a second consecutive year in
2010. Fortunately, a recovery may be underway
in 2011.
The Nigerian economy continued its robust
expansion in 2010, with growth estimated at 7.9
percent, up from 5.6 percent recorded in 2009.
Nigeria’s oil and government sectors benefitted Figure SSA.5: More than a third of countries in
Sub-Saharan Africa achieved growth rates of 6
percent and more in 2010
Source: World Bank.
0
2
4
6
8
10
12
14
16
Growth < 2% Growth 2-4% Growth 4-6% Growth 6-8% Growth >8%
No. of countries
SSA Oil Exporters
SSA Oil Importers
Figure SSA.6 Fastest growing SSA compares well
with other fast growing developing countries
Source: World Bank.
0.0 2.0 4.0 6.0 8.0 10.0 12.0
Russia
Malawi
Tanzania
Burkina Faso
Botswana
Rwanda
Brazil
Niger
Zambia
Ghana
Mozambique
Nigeria
Ethiopia
India
Congo
China
Real GDP growth (%)
133

Global Economic Prospects June 2011: RegionalAnnex
from the global jump in oil prices, as well as
from increased output due to relative calm in the
Niger Delta region following the government’s
amnesty program. However, the oil sector,
which accounts for some 16 percent of GDP,
contributed only a percentage point to the 7.9
percent surge in 2010 GDP, with the remainder
attributable to rapid growth in the non-oil sector.
The agricultural sector, which accounts for 42
percent of GDP and is the largest employer,
benefitted from favorable rains and expanded by
5.7 percent in 2010 Q3 contributing 2.4
percentage points. Productivity in the sector
remains low, however, as it is constrained by
poor market infrastructure and weak access to
basic farm inputs. Much of the dynamic sectoral
growth performance in recent years has been in
wholesale and retail trade and the services
sectors with growth rates in the double digits. In
2010 Q3, these sectors added 2 and 2.1
percentage points to GDP growth, respectively.
Growth in these dynamic sectors has been driven
by and contributed to a rising middle class. A
survey carried out by the National Bureau of
Statistics showed that, while in 1996 the average
household spent 63.6 percent of income on food,
by 2004 the share had fallen to 47.3 percent.
With per capita incomes doubling between 2004
and 2010 the food expenditure share of income
has dropped still further, implying Nigerian
households have more income to spend on
discretionary items--which helps to drive growth
in new sectors. One such sector is
telecommunications. Using the latest detailed
GDP figures available (Q3 2010), the
telecommunications sector, which accounts for
only 3.7 percent of GDP, contributed 1.3
percentage points to GDP growth (even higher
than contributions from oil).
Angola’s recovery from the crisis, unlike most
Sub Saharan African countries has lagged
behind. In 2010 it grew at 3.4%, well below its
strong pre-crisis double digit growth rates and
that of the Sub Sahara African average (4.8%).
Though oil prices rebounded in 2010, oil output
was hindered by technical delays. Further,
government spending which has helped drive
growth in the non-oil sector was curbed due to
the need to clear arrears to contractors.
Nonetheless, a pick-up is expected over the
forecast horizon. The recovery in oil prices and
government revenues helped return both the
fiscal and current account balances to healthy
surpluses in 2010 and tighter monetary policy
helped contain inflationary pressures somewhat.
Indeed, the improvements to its macroeconomic
environment supported the B+/B1 credit rating
for its long-term foreign debt issuer default
ratings from the three main international credit
rating agencies in 2010.
Kenya’s growth was stronger than expected at
5.6 percent in 2010. Good rainfall supported
harvests in the agricultural sector (including tea
and horticulture exports) and boosted electricity
and water supply. This helped to alleviate some
of the binding infrastructural constraints,
allowing Kenyan manufacturers to meet strong
demand from its faster-growing regional trading
partners in East Africa. Business and consumer
confidence was also lifted by the passage of the
new constitution. Tourist arrivals were up by
15.6 percent in the first 11 months of 2010 (year-
on-year), with tourist receipts increasing 8
percent in the same period. Strong growth in
Kenya’s other services sectors: finance,
telecommunication and real estate also provided
support to growth.
Medium-term outlook
GDP growth in Sub-Saharan Africa is expected
to remain strong in 2011 and 2012. With the
global recovery still on a firm footing; a growing
domestic middle class with discretionary
incomes to spend, and rising business confidence
in the region’s prospects, growth in Sub Saharan
Africa is expected to step-up to stronger rates in
2011 and 2012, reaching growth of 5.1 percent
and 5.8 percent, respectively (figure SSA.7).
Excluding South Africa, GDP growth in Sub-
Saharan Africa is expected to grow between 5.9
percent and 6.6 percent over the forecast
horizon, making it one of the developing regions
with the highest growth prospects over the
medium term (table SSA.4 and table SSA.5).
Prospects for large economies. Medium term
134

Global Economic Prospects June 2011: RegionalAnnex
growth prospects for South Africa point to a
strengthening economy. With the monetary
stance expected to remain accommodative,
consumer spending should continue to drive
growth. As the global recovery has taken hold,
the uncertainty that affected private investment
spending is expected to abate, allowing business
spending to increase and resume its positive
contribution to growth. As businesses demand
more labor, employment should rise and
consumer spending should strengthen. With
government fiscal policy countercyclical, the
boost to growth from increased government
spending will remain strong in 2011 but is likely
to wane thereafter. With South Africa’s economy
well integrated into the global economy the
ongoing global recovery should continue to
provide support to South Africa’s export growth,
Figure SSA.7 Growth in Sub Saharan Africa
will be among the fastest in developing regions
Source: World Bank.
0
1
2
3
4
5
6
7
8
2011 2012
Sub-Saharan Africa Ex. S.Africa East Asia and Pacific Ex. China
Europe and Central Asia (ECA) South Asia Ex. India
Latin America Middle East and N. Africa
Percent growth GDP
Table SSA.4 Saharan Africa forecast summary
Source: World Bank.
Est.
98-07a2008 2009 2010 2011 2012 2013
GDP at market prices (2005 US$) b 4.2 5.1 2.0 4.8 5.1 5.7 5.7
GDP per capita (units in US$) 1.9 3.0 0.0 2.8 3.0 3.7 3.7
PPP GDP c 4.4 5.5 2.2 4.6 5.4 5.7 5.7
Private consumption 2.3 3.8 1.3 3.9 5.1 5.3 5.3
Public consumption 5.5 8.0 4.3 6.9 5.5 5.3 5.3
Fixed investment 8.0 12.0 4.9 8.3 7.3 6.8 8.3
Exports, GNFS d 4.2 4.3 -6.5 8.3 6.5 7.2 6.5
Imports, GNFS d 6.8 7.0 -4.5 9.5 7.9 6.9 7.1
Net exports, contribution to growth -0.7 -1.1 -0.5 -0.8 -0.8 -0.3 -0.6
Current account bal/GDP (%) -0.8 -1.5 -2.8 -1.3 -1.6 -1.6 -1.5
GDP deflator (median, LCU) 6.1 10.6 4.3 6.3 5.8 6.1 6.7
Fiscal balance/GDP (%) -0.6 1.0 -5.5 -4.4 -3.2 -2.0 -1.2
Memo items: GDP
SSA excluding South Africa 4.5 6.0 4.2 6.0 5.9 6.6 6.4
Oil exporters e 4.9 6.6 4.7 6.0 5.8 6.9 6.7
CFA countries f 3.5 4.2 1.6 4.1 3.0 4.9 4.9
South Africa 3.7 3.7 -1.8 2.8 3.5 4.1 4.4
Nigeria 5.0 6.0 6.7 7.8 7.1 7.5 7.3
Kenya 3.4 1.6 2.6 5.6 4.8 5.0 5.2
(annual percent change unless indicated otherwise)
a. Growth rates over intervals are compound average; growth contributions, ratios and the GDP deflator
are averages.
b. GDP measured in constant 2005 U.S. dollars.
c. GDP measured at PPP exchange rates.
d. Exports and imports of goods and non-factor services (GNFS).
e. Oil Exporters: Angola, Cote d Ivoire, Cameroon, Congo, Rep., Gabon, Nigeria, Sudan, Chad, Congo,
Dem. Rep.
f. CFA Countries: Benin, Burkina Faso, Central African Republic, Cote d Ivoire, Cameroon, Congo,
Rep., Gabon, Equatorial Guinea, Mali, Niger, Senegal, Chad, Togo.
g. Estimate.
h. Forecast.
Forecast
135

Global Economic Prospects June 2011: RegionalAnnex
though strengthening domestic demand will
increase imports which will moderate the
contribution of net exports to GDP. Over the
forecast horizon, South Africa’s growth is
projected to accelerate to 3.5 percent in
2011,then reaching pre-crisis average growth
rates of 4.1 percent and 4.4 percent in 2012 and
2013 respectively.
Prospects for faster and sustained growth in
Nigeria appear favorable for the forecast
horizon, as underlying growth dynamics remain
robust. Consumer spending, underpinned by
increased bank lending and employment
opportunities in the consumer services sector,
will continue to drive growth. A number of
multinationals already operating in Nigeria have
announced plans to increase investments (e.g.
food giant Nestle), while new ones seek
opportunities to get a foothold in the market. In
March 2011, the Carlyle Group–a Washington
DC based Global Asset Manager-set up offices
in Lagos (and Johannesburg) to conduct buyout
and growth capital investments in Sub Saharan
Africa. A forecast of favorable rain patterns
along with selected government programs in the
agricultural sector, should continue to provide
support to farm incomes. However,
expansionary fiscal policy--if not managed
prudently--could compromise macroeconomic
stability, especially so as inflationary pressures
from food and fuel prices take hold. Over the
forecast period, Nigerian GDP is projected to
remain robust at 7.1 percent growth in 2011,
peaking at 7.5 percent in 2012 before moderating
to 7.3 percent in 2013.
Medium term growth prospects for the Angolan
economy remain strong, with real GDP projected
to grow at 6.7 percent in 2011, up from the 3.4%
recorded in 2010. Output in the oil sector is
expected to climb up to 2.1 million b/d from
1.78 million b/d on the back of new oil
production coming on stream. Further, the start
of the liquefied natural gas project should further
boost export revenues. And with much of the
clearance of contractor arrears behind, increased
public investment is expected to make a more
significant contribution to growth over the
forecast horizon. Nonetheless, much of this
investment will be capital intensive and thus
import dependent, which will reduce the overall
contribution of net exports to growth. However,
growth in the non-oil sector, will continue to be
hindered by infrastructural challenges, a weak
business regulatory environment and possible
crowding out of private sector investment by the
public sector.
And, the medium term outlook for Kenya is also
favorable, though growth in 2011 will be
undercut by recent poor rains. The ongoing
global recovery should continue to provide
support to Kenya’s agricultural exports and
tourism sector. Strong growth in its trading
partners in the East African Community, should
provide support to its manufacturing sector.
With the largest and most developed economy in
East Africa, a rising middle class and a sizeable
population (40 million people), investors are
increasingly considering Kenya as the gateway
to the rest of East Africa. This augurs well for
foreign investment flows. Investor confidence
has been reinforced by the passage of the new
constitution, though some may postpone
investments until after the 2012 elections.
Government investment in critically needed in
infrastructure, and ongoing reforms at the
Mombasa port should underpin growth
prospects. Kenya’s dynamic Information and
Communications Technology sector should also
be provided with a windfall opportunity from
increased access to higher bandwidth after the
arrival of a number of broadband fiber optic sea
cables on its coast. And developments in the ICT
sector should support productivity gains in other
sectors of the economy. Inflationary pressures
stemming from higher crude oil prices and
inadequate rainfall in the latter part of 2010
threaten to undermine growth prospects. Over
the forecast period Kenya’s growth is projected
to remain robust at 4.8 percent in 2011, rising to
5 percent in 2012 and 5.2 percent by 2013.
Projected fastest growing Sub-Saharan
African economies. Over the forecast horizon
(2011-2013), Sub-Saharan African economies
projected to be amongst the fastest growing in
the region, with growth rates averaging higher
than 6.5 percent in GDP include Ethiopia,
136

Global Economic Prospects June 2011: RegionalAnnex
Ghana, Mozambique, Nigeria, Rwanda, and
Zambia (table SSA.5).
With real GDP forecast to grow at 13.4 percent
in 2011, Ghana is projected to be the fastest
growing economy in Sub Saharan Africa, thanks
to the commencement of oil exports. Over the
medium term growth will be driven by the
nascent oil sector with production expected to
average 120,000 bpd, with the possibility of
higher output as recent new discoveries also
come on stream. Further, increased investments
in the gold mining industry and productivity
gains in its cocoa sector should further boost
export revenues. Thanks to increased business
confidence the services sector will continue to
see strong inflows of private investments,
particularly in the construction and
telecommunications sector, thereby lending
further support to growth. However, increased
macroeconomic instability remains a downside
risk.
Ethiopia’s economy is projected to grow
between 7.2 and 7.8 percent over the 2011-2013
period. Ethiopia’s growth will continue to be
driven by developments in its agricultural sector,
the largest sector in the economy. Productivity in
the sector will benefit from the support provided
to small scale farmers via the expansion of road,
power and market networks. Increased
investment flows to large scale commercial
agricultural ventures should lend further support
to the sector and the recent addition to hydro
electric power capacity should help alleviate
some of the binding constraints to growth.
However, the current double digit inflationary
environment remains a risk to growth.
Zambia is forecast to grow at 6.8 percent in
2011 thanks to developments in its mining,
agricultural and services sectors. Record high
copper prices continue to support increased
investment activity in Zambia’s copper industry,
thereby generating higher copper production and
exports. However, developments elsewhere in
the economy are also critical to Zambia’s growth
prospects, in particular, the agricultural sector,
which still remains the major employer in the
economy. The agricultural sector is benefitting
from increased output and yields thanks in part
to government support to the sector via the
provision of improved seeds and fertilizers to
farmers. Further, against the back drop of rising
incomes and low accessibility of important
services such as telecommunication and banking
services, growth in the services sector is
expected to remain strong over the forecast
horizon.
Real GDP growth in Mozambique is projected
at 7.6 percent in 2011. Mozambique is expected
to sustain its buoyant growth over the forecast
horizon as it continues to benefit from increased
investments in its mining sector. Recent
discoveries of large deposits of iron ore and
commercial quantities of natural gas offshore, in
addition to known deposits of coal, has only
added to its attraction as a mining investment
destination. Growth in Mozambique is already
being supported by ongoing mega-projects
including the Mozal aluminium smelter, the
Moatize coal mine which started production in
the second quarter of 2011, the extraction and
treatment of natural gas project by South African
petro-chemical giant Sasol, and the Irish-owned
titanium minerals dredge mine in Mona. These
investments and the exports that they generate in
the coming years will continue to drive growth
in Mozambique. However, the tightening of
monetary policy to tackle double digit inflation
rates is likely to moderate growth in 2011.
Rwanda’s strong growth is projected to continue
over the medium term, averaging about 6.9
percent over the forecast horizon, led by the
agriculture sector. Food crop production will
benefit from government support to farmers via
the provision of fertilizer, improved seeds and
extensions services. Coffee, Rwanda’s main
export, should also benefit from the strong
rebound in international coffee prices. Lower
transactions cost due to increased integration
with it’s neighbors in the East African
Community should lend further support to
growth through increased trade and investment
flows. Growth in the services sector, particularly
construction, finance and insurance, and
telecommunications is expected to be supported
137

Global Economic Prospects June 2011: RegionalAnnex
by increased private credit flows through the
forecast horizon.
Risks to the outlook
High food prices pose a risk. Prices of globally
traded food products have risen significantly
since June 2010. As of April 2011, global prices
were up by 103.2 percent for maize (year-on-
year), 74.1 percent for wheat, 94.6 percent for
Sorghum and 38.4 percent for palm oil.
However, for most Sub Saharan African
countries, food price increases were moderate for
much of 2010, and in a few countries prices
declined, thanks to favorable harvests; the local
nature of food markets in many countries in the
region; and the availability of alternate staples
(e.g. cassava) that can substitute for higher
priced internationally traded food (figure
SSA.8).
However, since November 2010 there has been a
rise in headline consumer price inflation rates
with increases in price of the food basket helping
to drive the increase. The median inflation rate
for Sub Saharan Africa increased to 4.5 percent
in December 2010 from a 10-year low 3.1
percent in August 2010. The distribution differs
across the region however. As of February 2011
24 percent of countries in the region had
inflation rates ranging between 5 and 10 percent;
and another 25 percent of countries recorded
inflation rates above 10 percent (including
Ethiopia, Nigeria, Sierra Leone, Guinea, and
Mozambique).
The persistence of food price increases could
have negative consequences, including
deterioration in the current account and fiscal
balances of net food importing Sub-Saharan
African countries; as well as higher levels of
poverty and malnutrition, with the possibility of
unrest in some countries--all of which would cut
into growth prospects for the region. The
moderate food price increases in 2010 were also
helped by the fact that compared to other
internationally traded food products, the rise in
the price of rice was limited. Given the high
import content of domestic consumption of rice
in most Sub-Saharan African countries, and as a
consequence a much higher pass through of
international price changes, if rice prices were to
go up more significantly in 2011, this could pose
an important threat to food security, even if for
some countries this would be moderated by
substitution to other staples. Further, if current
forecasts of drought conditions in parts of
Southern and Eastern Africa come to pass, this
will serve to cut back on agriculture output and
accentuate the rise in food prices. In some
countries the impact of drought will go beyond
its effects on food prices, but could impact
hydroelectric generation (e.g. Kenya), in an
environment in where businesses already
consider power supply to be a binding constraint.
Rise in oil prices represents another risk to
macro stability. Another price increase of
concern is the rise in oil prices. As of April
2011, crude oil prices had risen by 38 percent
compared to a year earlier. The result of this
increase in price on Sub Saharan African
countries is mixed, as the region comprises both
net oil exporters and importers. If oil prices are
to persist at high levels through 2011, oil
exporters in the region will see an improvement
in their current account and fiscal balances.
Indeed, given the pre-dominance of oil in the
economy of Sub Saharan African oil exporters—
in both Angola and Congo the oil sector
accounts for over 90 percent of exports and over
60 percent of GDP—should oil prices remain at
Figure SSA.8 Inflation levels remain below 10
percent for most Sub-Saharan African countries
Source: World Bank.
0
2
4
6
8
10
12
14
Inflation <0%
Inflation 0-5%
Inflation 5-10%
Inflation 10-15%
Inflation >15%
Food price inflation
Consumer price inflation
(number of countries)
138

Global Economic Prospects June 2011: RegionalAnnex
their February levels current account balances
could improve by as much as 7 percent of GDP.
This could also pose a macroeconomic
challenge, since if not managed well, could lead
to a ―Dutch Disease‖ effect, thereby making
more difficult the ability to diversify the
economy.
The downside risks to oil importers in the region
are however, greater. With countries facing an
increased oil import bill, and given that oil
imports are about 18 percent of total
merchandise imports among Sub Saharan Africa
oil importers, this could lead to a deterioration in
the current account to GDP ratio by about 0.5
percent (excluding South Africa), if the February
level of prices are sustained. However, were
prices to increase even further, by an additional
$50 from their February highs, current account
balances would deteriorate even further, by as
much as 3.5 percent of GDP. Fiscal balances
could also deteriorate depending on the degree of
petroleum subsidies provided by governments.
And depending on the exchange rate regime,
deterioration in current account balances could
lead to depreciation of the nominal exchange
rate, thereby bringing a further bout of
inflationary pressures to bear. Higher inflation
rates are also likely to prompt further monetary
tightening, which could limit credit expansion in
an already credit-constrained environment. For
instance, in both March and May, Kenya’s
Central Bank raised its key interest rate by 25
basis points, the first interest rate hikes since
June 2008, on account of rising inflation and the
depreciation of the shilling to close to a six and
half year low. Other countries in the region to
have hiked up interest rates in 2011 include
Mozambique and Nigeria. According to World
Bank estimates, if the current high oil prices
were to increase an additional $50/bbl this could
shave between 0.3 percent and 1 percent from
GDP growth in Sub Saharan Africa.
Political risks associated with elections in 2011. Over the forecast horizon, elections are
scheduled to be carried out in at least a third of
Sub-Saharan African countries. Though the past
decade has seen an increasing number of smooth
transitions of power in many countries in the
region, there still remain a number of instances
where political developments, leading to
elections and in its aftermath, have been a
deterrent to economic activity. In 2010, growth
prospects in Madagascar, Comoros, Cote
d’Ivoire and Guinea were affected adversely by
political unrests. Hence the evolution of the
political cycle over the forecast horizon will be
consequential to individual country growth
outcomes. As of June 2011, six presidential
elections had been carried out, none of which
created disruptions to economic activity.
However, the turmoil in Cote D’Ivoire which
escalated in 2011 is likely to have led to negative
growth in the first two quarters of 2011.
139

Global Economic Prospects June 2011: RegionalAnnex
Table SSA.5 Sub-Saharan Africa country forecasts
Est.
98-07a2008 2009 2010 2011 2012 2013
Angola
GDP at market prices (2005 US$) b 9.5 13.3 2.4 3.4 6.7 8.1 7.8
Current account bal/GDP (%) -0.9 8.5 -10.0 -1.7 4.0 7.4 9.9
Benin
GDP at market prices (2005 US$) b 3.8 5.1 2.7 2.5 3.4 4.3 4.8
Current account bal/GDP (%) -7.7 -9.3 -9.2 -10.6 -14.8 -12.4 -7.2
Botswana
GDP at market prices (2005 US$) b 4.7 3.1 -4.9 7.2 6.5 5.9 4.9
Current account bal/GDP (%) 9.2 3.5 -4.5 -6.2 -3.1 2.7 7.8
Burkina Faso
GDP at market prices (2005 US$) b 4.8 5.0 3.2 7.9 5.2 5.6 6.0
Current account bal/GDP (%) -14.0 -24.8 -19.5 -21.3 -19.8 -18.9 -18.0
Burundi
GDP at market prices (2005 US$) b 1.8 4.5 3.5 3.9 4.1 4.6 4.8
Current account bal/GDP (%) -20.5 -30.2 -16.0 -14.6 -15.1 -14.0 -12.9
Cape Verde
GDP at market prices (2005 US$) b 5.9 6.5 2.8 4.7 5.8 6.6 6.6
Current account bal/GDP (%) -10.8 -13.4 -9.9 -14.9 -11.8 -18.2 -24.3
Cameroon
GDP at market prices (2005 US$) b 3.4 2.9 2.0 2.8 3.8 4.1 4.6
Current account bal/GDP (%) -2.4 -1.9 -5.1 -3.8 -2.7 -3.2 -3.3
Central African Republic
GDP at market prices (2005 US$) b 0.8 2.2 2.4 3.0 3.3 3.3 3.3
Current account bal/GDP (%) -4.6 -9.7 -7.9 -9.0 -8.0 -7.9 -7.0
Chad
GDP at market prices (2005 US$) b 8.0 -0.4 -1.6 5.1 6.0 6.0 4.0
Current account bal/GDP (%) -36.5 -19.8 -28.9 -24.1 -14.3 -12.7 -5.4
Comoros
GDP at market prices (2005 US$) b 1.9 1.0 1.8 1.7 2.3 2.3 2.3
Current account bal/GDP (%) -4.0 -10.5 -5.9 -8.5 -9.1 -10.0 -10.3
Congo, Dem. Rep.
GDP at market prices (2005 US$) b 1.9 6.2 2.8 7.3 6.5 6.0 8.0
Current account bal/GDP (%) -3.6 -17.5 -10.5 -6.8 -2.8 -0.7 0.6
Congo, Rep.
GDP at market prices (2005 US$) b 2.9 5.6 7.6 9.1 7.8 5.4 4.9
Current account bal/GDP (%) 1.2 1.2 -10.6 3.7 9.5 6.6 6.1
Cote d Ivoire
GDP at market prices (2005 US$) b 0.0 2.2 3.6 3.0 -6.0 4.9 5.5
Current account bal/GDP (%) 0.7 1.9 7.2 6.7 -1.5 0.6 -0.8
Equatorial Guinea
GDP at market prices (2000 USD) 2 20.7 11.3 -5.4 0.9 2.8 4.0 4.0
Current account bal/GDP (%) 6.7 10.1 -20.0 -6.7 -10.7 -8.6 -6.9
Eritrea
GDP at market prices (2005 US$) b -0.1 -9.8 3.6 2.7 3.4 3.5 3.5
Current account bal/GDP (%) -19.0 -5.2 -6.5 -2.5 -2.7 -3.2 -3.4
Ethiopia
GDP at market prices (2005 US$) b 6.5 10.8 8.8 8.1 7.7 7.2 7.8
Current account bal/GDP (%) -5.3 -7.0 -5.1 -6.8 -7.7 -8.8 -9.6
Gabon
GDP at market prices (2005 US$) b 0.4 2.3 -1.0 5.1 6.0 5.1 4.1
Current account bal/GDP (%) 10.9 22.2 13.3 12.3 16.1 13.1 12.2
Gambia, The
GDP at market prices (2005 US$) b 4.6 6.1 4.6 4.8 5.0 5.0 5.0
Current account bal/GDP (%) -9.5 -6.1 4.0 3.1 3.1 2.9 2.7
Ghana
GDP at market prices (2005 US$) b 4.6 8.4 4.7 7.7 13.4 10.0 8.0
Current account bal/GDP (%) -6.4 -12.4 -3.6 -7.7 -6.3 -4.9 -4.0
Guinea
GDP at market prices (2005 US$) b 2.8 4.9 -0.3 3.5 4.3 4.5 4.7
Current account bal/GDP (%) -6.0 -31.9 -10.4 -8.9 -7.6 -7.4 -7.1
Guinea-Bissau
GDP at market prices (2005 US$) b 1.5 3.5 3.0 3.4 3.9 3.9 3.9
Current account bal/GDP (%) -7.2 -11.0 -8.5 -9.4 -9.8 -9.2 -8.9
Kenya
GDP at market prices (2005 US$) b 3.4 1.6 2.6 5.6 4.8 5.0 5.2
Current account bal/GDP (%) -4.9 -6.6 -5.7 -7.8 -9.9 -7.7 -7.1
Lesotho
GDP at market prices (2005 US$) b 2.8 4.5 0.9 2.4 3.1 4.0 3.8
Current account bal/GDP (%) -12.9 12.6 -2.4 -22.4 -19.5 -19.5 -19.3
Madagascar
GDP at market prices (2005 US$) b 3.2 7.1 -3.7 0.7 2.6 3.9 3.9
Current account bal/GDP (%) -9.5 -17.4 -15.2 -13.8 -12.7 -11.2 -9.7
Malawi
GDP at market prices (2005 US$) b 2.8 8.6 7.6 6.6 6.1 5.7 5.5
Current account bal/GDP (%) -4.7 -7.1 -9.6 -2.7 -4.7 -5.1 -5.5
Mali
GDP at market prices (2005 US$) b 5.1 4.9 4.3 5.0 5.8 5.9 5.9
Current account bal/GDP (%) -7.9 -12.2 -14.1 -15.2 -15.4 -15.8 -15.8
(annual percent change unless indicated otherwise) Forecast
140

Global Economic Prospects June 2011: RegionalAnnex
Notes:
1. Peter Guests, ―Resource Deals to Africa‖, in
This is Africa, Financial Times Business,
April/May 2011.
2. ―Who’s investing in Africa‖, Ai, November-
December 2010, Vol. 8 issue 6.
3. Gail Mwamba, ―Structuring Local
Solutions‖, in This is Africa, Financial
Times Business, April/May 2011.
4. World Bank (2008). World Development
Report: Agriculture for Development, World
Bank, Washington DC.
5. Calestous Juma. ―Growing the economy‖, in
The New Harvests. Oxford University Press.
Transforming Africa’s Role in the Global
Food Security System. Address by H.E. Mr
Kofi A. Annan, Chair of the Alliance for a
Green revolution in Africa, London 30
March 2011.
6. Address by H.E. Mr Kofi A. Annan, Chair
of the Alliance for a Green revolution in
Africa, London 30 March 2011.
Source: World Bank.
Est.
98-07a2008 2009 2010 2011 2012 2013
Mauritania
GDP at market prices (2005 US$) b 4.1 3.7 -1.1 4.9 6.0 6.3 5.4
Current account bal/GDP (%) -5.8 -12.6 -13.2 -10.6 -11.6 -12.1 -12.7
Mauritius
GDP at market prices (2005 US$) b 3.6 5.1 3.0 4.3 4.1 4.2 4.3
Current account bal/GDP (%) -1.3 -10.5 -9.5 -13.1 -12.3 -11.5 -10.5
Mozambique
GDP at market prices (2005 US$) b 6.8 6.7 6.3 6.6 7.6 7.7 7.7
Current account bal/GDP (%) -14.6 -12.0 -12.0 -13.7 -12.0 -10.9 -9.9
Namibia
GDP at market prices (2005 US$) b 4.4 4.3 -0.8 4.6 4.0 4.8 4.5
Current account bal/GDP (%) 4.0 0.5 -1.2 -7.2 -1.8 2.1 6.3
Niger
GDP at market prices (2005 US$) b 2.7 9.5 1.0 7.5 6.0 8.5 6.8
Current account bal/GDP (%) -7.4 -12.2 -18.9 -19.3 -19.7 -17.1 -14.7
Nigeria
GDP at market prices (2005 US$) b 5.0 6.0 6.7 7.8 7.1 7.5 7.3
Current account bal/GDP (%) 11.0 13.8 12.4 13.5 12.7 11.6 10.3
Rwanda
GDP at market prices (2005 US$) b 6.8 11.2 4.1 7.5 7.0 6.8 7.0
Current account bal/GDP (%) -6.0 -5.4 -7.3 -5.9 -5.6 -5.1 -4.7
Senegal
GDP at market prices (2005 US$) b 4.0 3.3 2.2 3.2 4.2 4.4 4.4
Current account bal/GDP (%) -7.0 -14.3 -12.9 -14.0 -14.2 -14.9 -15.5
Seychelles
GDP at market prices (2005 US$) b 2.1 -0.9 -7.6 3.5 4.0 5.0 5.0
Current account bal/GDP (%) -16.4 -44.0 -37.2 -39.5 -23.1 -16.7 -10.3
Sierra Leone
GDP at market prices (2005 US$) b 7.5 5.5 3.2 5.8 5.6 5.9 6.0
Current account bal/GDP (%) -12.2 -15.3 -15.0 -14.3 -14.7 -13.6 -12.5
South Africa
GDP at market prices (2005 US$) b 3.7 3.7 -1.8 2.8 3.5 4.1 4.4
Current account bal/GDP (%) -2.1 -7.1 -4.1 -2.8 -3.2 -3.8 -4.4
Sudan
GDP at market prices (2005 US$) b 6.3 6.8 4.5 5.5 5.3 5.8 5.8
Current account bal/GDP (%) -7.1 -2.3 -7.1 -3.0 -7.8 -7.9 -7.9
Swaziland
GDP at market prices (2005 US$) b 3.1 2.4 1.2 2.0 0.5 1.5 2.0
Current account bal/GDP (%) -1.3 -8.1 -13.8 -14.5 -14.2 -13.6 -12.5
Tanzania
GDP at market prices (2005 US$) b 5.9 7.4 6.0 7.0 6.5 6.9 6.7
Current account bal/GDP (%) -5.7 -13.0 -8.5 -8.7 -9.1 -10.1 -11.3
Togo
GDP at market prices (2005 US$) b 1.8 1.8 3.2 3.4 3.7 4.0 4.1
Current account bal/GDP (%) -9.5 -7.7 -5.3 -5.7 -4.3 -4.6 -4.7
Uganda
GDP at market prices (2005 US$) b 7.0 8.7 7.1 5.2 6.4 6.6 7.0
Current account bal/GDP (%) -5.4 -9.1 -6.6 -9.7 -11.9 -15.8 -12.1
Zambia
GDP at market prices (2005 US$) b 4.2 5.8 6.4 7.6 6.8 6.7 6.0
Current account bal/GDP (%) -13.7 -9.5 -5.5 -3.7 -3.6 -3.0 -2.4
World Bank forecasts are frequently updated based on new information and changing (global)
circumstances. Consequently, projections presented here may differ from those contained in other
Bank documents, even if basic assessments of countries’ prospects do not significantly differ at any
given moment in time.
Liberia, Somalia, Sao Tome and Principe are not forecast owing to data limitations.
a. Growth rates over intervals are compound average; growth contributions, ratios and the GDP deflator
are averages.
b. GDP measured in constant 2005 U.S. dollars.
c. Estimate.
d. Forecast.
Forecast(annual percent change unless indicated otherwise)
141