global construction markets trends & prospects · pdf filefirst for global construction...
TRANSCRIPT
FIRST FOR GLOBAL CONSTRUCTION INFORMATION www.khl.com
GLOBAL CONSTRUCTION MARKETS –
TRENDS & PROSPECTS
Chris Sleight,
Editor
International Construction
FIRST FOR GLOBAL CONSTRUCTION INFORMATION www.khl.com
CONTENTS
• Global economic picture
• Global construction outlook
• Global industry ‘health’
• Europe in depth
• Summary
FIRST FOR GLOBAL CONSTRUCTION INFORMATION www.khl.com
ECONOMIC FORECASTS – WHY BOTHER?
• The numbers are never right!
• Hard to interpret
• Can’t take account of unexpected events
– Lehman Bros., European debt crisis, Arab Spring
• Can be politicised/biased
FIRST FOR GLOBAL CONSTRUCTION INFORMATION www.khl.com
BUT...
• Do we expect too much from forecasters?
– No-one predicted the Lehman collapse etc.
– Some things you just can’t forecast for
• The trend is often right, even if the details are inaccurate
• What are the alternatives?
– Poor forecasts are better than no forecasts
FIRST FOR GLOBAL CONSTRUCTION INFORMATION www.khl.com
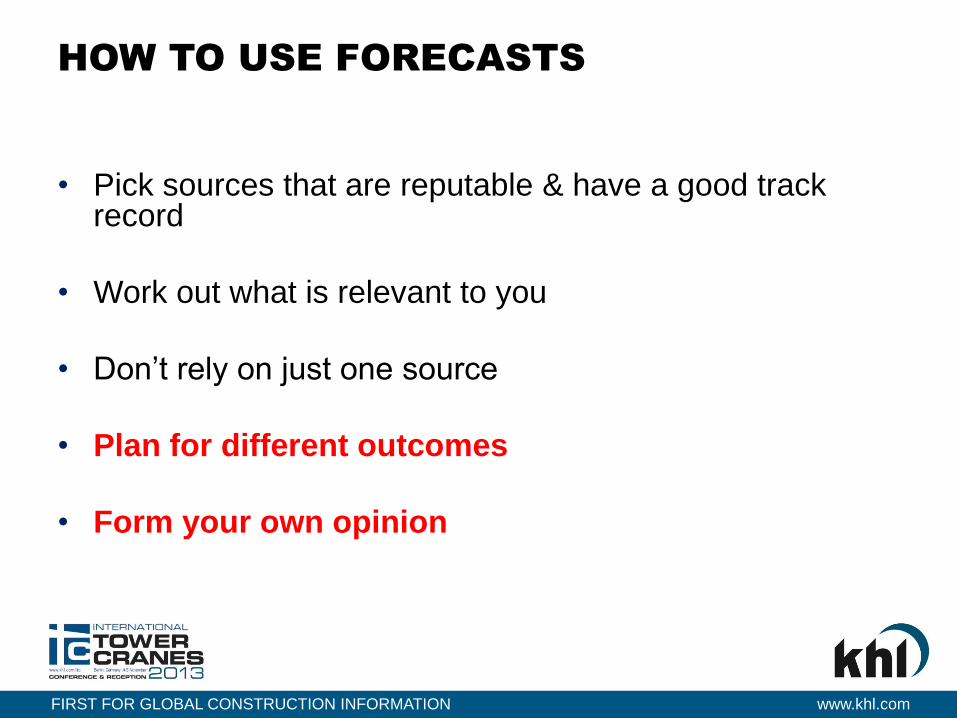
HOW TO USE FORECASTS
• Pick sources that are reputable & have a good track record
• Work out what is relevant to you
• Don’t rely on just one source
• Plan for different outcomes
• Form your own opinion
FIRST FOR GLOBAL CONSTRUCTION INFORMATION www.khl.com
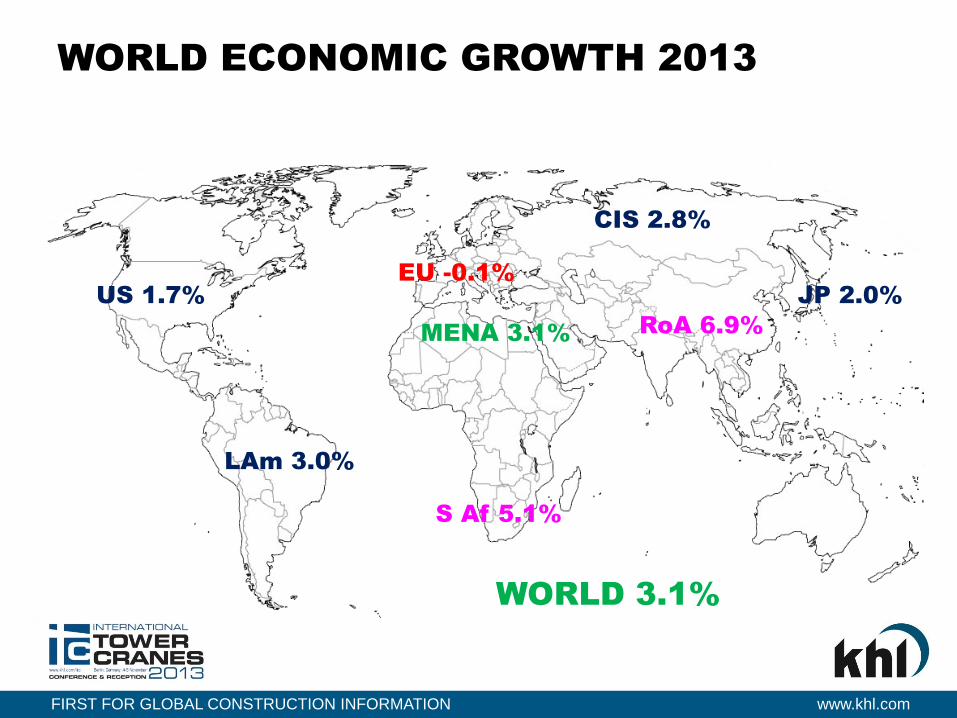
WORLD ECONOMIC GROWTH 2013
EU -0.1%
US 1.7%
LAm 3.0%
MENA 3.1%
S Af 5.1%
CIS 2.8%
JP 2.0%
RoA 6.9%
WORLD 3.1%
FIRST FOR GLOBAL CONSTRUCTION INFORMATION www.khl.com
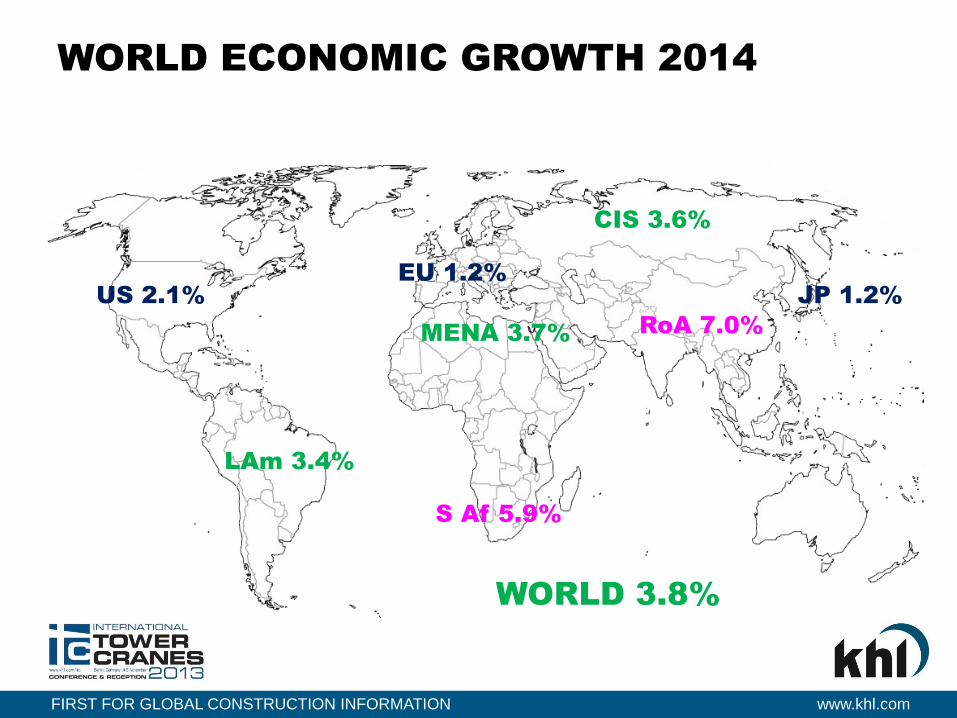
WORLD ECONOMIC GROWTH 2014
EU 1.2%
US 2.1%
LAm 3.4%
MENA 3.7%
S Af 5.9%
CIS 3.6%
JP 1.2%
RoA 7.0%
WORLD 3.8%
FIRST FOR GLOBAL CONSTRUCTION INFORMATION www.khl.com
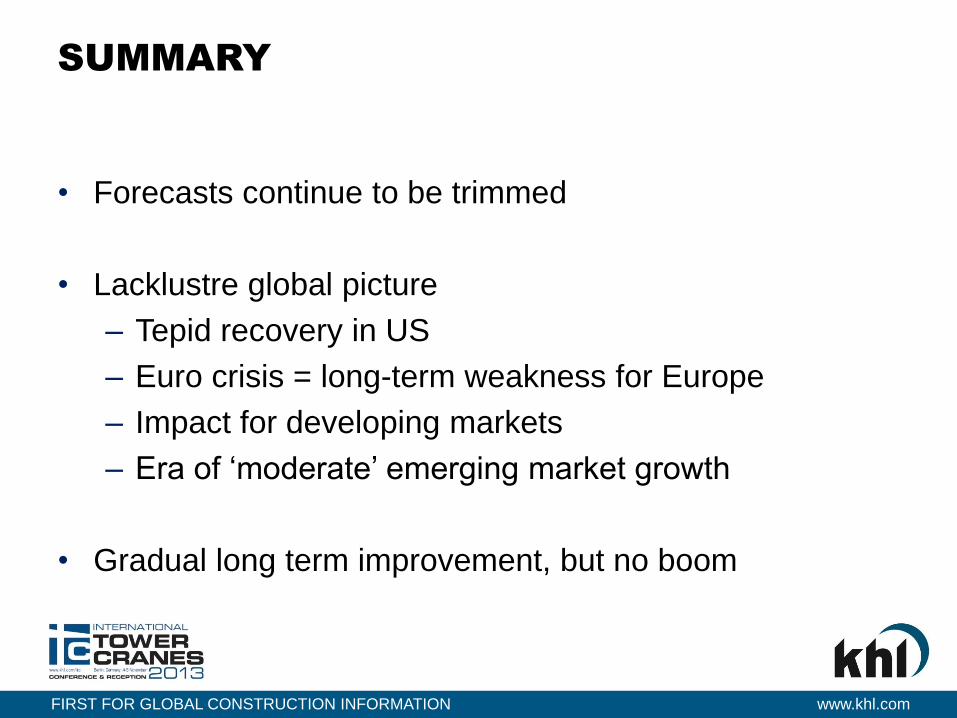
SUMMARY
• Forecasts continue to be trimmed
• Lacklustre global picture
– Tepid recovery in US
– Euro crisis = long-term weakness for Europe
– Impact for developing markets
– Era of ‘moderate’ emerging market growth
• Gradual long term improvement, but no boom
FIRST FOR GLOBAL CONSTRUCTION INFORMATION www.khl.com
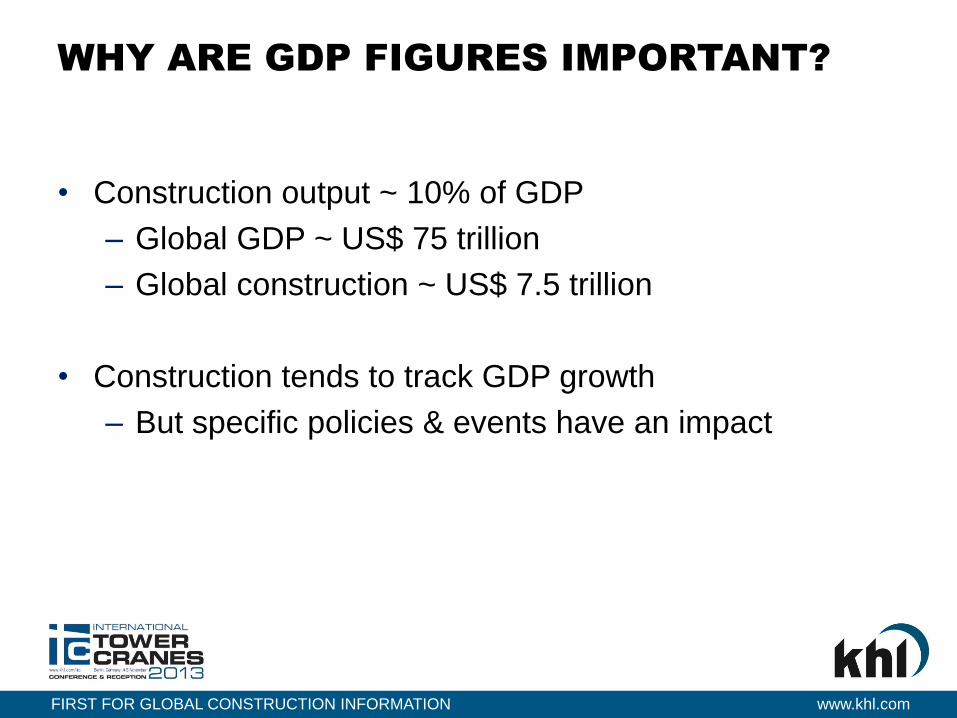
WHY ARE GDP FIGURES IMPORTANT?
• Construction output ~ 10% of GDP
– Global GDP ~ US$ 75 trillion
– Global construction ~ US$ 7.5 trillion
• Construction tends to track GDP growth
– But specific policies & events have an impact
FIRST FOR GLOBAL CONSTRUCTION INFORMATION www.khl.com
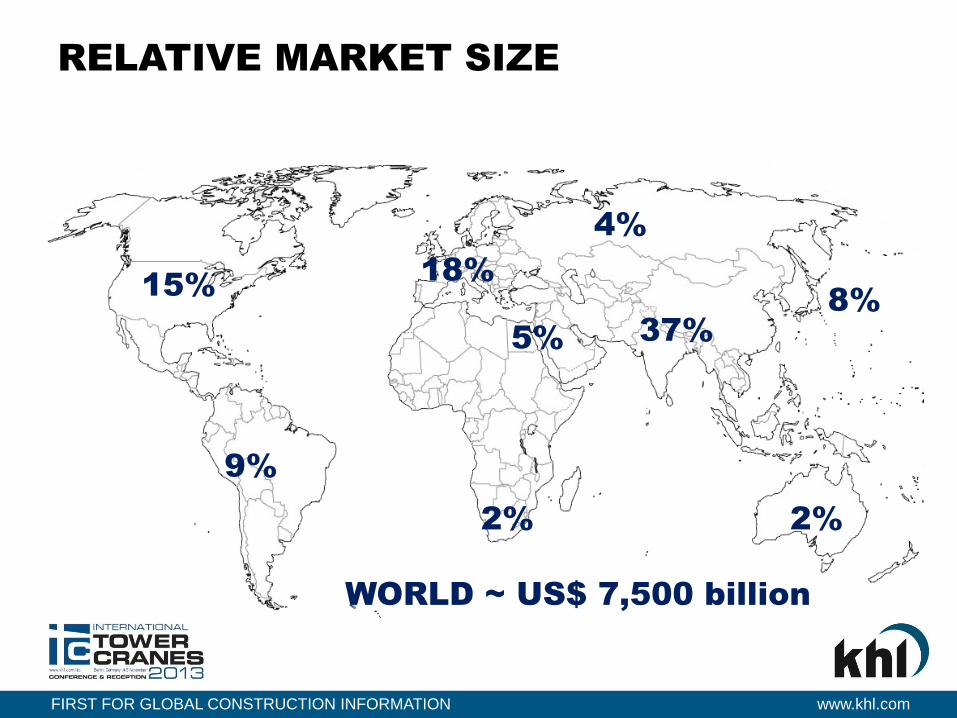
RELATIVE MARKET SIZE
18% 15%
9%
5%
2%
4%
8%
37%
WORLD ~ US$ 7,500 billion
2%
FIRST FOR GLOBAL CONSTRUCTION INFORMATION www.khl.com
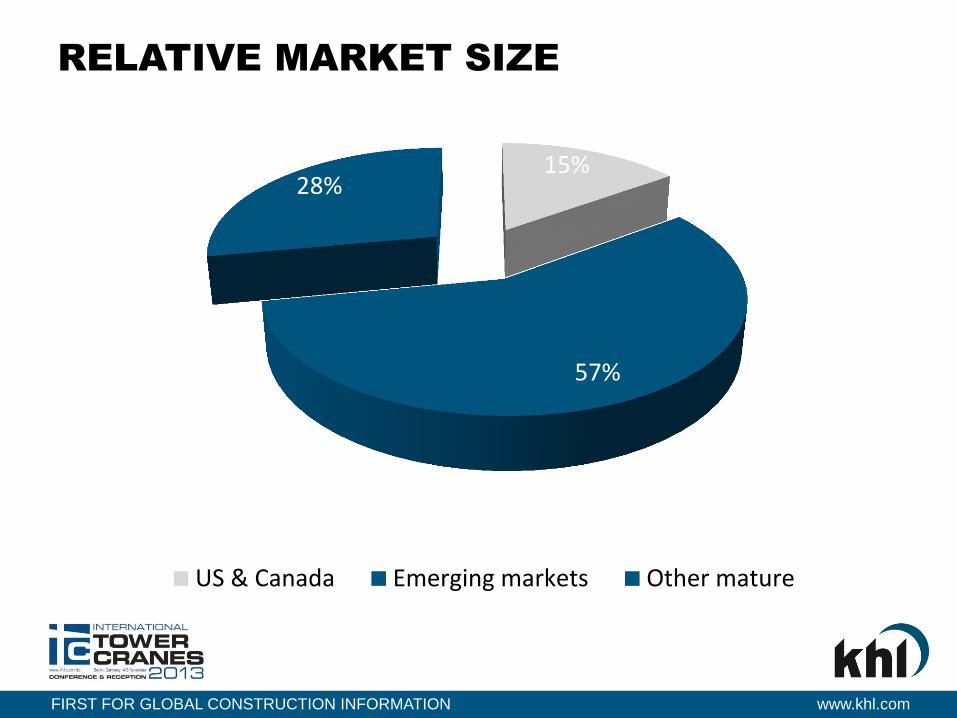
RELATIVE MARKET SIZE
15%
57%
28%
US & Canada Emerging markets Other mature
FIRST FOR GLOBAL CONSTRUCTION INFORMATION www.khl.com
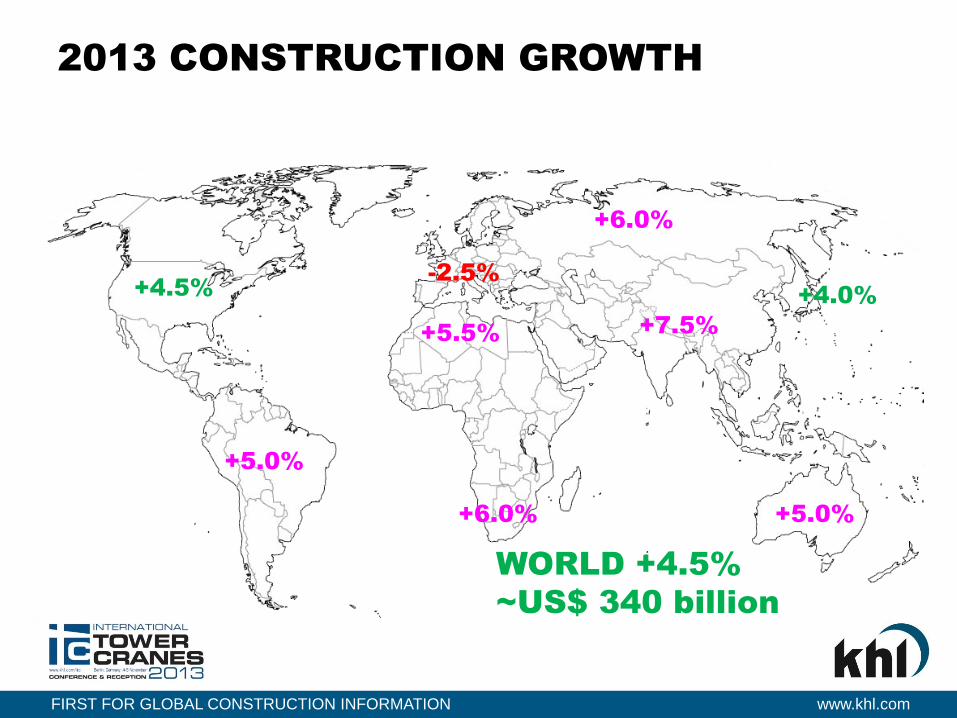
2013 CONSTRUCTION GROWTH
-2.5% +4.5%
+5.0%
+5.5%
+6.0%
+6.0%
+4.0%
+7.5%
WORLD +4.5%
~US$ 340 billion
+5.0%
FIRST FOR GLOBAL CONSTRUCTION INFORMATION www.khl.com
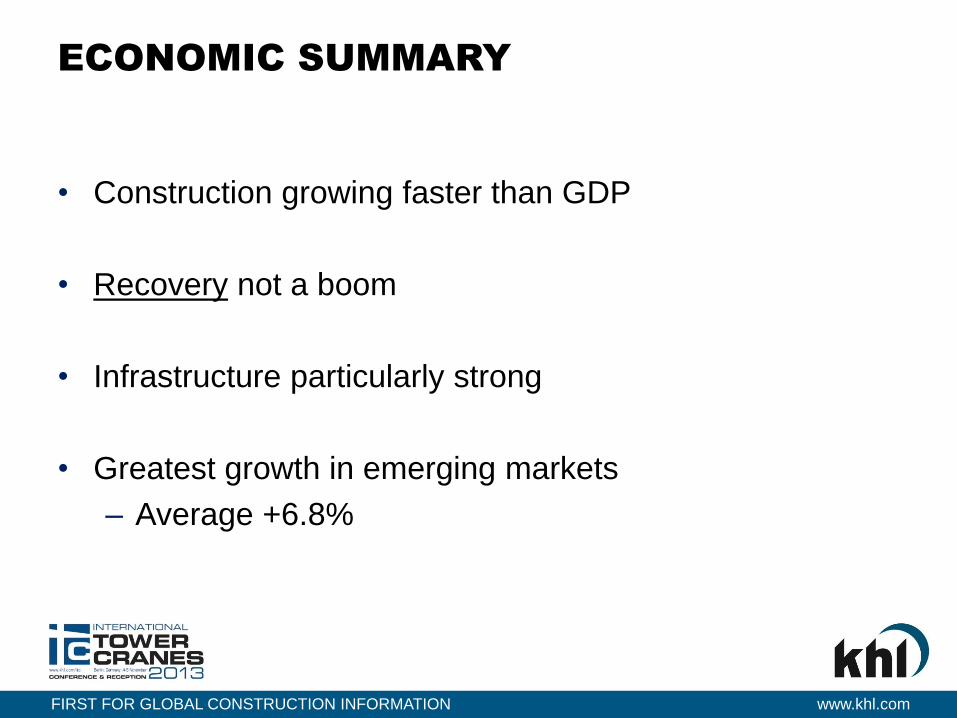
ECONOMIC SUMMARY
• Construction growing faster than GDP
• Recovery not a boom
• Infrastructure particularly strong
• Greatest growth in emerging markets
– Average +6.8%
FIRST FOR GLOBAL CONSTRUCTION INFORMATION www.khl.com
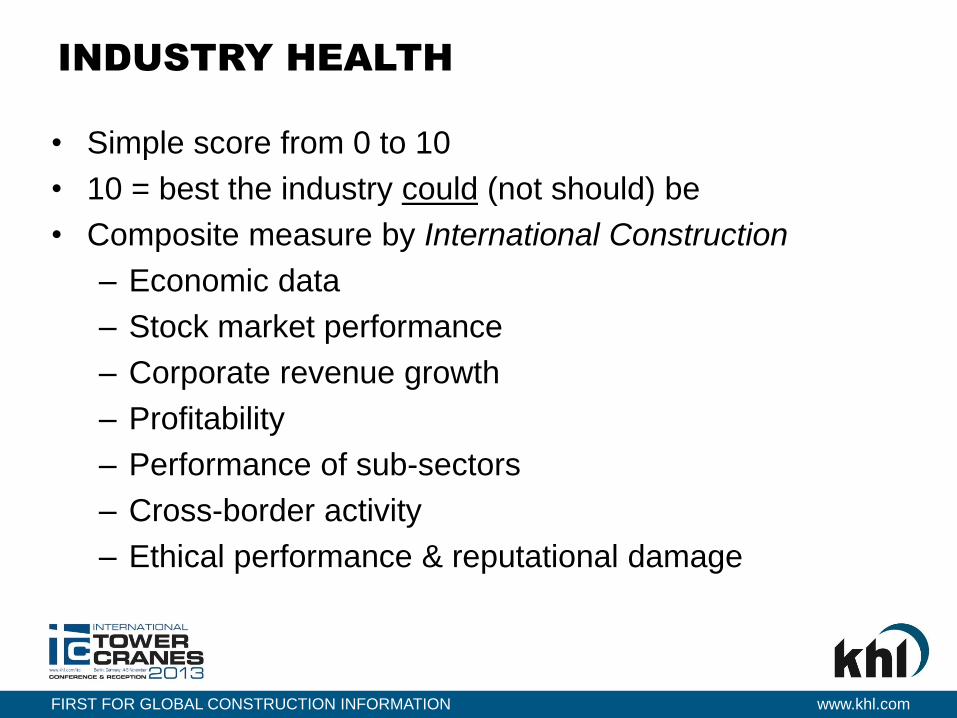
INDUSTRY HEALTH
• Simple score from 0 to 10
• 10 = best the industry could (not should) be
• Composite measure by International Construction
– Economic data
– Stock market performance
– Corporate revenue growth
– Profitability
– Performance of sub-sectors
– Cross-border activity
– Ethical performance & reputational damage
FIRST FOR GLOBAL CONSTRUCTION INFORMATION www.khl.com
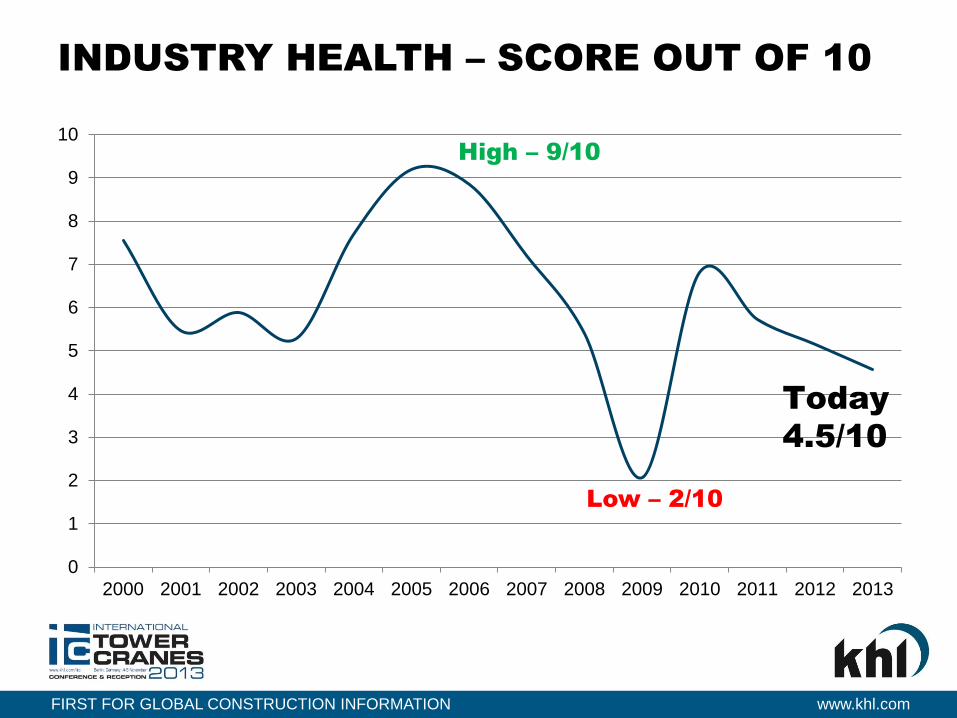
INDUSTRY HEALTH – SCORE OUT OF 10
0
1
2
3
4
5
6
7
8
9
10
2000 2001 2002 2003 2004 2005 2006 2007 2008 2009 2010 2011 2012 2013
Low – 2/10
Today
4.5/10
High – 9/10
FIRST FOR GLOBAL CONSTRUCTION INFORMATION www.khl.com
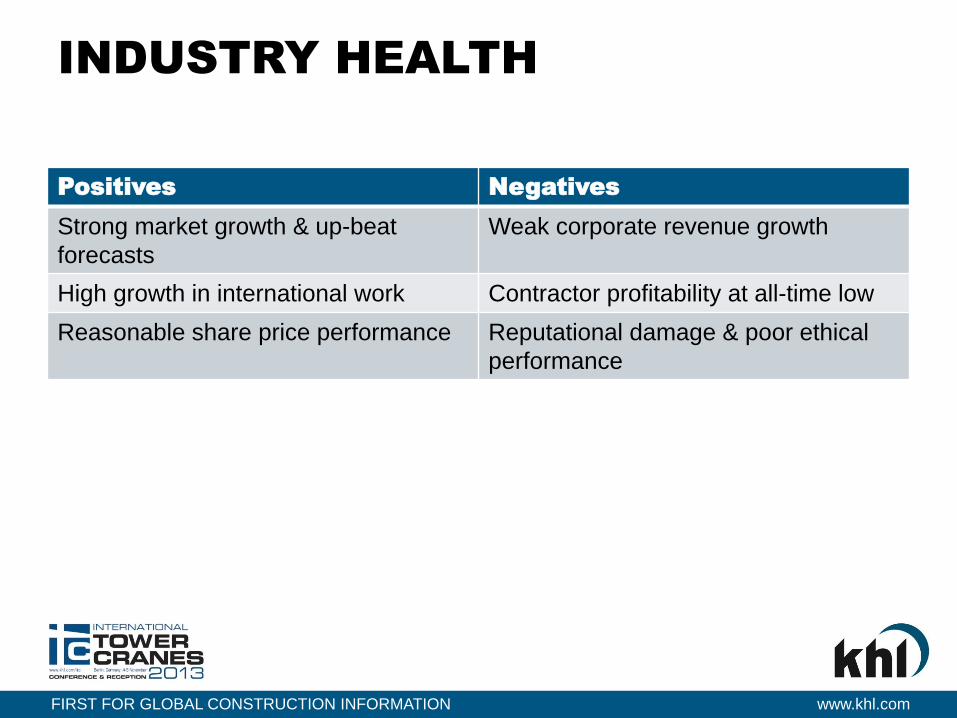
INDUSTRY HEALTH
Positives Negatives
Strong market growth & up-beat
forecasts
Weak corporate revenue growth
High growth in international work Contractor profitability at all-time low
Reasonable share price performance Reputational damage & poor ethical
performance
FIRST FOR GLOBAL CONSTRUCTION INFORMATION www.khl.com
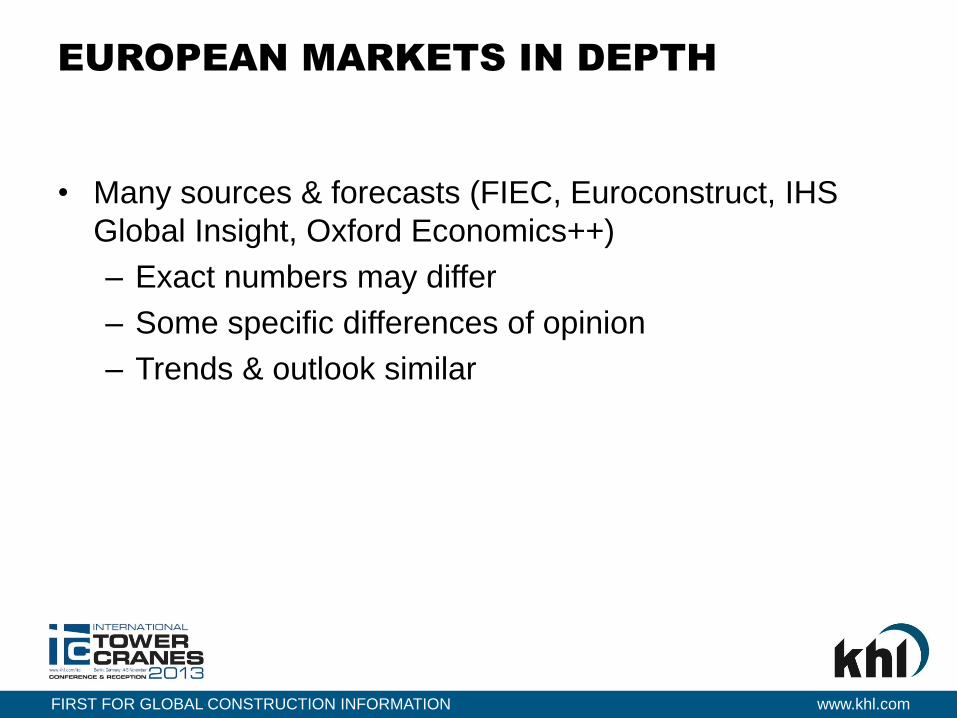
EUROPEAN MARKETS IN DEPTH
• Many sources & forecasts (FIEC, Euroconstruct, IHS
Global Insight, Oxford Economics++)
– Exact numbers may differ
– Some specific differences of opinion
– Trends & outlook similar
FIRST FOR GLOBAL CONSTRUCTION INFORMATION www.khl.com
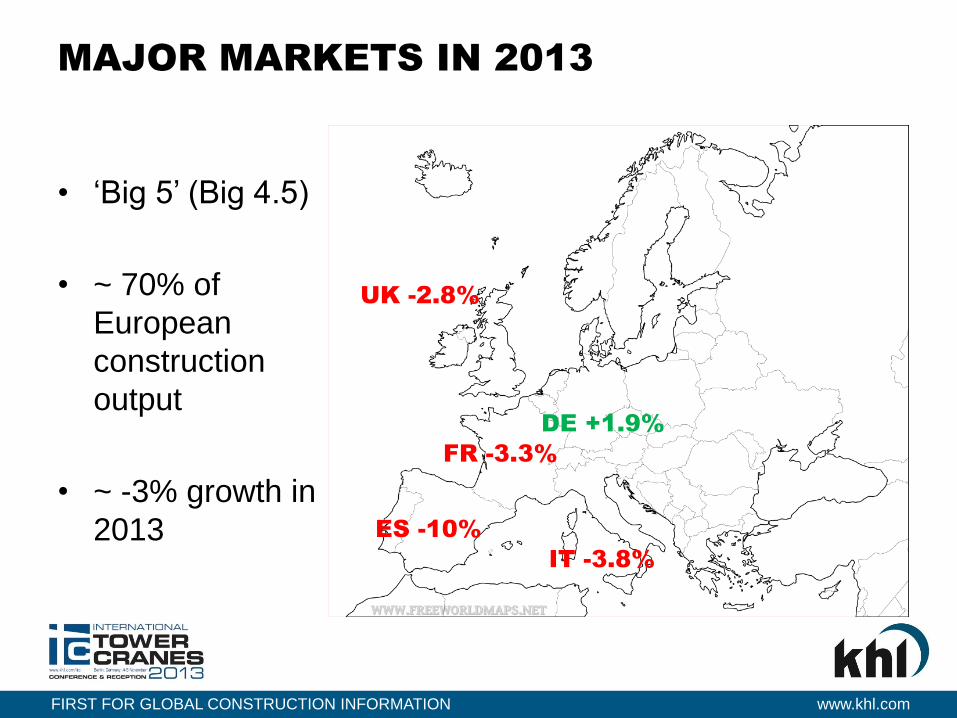
MAJOR MARKETS IN 2013
UK -2.8%
IT -3.8%
FR -3.3%
ES -10%
• ‘Big 5’ (Big 4.5)
• ~ 70% of
European
construction
output
• ~ -3% growth in
2013
DE +1.9%
FIRST FOR GLOBAL CONSTRUCTION INFORMATION www.khl.com
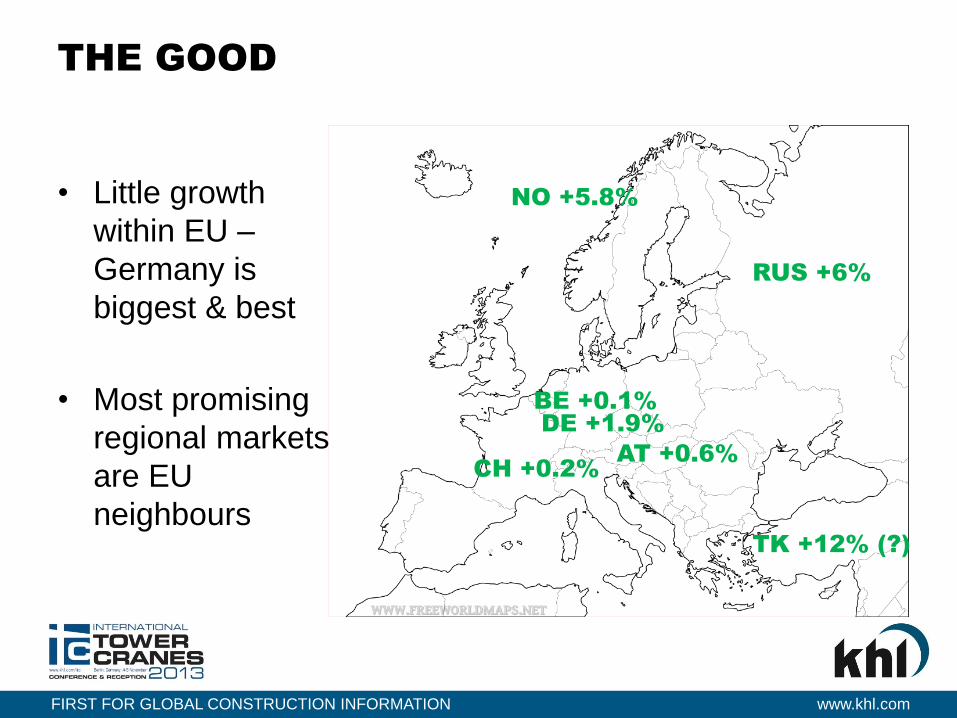
THE GOOD
DE +1.9%
• Little growth
within EU –
Germany is
biggest & best
• Most promising
regional markets
are EU
neighbours
NO +5.8%
AT +0.6%
TK +12% (?)
RUS +6%
BE +0.1%
CH +0.2%
FIRST FOR GLOBAL CONSTRUCTION INFORMATION www.khl.com
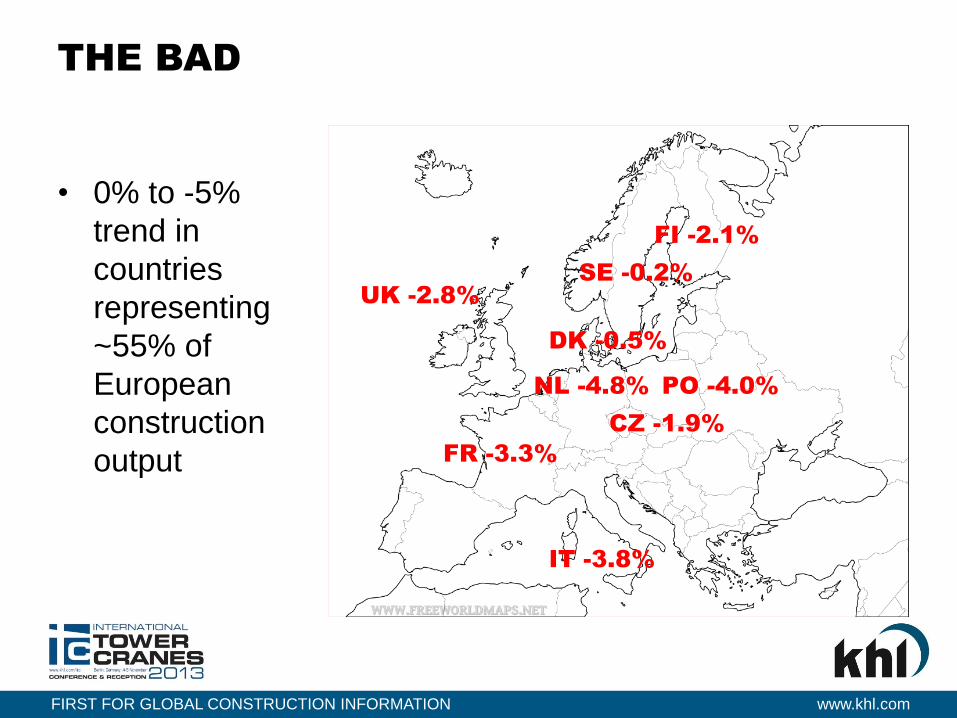
THE BAD
UK -2.8%
IT -3.8%
FR -3.3%
• 0% to -5%
trend in
countries
representing
~55% of
European
construction
output
SE -0.2%
FI -2.1%
PO -4.0%
CZ -1.9%
NL -4.8%
DK -0.5%
FIRST FOR GLOBAL CONSTRUCTION INFORMATION www.khl.com
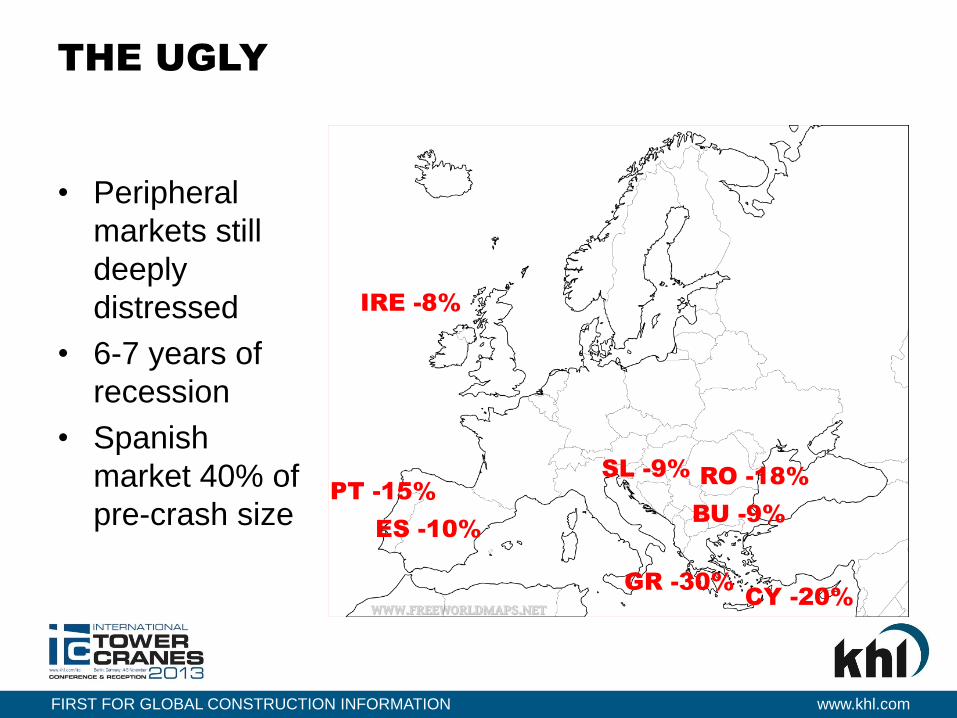
THE UGLY
IRE -8%
ES -10%
• Peripheral
markets still
deeply
distressed
• 6-7 years of
recession
• Spanish
market 40% of
pre-crash size
CY -20%
PT -15%
GR -30%
RO -18%
BU -9%
SL -9%
FIRST FOR GLOBAL CONSTRUCTION INFORMATION www.khl.com
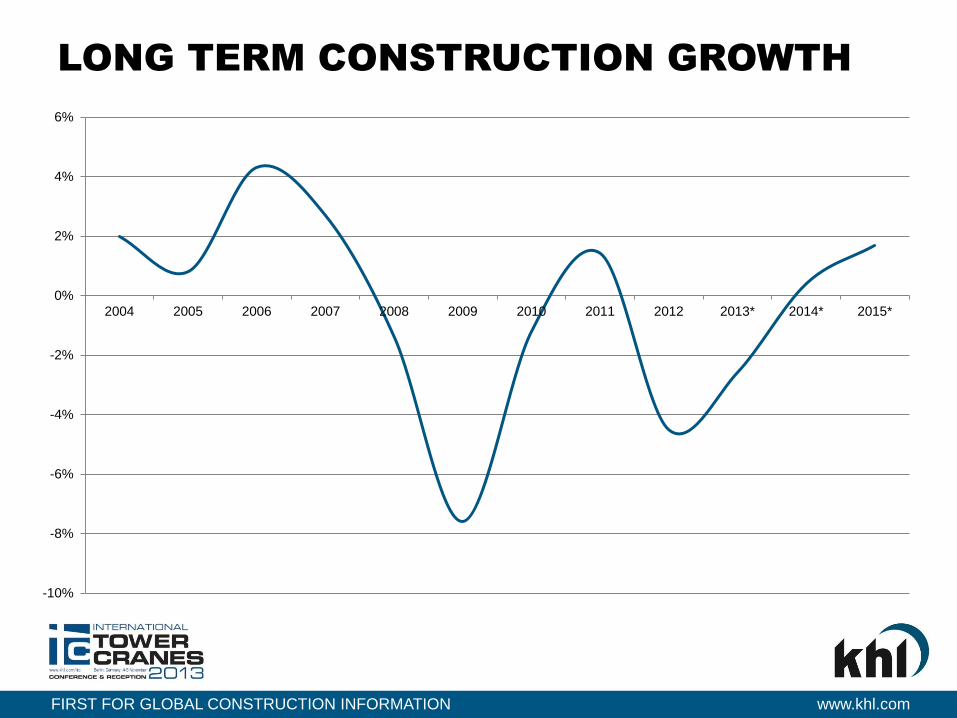
LONG TERM CONSTRUCTION GROWTH
-10%
-8%
-6%
-4%
-2%
0%
2%
4%
6%
2004 2005 2006 2007 2008 2009 2010 2011 2012 2013* 2014* 2015*
FIRST FOR GLOBAL CONSTRUCTION INFORMATION www.khl.com
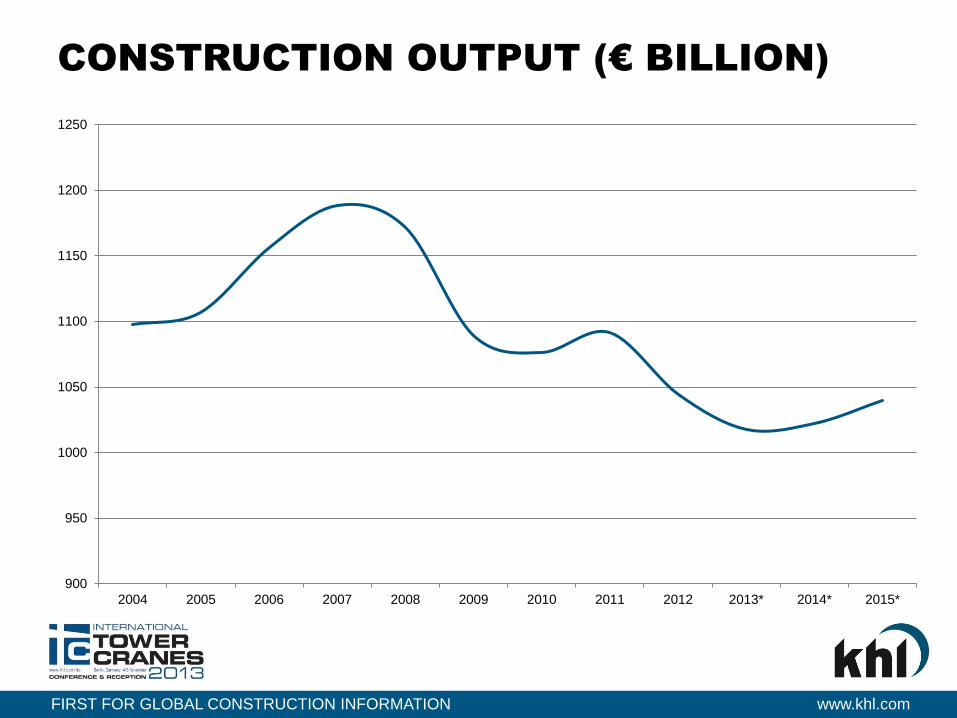
CONSTRUCTION OUTPUT (€ BILLION)
900
950
1000
1050
1100
1150
1200
1250
2004 2005 2006 2007 2008 2009 2010 2011 2012 2013* 2014* 2015*
FIRST FOR GLOBAL CONSTRUCTION INFORMATION www.khl.com
LONG TERM GROWTH TRENDS
• 2011 recovery stalled – now in second dip
– Triggered by threat of Greek default
• Recovery in 2014(?)
• Market value has fallen back to late-1990s levels
• When it returns, growth will be weak in global terms
– The ‘boom year’ of 2006 saw +4.5% growth
• Europe is still a big market ~20% of global output
FIRST FOR GLOBAL CONSTRUCTION INFORMATION www.khl.com
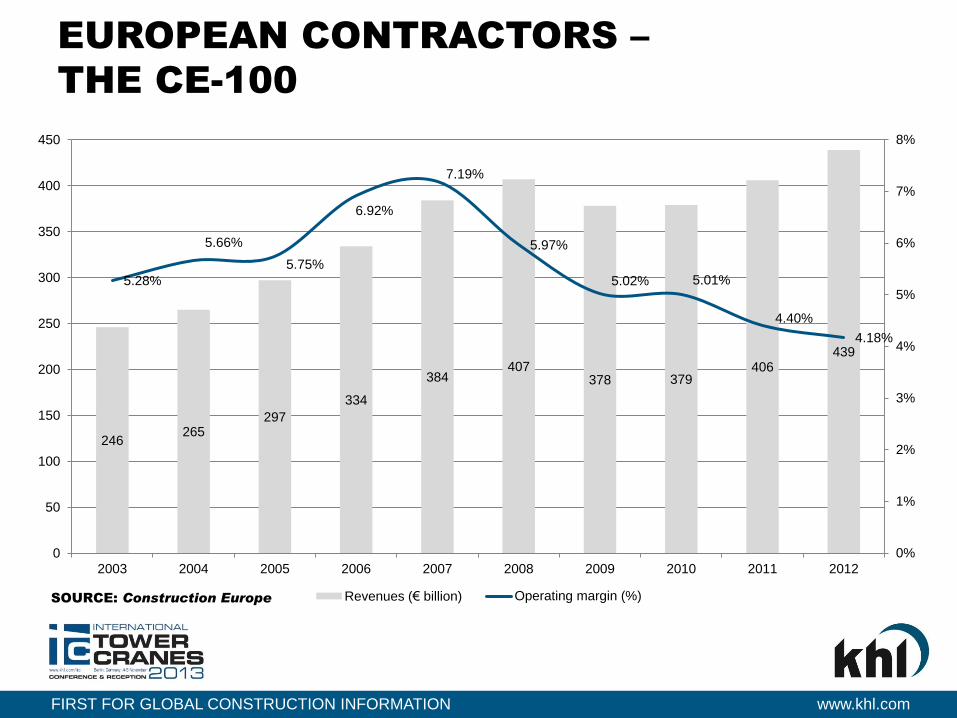
EUROPEAN CONTRACTORS –
THE CE-100
246 265
297
334
384 407
378 379 406
439
5.28%
5.66%
5.75%
6.92%
7.19%
5.97%
5.02% 5.01%
4.40%
4.18%
0%
1%
2%
3%
4%
5%
6%
7%
8%
0
50
100
150
200
250
300
350
400
450
2003 2004 2005 2006 2007 2008 2009 2010 2011 2012
Revenues (€ billion) Operating margin (%)SOURCE: Construction Europe
FIRST FOR GLOBAL CONSTRUCTION INFORMATION www.khl.com
SUMMARY
• Industry in recovery
• Era of moderate global growth
– Hard to predict
• Greatest growth in emerging markets
– Risk vs reward