global cities investment monitor 2018 · the global cities investment monitor demonstrates that...
TRANSCRIPT
GLOBAL CITIES INVESTMENT MONITOR 2018NEW RANKINGS, TRENDS AND CRITERIA
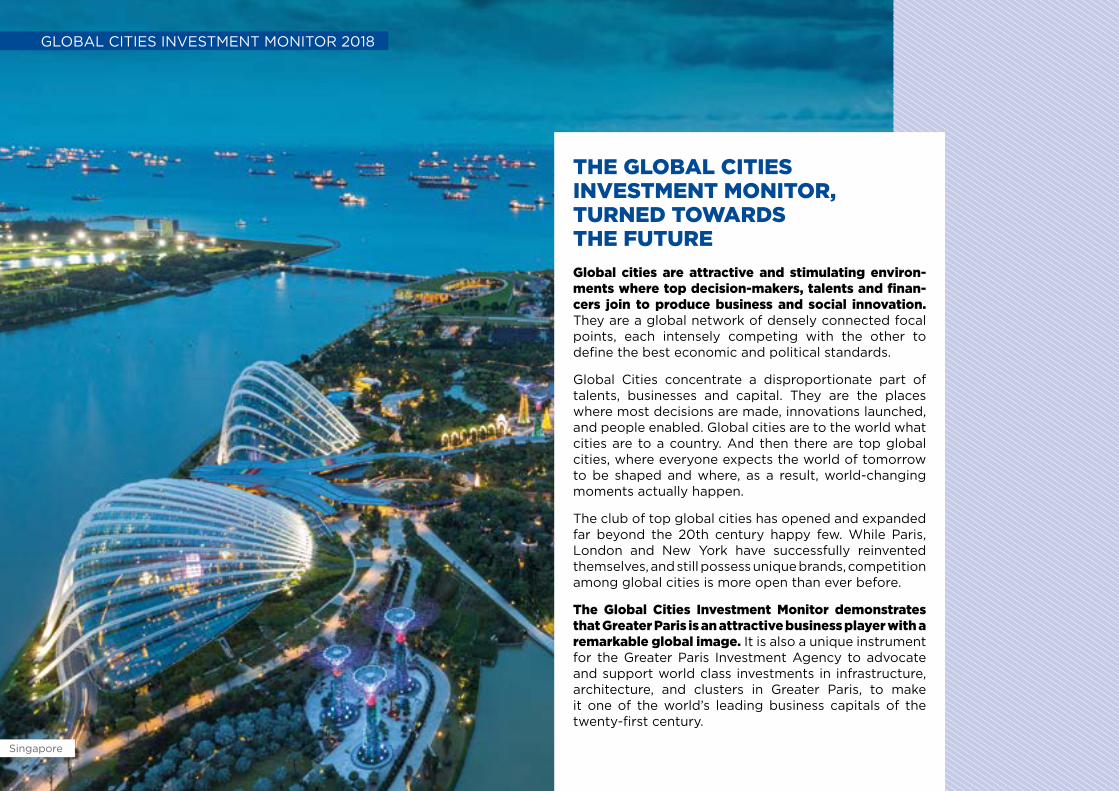
Singapore
INFOG RAPHICLorem ipsum dolor sit am et, consectetuer adipiscing elit, sed diam nonum my nibh
01 INFOG RAPHICLorem ipsum dolor sit amet, consectetuer adipiscing elit, sed diam nonum my nibh
02 INFOGRAPHICLorem ipsum dolor sit amet, consectetuer adipiscing elit, sed diam nonummy nibh
03
INFOG RAPHICLorem ipsum dolor sit am et, consectetuer adipiscing elit, sed diam nonum my nibh
04 INFOG RAPHICLorem ipsum dolor sit amet, consectetuer adipiscing elit, sed diam nonum my nibh
05 INFOGRAPHICLorem ipsum dolor sit amet, consectetuer adipiscing elit, sed diam nonummy nibh
06
GLOBAL CITIES INVESTMENT MONITOR 2018
THE GLOBAL CITIES INVESTMENT MONITOR, TURNED TOWARDS THE FUTURE
Global cities are attractive and stimulating environ-ments where top decision-makers, talents and finan-cers join to produce business and social innovation.They are a global network of densely connected focal points, each intensely competing with the other to define the best economic and political standards.
Global Cities concentrate a disproportionate part of talents, businesses and capital. They are the places where most decisions are made, innovations launched, and people enabled. Global cities are to the world what cities are to a country. And then there are top global cities, where everyone expects the world of tomorrow to be shaped and where, as a result, world-changing moments actually happen.
The club of top global cities has opened and expanded far beyond the 20th century happy few. While Paris, London and New York have successfully reinvented themselves, and still possess unique brands, competition among global cities is more open than ever before.
The Global Cities Investment Monitor demonstrates that Greater Paris is an attractive business player with a remarkable global image. It is also a unique instrument for the Greater Paris Investment Agency to advocate and support world class investments in infrastructure, architecture, and clusters in Greater Paris, to make it one of the world’s leading business capitals of the twenty-first century.
| 3
PARIS IS NOW POSED TO BECOME THE LEADING DESTINATION IN POST-BREXIT EUROPE
International investments were up 80% in Paris last year. This was by far the highest percentage among global cities and a probable record-breaker. Paris reached the top 3.
The gap with the leader was even more reduced for strategic investments. Paris emerged as the winning global city in post-Brexit Europe, way ahead of competitors.
Can it last? International investors think so. They even think Paris will be one of the two global cities whose attractiveness will increase the most over the next years. Investors now recognize that Paris is a top player under most criteria. The perception of a global business hub is definitely there, besides the top brand for quality of life.
Investors answered the policies implemented to welcome talents, science, environment-friendly initiatives, as well as the pro-business reforms. This is good news for Paris and for Europe, which is once again the leading destination for business project in the world. Long may Paris be that lighthouse for innovation, prosperity and openness.
Christian NIBOURELChairman, Greater Paris Investment Agency
INFOG RAPHICLorem ipsum dolor sit am et, consectetuer adipiscing elit, sed diam nonum my nibh
01 INFOG RAPHICLorem ipsum dolor sit amet, consectetuer adipiscing elit, sed diam nonum my nibh
02 INFOGRAPHICLorem ipsum dolor sit amet, consectetuer adipiscing elit, sed diam nonummy nibh
03
INFOG RAPHICLorem ipsum dolor sit am et, consectetuer adipiscing elit, sed diam nonum my nibh
04 INFOG RAPHICLorem ipsum dolor sit amet, consectetuer adipiscing elit, sed diam nonum my nibh
05 INFOGRAPHICLorem ipsum dolor sit amet, consectetuer adipiscing elit, sed diam nonummy nibh
06
INFOG RAPHICLorem ipsum dolor sit am et, consectetuer adipiscing elit, sed diam nonum my nibh
01 INFOG RAPHICLorem ipsum dolor sit amet, consectetuer adipiscing elit, sed diam nonum my nibh
02 INFOGRAPHICLorem ipsum dolor sit amet, consectetuer adipiscing elit, sed diam nonummy nibh
03
INFOG RAPHICLorem ipsum dolor sit am et, consectetuer adipiscing elit, sed diam nonum my nibh
04 INFOG RAPHICLorem ipsum dolor sit amet, consectetuer adipiscing elit, sed diam nonum my nibh
05 INFOGRAPHICLorem ipsum dolor sit amet, consectetuer adipiscing elit, sed diam nonummy nibh
06
EDITORIAL
Jay NIRSIMLOO
Chairman, KPMG France
2017 : GLOBAL DYNAMICS 4
2017: THE MOST ATTRACTIVE GLOBAL CITIES 6
2017: INVESTORS’ PERCEPTIONS OF GLOBAL CITIES 12
INVESTOR'S CRITERIA 16
FOCUS ON PARIS 18
METHODOLOGY 24
GLOBAL CITIES INVESTMENT MONITOR 2018
PARIS
3e
INFOG RAPHICLorem ipsum dolor sit am et, consectetuer adipiscing elit, sed diam nonum my nibh
01 INFOG RAPHICLorem ipsum dolor sit amet, consectetuer adipiscing elit, sed diam nonum my nibh
02 INFOGRAPHICLorem ipsum dolor sit amet, consectetuer adipiscing elit, sed diam nonummy nibh
03
INFOG RAPHICLorem ipsum dolor sit am et, consectetuer adipiscing elit, sed diam nonum my nibh
04 INFOG RAPHICLorem ipsum dolor sit amet, consectetuer adipiscing elit, sed diam nonum my nibh
05 INFOGRAPHICLorem ipsum dolor sit amet, consectetuer adipiscing elit, sed diam nonummy nibh
06
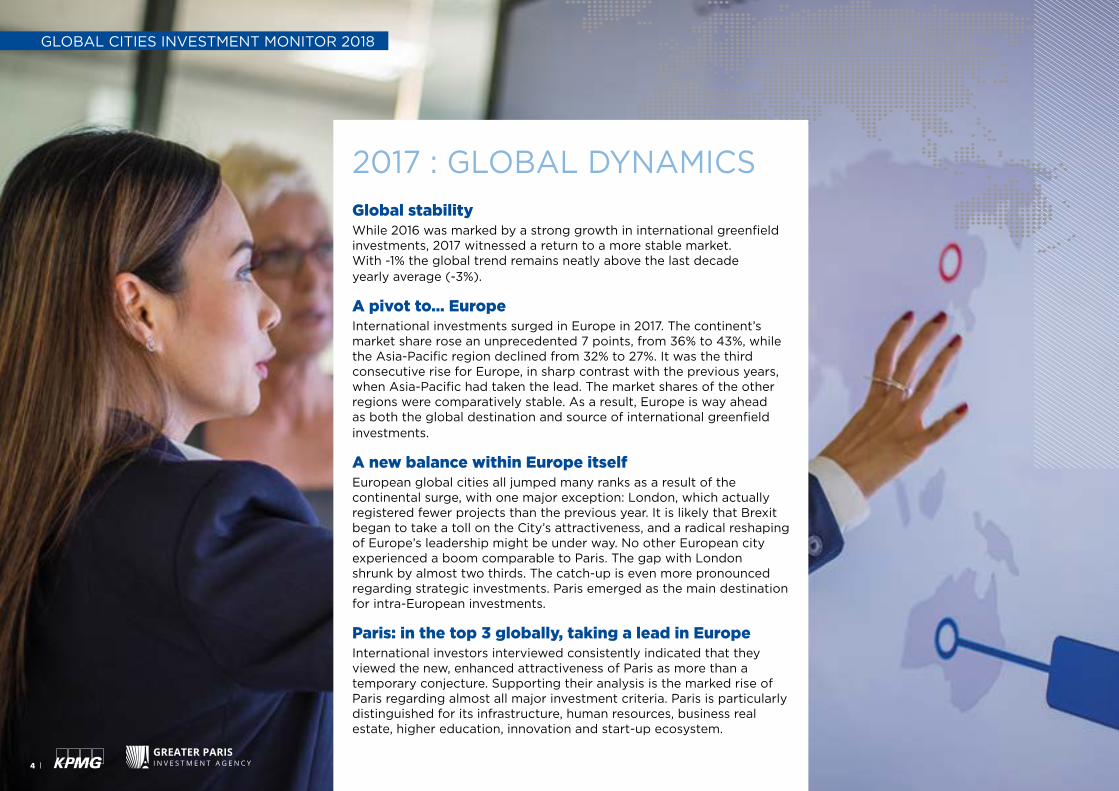
2017 : GLOBAL DYNAMICSGlobal stability
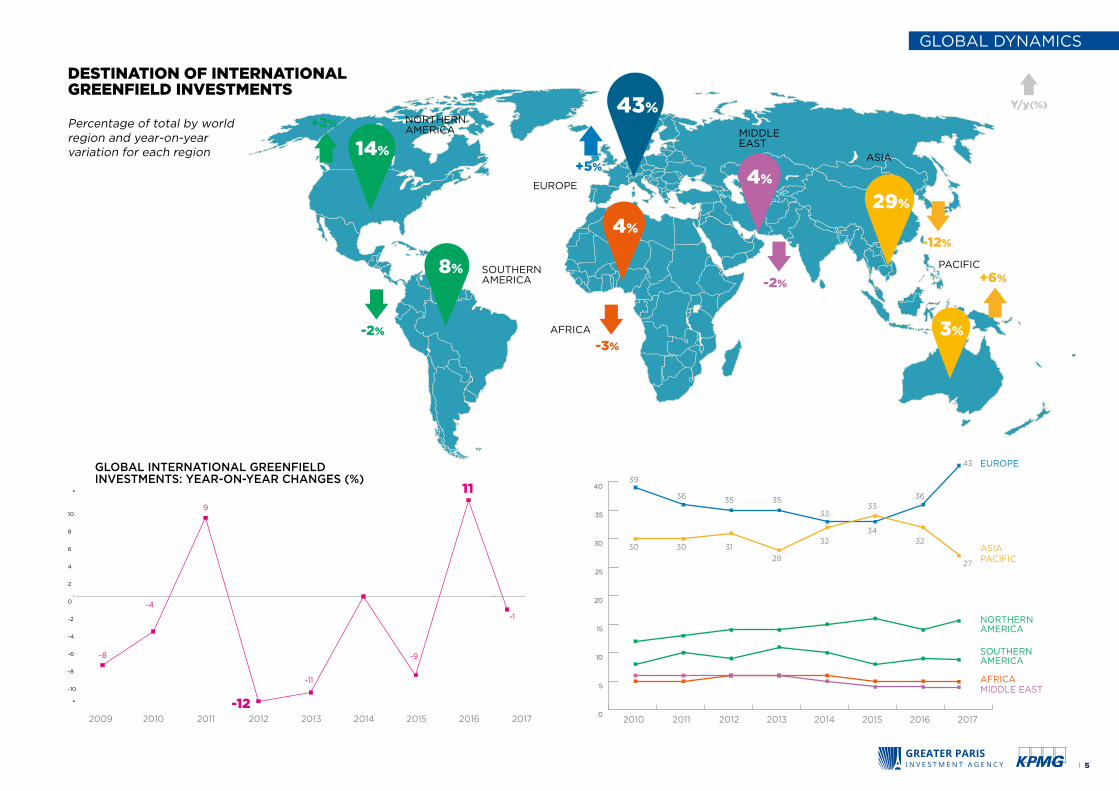
While 2016 was marked by a strong growth in international greenfield investments, 2017 witnessed a return to a more stable market. With -1% the global trend remains neatly above the last decade yearly average (-3%).
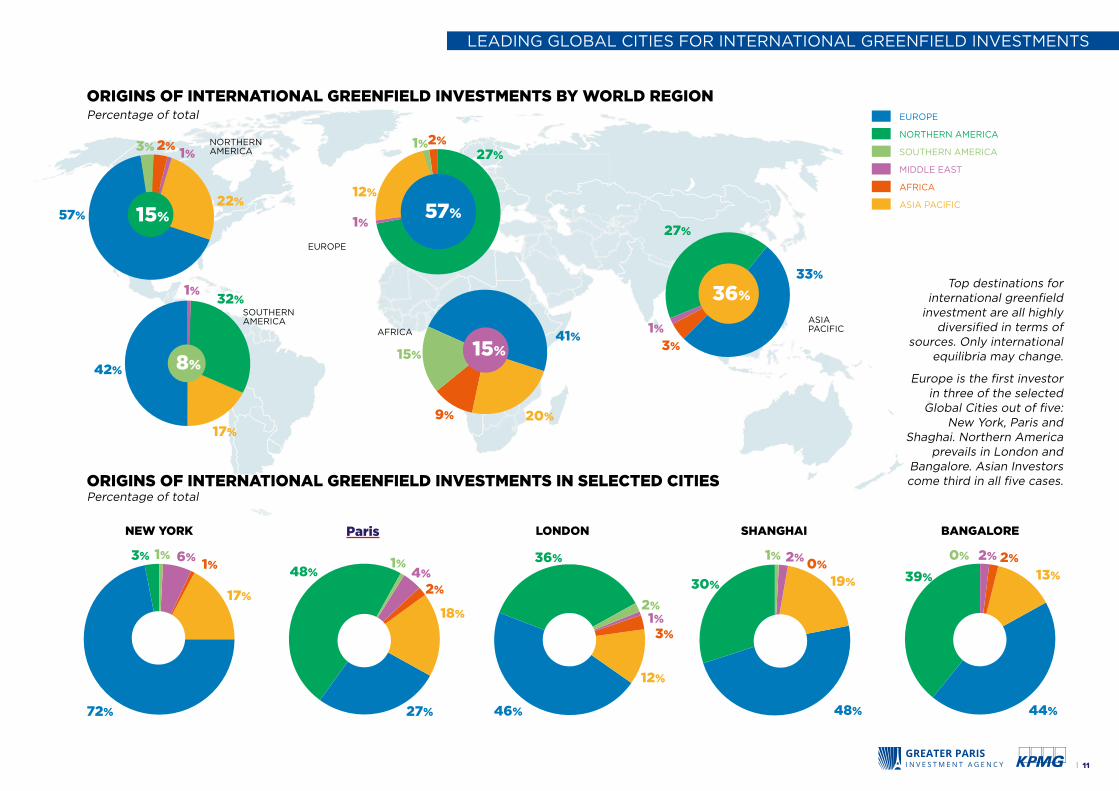
A pivot to… EuropeInternational investments surged in Europe in 2017. The continent’s market share rose an unprecedented 7 points, from 36% to 43%, while the Asia-Pacific region declined from 32% to 27%. It was the third consecutive rise for Europe, in sharp contrast with the previous years, when Asia-Pacific had taken the lead. The market shares of the other regions were comparatively stable. As a result, Europe is way ahead as both the global destination and source of international greenfield investments.
A new balance within Europe itselfEuropean global cities all jumped many ranks as a result of the continental surge, with one major exception: London, which actually registered fewer projects than the previous year. It is likely that Brexit began to take a toll on the City’s attractiveness, and a radical reshaping of Europe’s leadership might be under way. No other European city experienced a boom comparable to Paris. The gap with London shrunk by almost two thirds. The catch-up is even more pronounced regarding strategic investments. Paris emerged as the main destination for intra-European investments.
Paris: in the top 3 globally, taking a lead in EuropeInternational investors interviewed consistently indicated that they viewed the new, enhanced attractiveness of Paris as more than a temporary conjecture. Supporting their analysis is the marked rise of Paris regarding almost all major investment criteria. Paris is particularly distinguished for its infrastructure, human resources, business real estate, higher education, innovation and start-up ecosystem.
GLOBAL CITIES INVESTMENT MONITOR 2018
4 |
| 5
DESTINATION OF INTERNATIONAL GREENFIELD INVESTMENTS
Percentage of total by world region and year-on-year variation for each region
29%
+2%
¢
+6%
¢
14%
43%
4%
3%
4%
å-2%
¢+5%
å-3%
å-2%
11
å-12%
¢Y/y(%)
NORTHERN AMERICA
AFRICA
MIDDLE EAST
ASIA
SOUTHERN AMERICA
EUROPE
8% PACIFIC
INFOG RAPHICLorem ipsum dolor sit am et, consectetuer adipiscing elit, sed diam nonum my nibh
01 INFOG RAPHICLorem ipsum dolor sit amet, consectetuer adipiscing elit, sed diam nonum my nibh
02 INFOGRAPHICLorem ipsum dolor sit amet, consectetuer adipiscing elit, sed diam nonummy nibh
03
INFOG RAPHICLorem ipsum dolor sit am et, consectetuer adipiscing elit, sed diam nonum my nibh
04 INFOG RAPHICLorem ipsum dolor sit amet, consectetuer adipiscing elit, sed diam nonum my nibh
05 INFOGRAPHICLorem ipsum dolor sit amet, consectetuer adipiscing elit, sed diam nonummy nibh
06
EUROPE
ASIAPACIFIC
NORTHERN AMERICA
2010 2011 2012 2013 2014 2015 2016 2017
39
36 35 35
3333
36
43
30 30 31
28
3234
32
27
SOUTHERN AMERICA
AFRICAMIDDLE EAST
GLOBAL INTERNATIONAL GREENFIELD INVESTMENTS: YEAR-ON-YEAR CHANGES (%)
2009 2010 2011 2012 2013 2014 2015 2016 2017
-8
-4
9
-11
-9
-1
-10
-8
-6
-4
-2
0
2
4
6
8
10
-120
5
10
15
20
25
30
35
40
GLOBAL DYNAMICS
NUMBER OF INTERNATIONAL GREENFIELD INVESTMENTS IN THE 35 LEADING CITIES WORLDWIDE
2017: THE MOST ATTRACTIVE GLOBAL CITIES
New York156
Toronto114
San Francisco
74
Los Angeles52
Sao Paulo101
Mexico61
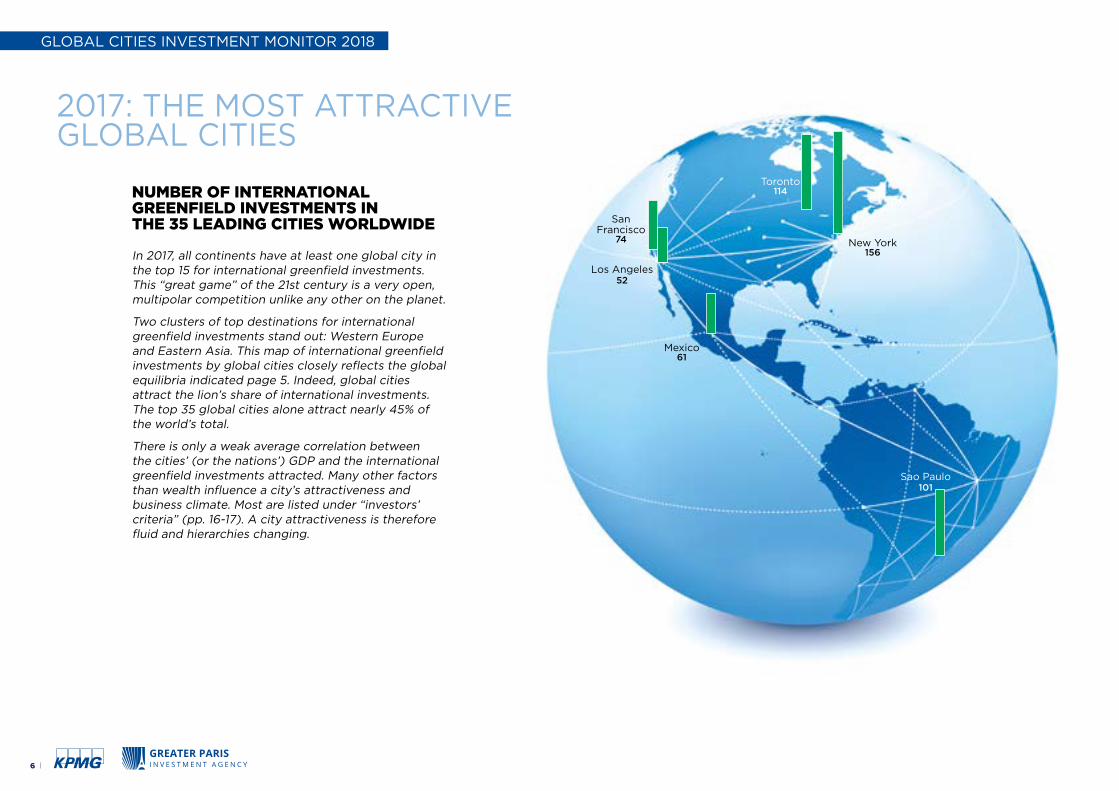
In 2017, all continents have at least one global city in the top 15 for international greenfield investments. This “great game” of the 21st century is a very open, multipolar competition unlike any other on the planet.
Two clusters of top destinations for international greenfield investments stand out: Western Europe and Eastern Asia. This map of international greenfield investments by global cities closely reflects the global equilibria indicated page 5. Indeed, global cities attract the lion’s share of international investments. The top 35 global cities alone attract nearly 45% of the world’s total.
There is only a weak average correlation between the cities’ (or the nations’) GDP and the international greenfield investments attracted. Many other factors than wealth influence a city’s attractiveness and business climate. Most are listed under “investors’ criteria” (pp. 16-17). A city attractiveness is therefore fluid and hierarchies changing.
6 |
GLOBAL CITIES INVESTMENT MONITOR 2018

| 7
Johannesburg31
Dubai248
Moscow41
Paris338
Dublin 132
Madrid95
Amsterdam124
Warsaw67
Francfort94
Berlin58
Düsseldorf74
Munich91
Milan49
Barcelona135
London 390
Bangalore137 Ho Chi
Minh City79
Tokyo112
Seoul38
Shanghai173
Beijing79
Hong Kong
161
Singapore354
Rangoon35
Kuala Lumpur40
Pune47
Hyderabad41
Melbourne77
Sydney121
2017: THE MOST ATTRACTIVE GLOBAL CITIES
Lo
nd
on
Sin
gap
ore
Pa
ris
Du
bai
Sh
an
gh
ai
Ho
ng
Ko
ng
New
Yo
rk
Ban
galo
re
Barc
elo
na
Du
blin
Am
sterd
am
Syd
ney
Toro
nto
Tokyo
Sao
Pau
lo
Mad
rid
Fra
ncfo
rt
Mu
nic
h
Beiji
ng
Ho
Ch
i M
inh
Melb
ou
rne
San
Fra
ncis
co
Du
sseld
orf
Wars
aw
Mexic
o
Berl
in
Lo
s A
ng
ele
s
Mila
n
Pu
ne
Mo
sco
w
Hyd
era
bad
Ku
ala
Lu
mp
ur
Seo
ul
Ran
go
on
Jo
han
nesb
urg
1 2 3 4 5 6 7 8 9 10 11 12 13 14 15 16 17 18 19 20 21 22 23 24 25 26 27 28 29 30 31 32 33 34 35
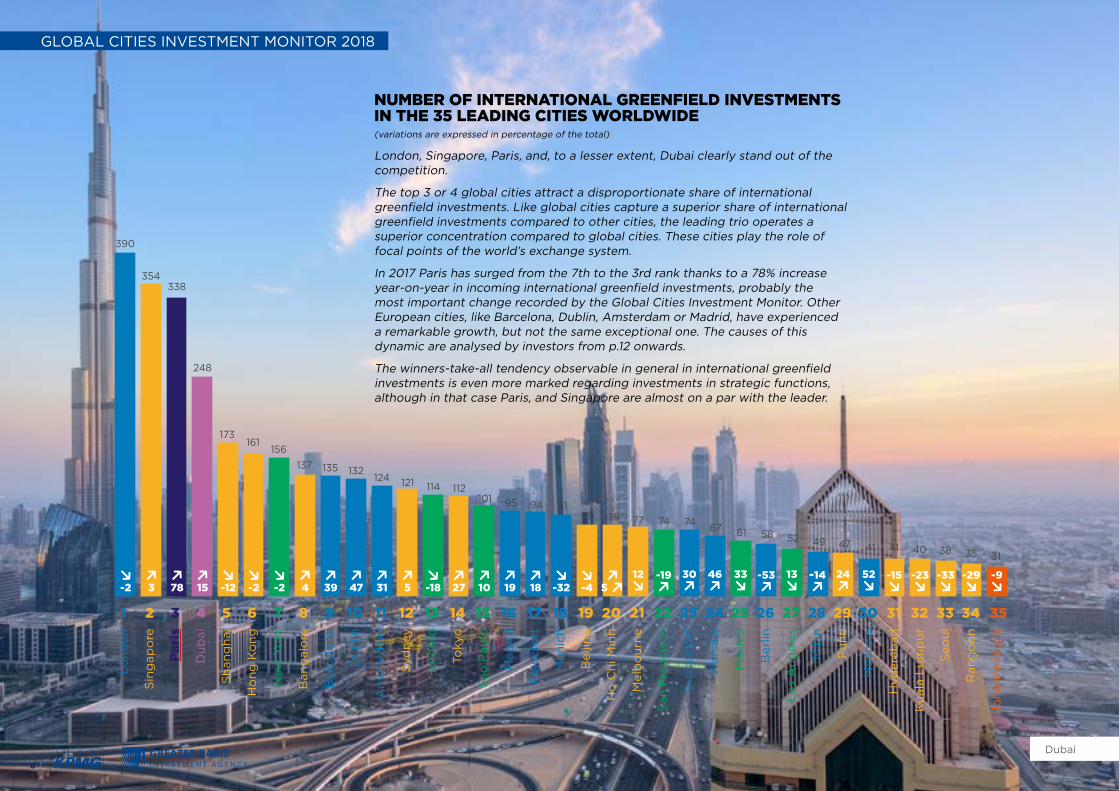
NUMBER OF INTERNATIONAL GREENFIELD INVESTMENTS IN THE 35 LEADING CITIES WORLDWIDE (variations are expressed in percentage of the total)
London, Singapore, Paris, and, to a lesser extent, Dubai clearly stand out of the competition.
The top 3 or 4 global cities attract a disproportionate share of international greenfield investments. Like global cities capture a superior share of international greenfield investments compared to other cities, the leading trio operates a superior concentration compared to global cities. These cities play the role of focal points of the world’s exchange system.
In 2017 Paris has surged from the 7th to the 3rd rank thanks to a 78% increase year-on-year in incoming international greenfield investments, probably the most important change recorded by the Global Cities Investment Monitor. Other European cities, like Barcelona, Dublin, Amsterdam or Madrid, have experienced a remarkable growth, but not the same exceptional one. The causes of this dynamic are analysed by investors from p.12 onwards.
The winners-take-all tendency observable in general in international greenfield investments is even more marked regarding investments in strategic functions, although in that case Paris, and Singapore are almost on a par with the leader.
Dubai
GLOBAL CITIES INVESTMENT MONITOR 2018
8 |
T-2E3E78E15T-12T-2T-2E4E39 E47 E31 E5T-18E27 E10 E19 E18 T-32T-4E
5 E12 T
-19E
30 E
46 E
33 T
-53E
13 T
-14E
24 E
52T
-15T
-23T
-33T
-29T
-9T

| 9
2013-2017 : CUMULATED INVESTMENTS IN TOP 10 CITIESInternational greenfield investments in strategic functions : top 15 cities
Lo
nd
on
Sin
gap
ore
Pa
ris
Du
bai
Sh
an
gh
ai
Ban
galo
re
New
Yo
rk
Ho
ng
Ko
ng
Barc
elo
na
Du
blin
To
kyo
Syd
ney
Am
ste
rdam
Mad
rid
To
ron
to
Lo
nd
on
Sin
gap
ore
Pa
ris
Du
bai
Sh
an
gh
ai
New
Yo
rk
Ho
ng
Ko
ng
Syd
ney
Sao
Pau
lo
Ban
galo
re2013-2017: CUMULATED INVESTMENTS IN TOP 10 CITIES
2013-2017 Rankings : cumultated IGI over 5 years
230
199
198 198
138
10189
82 80 72 71 71
64 62 60 55
2030 1890
1240 1229
138
1077979
841696 658 648
Strategic investments, the rarest and most coveted type of investments, tend to be even more concentrated in the Top global cities.
Strategic business activities comprise customer contact centers, design, development & testing, education and training, headquarters, research and development, sales, marketing & support, and shared service centers.
London
Dubai
Shangaï
Singapore
Paris
227
338
354
390
452
398
412
435
245
270
354
269
215248
343
378
249
404
257
181 173
Dubai
1=
2=
3S+2
4F-1
5F-1
6=
7=
8S+1
9F-1
10=
2013-2017: VARIATIONS IN TOP 5 CITIES
2013 2014 2015 2016 2017
2017: THE MOST ATTRACTIVE GLOBAL CITIES
240 245
190
San Francisco
NORTHERN AMERICA
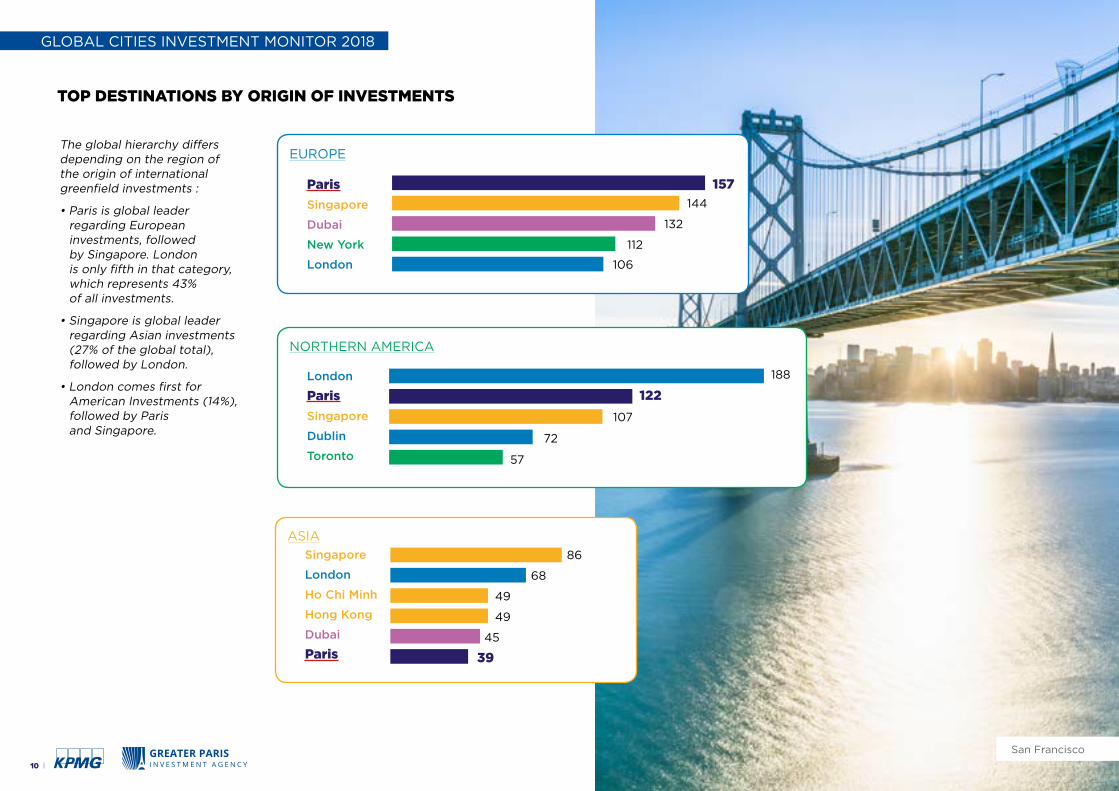
The global hierarchy differs depending on the region of the origin of international greenfield investments :
• Paris is global leader regarding European investments, followed by Singapore. London is only fifth in that category, which represents 43% of all investments.
• Singapore is global leader regarding Asian investments (27% of the global total), followed by London.
• London comes first for American Investments (14%), followed by Paris and Singapore.
TOP DESTINATIONS BY ORIGIN OF INVESTMENTS
GLOBAL CITIES INVESTMENT MONITOR 2018
10 |
EUROPE
ASIA
157
188
122
107
72
57
London
Paris
Singapore
Dublin
Toronto
144
132
112
106
Paris
Singapore
Dubai
New York
London
Singapore
London
Ho Chi Minh
Hong Kong
Dubai
Paris
86
68
49
49
45
39
San Francisco
| 11
BANGALORE
ORIGINS OF INTERNATIONAL GREENFIELD INVESTMENTS IN SELECTED CITIES Percentage of total
NORTHERN AMERICA
EUROPE
AFRICA
ASIA PACIFIC
SOUTHERN AMERICA
Percentage of total
ORIGINS OF INTERNATIONAL GREENFIELD INVESTMENTS BY WORLD REGION
Top destinations for international greenfield
investment are all highly diversified in terms of
sources. Only international equilibria may change.
Europe is the first investor in three of the selected
Global Cities out of five: New York, Paris and
Shaghai. Northern America prevails in London and
Bangalore. Asian Investors come third in all five cases.
36%
8%
17%
22%12%
20%
1%
1%
1%
1%2%
9%
3%
1%
2%3%
15%
32%
72%
17%
1%3% 1% 6%
NEW YORK
46%
12%
3%
27%
57%
42%
36%
2%1%
LONDON
41%
33%
27%
57%
SHANGHAI
44%48%
19%13%
2%0%39%30%
1% 0% 2%2%
27%
18%
2%
48%1%
4%
Paris
EUROPE
NORTHERN AMERICA
SOUTHERN AMERICA
MIDDLE EAST
AFRICA
ASIA PACIFIC
LEADING GLOBAL CITIES FOR INTERNATIONAL GREENFIELD INVESTMENTS
15%
15%

2017: INVESTORS’ PERCEPTIONS OF GLOBAL CITIES
1 New York
2 London
3 Paris4 Shanghai
5 Tokyo
5 Francfort
5 Singapore
8 Berlin
9 San Francisco
Chicago
Los Angeles
Sydney
Toronto
Copenhague
Stockholm
Hong Kong
Madrid
Munich
Dublin
Beijing
Dubai
50%
38%
28%
13%
10%
10%
10%
9%
6%
5%
5%
4%
4%
4%
4%
4%
4%
4%
4%
3%
3%
3%
Percentage of quotations by city
CITIES’ GLOBAL IMAGE
“ In your view, which 3 cities or major world capitals have the best overall image?”
1910
102 8
535
5
4
Aerial view of Manhattan island, New York, USA
GLOBAL CITIES INVESTMENT MONITOR 2018
12 |
| 13
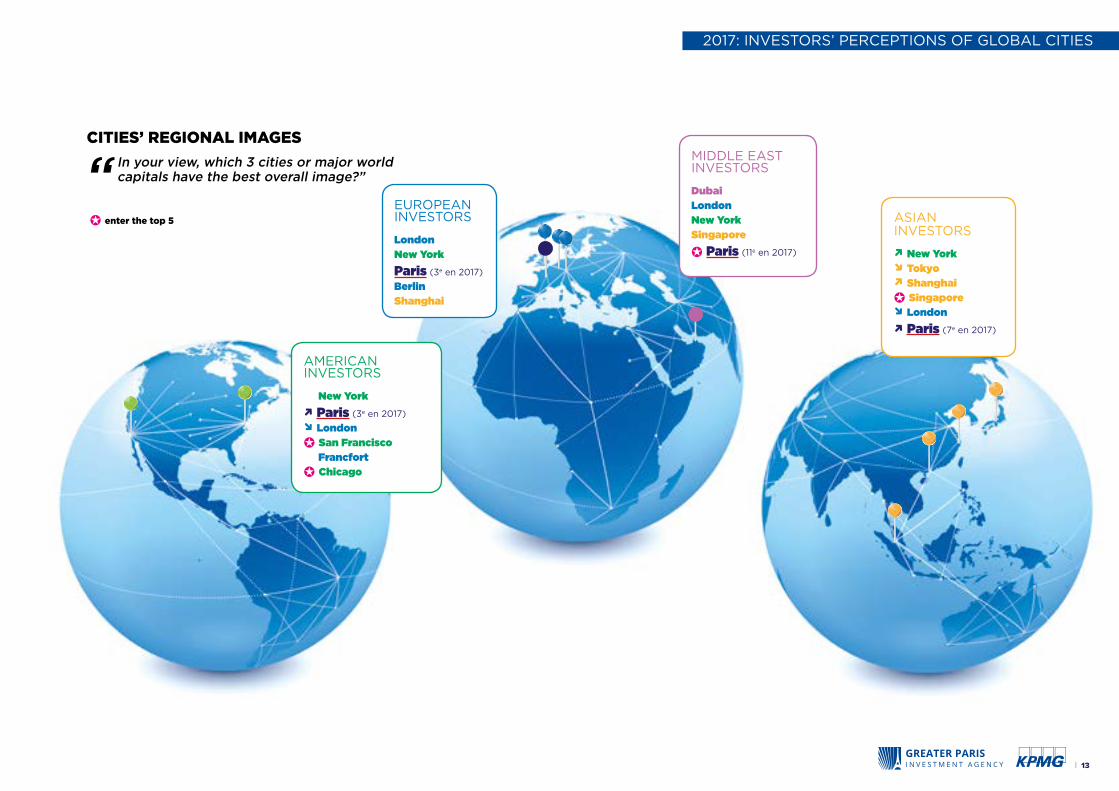
✪ enter the top 5
CITIES’ REGIONAL IMAGES
“ In your view, which 3 cities or major world capitals have the best overall image?”
AMERICAN INVESTORS
New York
S Paris (3e en 2017)
F London
✪ San FranciscoFrancfort
✪ Chicago
EUROPEAN INVESTORS
LondonNew York
Paris (3e en 2017)
BerlinShanghai
ASIAN INVESTORS
S New YorkF TokyoS Shanghai
✪ SingaporeF London
S Paris (7e en 2017)
MIDDLE EAST INVESTORS
Dubai LondonNew YorkSingapore
✪ Paris (11e en 2017)
2017: INVESTORS’ PERCEPTIONS OF GLOBAL CITIES

1 New York
2 London
3 Shanghai
4 Paris5 Berlin
6 Hong Kong
6 Francfort
6 Beijing
6 Dublin
Chicago
Dubai
Tokyo
San Francisco
Singapore
Madrid
Mumbai
Hambourg
Toronto
27%
21%
20%
11%
10%
6%
6%
6%
6%
5%
5%
5%
5%
5%
5%
4%
4%
4%
CITIES’ GLOBAL ATTRACTIVENESS
Percentage of quotations by city
6
1
24
566
63
“ In your view, which 3 major world capitals are currently the most attractive locations for setting up a business in general (whether another business or yours)?”
10
Singapore Harbour
GLOBAL CITIES INVESTMENT MONITOR 2018
14 |
| 15
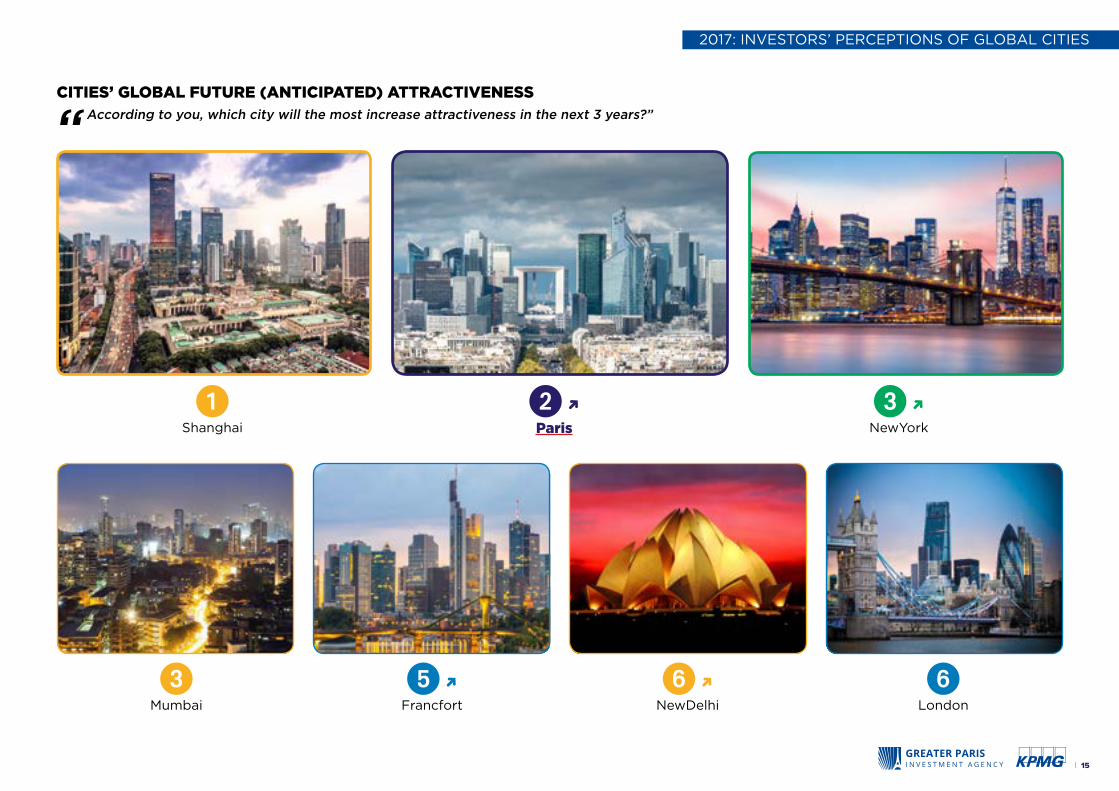
CITIES’ GLOBAL FUTURE (ANTICIPATED) ATTRACTIVENESS
1
Shanghai
2 S Paris
3 SNewYork
3
Mumbai
5 S Francfort
6 SNewDelhi
6 London
“ According to you, which city will the most increase attractiveness in the next 3 years?”
2017: INVESTORS’ PERCEPTIONS OF GLOBAL CITIES
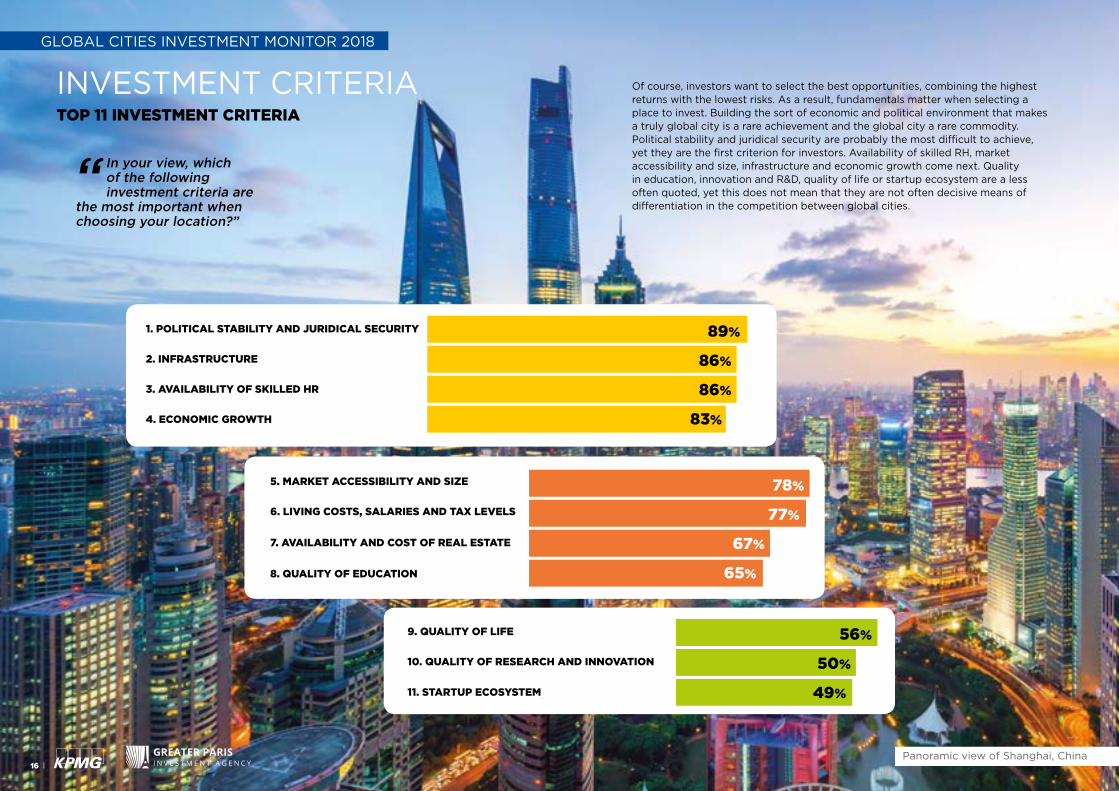
1. POLITICAL STABILITY AND JURIDICAL SECURITY
2. INFRASTRUCTURE
3. AVAILABILITY OF SKILLED HR
4. ECONOMIC GROWTH
Of course, investors want to select the best opportunities, combining the highest returns with the lowest risks. As a result, fundamentals matter when selecting a place to invest. Building the sort of economic and political environment that makes a truly global city is a rare achievement and the global city a rare commodity.Political stability and juridical security are probably the most difficult to achieve, yet they are the first criterion for investors. Availability of skilled RH, market accessibility and size, infrastructure and economic growth come next. Quality in education, innovation and R&D, quality of life or startup ecosystem are a less often quoted, yet this does not mean that they are not often decisive means of differentiation in the competition between global cities.
“ In your view, which of the following investment criteria are
the most important when choosing your location?”
89%
86%
86%
83%
GLOBAL CITIES INVESTMENT MONITOR 2018
TOP 11 INVESTMENT CRITERIA
INVESTMENT CRITERIA
Panoramic view of Shanghai, China16 |
9. QUALITY OF LIFE
10. QUALITY OF RESEARCH AND INNOVATION
11. STARTUP ECOSYSTEM
5. MARKET ACCESSIBILITY AND SIZE
6. LIVING COSTS, SALARIES AND TAX LEVELS
7. AVAILABILITY AND COST OF REAL ESTATE
8. QUALITY OF EDUCATION
78%
77%
67%
65%
56%
50%
49%
| 17
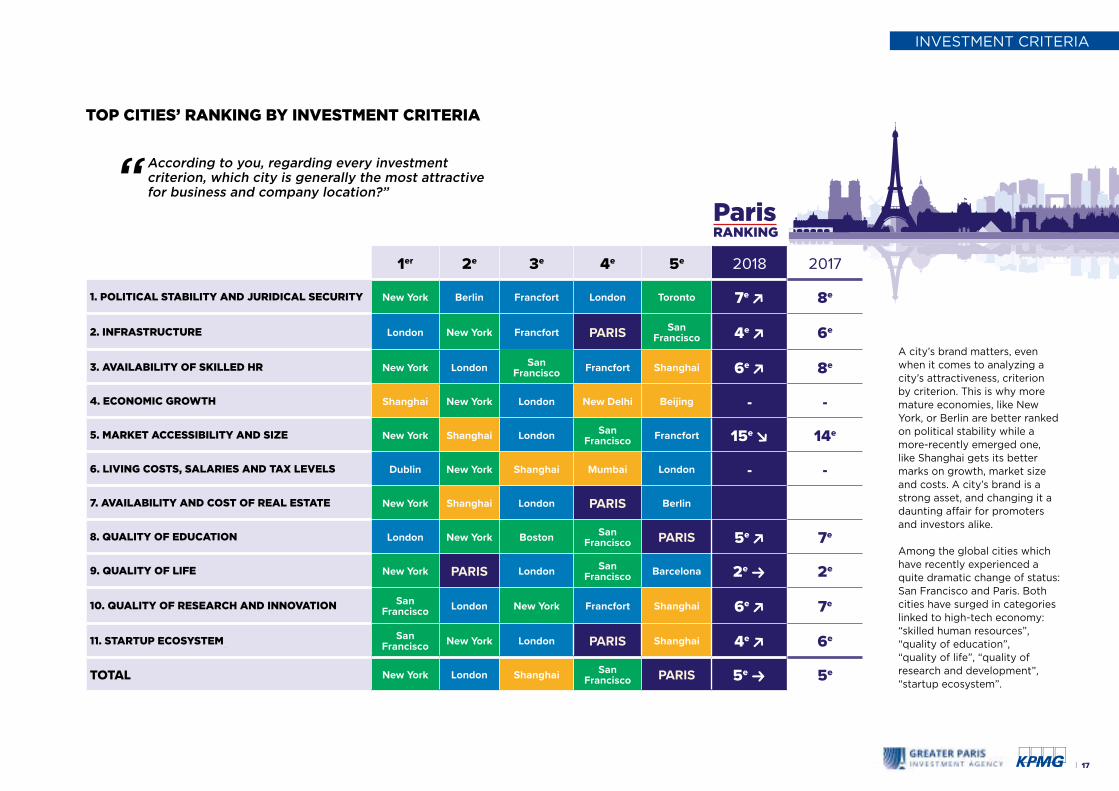
TOP CITIES’ RANKING BY INVESTMENT CRITERIA
1er 2e 3e 4e 5e 2018 2017
1. POLITICAL STABILITY AND JURIDICAL SECURITY New York Berlin Francfort London Toronto 7e E 8e
2. INFRASTRUCTURE London New York Francfort PARIS San Francisco 4e E 6e
3. AVAILABILITY OF SKILLED HR New York London San Francisco Francfort Shanghai 6e E 8e
4. ECONOMIC GROWTH Shanghai New York London New Delhi Beijing - -
5. MARKET ACCESSIBILITY AND SIZE New York Shanghai London San Francisco Francfort 15e T 14e
6. LIVING COSTS, SALARIES AND TAX LEVELS Dublin New York Shanghai Mumbai London - -
7. AVAILABILITY AND COST OF REAL ESTATE New York Shanghai London PARIS Berlin
8. QUALITY OF EDUCATION London New York Boston San Francisco PARIS 5e E 7e
9. QUALITY OF LIFE New York PARIS London San Francisco Barcelona 2e R 2e
10. QUALITY OF RESEARCH AND INNOVATION San Francisco London New York Francfort Shanghai 6e E 7e
11. STARTUP ECOSYSTEM San Francisco New York London PARIS Shanghai 4e E 6e
TOTAL New York London Shanghai San Francisco PARIS 5e R 5e
A city’s brand matters, even when it comes to analyzing a city’s attractiveness, criterion by criterion. This is why more mature economies, like New York, or Berlin are better ranked on political stability while a more-recently emerged one, like Shanghai gets its better marks on growth, market size and costs. A city’s brand is a strong asset, and changing it a daunting affair for promoters and investors alike.
Among the global cities which have recently experienced a quite dramatic change of status: San Francisco and Paris. Both cities have surged in categories linked to high-tech economy: “skilled human resources”, “quality of education”, “quality of life”, “quality of research and development”, “startup ecosystem”.
“ According to you, regarding every investment criterion, which city is generally the most attractive for business and company location?”
Paris RANKING
INVESTMENT CRITERIA

FOCUS ON PARIS
PARIS: A POSITIVE OUTLOOK FOR A TOP BRAND AND A MAJOR DESTINATION
In 2017, international greenfield investments surged 80% in Paris, now the third most attractive global city in the world, far ahead of the next competitor.
Is this a game changer for Paris or a temporary spike due to abnormal conditions in Europe and elsewhere? Our survey contains a few keys to analyze the underlying trend.
First, the levels of attractiveness perceived by international investors are very close to the actual ranking of Paris: third or fourth globally, either one considers the city’s global image or a more analytical appreciation of the city’s position regarding each investment criterion. Few competitors enjoy such a level of consistency between the investors’ opinions and the measurable reality.
Second, the investors’ predictions tend to distinguish Paris as the second-best among the cities which will see their attractiveness increase over the next three years. If anything, this result reinforces the sense that the underlying trend is indeed a favorable one for Paris. Its new-found position as a member of the top trio could therefore very well be a lasting one.
Supporting this analysis are the investors’ perceptions about Paris specifically: the investors who think that the attractiveness of Paris will improve over the next three years outnumber those who think the opposite three to one, an almost complete inversion compared to four years ago.
The policies of the French government that address the protection of the environment, international affairs and business demands are equally likely to reinforce the investors’ analysis that Paris is much better placed than London and other cities to be the next European leader.
GLOBAL CITIES INVESTMENT MONITOR 2018
18 |
| 19
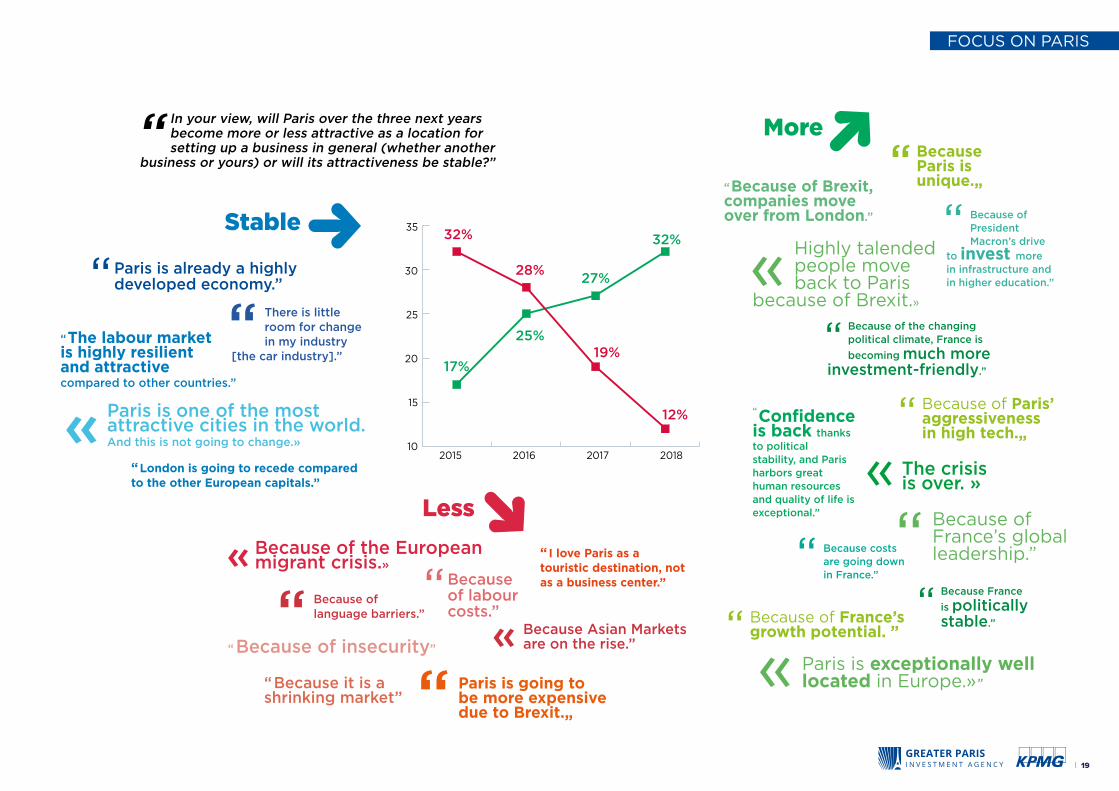
“ In your view, will Paris over the three next years become more or less attractive as a location for setting up a business in general (whether another
business or yours) or will its attractiveness be stable?”
« Paris is exceptionally well located in Europe.»”
“ There is little room for change in my industry
[the car industry].”
“ Because of language barriers.”
« Because Asian Markets are on the rise.”
“ The labour market is highly resilient and attractive compared to other countries.”
“ Because of Brexit, companies move over from London.”
“ Paris is going to be more expensive due to Brexit.„
“ Because Paris is unique.„
“ Because of Paris’ aggressiveness in high tech.„
“ Because of France’s growth potential. ”
“ Because of insecurity”
“ Because it is a shrinking market”
« Paris is one of the most attractive cities in the world. And this is not going to change.»
« Highly talended people move back to Paris
because of Brexit.»
« The crisis is over. »
« Because of the European migrant crisis.»
“ London is going to recede compared to the other European capitals.”
“ I love Paris as a touristic destination, not as a business center.”
“ Paris is already a highly developed economy.”
“ Because of labour costs.”
32%
28%27%
32%
25%
17%19%
12%
35
30
25
20
15
102015 2016 2017 2018
“ Because of President Macron’s drive
to invest more in infrastructure and in higher education.”
“ Because costs are going down in France.”
“ Confidence is back thanks to political stability, and Paris harbors great human resources and quality of life is exceptional.”
“ Because of the changing political climate, France is
becoming much more investment-friendly.”
“ Because France
is politically stable.”
“ Because of France’s global leadership.”
FOCUS ON PARIS
StableD
MoreS
LessF
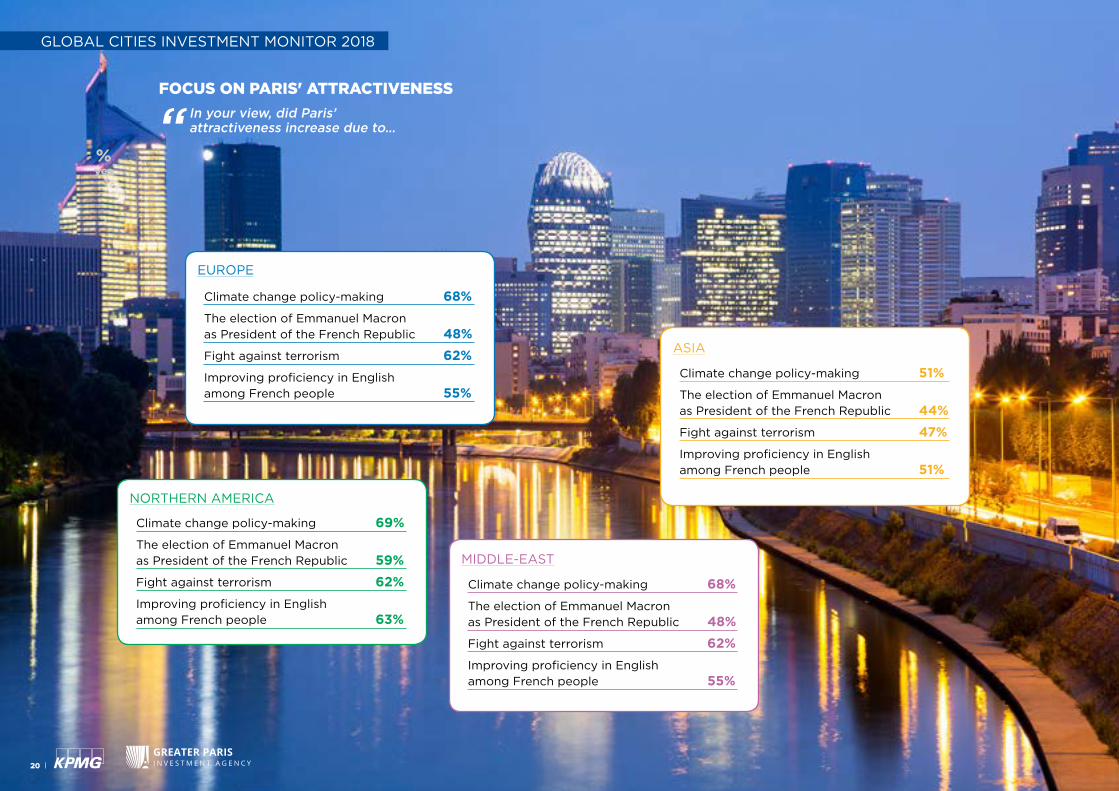
FOCUS ON PARIS' ATTRACTIVENESS
“ In your view, did Paris’ attractiveness increase due to…
% yes
GLOBAL CITIES INVESTMENT MONITOR 2018
NORTHERN AMERICA
EUROPE
ASIA
MIDDLE-EAST
Climate change policy-making 69%
The election of Emmanuel Macron as President of the French Republic 59%
Fight against terrorism 62%
Improving proficiency in English among French people 63%
Climate change policy-making 68%
The election of Emmanuel Macron as President of the French Republic 48%
Fight against terrorism 62%
Improving proficiency in English among French people 55%
Climate change policy-making 51%
The election of Emmanuel Macron as President of the French Republic 44%
Fight against terrorism 47%
Improving proficiency in English among French people 51%
Climate change policy-making 68%
The election of Emmanuel Macron as President of the French Republic 48%
Fight against terrorism 62%
Improving proficiency in English among French people 55%
20 |
| 21
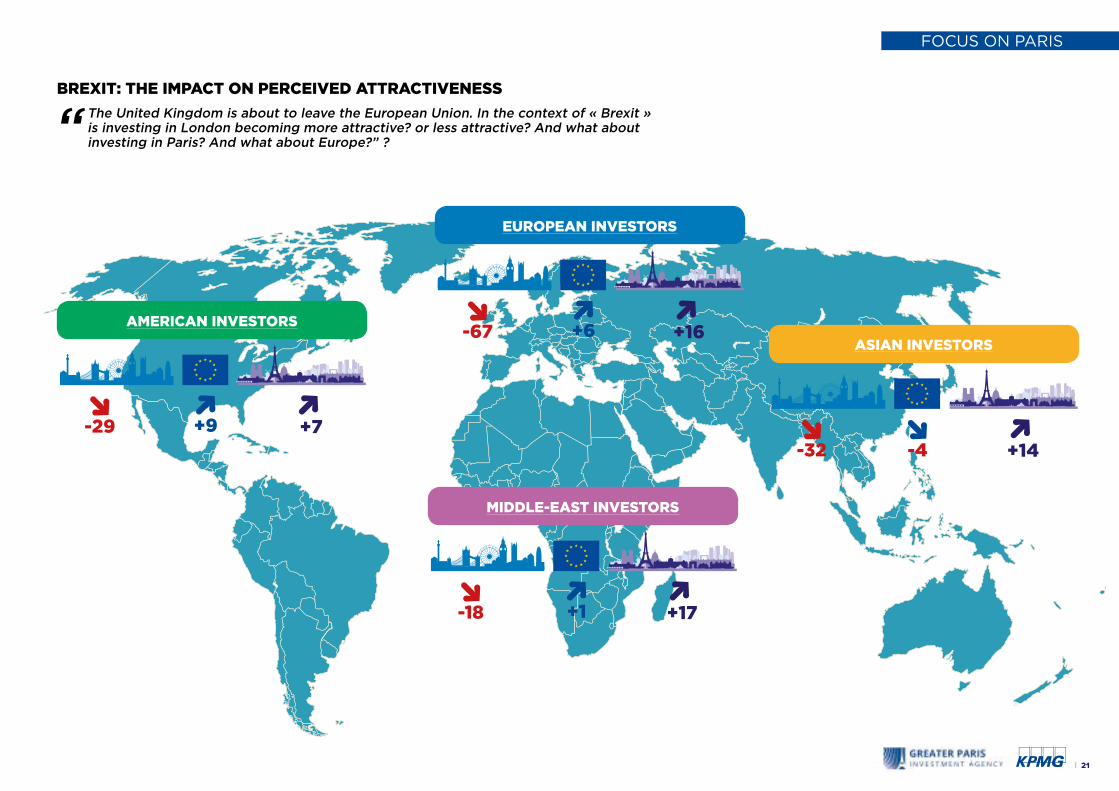
BREXIT: THE IMPACT ON PERCEIVED ATTRACTIVENESS
“ The United Kingdom is about to leave the European Union. In the context of « Brexit » is investing in London becoming more attractive? or less attractive? And what about investing in Paris? And what about Europe?” ?
FOCUS ON PARIS
AMERICAN INVESTORS
EUROPEAN INVESTORS
ASIAN INVESTORS
MIDDLE-EAST INVESTORS
F-29
S +9
S+7
F-67
S +6
S+16
F-32
F-4
S+14
F-18
S +1
S+17
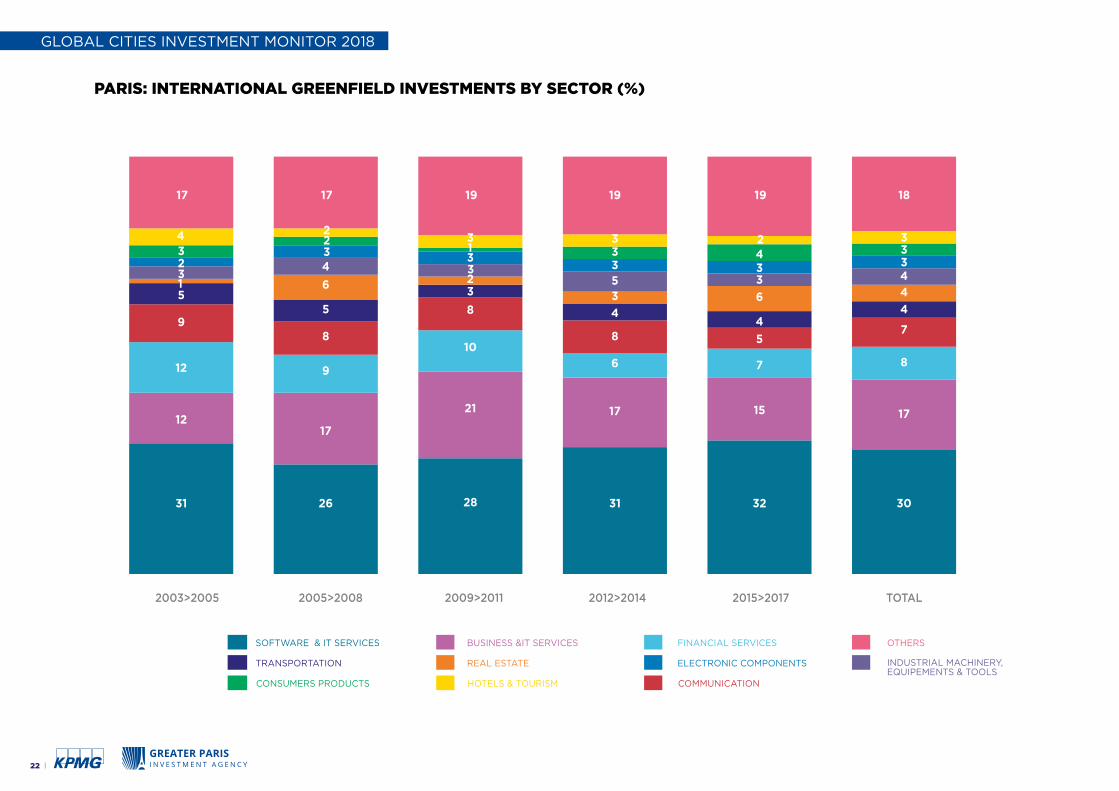
PARIS: INTERNATIONAL GREENFIELD INVESTMENTS BY SECTOR (%)
INDUSTRIAL MACHINERY, EQUIPEMENTS & TOOLS
CONSUMERS PRODUCTS HOTELS & TOURISM COMMUNICATION
SOFTWARE & IT SERVICES BUSINESS &IT SERVICES FINANCIAL SERVICES OTHERS
TRANSPORTATION REAL ESTATE ELECTRONIC COMPONENTS
GLOBAL CITIES INVESTMENT MONITOR 2018
22 |
17 17 19 19 19 18
55
3
44
4
4
2003>2005 2005>2008 2009>2011 2012>2014 2015>2017 TOTAL
31 26 28 31 32 30
1217
21 17 15 17
12 9
106 7 8
98
8
8 57
1 6 2
3
4
6 4
3
34 3
5 3 42
2 22
3 3
31
3
33
3 3
33
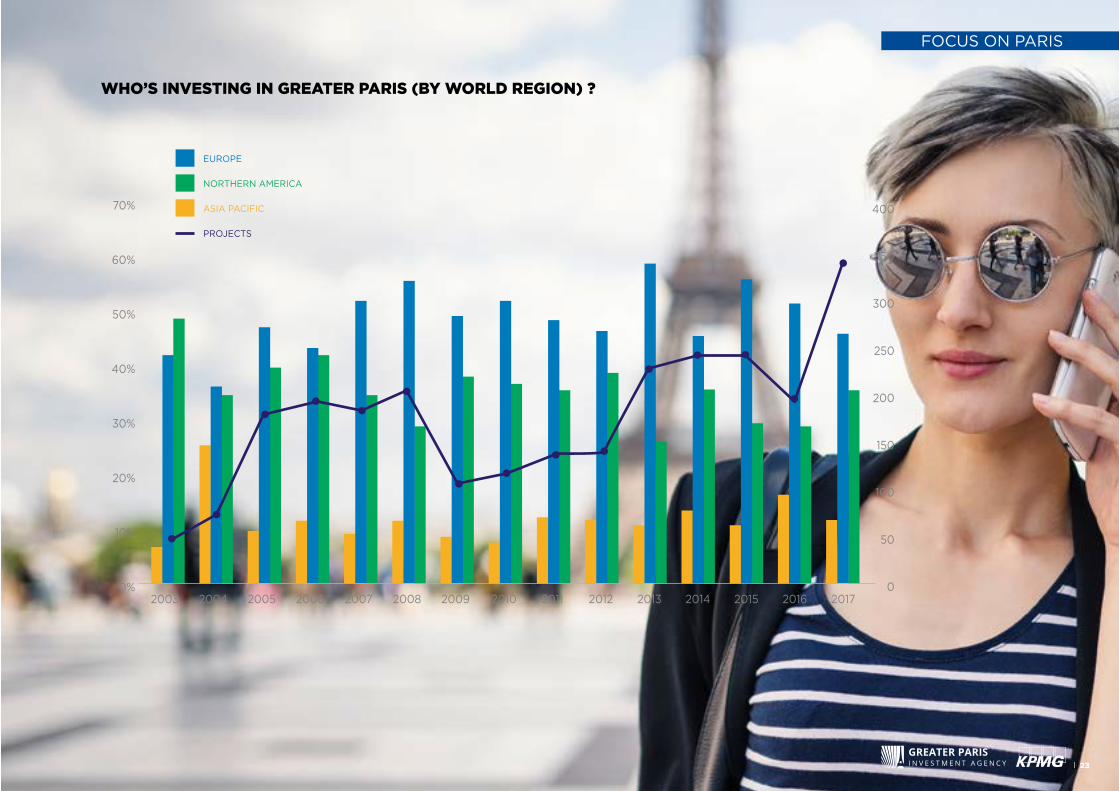
WHO’S INVESTING IN GREATER PARIS (BY WORLD REGION) ?
FOCUS ON PARIS
EUROPE
NORTHERN AMERICA
ASIA PACIFIC
PROJECTS
| 23
2003 2004 2005 2006 2007 2008 2009 2010 2011 2012 2013 2014 2015 2016 2017
70%
60%
50%
40%
30%
20%
10%
0%
400
350
300
250
200
150
100
50
0

PERCEPTIONS
¢
¢%
0 5 10 15 20 25 30 35 40
REVENUE (in ¤)
■ Less than 500 million■ Between 500 millions and 5 bilion■ More than 5 bilion
37%
40%
24%
POSITION OF THE INTERWIEVEE
FINANCIAL MANAGER
MARKETING / COMMUNICATION / MANAGER
DEVELOPMENT MANAGER
CEO
SALES MANAGER
HUMAN RESOURCES MANAGER
OTHERS
29%
33%
4%
13%
10%
4%
7%
The Monitor is a reliable tool for policymakers and investors, with a rigorous, transparent and stable methodology. It is an exclusive benchmark study by Greater Paris Investment Agency in partnership with KPMG.
This Monitor is designed to perceive and describe the fluid and ever-changing dynamics of our contemporary world, by focusing on the latest decisions rather on accumulated stocks of wealth. It uses homogenous indicators that reflect global movements and pinpoint the latest fluctuations.
As a result its rankings are much more open and evolving that other rankings, which focus on global cities’ accumulated wealth and “power”. In short, our Monitor is turned towards the future.
NORTHERN AMERICA
Canada 20United States 90Total 110
SOUTHERN AMERICA
Brazil 15Total 15
EUROPE
France 35Germany 35Italy 20Netherlands 10Spain 10Sweden 10Switzerland 20UK 50Ireland 10 Russia 20Total 220
ASIAChina 25Hong Kong 20India 20Japan 40South Korea 10Total 115
MIDDLE EAST
Kuwait 10Qatar 10Saudi Arabia 10UAE 20Total 50
METHODOLOGY
GLOBAL CITIES INVESTMENT MONITOR 2018
24 |
A poll conducted with a representative sample of
516 companies with international business settlements• 22 countries• 3 criteria:- Location of headquarters
- Industry
- Turnover
• Phone interviews with global business leaders(CEO, managing director, administrative and financial manager, sales manager, head of international investment)
12 February to 2 April 2018
¢
¢%
0 5 10 15 20 25 30 35 40
■ Service■ IT ■ Heavy industry■ Consumer goods
30% 40%
11% 19%
BUSINESS ACTIVITY

| 25
35 GLOBAL CITIESTop destinations in term of international Greenfield investments
Sao Paulo
Database“fDi markets” Financial Times, since January 2003
• 188 000 international investment projects
• 86 000 businesses all over the world
• 15,929 information sources: newspapers, magazines, associations, websites…
San Francisco
Los Angeles New York
Mexico
Toronto
Dubai
Abu Dhabi
DublinAmsterdam
Munich
BerlinLondon
Paris Francfort
New Dehli
Rangoon
Hyderabad
Pune
Bangalore
Shanghai
Tokyo
Sydney
Seoul
Beijing
Hong Kong
Istanbul
Moscow
BarcelonaMadrid
Ho Minh City
Singapour
Kuala Lumpur
Melbourne
Johannesburg
METHODOLOGY
International Greenfield InvestmentThe Monitor measures the number of published international "greenfield" investments collected in the fDi Markets database. International greenfield investments occur when a company launches new activities in a global city. They built up its economic potential and create jobs. Purely financial investments, like real estate transactions, privatisations or alliances are not included. Join ventures are included only when they result in job creation.
The Monitor uses the simplest possible unit: a published investment project, by contrast with expected job creations or capex, so as to maximize comparability and minimize interferences from local factors – currency fluctuations, governmental promotion, etc.)
The Top global cities for international greenfield investments list has been regularly updated to take account of the significant rebalances in the global economy.
INFOG RAPHICLorem ipsum dolor sit am et, consectetuer adipiscing elit, sed diam nonum my nibh
01 INFOG RAPHICLorem ipsum dolor sit amet, consectetuer adipiscing elit, sed diam nonum my nibh
02 INFOGRAPHICLorem ipsum dolor sit amet, consectetuer adipiscing elit, sed diam nonummy nibh
03
INFOG RAPHICLorem ipsum dolor sit am et, consectetuer adipiscing elit, sed diam nonum my nibh
04 INFOG RAPHICLorem ipsum dolor sit amet, consectetuer adipiscing elit, sed diam nonum my nibh
05 INFOGRAPHICLorem ipsum dolor sit amet, consectetuer adipiscing elit, sed diam nonummy nibh
06
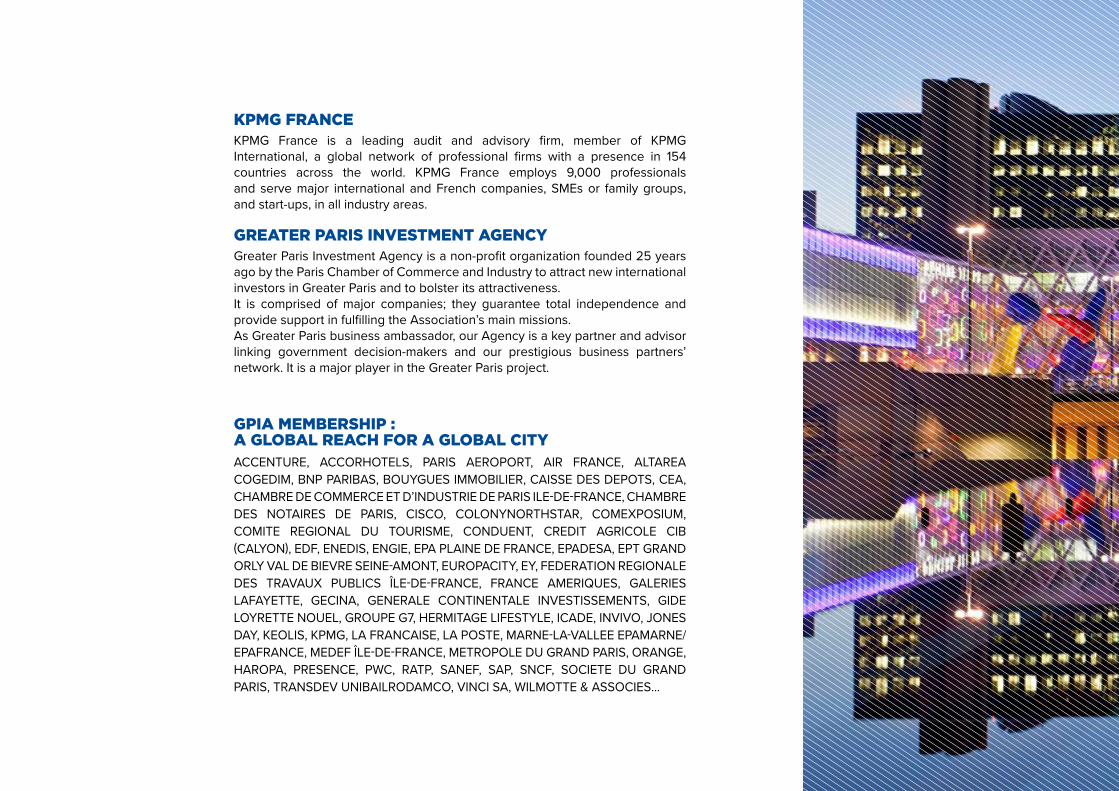
GPIA MEMBERSHIP : A GLOBAL REACH FOR A GLOBAL CITY ACCENTURE, ACCORHOTELS, PARIS AEROPORT, AIR FRANCE, ALTAREA COGEDIM, BNP PARIBAS, BOUYGUES IMMOBILIER, CAISSE DES DEPOTS, CEA, CHAMBRE DE COMMERCE ET D’INDUSTRIE DE PARIS ILE-DE-FRANCE, CHAMBRE DES NOTAIRES DE PARIS, CISCO, COLONYNORTHSTAR, COMEXPOSIUM, COMITE REGIONAL DU TOURISME, CONDUENT, CREDIT AGRICOLE CIB (CALYON), EDF, ENEDIS, ENGIE, EPA PLAINE DE FRANCE, EPADESA, EPT GRAND ORLY VAL DE BIEVRE SEINE-AMONT, EUROPACITY, EY, FEDERATION REGIONALE DES TRAVAUX PUBLICS ÎLE-DE-FRANCE, FRANCE AMERIQUES, GALERIES LAFAYETTE, GECINA, GENERALE CONTINENTALE INVESTISSEMENTS, GIDE LOYRETTE NOUEL, GROUPE G7, HERMITAGE LIFESTYLE, ICADE, INVIVO, JONES DAY, KEOLIS, KPMG, LA FRANCAISE, LA POSTE, MARNE-LA-VALLEE EPAMARNE/EPAFRANCE, MEDEF ÎLE-DE-FRANCE, METROPOLE DU GRAND PARIS, ORANGE, HAROPA, PRESENCE, PWC, RATP, SANEF, SAP, SNCF, SOCIETE DU GRAND PARIS, TRANSDEV UNIBAILRODAMCO, VINCI SA, WILMOTTE & ASSOCIES…
KPMG FRANCEKPMG France is a leading audit and advisory firm, member of KPMG International, a global network of professional firms with a presence in 154 countries across the world. KPMG France employs 9,000 professionals and serve major international and French companies, SMEs or family groups, and start-ups, in all industry areas.
GREATER PARIS INVESTMENT AGENCYGreater Paris Investment Agency is a non-profit organization founded 25 years ago by the Paris Chamber of Commerce and Industry to attract new international investors in Greater Paris and to bolster its attractiveness.It is comprised of major companies; they guarantee total independence and provide support in fulfilling the Association’s main missions.As Greater Paris business ambassador, our Agency is a key partner and advisor linking government decision-makers and our prestigious business partners’ network. It is a major player in the Greater Paris project.
INFOG RAPHICLorem ipsum dolor sit am et, consectetuer adipiscing elit, sed diam nonum my nibh
01 INFOG RAPHICLorem ipsum dolor sit amet, consectetuer adipiscing elit, sed diam nonum my nibh
02 INFOGRAPHICLorem ipsum dolor sit amet, consectetuer adipiscing elit, sed diam nonummy nibh
03
INFOG RAPHICLorem ipsum dolor sit am et, consectetuer adipiscing elit, sed diam nonum my nibh
04 INFOG RAPHICLorem ipsum dolor sit amet, consectetuer adipiscing elit, sed diam nonum my nibh
05 INFOGRAPHICLorem ipsum dolor sit amet, consectetuer adipiscing elit, sed diam nonummy nibh
06
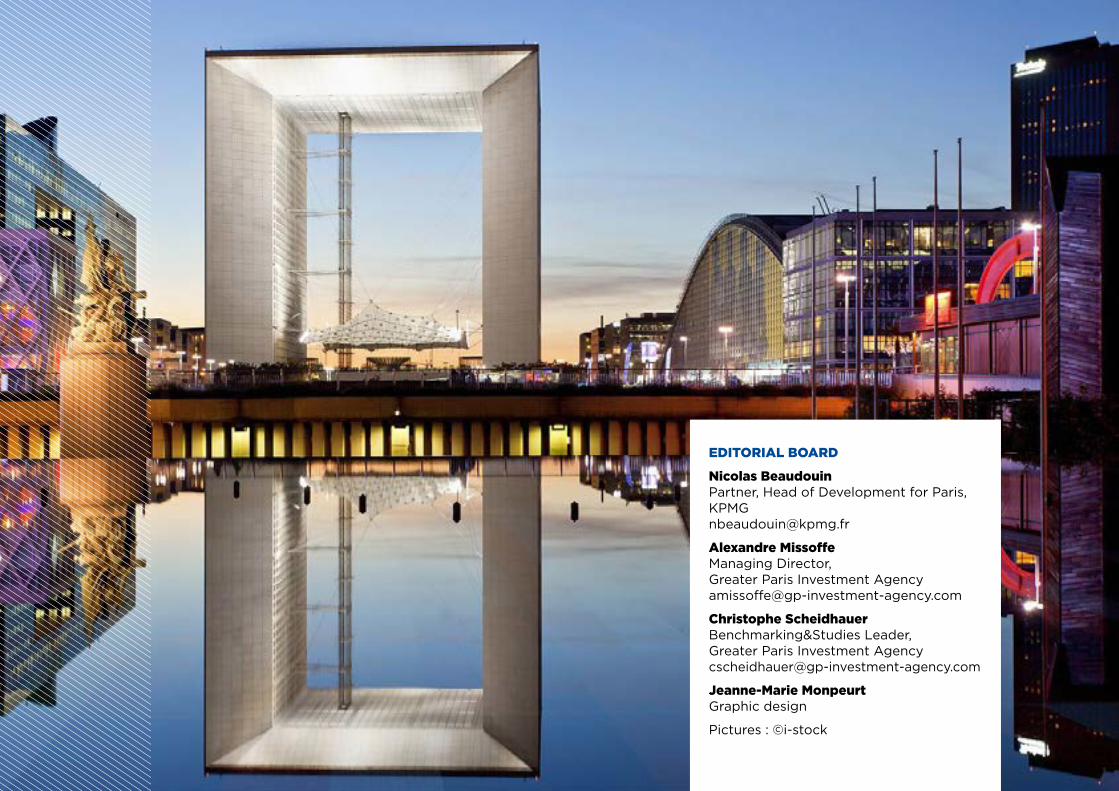
EDITORIAL BOARD
Nicolas Beaudouin Partner, Head of Development for Paris,[email protected]
Alexandre Missoffe Managing Director, Greater Paris Investment Agency [email protected]
Christophe Scheidhauer Benchmarking&Studies Leader, Greater Paris Investment Agency [email protected]
Jeanne-Marie Monpeurt Graphic design
Pictures : ©i-stock
INFOG RAPHICLorem ipsum dolor sit am et, consectetuer adipiscing elit, sed diam nonum my nibh
01 INFOG RAPHICLorem ipsum dolor sit amet, consectetuer adipiscing elit, sed diam nonum my nibh
02 INFOGRAPHICLorem ipsum dolor sit amet, consectetuer adipiscing elit, sed diam nonummy nibh
03
INFOG RAPHICLorem ipsum dolor sit am et, consectetuer adipiscing elit, sed diam nonum my nibh
04 INFOG RAPHICLorem ipsum dolor sit amet, consectetuer adipiscing elit, sed diam nonum my nibh
05 INFOGRAPHICLorem ipsum dolor sit amet, consectetuer adipiscing elit, sed diam nonummy nibh
06
www.greater-paris-investment-agency.com
Find all the results and press releases on : http://gp-investment-agency.com/
Beijing Central Business District