global banking industry outlook -...
TRANSCRIPT

Institute of International Finance
Global Banking Industry Outlook
Highlights
NPL Ratios of Chinese Commercial Banks and 16 Listed Banks
Sources: Wind, BOC Institute of International Finance
2017Q3 (Issue 12) June 28, 2017
●In 2017Q1, overall operation of global banks changed better
with varied improvement in size, profitability and asset
quality, but banking industry of Japan and Brazil were still
under heavy pressure.
●In 2017Q1, Chinese banking industry maintained sound
growth. Financial “deleverage” is expected to carry into the
second half year of 2017, accompanied by the basic stability
of NPL ratio, moderate pickup of credit growth rate, eased
decline of NIM and new development opportunities for
inclusive finance.
●The present report will make a research into the profitability
changes of listed banks since 2009.
BOC Institute of International Finance
Global Banking Industry Research Team
Team leader: Chen Weidong
Deputy leader: Zhang Xingrong
Team members: Shao Ke
Xiong Qiyue
Zhao Xue
Han Xueguang
Yi Xiaowei
Liu Yaying (Hong Kong)
Lin Hong (Sydney)
Wang Zhe (Tokyo)
Qu Kang (London)
Yang Bo (Hungary)
He Hua (Johannesburg)
Huang Xiaojun (New York)
Chen Wei (Brazil)
Contact: Shao Ke
Telephone: 010-66594540
Email: [email protected] Five Big Banks
Joint-stock banks
All banks


Global Banking Industry Outlook
BOC Institute of International Finance 1 2017Q3
Overall Operation is Steady with Pending Sustainability
-- Global Banking Industry Outlook (2017Q3)
In 2017Q1, global economic growth showed signs of recovery, overall operation of banks changed
better with varied improvement in size, profitability and asset quality: American and Chinese banks
grew steadily, banking performance in the UK, Eurozone, South Africa and ASEAN revived, but
banking industry of Japan and Brazil were still under heavy pressure. China’s listed banks1
reported a steady increase of assets and liabilities, quicker growth rate of net profits, steadily
higher contribution of non-interest income, eased momentum of double hikes in NPL amount and
ratio, steady reduction of allowance-to-NPL ratio, stable but increasing capital adequacy ratio
(CAR) and sound operation overall. Looking into the second half year of 2017, the economic and
financial landscape of the world will still hide great uncertainties and we should wait and see
whether the recovery of global banking industry will sustain; credit growth rate of Chinese banks
will pick up speed moderately, the credit distribution will continue to readjust, the declining trend
of net interest margin (NIM) will be eased, the NPL ratio will remain basically steady and inclusive
finance will embrace great development opportunities.
I. Operational Characteristics of G-SIBs
I.1 Business operation
1. Assets and liabilities increased with a dichotomy in structure
As of the end of 20162, assets and liabilities of 30 global systematically important banks (G-SIBs)
amounted to USD48.2 trillion and USD44.7 trillion, representing an increase of 0.6% and 0.7%
over 2015, and the average growth rate was higher than 2015 by 4.6 and 5.2 percentage points.
Compared with their international counterparts, China’s G-SIBs ranked ahead in terms of the
overall growth rate of assets and liabilities (both at 2.9%).
As of the end of 2016, deposits/liabilities and loans/assets of 30 G-SIBs were 57.1% and 39.2%
respectively with the former increasing by 0.6 percentage point and the latter decreasing by 0.1
percentage point both on a year-on-year basis. Of which, 15 of the 30 G-SIBs saw a rise of
loans/assets up to 3.2 percentage points; 18 reported a rise of deposits/liabilities up to 4.5
percentage points. By deposits/liabilities and loans/assets, figures of China’s G-SIBs were slightly
higher than the average of other G-SIBs, but the change degree was at par with their foreign
counterparts.
2. Net profits continued to drop
In 2016, net profits of 30 G-SIBs dropped by 9.6% year on year to USD266.97 billion, and the
corresponding figures for China’s G-SIBs were 7.2%3 and USD126.57 billion.
1 For the purpose of this report, “listed banks” refer to the following 16 commercial banks listed in China’s
A-share market: large commercial banks (ICBC, ABC, BOC, CCB and BOCOM), joint-stock commercial banks
(Merchants Bank, SPDB, Minsheng Bank, CITIC Bank, Industrial Bank, Everbright Bank, Huaxia Bank and
Ping An Bank) and city commercial banks (Bank of Beijing, Bank of Nanjing and Bank of Ningbo).
2 FY2016 for Japanese G-SIBs.
3 The drop was mainly due to exchange rate of U.S. dollars. If the net profits of China’s G-SIBs in 2016 are

Global Banking Industry Outlook
BOC Institute of International Finance 2 2017Q3
3. NIM edged up
In 2016, average NIM of 30 G-SIBs stood at 2.1%, up 0.5 percentage point year on year. NIM of
China’s G-SIBs arrived at 2.1%, down 0.2 percentage point year on year.
4. Operational efficiency nudged down
In 2016, cost-to-income ratio of 30 G-SIBs averaged at 68.4%, up 0.8 percentage point year on
year. Cost-to-income ratio of China’s G-SIBs was 29.0%, down 7.8 percentage points year on year.
5. CAR rose
As of the end of 2016, CAR of 30 G-SIBs rose by 0.8 percentage point year on year to 17.7% on
average, indicating larger steadiness. CAR of China’s G-SIBs, at 14.4%, unchanged from 2015.
6. Asset quality continued to improve
As of the end of 2016, average NPL ratio of 30 G-SIBs decreased by 0.3 percentage point year on
year to 2.4%, in contrast to an increase of 0.01 percentage point in the ratio of China’s G-SIBs to
1.7%.
7. Return figures declined slightly
In 2016, return on assets (ROA) of 30 G-SIBs, at 0.5%, stayed fundamentally unchanged from
2015, but the return on equity (ROE) declined by 1.5 percentage points to 5.5%. Also in the period,
ROA and ROE of China’s G-SIBs remained higher at 1.1% and 14.2%.
8. Valuation changed
As of the end of 2016, average price to book ratio (P/B ratio) of 30 G-SIBs was 0.9, 0.1 higher than
2015. Average P/B ratio of China’s G-SIBs was 0.8, slightly lower than the international level.
I.2 Outlook
In general, G-SIBs will show the following trends in the latter half year of 2017:
Balance sheet sizes will continue to change in different directions. Different from the further
contraction in the balance sheet of European G-SIBs, that of the U.S., Japan and China will
continue to swell.
They will still face heavy pressure for making profits. Due to the “interest rate hike” and the
“normalization of balance sheet”, the profitability of American G-SIBs is expected to enhance; as
the supply-side structural reform is deepening, China’s G-SIBs will experience slower growth rate
of profits in the short run; the profit prospect of G-SIBs in Europe and Japan, under the continued
impact of “negative interest rate” policy, will remain unoptimistic.
Capital indicators will continue to improve. As regulatory rules are coming into force gradually
around the world and everywhere, CAR of G-SIBs will rise further.
Asset quality will stabilize obviously. As the trend of global economic recovery becomes further
clear, it is expected that NPL ratio of G-SIBs will decrease to an all-time low.
presented in RMB, the result will be a year-on-year rise of 1.5%.

Global Banking Industry Outlook
BOC Institute of International Finance 3 2017Q3
II. Operation of Banking Industry in Major Economies and Outlook
II.1 The U.S. banking industry grew steadily and sustainably
1. Review of operation in 2017Q1
Assets and liabilities increased steadily. As of the end of 2017Q1, total assets of the U.S. banking
industry4 stood at USD16.97 trillion, up 4.13% compared with the same period of last year and
1.1% compared with the end of 2016; total liabilities amounted to USD15.07 trillion, up 4.26%
compared with the same period of last year and 1.06% compared with the end of 2016.
Net profits grew sustainably and all return indicators rose. In 2017Q1, the U.S. banking
industry reported net profits of USD44 billion, representing a sharp growth of 12.7% over the same
period of last year and an increase of 0.47% over 2016Q4. At the same time, ROA of the U.S.
banking industry rose from 0.94% in 2016 to 1.05%.
CAR continued to increase and NPL ratio went down further. As of the end of 2017Q1, tier 1
CAR of the U.S. banking industry increased by 28 BPs year on year and 19 BPs quarter on quarter
to 13.26%. NPL amount declined significantly by 11.5% over the same period of last year to
USD124.95 billion and NPL ratio fell by 24 BPs year on year to 1.34%.
2. Estimation on operation in 2017Q2
The U.S. has adjusted its monetary and regulatory policies in 2017Q2, exerting certain influence
on the banking operation. First, on June 8, the U.S. House of Representatives passed the Financial
Creating Hope and Opportunity for Investors, Consumers and Entrepreneurs Act (the “Financial
Choice Act 2.0”), the formal implementation of which will slash down the regulatory cost of banks.
Second, on June 14, the Fed decided to raise the target range for the federal funds rate by ¼
percentage point to 1 to 1¼ percent, which will help the U.S. banking industry to further lift the
NIM level; the Fed also issued addendum to the Policy Normalization Principles and Plans setting
forth the details of reducing the balance sheet, which will possibly affect the money supply and
banking size growth.
According to our estimation, the U.S. banking industry will score good operation overall to be seen
mainly in the following aspects:
First, the size will expand slightly. As of May 24, 2017, total assets of the U.S. banking industry
grew by 0.33% over the end of 2017Q1. Consistent with the trend, total assets of American banks
are expected to reach USD17.06 trillion by the end of Q2, up 0.56% and 0.32% compared with the
end of last quarter and a year earlier respectively. Total liabilities are expected to increase by
0.13% over the end of 2017Q1 and by 2.9% over the same period of last year to USD15.09 trillion.
Second, the profitability will improve stably. In 2017Q1, more than 57% of the American banks
reported a year-on-year increase of operating income, while only 4.1% suffered a loss. Considering
that the U.S. economy is recovering mildly, we reckon that the banking industry will earn more in
Q2 and the net profits will increase by 0.4% over 2017Q1 and by 1.0% over the same period of last
year to around USD44.2 billion.
Third, both the capital position and the risk profile will be in good conditions. The steadily
increasing trend of CAR of the U.S. banking industry that emerged since 2015Q1 will be carried
into 2017Q2, with tier 1 CAR rising by 10 BPs in the quarter to 13.36%, a year-on-year increase of
42 BPs. Meanwhile, the absolute scale and ratio of NPLs which started to decline since 2016 will
4 Banking industry herein refers to all deposit financial institutions protected by FDIC deposit insurance.

Global Banking Industry Outlook
BOC Institute of International Finance 4 2017Q3
trend down further, with NPL ratio falling to 1.30%, a decrease of 4 BPs over the end of 2017Q1.
II.2 Banking operation in the Eurozone had a rebound
1. Review of operation in 2017Q1
Deposits and loans grew at a faster but varied speed. As of the end of 2017Q1, outstanding
deposits amounted to EUR17.42 trillion in the Eurozone, a year-on-year increase of 2.09% which
was higher than the prior quarter by 1.63 percentage points. In terms of the country performance,
Lithuania, Slovakia and Estonia grew relatively quickly at 12.33%, 8.14% and 7.97% respectively,
but Greece, Ireland and Spain registered a negative growth at -16.39%, -3.53% and -2.50%
respectively.
Profits of major banks increased. In 2017Q1, ROA of major European banks5, at 0.51%,
increased by 0.8 percentage point compared with the same period of last year; ROE, at 8.9%,
increased by 1.7 percentage points compared with the same period of last year. Let’s turn eyes to
the three biggest banks in the Eurozone by capitalization: net profits of Banco Santander grew by
14.3% year on year to EUR1,867 million, net profits of BNP Paribas grew by 4.4% year on year to
EUR1,890 million and profits of ING fell by 9% year on year to EUR1,140 million. Besides,
Deutsch Bank drawing extensive concern generated higher-than-expected net profits after tax of
EUR575 million, a surge of 143% over a year earlier.
Risks were mitigated. As of the end of 2017Q1, tier 1 CAR of major European banks grew by one
percentage point to 13.4%, and their NPL ratio fell by 0.1 percentage point to 2.6%.
2. Estimation on operation in 2017Q2
In 2017Q2, the environment in which European banks operate is expected to change better steadily
in the following aspects: first, monetary policies will remain basically stable, laying a solid
foundation for the size-up of banking industry; second, the economy will recover. The
Manufacturing PMI of the Eurozone in May hit a new high over the past six years, and the
Optimistic Sentiment of Consumers and Investors reached the highest level in the last decade.
According to our estimation, the operation of European banking industry will improve further in
the following aspects:
Assets and liabilities will continue to grow. Deposits will grow at the previous speed to EUR17.5
trillion, and loans will rise to approximately EUR18.3 trillion.
Operational benefits will improve. ROA and ROE of banks will rise; key interest rate will remain
stable and NIM will possibly stay unchanged.
Risk indicators will remain stable. Alongside the gradual improvement of operational benefits,
the requirement of banks whether internally or externally on excessive high CAR has been relaxed,
so the CAR is expected to maintain the current level. The overall NPL ratio of Eurozone banks is
still high, and it may still take a period of time for the asset quality to accelerate improvement.
5 Including 27 banks, namely HSBC Holdings, Royal Bank of Scotland, Standard Chartered Bank, Lloyds Bank,
Barclays Bank, BNP Paribas, Societe Generale, Credit Agricole, Natixis, Deutsche Bank, Commerzbank,
UniCredit, Intesa Sanpaolo, BBVA, Banco Santander Brasil S.A., Credit Suisse, UBS, ING Group, ABN AMRO,
Danske Bank, Nordea, SEB, Svenska Handelsbanken AB, Swedbank, Norges Bank, KBC Group and Erste
Group Bank.

Global Banking Industry Outlook
BOC Institute of International Finance 5 2017Q3
II.3 Profitability of the UK banking industry was improved
1. Review of operation in 2017Q1
The asset size remained stable. As of the end of 2017Q1, the largest four banks in the UK6
reported total assets of GBP4.7 trillion, down 0.5% and 0.6% compared with the prior quarter and
the same period of last year respectively. Since the financial crisis, banks in the UK have been
pressed by the regulatory authorities and the general environment to downsize their assets to seek
for solutions to the “too big to fall” problem.
Net profits grew sharply. In 2017Q1, net profits of the largest four banks in the UK grew by 1.3%
year on year to GBP4.83 billion.
CAR rose but NPL ratio fell. As of the end of 2017Q1, the largest four banks in the UK had a
core tier 1 CAR of 13.8% on average, which edged up over the prior quarter (13.3%) and added by
1.15 percentage points over the same period of last year, indicating that the UK banks are exposed
to less risks. The NPL ratio was kept at around 2.2.
2. Estimation on operation in 2017Q2
In 2017Q2, the following two factors will produce certain influence upon the operation of UK
banks: First, the less spending power of residents will drag down related credit business. The UK’s
headline inflation in April (2.4%) and May (2.6%) nearly doubled the figure a year earlier, which
impaired the residents’ consumption confidence and level to certain extent and further affected the
operating activities of UK banks. Second, the UK general election result intensified Britain's
economic uncertainty. On June 9, the UK general election result was confirmed a Hung Parliament,
and the Conservatives lost the majority seats. Therefore, the composition and policies of the future
administration are brimming with uncertainties.
We estimate that the UK banking industry will show the following good performance in business
operation in 2017Q2:
Asset size will remain stable and may contract a little. Since the financial crisis, assets of the
largest four banks in the UK have been downsizing gradually and the combined figure may arrive at
about GBP4.6 trillion, down 2% and 5% compared with 2017Q1 and a year earlier respectively.
A modest increase is expected in net profits. According to our estimation, net profits of the largest
four banks in the UK will increase by 1.6% over 2017Q1 to about GBP4.9 billion in 2017Q2.
CAR and NPL ratio will stay at current levels. In Q1, average core CAR of the largest four banks
in the UK was far higher than 9.5% that is recommended by the Bank of England, thus meeting the
requirement of regulatory authorities and investors. It is expected to remain at 13.8% in Q2. NPL
ratio will continue to fall and approach 2% in Q2, a decrease of 0.2 percentage point and 0.4
percentage point over the end of 2016 and the same period of last year respectively.
II.4 The Japanese banking industry was under great stress to make profits
1. Review of operation in 2017Q1
Asset size expanded steadily. As of the end of 2017Q1, combined assets of the largest five
Japanese banks7 grew slightly by 0.6% over the end of 2016 and by 3.8% over the same period of
6 Namely, HSBC Holdings, Barclays Bank, Royal Bank of Scotland and Lloyds Bank. 7 The largest five banks in Japan, namely, Bank of Tokyo-Mitsubishi UFJ Ltd., Mizuho Financial Group, Inc. and Sumitomo Mitsui

Global Banking Industry Outlook
BOC Institute of International Finance 6 2017Q3
last year to JPY816 trillion.
Profitability decreased significantly. In FY2016 (April 2016 through March 2017), the largest
five Japanese banks reported net profits of JPY2.5 trillion, a decrease of 3.8% year on year.
Sumitomo Mitsui Financial Group managed to increase its net profits by 9.3%8, but the rest four
registered varied negative growths.
CAR rose but NPL ratio fell. As of the end of 2017Q1, average tier 1 CAR of the largest five
Japanese banks, at 13.1%, rose by 0.4 percentage point over the same period of last year; their NPL
ratio, at 1.0%, fell by 0.1 percentage point over a year earlier.
2. Estimation on operation in 2017Q2
In 2017Q2, Japan maintained its monetary policies but readjusted the regulatory policies exerting
certain influence upon banking operation. Specifically, first, new amendments to the Bank of Japan
Act were finalized on May 26. This will help to enhance the competitiveness of Japanese banks.
Second, the Financial Services Agency will impose restrictions on the securities investments made
by regional banks. This will adversely affect the performance of regional banks.
By our estimate, the Japanese banking industry will run business on a steady footing overall in
2017Q2.
Asset size will remain stable. Since Bank of Japan chose to un-change its monetary policy
framework, banking assets will continue to size up. We presume that asset size of the largest five
Japanese banks will be at par with that at the end of Q1 and augment by around 3.5% compared
with the same period of last year.
There is little possibility for the business results to grow. Without any change in the ultra-loose
monetary policy environment, Japan will see a year-on-year decrease of 3%-5% in the net profits of
its five largest banks in Q2 under continuous impact from the negative interest rate policy.
CAR and NPL ratio will not change. Average tier 1 CAR of the five largest Japanese banks has
reached 13.13%, meeting the regulatory requirement, so we think that they will maintain this level
in Q2. Average NPL ratio of the five largest Japanese banks will stay at about 1.0% since the
country does not change its loose monetary policies and the offshore economy shows signs of
recovery in Q2.
II.5 Major member countries of ASEAN reported a revival in banking activities
1. Review of operation in 2017Q1
Asset size continued to grow. As of the end of 2017Q1, total assets of Malaysian, Thai and
Indonesian banks increased by 4.8%, 0.02% and 10.7% year on year to MYR1.87 trillion,
THB17.65 trillion and IDR 6,829.6 trillion respectively.
Profitability was enhanced a lot. In 2017Q1, profits before tax of Malaysian and Indonesian
Financial Group, Resona Holdings and Sumitomo Mitsui Financial Group, own one half of total banking assets of Japan. 8 The main reason for performance improvement of Sumitomo Mitsui Financial Group: it set aside lots of provisions for the loss in
consumer finance and foreign stock holdings, etc. in the previous financial year, so its net profits for the current fiscal year grew
significantly over the prior fiscal year.

Global Banking Industry Outlook
BOC Institute of International Finance 7 2017Q3
banks increased by 3.9% and 59% year on year to MYR8.0 billion and IDR54.7 trillion respectively,
while the net profit base of Thailand’s banking industry was similar to a year earlier at THB51
billion.
Overall risks were controllable. As of the end of 2017Q1, CAR and NPL ratio of Malaysian
banking industry grew by 0.4 and 0.02 percentage point year on year to 17% and 1.62%
respectively; CAR of Thailand’s banking industry fell by 0.3 percentage point over the end of last
year to 17.8% and its NPL ratio rose by 0.3 percentage point to 3.1%; Indonesian banking industry
had CAR ratio of 22.9% and NPL ratio of 3.0%, up 0.8 and 0.2 percentage point over the same
period of last year respectively.
2. Estimation on operation in 2017Q2
The 14th general election will soon take place in Malaysia. The national government will possibly
step up infrastructure investment to stimulate domestic economy. In this context, Malaysian
economy is expected to grow further in the next two quarters, creating favorable conditions for the
banking industry to improve operation. Since 2017Q1, Thailand’s banks have started to tighten the
lending standards for commercial sectors of various sizes; and in Q2, the approval rate was merely
about 30%, resulting in a slower growth of bank loans in Thailand. Indonesian government required
the state-owned large banks to provide jumbo low-interest (minimum 7%) loans to the light rail
construction project in Jakarta, which gives those banks another headache in addition to the bad
debt rate problem.
By our estimate, the banking industry of major member countries of ASEAN will be well-run on a
whole in 2017Q2, as shown below:
Asset size will expand modestly. Total assets of Malaysian banking industry are expected to
increase by 5% year on year to MYR1.89 trillion in Q2. Because Thailand’s banks continue to
tighten the lending standards, the total assets will grow by 0.03% year on year to THB17.7 trillion
in Q2. The revival in economic activities of Indonesia will possibly drive total banking assets to rise
by 11% year on year to IDR7,046 trillion in Q2.
Profitability will be held steady. By estimates, Malaysian banking industry will report profits
before tax of MYR9.0 billion in Q2, representing a year-on-year increase of 0% and a
quarter-on-quarter increase of 12.5%; the accumulated net profits will reach MYR17.0 billion, up
1.79% compared with the same period of last year. We expect net profits of Thailand’s banking
industry will remain at around THB51.0 billion in Q2, at par with a year earlier and the last quarter;
the accumulated net profits will have nil growth over the same period of last year and stand at about
THB102.0 billion. Indonesian banking industry is expected to see a modest growth (20% year on
year) in net profits to IDR40.2 trillion in Q2. ROA will increase to 2.55% in Q2 and the
accumulated ROA will be about 2.5% for the first two quarters.
Capital indicators will continue to improve. We expect that CAR and NPL ratio of Malaysian
banking industry will stay around 16.9% and 1.66% in Q2, an increase of 0.1 and 0 percentage
point over a year earlier. And the CAR of Thailand’s banking industry will remain at 17.8%, but its
NPL ratio is likely to climb to 3%, up 0.3 and 0.1 percentage point over a year earlier. CAR of
Indonesian banking industry will remain high at 22.9%-23% in spite of a possible decline of 0.3
percentage point year on year; and its NPL ratio will grow by 0.1 percentage point year on year to

Global Banking Industry Outlook
BOC Institute of International Finance 8 2017Q3
3%.
II.6 Banking industry of South Africa maintained basic stability
1. Review of operation in 2017Q1
The size of assets and liabilities expanded marginally. 2017Q1 saw a year-on-year increase of
1.86% in total assets of South African banking industry to ZAR4.94 trillion and a year-on-year
growth of 2.4% in total liabilities to ZAR4.14 trillion.
Net profits were kept basically stable. In 2017Q1, net profits of South African banks totaled to
ZAR242.24 billion, a year-on-year growth of 18.5%. ROA (annualized) was 1.33%, basically flat
with the full-year figure (1.32%) of 2016; ROE (annualized) was 17.43%, down 0.2 percentage
point over the full-year figure (17.64%) of 2016.
CAR indicators and asset quality turned better. In 2017Q1, core tier 1 CAR of South Africa’s
banking industry was 13% on average, up 1.7 percentage points year on year, showing that overall
risk profile was further improved. NPL ratio hovered around 2.84%, down 0.49 percentage point
compared with a year earlier.
2. Estimation on operation in 2017Q2
On June 9, Moody’s Investors Service downgraded the long-term issuer and senior unsecured
ratings of the Government of South Africa to Baa3 from Baa2 (only a notch away from the “junk”
status), and assigned a negative outlook. Downgrade may cause liquidity squeeze in the market,
while higher financing cost of local banks will increase loan interest rate, thus exerting a negative
impact upon asset business size of banks; the impact of sovereign rating downgrade on the real
economy will also impair the solvency of borrowers, thereby producing a negative influence on
NPL ratio of banks.
By our estimate, banking industry of South Africa will remain stable on a whole in 2017Q2.
Asset base will remain stable. In April 2017, total banking assets increased by 2.9% year on year
to ZAR491 million, of which, loans and advances rose by 2.7% year on year to ZAR3.741 trillion.
We think the figures will change little in Q2.
Profits will increase steadily. Monthly net profits stood at ZAR80.82 billion in January through
April 2017 and the trend is expected to continue in Q2.
Capital indicators and asset quality will continue to improve. In April 2017, overall CAR of the
banking industry was 15.95%, and tier 1 CAR was 12.99%. Overall CAR is expected to be around
15.9% in 2017Q2. NPL ratio of South African banks was kept at 3% fundamentally. Since the
performance in 2017 is better than last year and remains steady, NPL ratio is expected to remain at
3% around in Q2.
II.7 Size-up of Brazilian banking industry was lackluster and the market performance was a
mixed bag
1. Review of operation in 2017Q1
Assets edged down and market concentration further increased. As of the end of 2017Q1, total

Global Banking Industry Outlook
BOC Institute of International Finance 9 2017Q3
assets of Brazilian banks decreased by 0.8% year on year to BRL8.35 trillion9; outstanding loans
fell by 9% year on year to BRL3.07 trillion; outstanding deposits grew by 6.2% year on year to
BRL2.14 trillion.
Large banks were back on the growth track but small and medium banks suffered a larger
loss. In Q1, the largest five Brazilian banks reported net profits of BRL17.3 billion, a year-on-year
surge of 29.2%. In contrast, small and medium banks witnessed worsening of business results.
Specifically, 28 of the 45 small and medium banks recorded a loss, the net loss was BRL600
million and the accumulated loss amount rose by 40% year on year.
NPL ratio continued to grow. As of 2017Q1, NPL ratio of Brazilian banking industry was as high
as 3.9%, an increase of 0.3 percentage point compared with the same period of last year. As of the
end of 2017Q1, CAR of Brazilian banking industry grew by 0.2 percentage point year on year to
16.1%.
2. Estimation on operation in 2017Q2
In 2017Q2, the environment in which Brazilian banks run business show the following
characteristics: First, the signs of economic resuscitation emerge but political turmoil has brought
uncertainties to banking operation. In 2017Q1, Brazilian economy grew by 1.12% quarter on
quarter, implying that the country has weathered through the two-year-long economic recession. On
May 18, a recording that appeared to show Brazilian President Michel Temer condoning the
payment of hush money to a jailed lawmaker was disclosed. The scandal will add uncertainties to
the recovery of Brazilian economy. Second, Moody’s does not believe in Brazilian banking industry.
In early June, Moody’s Investors Service downgraded credit rating of 19 Brazilian banks from
“Stable” to “Negative”. Third, interest margin business of banks is under stress. The market expects
that the central bank of Brazil will continue to adopt the loose monetary policy and cut the
benchmark interest rate from the current 10.25% to 8.25% before the end of the year. This will put
Brazilian banks, especially small and medium banks with limited capital and poor negotiation
power, under great stress.
II.8 Australian banks had an upturn in business activities
1. Review of operation in 2017Q1
Asset size expanded a little year on year but contracted quarter on quarter. As of the end of
2017Q1, Australian banking industry reported total assets of AUD4.5 trillion, down 2.0% compared
with the end of 2016. Encouraged by the loan growth, the total assets increased by AUD17.1 billion
or 0.4% compared with the same period of last year, but the year-on-year increase slowed down
further.
Net profits achieved year-on-year growth thanks to the improvement of earnings ratio. In
2017Q1, Australian banking industry realized net profits of AUD8,040 million, an increase of
AUD4,930 million or 158.5% over a year earlier. The profits before tax scored AUD12,020 million
in Q1, a year-on-year increase of AUD680 million or 6.0%.
CAR was on a rise while NPL ratio declined to a low level. As of the end of 2017Q1, CAR of
9 BRL1=RMB2.08 or USD0.3 on June 12, 2017.

Global Banking Industry Outlook
BOC Institute of International Finance 10
2017Q3
Australian banking industry grew by 0.5 percentage point year on year to 14.3%. The NPL ratio
declined by 0.1 percentage point year on year to about 0.4%, a new low since 2008.
2. Estimation on operation in 2017Q2
In 2017Q2, the operating environment of Australian banking industry witnessed the following
changes: First, the Australian government unveiled the fiscal budget for the new year which
introduced new requirements on operating cost of banks. In May 2017, the Australian government
released the government budget for the coming year including multiple policies directly related to
banks. This initiative is set to lift the operating cost of banks in the medium term. Second, the
supervision on housing loan was heightened which increased the pressure on operation of banks. In
early April, the Reserve Bank of Australia (RBA) published a report on financial stability which
mentioned the concern on the country’s housing market; the Australian Prudential Regulation
Authority (APRA) and the Australian Securities and Investment Commission (ASIC) under the
Australian Council of Financial Regulators announced successively to heighten the supervision and
regulation on interest-only housing loan.
By our estimate, banking industry of Australia will have an upturn in operation in 2017Q2.
Assets are expected to report a quarter-on-quarter growth. Total assets of Australian banking
industry will increase in Q2 with a quarter-on-quarter growth of 1.5% to 2.0%, and the asset
balance will be around AUD4.6 trillion, basically flat with the same period of last year.
Net profits are expected to show an upward trend. Net profits of Australian banking industry
will increase by 5.0% quarter on quarter and 2.4% year on year to AUD8,440 million in Q2.
CAR will possibly nudge down and NPL ratio may be pressured up. Due to dividend
distribution and loan growth, etc., there is possibility for CAR of Australian banking industry to
nudge down, but the ratio is expected to stay at 14.0%, a quarter-on-quarter decrease of 0.3
percentage point but no change over the same period of last year. We expect the NPL ratio to rise
slightly by 0.5% in Q2, a quarter-on-quarter increase of 0.1 percentage point but no change over the
same period of last year.
III. China’s Banking Industry Review and outlook
III.1 Operation of listed banks in 2017Q1
In 2017Q1, overall operation of listed banks took on the following characteristics: assets and
liabilities increased steadily at obviously different speeds; net profit growth quickened and
profitability continued to weaken; the proportion of deposits decreased and that of loans increased,
while non-interest income made greater contribution stably; the momentum that the amount and
ratio of NPLs grew faded, while the allowance-to-NPL ratio fell stably; CAR rose stably, but the
loan-to-deposit ratio scored a big decrease.
1. Assets and liabilities grew steadily at obviously different speeds
As of the end of 2017Q1, total assets and total liabilities of listed banks were RMB138.2 trillion
and RMB128.1 trillion respectively, up 12.1% and 12.2% from a year earlier. The growth rate was
up by 0.3 and 0.7 percentage point compared with the same period of 2016 respectively. The assets
and liabilities of China’s Big Five were RMB94.6 trillion and RMB87.3 trillion respectively, up
Global Banking Industry Outlook
BOC Institute of International Finance 11
2017Q3
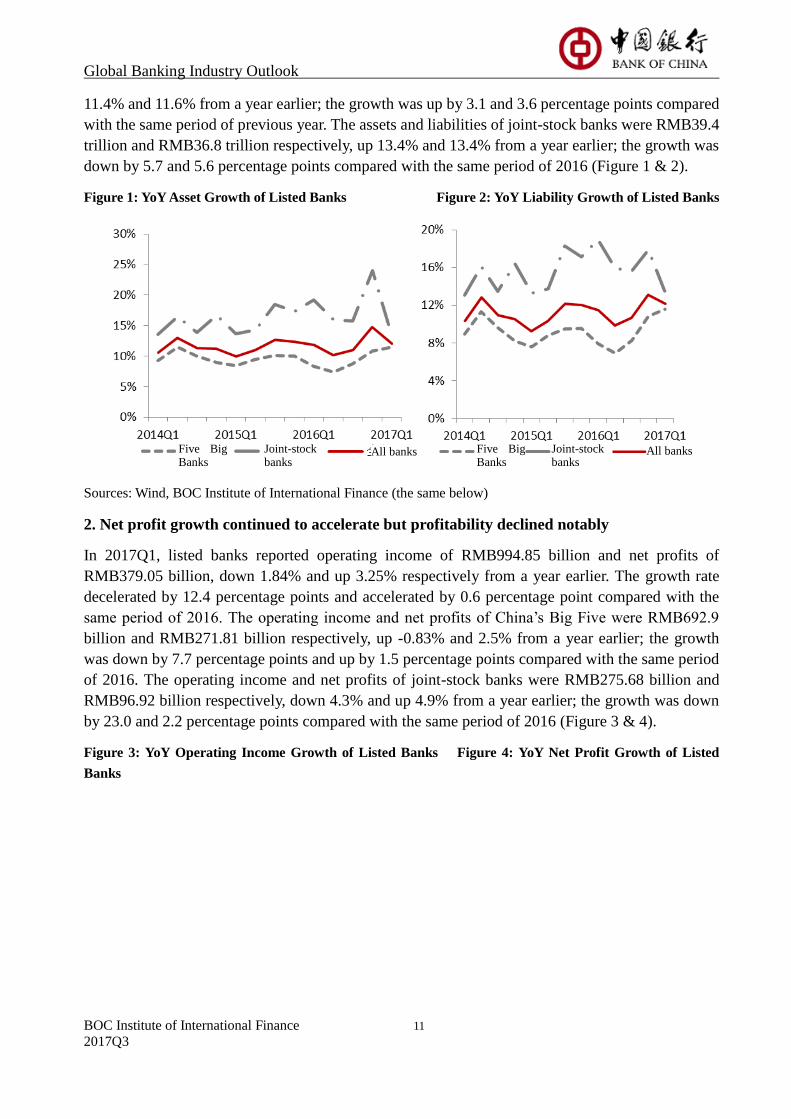
11.4% and 11.6% from a year earlier; the growth was up by 3.1 and 3.6 percentage points compared
with the same period of previous year. The assets and liabilities of joint-stock banks were RMB39.4
trillion and RMB36.8 trillion respectively, up 13.4% and 13.4% from a year earlier; the growth was
down by 5.7 and 5.6 percentage points compared with the same period of 2016 (Figure 1 & 2).
Figure 1: YoY Asset Growth of Listed Banks Figure 2: YoY Liability Growth of Listed Banks
Sources: Wind, BOC Institute of International Finance (the same below)
2. Net profit growth continued to accelerate but profitability declined notably
In 2017Q1, listed banks reported operating income of RMB994.85 billion and net profits of
RMB379.05 billion, down 1.84% and up 3.25% respectively from a year earlier. The growth rate
decelerated by 12.4 percentage points and accelerated by 0.6 percentage point compared with the
same period of 2016. The operating income and net profits of China’s Big Five were RMB692.9
billion and RMB271.81 billion respectively, up -0.83% and 2.5% from a year earlier; the growth
was down by 7.7 percentage points and up by 1.5 percentage points compared with the same period
of 2016. The operating income and net profits of joint-stock banks were RMB275.68 billion and
RMB96.92 billion respectively, down 4.3% and up 4.9% from a year earlier; the growth was down
by 23.0 and 2.2 percentage points compared with the same period of 2016 (Figure 3 & 4).
Figure 3: YoY Operating Income Growth of Listed Banks Figure 4: YoY Net Profit Growth of Listed
Banks
Five Big Banks
Five Big Banks
Joint-stock banks
Joint-stock banks
All banks All banks

Global Banking Industry Outlook
BOC Institute of International Finance 12
2017Q3
In 2017Q1, net interest margin (NIM) and net interest spread (NIS)10 of listed banks decreased by
0.39 and 0.45 percentage point compared with the same period of last year to 2.08% and 2.23%.
Specifically, NIM and NIS of China’s Big Five fell by 0.24 and 0.3 percentage point year on year
respectively to 1.97% and 1.87%; NIM and NIS of the joint-stock banks declined by 0.52 and 0.6
percentage point year on year respectively to 2.16% and 2.54%.
In 2017Q1, ROA and ROE of listed banks dropped by 0.1 percentage point and 1.5 percentage
points year on year to 1.02% and 14.89% respectively. Specifically, ROA and ROE of China’s Big
Five fell by 0.1 percentage point and 2.0 percentage points year on year respectively to 1.13% and
14.15%; ROA and ROE of the joint-stock banks declined by 0.1 percentage point and 1.5
percentage points year on year respectively to 0.96% and 14.79%.
In 2017Q1, cost-to-income ratio of listed banks was 25.09%, up 1.1 percentage points year on year.
Of which, cost-to-income ratio of China’s Big Five dipped by 0.2 percentage point year on year to
22.95%, and that of joint-stock banks climbed by 1.5 percentage points year on year to 26.07%.
3. The proportion of deposits, different from that of loans, shrank while the contribution of
non-interest income continued to enlarge
As of the end of 2017Q1, the deposit balance of listed banks represented 73.3% of total liabilities
while the loan balance accounted for 53.3% of total assets, down 1.6 and up 2.0 percentage points
respectively year on year. With respect to China’s Big Five, the two proportions, at 79.5% and
56.1%, shrank by 0.8 percentage point and enlarged by 2.1 percentage points over the same period
of last year respectively; as to the joint-stock banks, the two proportions, at 59.7% and 48.6%,
decreased by 3.5 and increased by 2.3 percentage points over the same period of last year
respectively.
As of the end of 2017Q1, non-interest income of listed banks contributed 36.0% to total income, up
4.3 percentage points year on year. Of which, non-interest income of China’s Big Five made an
contribution of 36.2%, up 4.4 percentage points over the same period of last year; and such
contribution was 36.4% for joint-stock banks, up 4.1 percentage points year on year.
10 In the report, NIM, NIS, ROA, ROE, cost-to-income ratio, CAR, tier 1 CAR and core tier 1 CAR are the arithmetic average
while proportion of non-interest income, NPL ratio, allowance-to-loan ratio and loan-to-deposit ratio are the weighted average.
Five Big Banks
Five Big Banks
Joint-stock banks
Joint-stock banks
All banks All banks

Global Banking Industry Outlook
BOC Institute of International Finance 13
2017Q3
4. The momentum that the amount and ratio of NPLs grew faded further while
allowance-to-NPL ratio fell stably
As of the end of 2017Q1, outstanding NPLs of listed banks amounted to RMB1.2 trillion, up 11.6%
from a year earlier, 32.2 percentage points lower than the same period of 2016; NPL ratio, at 1.67%,
fell by 0.02 percentage point year on year. Specifically, outstanding NPLs of China’s Big Five
amounted to RMB848.87 billion, representing a year-on-year growth of 6.3% which declined by
32.2 percentage points compared with the growth a year earlier; the NPL ratio was reduced by 0.1
percentage point year on year to 1.68%. Outstanding NPLs of joint-stock banks amounted to
RMB324.25 billion, up 27.2% from a year earlier, 20.1 percentage points lower than the same
period of 2016; NPL ratio, at 1.70%, rose by 0.1 percentage point year on year.
As of the end of 2017Q1, the allowance-to-NPL ratio of listed banks stood at 154.9%, down 9.1
percentage points over the same period of 2016. The ratio of China’s Big Five and joint-stock banks
were 158.1% and 174.7% respectively, up 1.6 and down 4.5 percentage points from the same period
of last year. In particular, the ratio of some listed banks has already fallen below the regulatory red
line of 150%.
5. CAR steadied higher, loan-to-deposit ratio had a big reduction
In 2017Q1, CAR, tier 1 CAR, and core tier 1 CAR of listed banks arrived at 12.8%, 10.6% and
9.9% respectively, up 0.1, 0.1 and 0.7 percentage point from the same period of 2016. In regard to
the Big Five, the three indicators read at 13.9%, 12.2% and 12.4% respectively, representing a
decrement of 0.3 percentage point, a fall of 0.2 percentage point and an increment of 0.6 percentage
point compared with the same period of last year; with respect to the joint-stock banks, the three
indicators read at 12.1%, 10.1% and 9.0% respectively, representing a growth of 0.4 percentage
point, an increase of 0.4 percentage point and a decline of 0.1 percentage point over the same
period of 2016.
As of the end of 2017Q1, the loan-to-deposit ratio of listed banks stood at 75.9%, down 6.1
percentage points over the same period of 2016. Of which, the ratio of China’s Big Five dipped by
9.4 percentage points year on year to 72.8%, and that of joint-stock banks climbed by 4.3
percentage points year on year to 87.2%.
III.2 Outlook on banking operation in 2017
1. Operating environment of banks in Q2
In 2017Q2, the operating environment of Chinese banks has deteriorated in the following aspects
compared with the prior quarter:
First, economic growth tends to slow down while remaining stable. On the demand side,
investment growth slowed down mainly due to a sharp year-on-year fall in infrastructure
investment growth; consumption growth was the same as a year earlier but it may be dragged by
income growth and high housing price; foreign trade recovered on the back of recent improvement
in EU economy and base effect. On the supply side, industrial production remained steady on the
whole and the service industry maintained fast growth. GDP is expected to slow to about 6.8% in
Q2.

Global Banking Industry Outlook
BOC Institute of International Finance 14
2017Q3
Second, the monetary policy, albeit remaining steady, is tightened somewhat. In the first five
months of 2017, China’s central bank conducted net currency withdrawal of RMB795 billion
through open market operations. At the end of May, M2 grew by 9.6% year on year, down 0.9
percentage point from April. Since Q2, SHIBOR, yield of wealth management products and interest
rate of interbank negotiable certificates of deposit have gone high continuously, exerting a big
influence on liability cost of commercial banks. NIM and NIS are under great downward pressure.
Third, increasingly better regulation is a trend. Since Q2, the People’s Bank of China, as well as
the China Banking Regulatory Commission, the China Securities Regulatory Commission and the
China Insurance Regulatory Commission have co-issued a number of policies on the massive
rectification of interbank business, wealth management business and non-compliance in investment
business11. In the short run, the release of regulatory measures will exert a big influence on such
businesses as bank wealth management and interbank negotiable certificates of deposit. However,
in the long run, stricter regulation will help commercial banks to standardize their activities and
guide relevant businesses to develop orderly and healthily.
In conclusion, we expect net profits of listed banks to grow by about 3.5% year on year, assets and
liabilities to grow by around 12% and 12.5% respectively, and NPL ratio to rise by 1.68% or so in
2017Q2.
2. Outlook
The operation of listed banks in 2017H2 is expected to take on the following characteristics in the
context of steadily decelerating economic growth, steadily tightened monetary policy and
increasingly stricter regulatory policies:
First, “deleverage” efforts will continue in the financial industry. Since Q2, the People’s Bank
of China, as well as the China Banking Regulatory Commission, the China Securities Regulatory
Commission and the China Insurance Regulatory Commission have released a series of regulatory
documents for the purpose of launching special rectifications mainly in interbank negotiable
certificates of deposit, bank wealth management and entrusted investment, indicating increasingly
more efforts on deleverage in the financial industry.
Second, NPL ratio will maintain basic stability. The NPL ratio of commercial banks at the end of
2017Q1 was basically at par with that at the end of 2016, and the proportion of special-mention
loans shrank by 0.1 percentage point compared with the end of 2016 to 3.77%. In the same period,
the formation rate of NPLs fell as well.
Third, credit growth rate will expedite modestly and credit distribution will be readjusted
continuously. In 2017H2, as the market center shifts upwards, corporate bonds will still play a
small part in financing activities, loan growth rate will have a mild pickup and loan interest rate will
edge up alongside the increase of liability cost. We expect that infrastructure construction with a
higher comprehensive return and medium and high-end manufacturing will be the key targets of
corporate lending, while agro-related loans and SME loans will also increase.
11 For example, the CBRC has released the special policies on addressing the "violation of financial laws, regulatory rules and
internal regulations", the "regulatory arbitrage, arbitrage from shunning money from flowing into the real economy and connected
arbitrage" and the "improper innovation, improper transaction and improper charging".

Global Banking Industry Outlook
BOC Institute of International Finance 15
2017Q3
Fourth, the decreasing trend of NIM will be alleviated. In 2017Q1, NIM of listed banks,
exposed to the external shock that regulatory policies are increasingly stricter, was at a low level.
NIM of commercial banks tends to improve against the steady but slightly tightened monetary
policy and the continuous move-up of average interest rate.
Fifth, inclusive finance will embrace great development opportunities. The Report on the Work
of the Government delivered in the year says that “We will encourage large and medium
commercial banks to establish inclusive finance departments”. The CBRC issued the Program on
Setup of Inclusive Finance Departments in Medium and Large-sized Commercial Banks. So far,
some large commercial banks have officially set up the inclusive financial department; by the end
of the year, we expect that the department will be established in all large commercial banks, making
financial services to expand coverage and become more accessible.
Sixth, highly international banks will possibly benefit from the U.S. dollar appreciation. The
Belt and Road Forum for International Cooperation was held in May, 2017, achieving a lot and
offering valuable opportunities for commercial banks to support the B&R initiative. At the same
time, the Fed’s interest hike and balance sheet contraction will heighten the expectation on
strengthening of U.S. dollar’s exchange rate, so highly international banks and banks having lots of
USD assets will benefit in general.
3. Forecast of key operating indicators
Table 1: Forecast of Key Indicators of China’s Listed Banks in 2017Q2 (%)
Type Key indicator 2015
(R)
2016
(R)
2017
Q1 (R) Q2 (E)
Full year
(F)
Size Asset growth 12.4 12.0 12.1 12.0 12.0
Liability growth 12.0 12.5 12.2 12.5 12.3
Profits Net profit growth 1.9 3.0 3.3 3.5 3.5
Structure
Proportion of loans 51.1 51.5 53.3 52.5 52.0
Proportion of deposits 74.1 73.0 73.3 73.5 72.5
Contribution of
non-interest income 26.1 30.5 36.0 31.0 30.5
Quality NPL ratio 1.64 1.70 1.67 1.68 1.67
Allowance-to-NPL ratio 169.2 160.0 154.9 161.0 165.0
Capital CAR 12.8 13.0 12.8 13.0 13.1
Note: R: Review; E: Estimation; F: Forecast.

Disclaimer
This report is prepared by BOC Institute of International Finance. The information contained in this report is
from publicly available sources.
The views or estimates contained in this report only represent the judgment of the author as of the date hereof.
They don’t necessarily reflect the views of BOC. BOC Institute of International Finance may change the views or
estimates without prior notice, and shall not be held liable for update, correction or revision of this report.
The contents and views in the report are for information purpose only and do not constitute any investment
advice. No responsibility is held for any direct and indirect investment consequences as a result of the
information provided in the report.
The copyright of this report is exclusively owned by BOC Institute of International Finance. No individuals and
institutions shall be allowed to copy, reproduce and publish the whole or part of the report without written
consent. In case of quotation, reference to BOC Institute of International Finance shall be given, and any
quotation, abridgment and revision that deviate from the original meaning of the report shall be prohibited. BOC
Institute of International Finance reserves the right to take legal actions on any violation and any quotation that
deviates the original meaning of the report.

BOC Institute of International Finance
1 Fuxingmen Nei Street, Beijing, 100818 China
Tel: +86-10-66592779
Fax: +86-10-66030183