china’s economic and financial...
TRANSCRIPT
Institute of International Finance
China’s Economic and Financial Outlook
Highlights
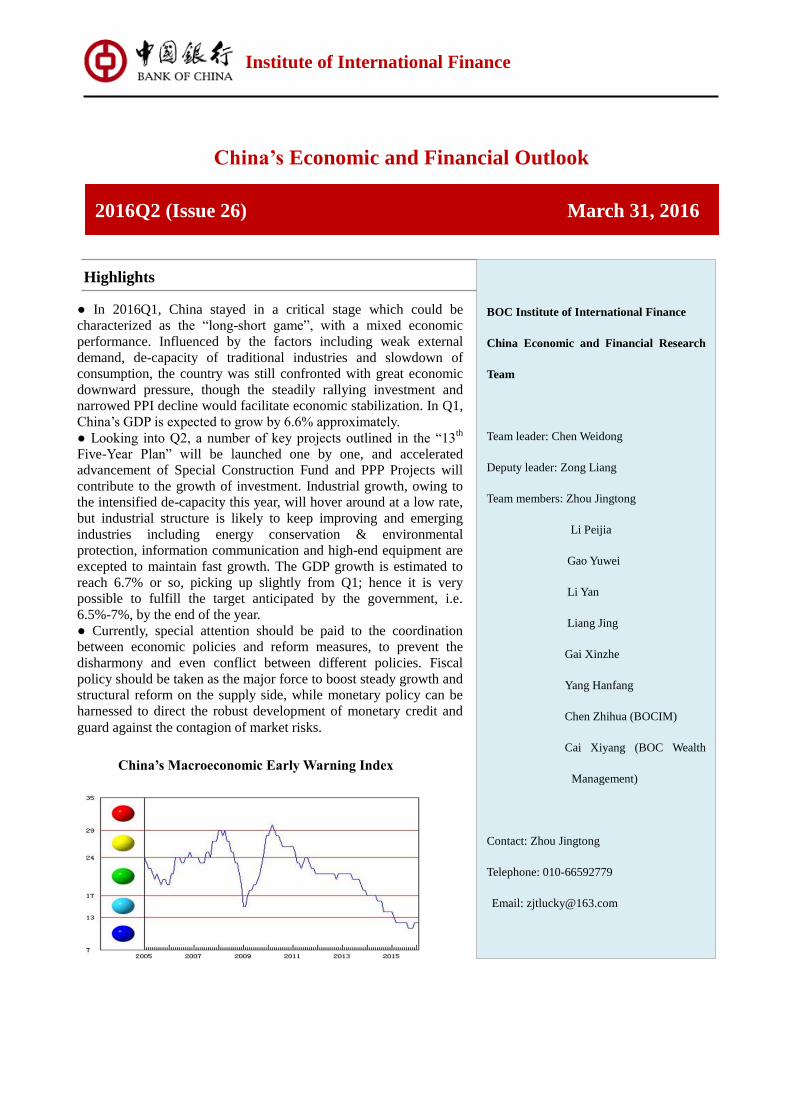
China’s Macroeconomic Early Warning Index
● In 2016Q1, China stayed in a critical stage which could be
characterized as the “long-short game”, with a mixed economic
performance. Influenced by the factors including weak external
demand, de-capacity of traditional industries and slowdown of
consumption, the country was still confronted with great economic
downward pressure, though the steadily rallying investment and
narrowed PPI decline would facilitate economic stabilization. In Q1,
China’s GDP is expected to grow by 6.6% approximately. ● Looking into Q2, a number of key projects outlined in the “13
th
Five-Year Plan” will be launched one by one, and accelerated
advancement of Special Construction Fund and PPP Projects will
contribute to the growth of investment. Industrial growth, owing to
the intensified de-capacity this year, will hover around at a low rate,
but industrial structure is likely to keep improving and emerging
industries including energy conservation & environmental
protection, information communication and high-end equipment are
excepted to maintain fast growth. The GDP growth is estimated to
reach 6.7% or so, picking up slightly from Q1; hence it is very
possible to fulfill the target anticipated by the government, i.e.
6.5%-7%, by the end of the year. ● Currently, special attention should be paid to the coordination
between economic policies and reform measures, to prevent the
disharmony and even conflict between different policies. Fiscal
policy should be taken as the major force to boost steady growth and
structural reform on the supply side, while monetary policy can be
harnessed to direct the robust development of monetary credit and
guard against the contagion of market risks.
BOC Institute of International Finance
China Economic and Financial Research
Team
Team leader: Chen Weidong
Deputy leader: Zong Liang
Team members: Zhou Jingtong
Li Peijia
Gao Yuwei
Li Yan
Liang Jing
Gai Xinzhe
Yang Hanfang
Chen Zhihua (BOCIM)
Cai Xiyang (BOC Wealth
Management)
Contact: Zhou Jingtong
Telephone: 010-66592779
Email: [email protected]
2016Q2 (Issue 26) March 31, 2016
China’s Economic and Financial Outlook
BOC Institute of International Finance 1 2016Q2
A Mixed Start in the Economic Sphere, and To-be-Enhanced Policy
Coordination
----China’s Economic and Financial Outlook (2016Q2)
In 2016Q1, China stayed in a critical stage which could be characterized as the “long-short game”,
with a mixed economic performance. Influenced by the factors including weak external demand,
de-capacity of traditional industries and slowdown of consumption, the country was still
confronted with great economic downward pressure, though the steadily rallying investment and
narrowed PPI decline would facilitate economic stabilization. In Q1, China’s GDP is expected to
grow by 6.6% approximately. Looking into Q2, a number of key projects outlined in the “13th
Five-Year Plan” will kick off one by one, and accelerated advancement of Special Construction
Fund and PPP Projects will contribute to the growth of investment. Industrial growth, owing to the
intensified de-capacity this year, will hover around a low rate, but industrial structure is likely to
keep improving and emerging industries including energy conservation & environmental
protection, information communication and high-end equipment are excepted to maintain fast
growth. The GDP growth is estimated to reach 6.7% or so, picking up slightly from Q1; hence it is
very possible to fulfil the target anticipated by the government, i.e. 6.5%-7%, by the end of the
year.
Macroeconomic policy will change the previous excessive emphasis on aggregate demand
management and pay more attention to the structural reform on the supply side, which will have a
profound impact on China's economic development model and motivation mechanism. To contain
economic downward pressure, tighten up structural reform on the supply side, guard against
cross-sector contagion of financial risks and prevent asset price bubbles, are the main difficulties
and challenges faced by Chinese economy. At present, China should put focus on the coordination
between economic policies and reform measures, to circumvent the disharmony and even conflict
between different policies. In terms of macro policies, fiscal policy should be taken as the major
force to boost steady growth and structural reform on the supply side, increase the efforts in tax
cuts and fee clearance, improve the supply efficiency of public services, further standardize the
management of local government debts, and avoid fiscal and financial risks; monetary policy
should be harnessed to enhance the use of structural instruments, and guide the robust development
of monetary credit and steady decline of market interest rate by grasping the opportunities brought
about by the RRR cut, hence preventing cross-sector spread of market risk. Meanwhile,
tailor-made policies should be applied to different cities, to balance the relationship between real
estate destock and bubble suppression.
I. 2016Q1 Economic Review and Q2 Outlook
I.1 Main characteristics of economic operation in Q1: mixed performance
In 2016Q1, China stayed in a critical stage which could be characterized as the “long-short game”,
with a mixed economic performance. Satisfactorily, the “stable growth” policy started to take effect,
with the explosive growth of new projects and stabilized investment growth, the prices of energy
and raw materials rallied, and PPI decline narrowed. However, troublesomely, the economy
showed slower growth of indicators like industrial production and consumption, further decline in
exports, weak private investment and unstable foundation for stabilization, suggesting the
sustained great downward pressure. Specific characteristics are descried as follows:

China’s Economic and Financial Outlook
BOC Institute of International Finance 2 2016Q2
Figure 1: China’s Quarterly GDP Growth Figure 2: China’s Macroeconomic Climate Early
Warning System
Sources: Wind, BOC Institute of International Finance
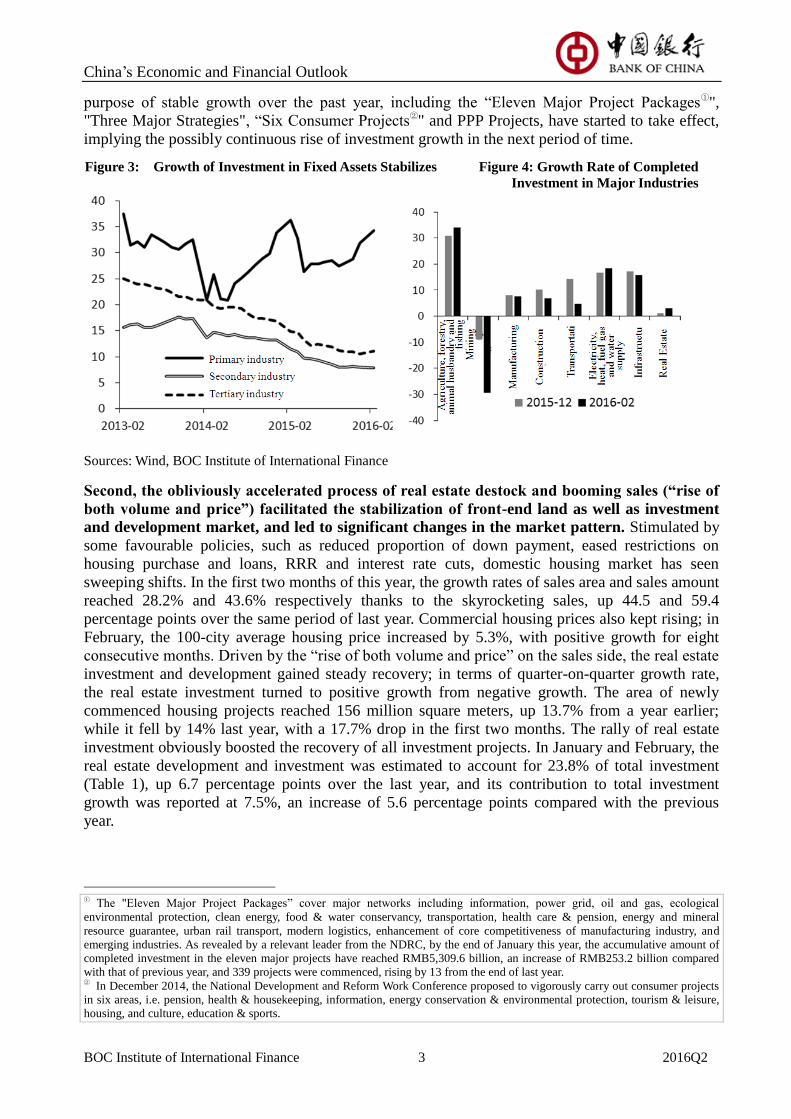
First, investment achieved a "good start", with obvious disparities in the investment
structure and explosive growth of new projects. The first two months witnessed a year-on-year
investment growth of 10.2% (Figure 3), up 0.2 percentage points from last year, and also
significantly higher than the market expectation (about 9%). In the context of economic downturn,
the investment recovery would be of great significance for stabilizing economic development and
boosting market confidence. Agriculture, infrastructure and strategic emerging industries
encouraged by national policies, owing to the differentiated investment structure (Figure 4),
presented fast investment growth, while some traditional industries were confronted with great
de-capacity pressure, bleak prospect and poor profitability, with the scale of investment contracting
continuously. In terms of infrastructure investment, for instance, the investment in water project
management and public facilities management increased by 24.7% and 26.5% respectively;
compared with 2015, the investment growth (18.5%) of industries including electricity, heat, gas
and water production & supply was 1.9 percentage points higher. The investment in equipment
manufacturing industry grew by 11.3% year on year, up 1.1 percentage points over last year and
3.8 percentage points higher than that of the entire manufacturing industry; the investment growth
of auto manufacturing industry stood at 13.9%, a year-on-year growth of 8.8 percentage points; the
investment in textile industry rose by 13.5%, up 4.5 percentage points year-on-year; and a growth
rate of 23.8% was reported for the food manufacturing industry, an increase of 13.8 percentage
points over the previous year. Meanwhile, the investment in energy-intensive industries presented
negative growth under the background of sluggish market demand, de-capacity and deleverage. In
January and February, the investment in energy-intensive manufacturing industry declined by 2.5%
year on year, compared with the zero growth in last year; among the five major industries
(including steel, coal chemical, cement, flat glass and electrolytic aluminium), the investment in
four industries went down.
New projects constitute a very important leading indicator for the judgment on investment.
Accelerated growth of new projects generally means the acceleration of investment growth in the
next period of time. In the first two months this year, the planned total investment in new projects
grew by 41.1%, up 42.9 percentage points compared with the same period of last year. Its rapid
growth indicated that a series of investment policies issued by the Chinese Government for the
China’s Economic and Financial Outlook
BOC Institute of International Finance 3 2016Q2
purpose of stable growth over the past year, including the “Eleven Major Project Packages①",
"Three Major Strategies", “Six Consumer Projects②" and PPP Projects, have started to take effect,
implying the possibly continuous rise of investment growth in the next period of time.
Figure 3: Growth of Investment in Fixed Assets Stabilizes Figure 4: Growth Rate of Completed
Investment in Major Industries
Sources: Wind, BOC Institute of International Finance
Second, the obliviously accelerated process of real estate destock and booming sales (“rise of
both volume and price”) facilitated the stabilization of front-end land as well as investment
and development market, and led to significant changes in the market pattern. Stimulated by
some favourable policies, such as reduced proportion of down payment, eased restrictions on
housing purchase and loans, RRR and interest rate cuts, domestic housing market has seen
sweeping shifts. In the first two months of this year, the growth rates of sales area and sales amount
reached 28.2% and 43.6% respectively thanks to the skyrocketing sales, up 44.5 and 59.4
percentage points over the same period of last year. Commercial housing prices also kept rising; in
February, the 100-city average housing price increased by 5.3%, with positive growth for eight
consecutive months. Driven by the “rise of both volume and price” on the sales side, the real estate
investment and development gained steady recovery; in terms of quarter-on-quarter growth rate,
the real estate investment turned to positive growth from negative growth. The area of newly
commenced housing projects reached 156 million square meters, up 13.7% from a year earlier;
while it fell by 14% last year, with a 17.7% drop in the first two months. The rally of real estate
investment obviously boosted the recovery of all investment projects. In January and February, the
real estate development and investment was estimated to account for 23.8% of total investment
(Table 1), up 6.7 percentage points over the last year, and its contribution to total investment
growth was reported at 7.5%, an increase of 5.6 percentage points compared with the previous
year.
① The "Eleven Major Project Packages” cover major networks including information, power grid, oil and gas, ecological
environmental protection, clean energy, food & water conservancy, transportation, health care & pension, energy and mineral
resource guarantee, urban rail transport, modern logistics, enhancement of core competitiveness of manufacturing industry, and
emerging industries. As revealed by a relevant leader from the NDRC, by the end of January this year, the accumulative amount of
completed investment in the eleven major projects have reached RMB5,309.6 billion, an increase of RMB253.2 billion compared
with that of previous year, and 339 projects were commenced, rising by 13 from the end of last year. ② In December 2014, the National Development and Reform Work Conference proposed to vigorously carry out consumer projects
in six areas, i.e. pension, health & housekeeping, information, energy conservation & environmental protection, tourism & leisure,
housing, and culture, education & sports.
China’s Economic and Financial Outlook
BOC Institute of International Finance 4 2016Q2
Table 1: Contribution of Real Estate Investment to Investment and Economic Growth
Year
GDP
(RMB100
million)
Investment in
fixed assets
(RMB100
million)
Real estate
investment
(RMB100
million)
Real estate
investment /GDP
(%)
Real estate investment/social
investment in fixed assets
(%)
2007 268019.4 137323.9 25288.8 9.4 18.4
2008 316751.7 172828.4 31203.2 9.9 18.1
2009 345629.2 224598.8 36241.8 10.5 16.1
2010 408903.0 251683.8 48259.4 11.8 19.2
2011 484123.5 311485.1 61796.9 12.8 19.8
2012 534123.0 374694.7 71803.8 13.4 19.2
2013 588018.8 446294.1 86013.4 14.6 19.3
2014 635910.2 512020.7 95035.6 14.9 18.6
2015 676707.8 562000.0 95978.9 14.2 17.1
2016 (1-2) 38008.0 9052.0 23.8
Sources: Wind, BOC Institute of International Finance
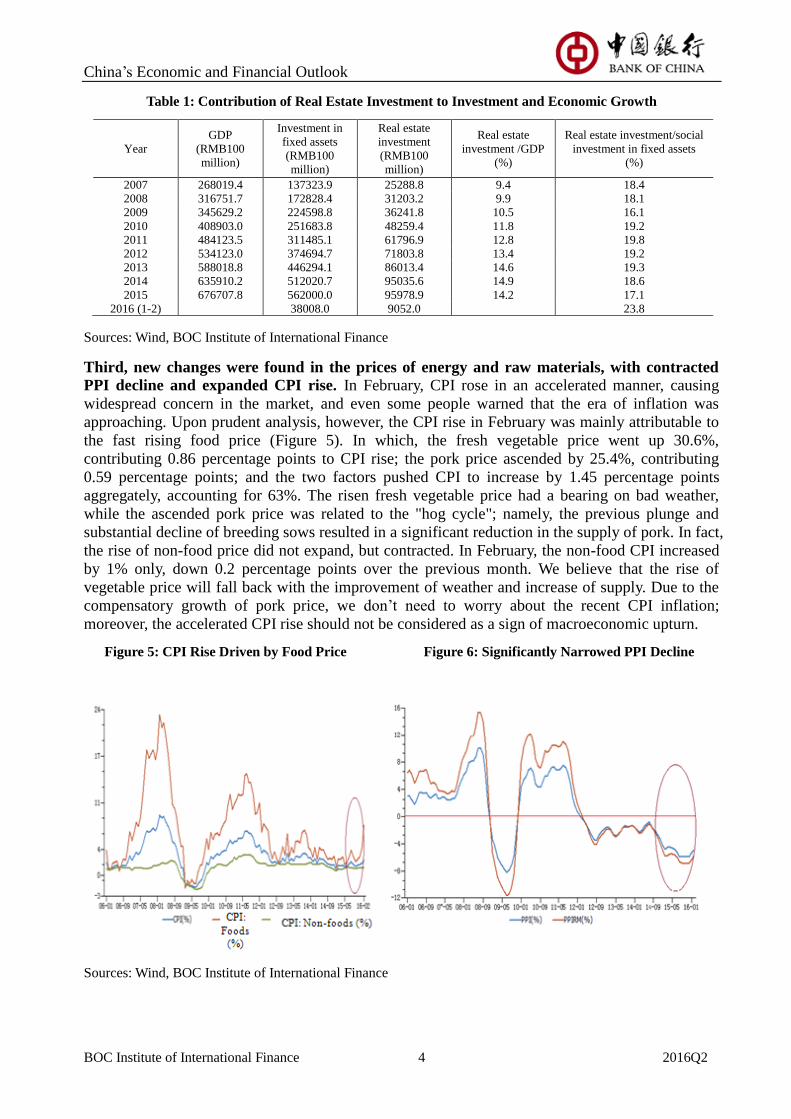
Third, new changes were found in the prices of energy and raw materials, with contracted
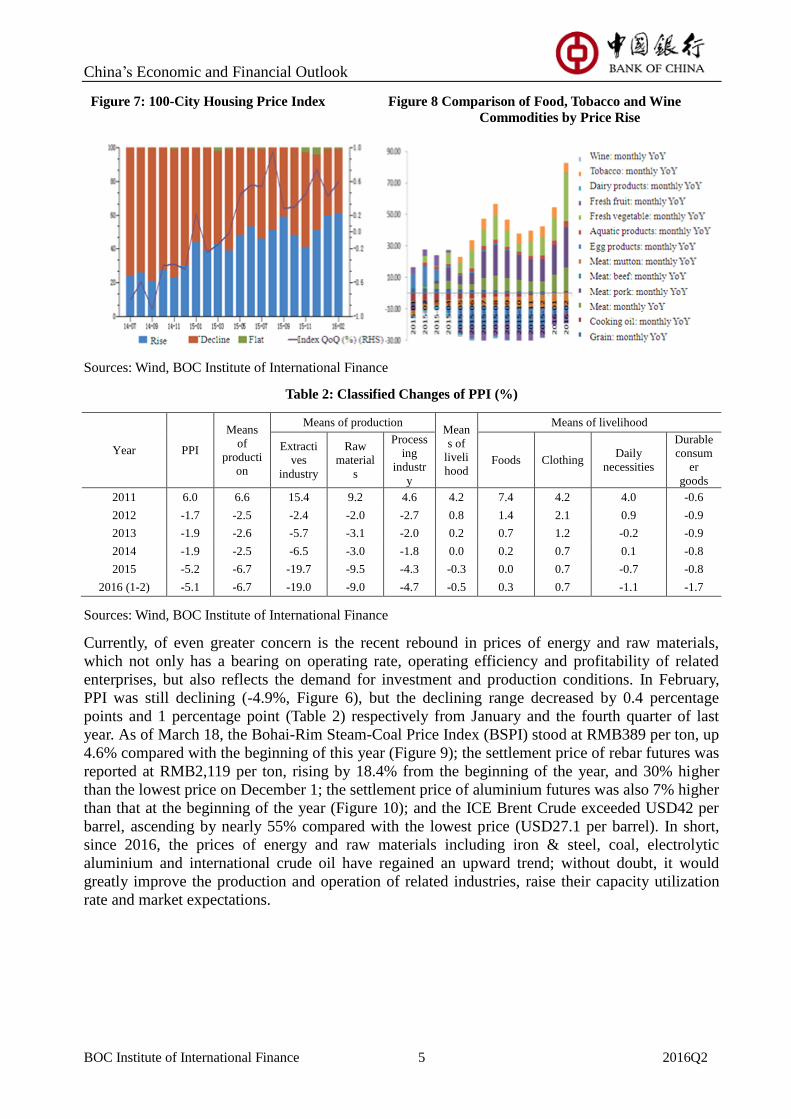
PPI decline and expanded CPI rise. In February, CPI rose in an accelerated manner, causing
widespread concern in the market, and even some people warned that the era of inflation was
approaching. Upon prudent analysis, however, the CPI rise in February was mainly attributable to
the fast rising food price (Figure 5). In which, the fresh vegetable price went up 30.6%,
contributing 0.86 percentage points to CPI rise; the pork price ascended by 25.4%, contributing
0.59 percentage points; and the two factors pushed CPI to increase by 1.45 percentage points
aggregately, accounting for 63%. The risen fresh vegetable price had a bearing on bad weather,
while the ascended pork price was related to the "hog cycle"; namely, the previous plunge and
substantial decline of breeding sows resulted in a significant reduction in the supply of pork. In fact,
the rise of non-food price did not expand, but contracted. In February, the non-food CPI increased
by 1% only, down 0.2 percentage points over the previous month. We believe that the rise of
vegetable price will fall back with the improvement of weather and increase of supply. Due to the
compensatory growth of pork price, we don’t need to worry about the recent CPI inflation;
moreover, the accelerated CPI rise should not be considered as a sign of macroeconomic upturn.
Figure 5: CPI Rise Driven by Food Price Figure 6: Significantly Narrowed PPI Decline
Sources: Wind, BOC Institute of International Finance
China’s Economic and Financial Outlook
BOC Institute of International Finance 5 2016Q2
Figure 7: 100-City Housing Price Index Figure 8 Comparison of Food, Tobacco and Wine
Commodities by Price Rise
Sources: Wind, BOC Institute of International Finance
Table 2: Classified Changes of PPI (%)
Year PPI
Means
of
producti
on
Means of production Mean
s of
liveli
hood
Means of livelihood
Extracti
ves
industry
Raw
material
s
Process
ing
industr
y
Foods Clothing Daily
necessities
Durable
consum
er
goods
2011 6.0 6.6 15.4 9.2 4.6 4.2 7.4 4.2 4.0 -0.6
2012 -1.7 -2.5 -2.4 -2.0 -2.7 0.8 1.4 2.1 0.9 -0.9
2013 -1.9 -2.6 -5.7 -3.1 -2.0 0.2 0.7 1.2 -0.2 -0.9
2014 -1.9 -2.5 -6.5 -3.0 -1.8 0.0 0.2 0.7 0.1 -0.8
2015 -5.2 -6.7 -19.7 -9.5 -4.3 -0.3 0.0 0.7 -0.7 -0.8
2016 (1-2) -5.1 -6.7 -19.0 -9.0 -4.7 -0.5 0.3 0.7 -1.1 -1.7
Sources: Wind, BOC Institute of International Finance
Currently, of even greater concern is the recent rebound in prices of energy and raw materials,
which not only has a bearing on operating rate, operating efficiency and profitability of related
enterprises, but also reflects the demand for investment and production conditions. In February,
PPI was still declining (-4.9%, Figure 6), but the declining range decreased by 0.4 percentage
points and 1 percentage point (Table 2) respectively from January and the fourth quarter of last
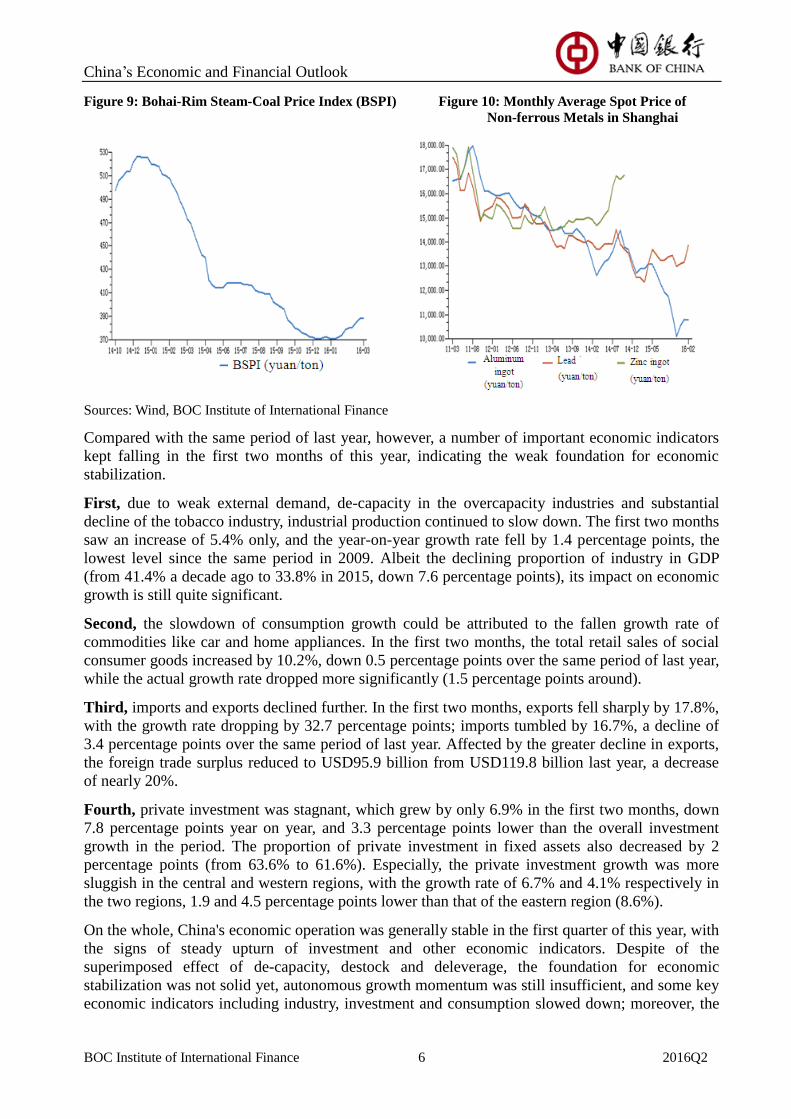
year. As of March 18, the Bohai-Rim Steam-Coal Price Index (BSPI) stood at RMB389 per ton, up
4.6% compared with the beginning of this year (Figure 9); the settlement price of rebar futures was
reported at RMB2,119 per ton, rising by 18.4% from the beginning of the year, and 30% higher
than the lowest price on December 1; the settlement price of aluminium futures was also 7% higher
than that at the beginning of the year (Figure 10); and the ICE Brent Crude exceeded USD42 per
barrel, ascending by nearly 55% compared with the lowest price (USD27.1 per barrel). In short,
since 2016, the prices of energy and raw materials including iron & steel, coal, electrolytic
aluminium and international crude oil have regained an upward trend; without doubt, it would
greatly improve the production and operation of related industries, raise their capacity utilization
rate and market expectations.
China’s Economic and Financial Outlook
BOC Institute of International Finance 6 2016Q2
Figure 9: Bohai-Rim Steam-Coal Price Index (BSPI) Figure 10: Monthly Average Spot Price of
Non-ferrous Metals in Shanghai
Sources: Wind, BOC Institute of International Finance
Compared with the same period of last year, however, a number of important economic indicators
kept falling in the first two months of this year, indicating the weak foundation for economic
stabilization.
First, due to weak external demand, de-capacity in the overcapacity industries and substantial
decline of the tobacco industry, industrial production continued to slow down. The first two months
saw an increase of 5.4% only, and the year-on-year growth rate fell by 1.4 percentage points, the
lowest level since the same period in 2009. Albeit the declining proportion of industry in GDP
(from 41.4% a decade ago to 33.8% in 2015, down 7.6 percentage points), its impact on economic
growth is still quite significant.
Second, the slowdown of consumption growth could be attributed to the fallen growth rate of
commodities like car and home appliances. In the first two months, the total retail sales of social
consumer goods increased by 10.2%, down 0.5 percentage points over the same period of last year,
while the actual growth rate dropped more significantly (1.5 percentage points around).
Third, imports and exports declined further. In the first two months, exports fell sharply by 17.8%,
with the growth rate dropping by 32.7 percentage points; imports tumbled by 16.7%, a decline of
3.4 percentage points over the same period of last year. Affected by the greater decline in exports,
the foreign trade surplus reduced to USD95.9 billion from USD119.8 billion last year, a decrease
of nearly 20%.
Fourth, private investment was stagnant, which grew by only 6.9% in the first two months, down
7.8 percentage points year on year, and 3.3 percentage points lower than the overall investment
growth in the period. The proportion of private investment in fixed assets also decreased by 2
percentage points (from 63.6% to 61.6%). Especially, the private investment growth was more
sluggish in the central and western regions, with the growth rate of 6.7% and 4.1% respectively in
the two regions, 1.9 and 4.5 percentage points lower than that of the eastern region (8.6%).
On the whole, China's economic operation was generally stable in the first quarter of this year, with
the signs of steady upturn of investment and other economic indicators. Despite of the
superimposed effect of de-capacity, destock and deleverage, the foundation for economic
stabilization was not solid yet, autonomous growth momentum was still insufficient, and some key
economic indicators including industry, investment and consumption slowed down; moreover, the

China’s Economic and Financial Outlook
BOC Institute of International Finance 7 2016Q2
growth of imports and exports slipped sharply, implying the sustained great economic downward
pressure. The GDP growth rate of Q1 is preliminarily estimated at around 6.6%, down 0.4
percentage points over the same period of last year; and CPI might rise by about 2.2%, a
year-on-year increase of 0.8 percentage points.
I.2 Main judgments on economic situation in Q2
Looking into Q2, a number of key projects outlined in the “13th
Five-Year Plan” will kick off one
by one, and accelerated advancement of Special Construction Fund and PPP Project will contribute
to the growth of investment. Meanwhile, real estate sales and housing price will drive the steady
rally of investment. Subject to the decline in revenue growth, the expectations on employment and
income are slightly pessimistic, with weak willingness of consumers for spending and consumption,
indicating the accelerated growth of consumption in the face of challenges. Industrial growth,
owing to the intensified de-capacity this year, will hover around a low rate, but industrial structure
is likely to keep improving and emerging industries including energy conservation &
environmental protection, information communication and high-end equipment are excepted to
maintain fast growth. In view of these factors, the GDP growth is estimated to reach about 6.7% in
2016Q2, picking up slightly from Q1; hence it is very possible to fulfil the target anticipated by the
government, i.e. 6.5%-7%, by the end of the year.
I.2.1 On the supply side, de-capacity will contribute to the sustained low growth of industrial
production, while the financial sector will encumber the growth of service sector
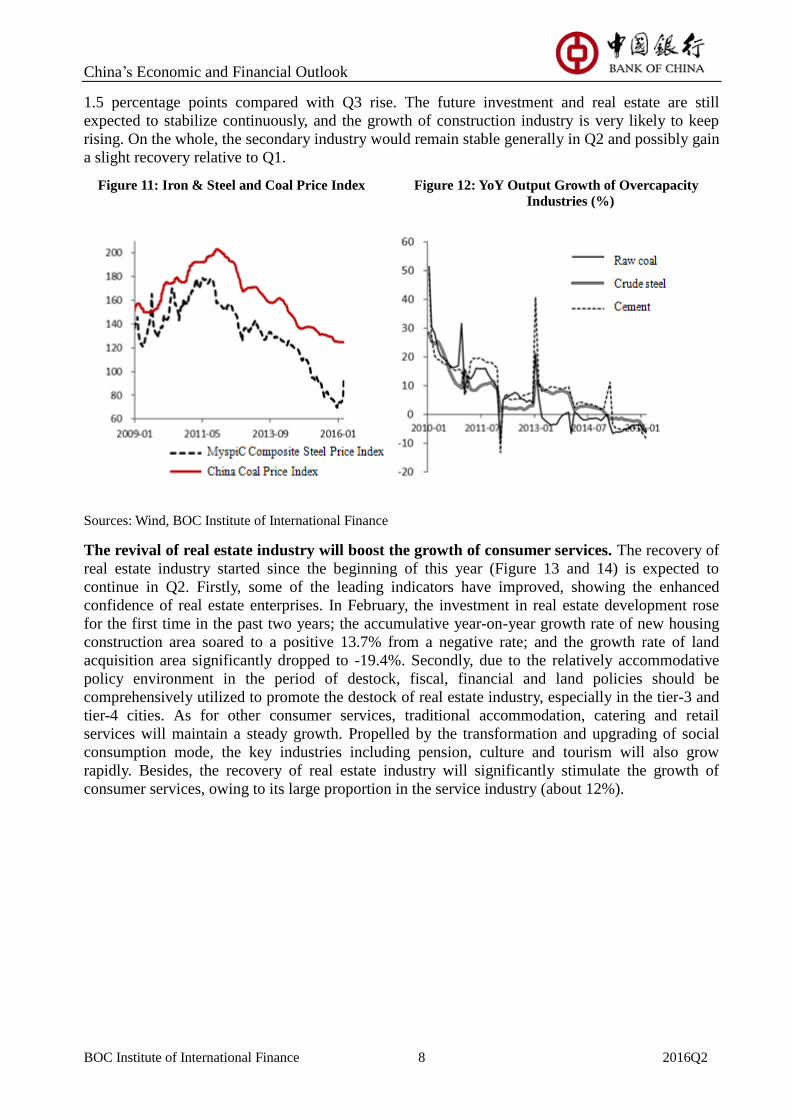
Industry will lie in the process of de-capacity. Since the beginning of this year, steel prices have
rebounded and coal prices have stabilized (Figure 11), due to the markedly declined product supply
arising from the production cut plans of enterprises or delayed on-steam as the result of losses. In
February, the output of products including crude steel and raw coal fell by 5.7% and 6.4%
respectively, up 3.4 and 2.9 percentage points over the previous year (Figure 12). Inventory has
been low all along. At the end of February, the steel stocks in the country's major markets
decreased by 14.3% year on year, which slightly eased the contradiction between supply and
demand in the market. Nevertheless, the short-term demand is still difficult to have a significant
improvement. This year the government will focus on the steel and coal industries by strictly
curbing new production capacity and resolutely eliminating the backward one, implying that
corporate mergers and acquisitions will increase. It is expected that the growth rate of overcapacity
industries will continuously fall with the progress of de-capacity in Q2, while the rising prices of
energy and raw materials will help to ease the downward pressure.
The emerging manufacturing industry will maintain a rapid growth. Due to the government's
efforts to promote the development of high-tech industries, the industries including aerospace
manufacturing, electronic communications equipment manufacturing and information chemicals
manufacturing maintained fast growth rates of 27.5%, 12.1% and 21.1% respectively in February.
This year the government will improve relevant preferential tax policies by deducing the aggregate
enterprise R&D expenses; meanwhile, the pilot of "investment-loan linkage” is to be launched. It is
estimated that the high-tech manufacturing industries including electronic communications and
information will still maintain rapid growth in Q2. Some emerging products in conformity with
new consumption direction will also keep fast development; for example, the output of sport utility
vehicles (SUV), new energy vehicles and smart phones had a year-on-year increase of 60.4%, 75.9%
and 18.6% respectively in February. Generally, the rapid growth momentum of these industries is
expected to remain unchanged in Q2.
Overall, the growth rate of industrial added value is estimated to stand at around 5.5% in Q2, an
increase of 0.1 percentage points from Q1. Driven by the real estate industry, the added value of
construction industry would pick up in an accelerated manner, which grew by 7.3% in 2015Q4, up
China’s Economic and Financial Outlook
BOC Institute of International Finance 8 2016Q2
1.5 percentage points compared with Q3 rise. The future investment and real estate are still
expected to stabilize continuously, and the growth of construction industry is very likely to keep
rising. On the whole, the secondary industry would remain stable generally in Q2 and possibly gain
a slight recovery relative to Q1.
Figure 11: Iron & Steel and Coal Price Index Figure 12: YoY Output Growth of Overcapacity
Industries (%)
Sources: Wind, BOC Institute of International Finance
The revival of real estate industry will boost the growth of consumer services. The recovery of
real estate industry started since the beginning of this year (Figure 13 and 14) is expected to
continue in Q2. Firstly, some of the leading indicators have improved, showing the enhanced
confidence of real estate enterprises. In February, the investment in real estate development rose
for the first time in the past two years; the accumulative year-on-year growth rate of new housing
construction area soared to a positive 13.7% from a negative rate; and the growth rate of land
acquisition area significantly dropped to -19.4%. Secondly, due to the relatively accommodative
policy environment in the period of destock, fiscal, financial and land policies should be
comprehensively utilized to promote the destock of real estate industry, especially in the tier-3 and
tier-4 cities. As for other consumer services, traditional accommodation, catering and retail
services will maintain a steady growth. Propelled by the transformation and upgrading of social
consumption mode, the key industries including pension, culture and tourism will also grow
rapidly. Besides, the recovery of real estate industry will significantly stimulate the growth of
consumer services, owing to its large proportion in the service industry (about 12%).
China’s Economic and Financial Outlook
BOC Institute of International Finance 9 2016Q2
Figure 13: Commercial Housing Sales (%) Figure 14: YoY Changes in 100-City Housing Price (%)
Sources: Wind, BOC Institute of International Finance
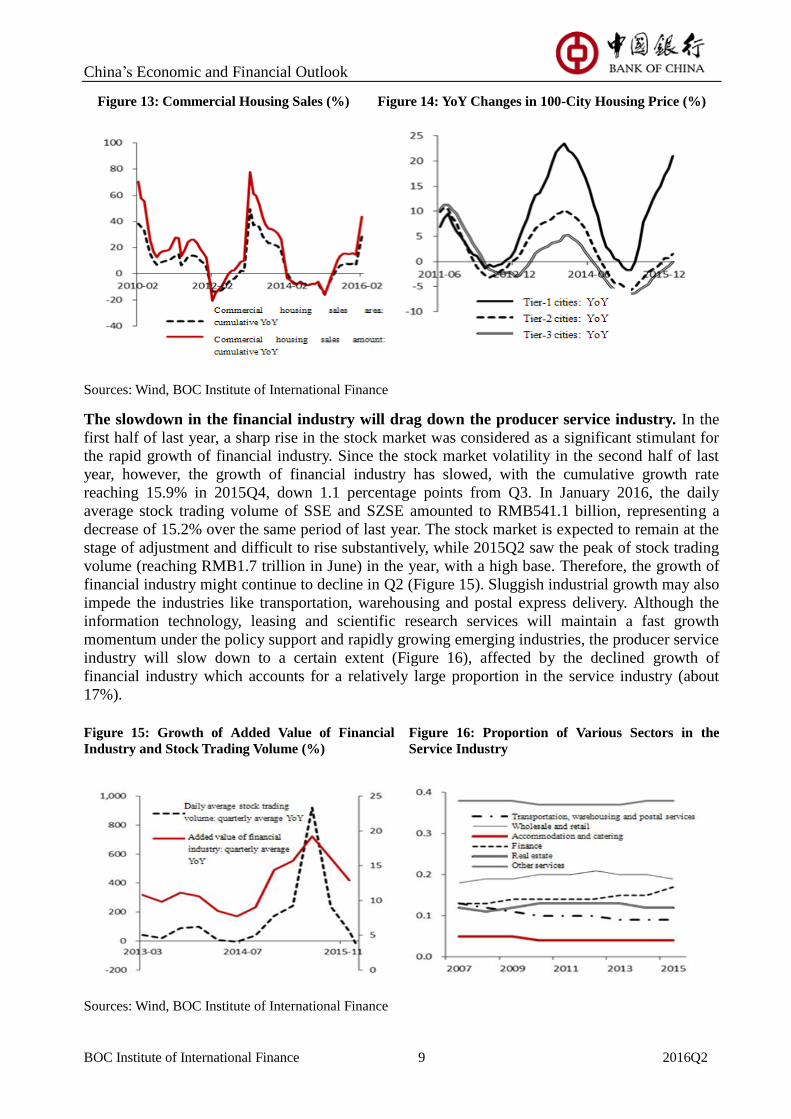
The slowdown in the financial industry will drag down the producer service industry. In the
first half of last year, a sharp rise in the stock market was considered as a significant stimulant for
the rapid growth of financial industry. Since the stock market volatility in the second half of last
year, however, the growth of financial industry has slowed, with the cumulative growth rate
reaching 15.9% in 2015Q4, down 1.1 percentage points from Q3. In January 2016, the daily
average stock trading volume of SSE and SZSE amounted to RMB541.1 billion, representing a
decrease of 15.2% over the same period of last year. The stock market is expected to remain at the
stage of adjustment and difficult to rise substantively, while 2015Q2 saw the peak of stock trading
volume (reaching RMB1.7 trillion in June) in the year, with a high base. Therefore, the growth of
financial industry might continue to decline in Q2 (Figure 15). Sluggish industrial growth may also
impede the industries like transportation, warehousing and postal express delivery. Although the
information technology, leasing and scientific research services will maintain a fast growth
momentum under the policy support and rapidly growing emerging industries, the producer service
industry will slow down to a certain extent (Figure 16), affected by the declined growth of
financial industry which accounts for a relatively large proportion in the service industry (about
17%).
Figure 15: Growth of Added Value of Financial
Industry and Stock Trading Volume (%) Figure 16: Proportion of Various Sectors in the
Service Industry
Sources: Wind, BOC Institute of International Finance
China’s Economic and Financial Outlook
BOC Institute of International Finance 10 2016Q2
I.2.2 From the demand side, consumption will face challenges for accelerated growth, and
investment growth is expected to steadily rally, with the prudentially optimistic attitude
towards foreign trade
Despite of overall stability of consumption growth, challenges can be found for further
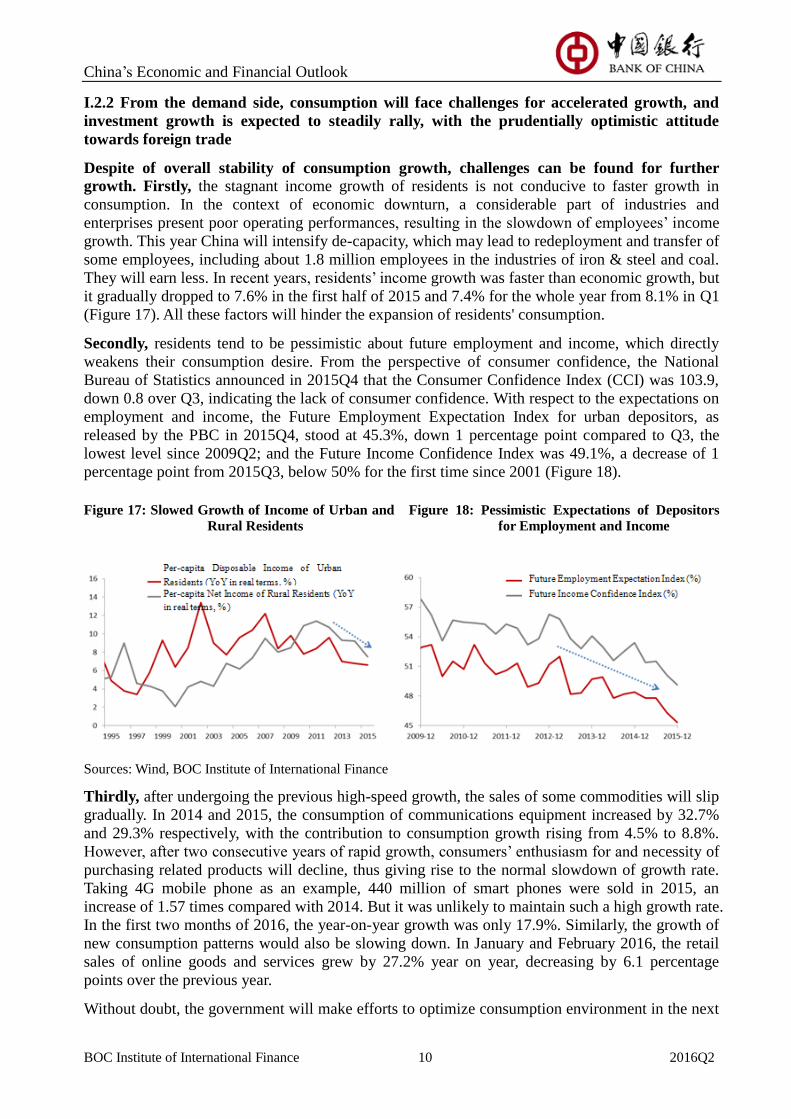
growth. Firstly, the stagnant income growth of residents is not conducive to faster growth in
consumption. In the context of economic downturn, a considerable part of industries and
enterprises present poor operating performances, resulting in the slowdown of employees’ income
growth. This year China will intensify de-capacity, which may lead to redeployment and transfer of
some employees, including about 1.8 million employees in the industries of iron & steel and coal.
They will earn less. In recent years, residents’ income growth was faster than economic growth, but
it gradually dropped to 7.6% in the first half of 2015 and 7.4% for the whole year from 8.1% in Q1
(Figure 17). All these factors will hinder the expansion of residents' consumption.
Secondly, residents tend to be pessimistic about future employment and income, which directly
weakens their consumption desire. From the perspective of consumer confidence, the National
Bureau of Statistics announced in 2015Q4 that the Consumer Confidence Index (CCI) was 103.9,
down 0.8 over Q3, indicating the lack of consumer confidence. With respect to the expectations on
employment and income, the Future Employment Expectation Index for urban depositors, as
released by the PBC in 2015Q4, stood at 45.3%, down 1 percentage point compared to Q3, the
lowest level since 2009Q2; and the Future Income Confidence Index was 49.1%, a decrease of 1
percentage point from 2015Q3, below 50% for the first time since 2001 (Figure 18).
Figure 17: Slowed Growth of Income of Urban and
Rural Residents Figure 18: Pessimistic Expectations of Depositors
for Employment and Income
Sources: Wind, BOC Institute of International Finance
Thirdly, after undergoing the previous high-speed growth, the sales of some commodities will slip
gradually. In 2014 and 2015, the consumption of communications equipment increased by 32.7%
and 29.3% respectively, with the contribution to consumption growth rising from 4.5% to 8.8%.
However, after two consecutive years of rapid growth, consumers’ enthusiasm for and necessity of
purchasing related products will decline, thus giving rise to the normal slowdown of growth rate.
Taking 4G mobile phone as an example, 440 million of smart phones were sold in 2015, an
increase of 1.57 times compared with 2014. But it was unlikely to maintain such a high growth rate.
In the first two months of 2016, the year-on-year growth was only 17.9%. Similarly, the growth of
new consumption patterns would also be slowing down. In January and February 2016, the retail
sales of online goods and services grew by 27.2% year on year, decreasing by 6.1 percentage
points over the previous year.
Without doubt, the government will make efforts to optimize consumption environment in the next
China’s Economic and Financial Outlook
BOC Institute of International Finance 11 2016Q2
step, to strengthen the supervision over consumer goods, enhance the quality of consumer goods,
and encourage enterprises to increase the supply of new consumer goods; the consumption credit
company pilot will be extended to the whole country, hence providing consumers with a new way
for obtaining consumer loans; besides, the rebound of housing sales will drive the growth of
livelihood related consumption. All of these factors will contribute to consumption. Accordingly,
the total retail sales of social consumer goods are expected to increase by about 10.5% in 2016Q2.
Investment is very likely to edge up, while the growth of investment in real estate and services
is substantial. Firstly, the strong growth momentum of new projects will be conducive to further
stabilization and recovery of investment in Q2. The ratio of planed investment in new projects to
that in projects under construction is 0.057, the highest level over the same period since 2007
(Figure 20). For instance, the number of new projects included in 11 categories of major project
packages increased by 13 in January 2016, and the amount of completed investment rose by
RMB253.2 billion. A sign of stabilization and recovery could also be found in the planned
investment in the projects under construction. In the first two months of 2016, a year-on-year
increase of 13.9% was recorded, up 9.4 percentage points from the same period of last year.
Secondly, the rebounded investment in the real estate and service industries will boost the
investment growth in Q2. Since May and June 2015, the growth rate of real estate sales volume
and area has been positive successively. As a consequence, the growth rate of new and
second-hand housing prices in 70 large and medium-sized cities in the country has also been
positive since November and December 2015. Besides, since the beginning of 2016, such recovery
effect has spread to the areas of land transactions and real estate investment. In the first two months
of 2016, the land transaction prices increased by 0.9% year on year, a positive growth for the first
time in the recent year; the investment in real estate development rose by 3% year on year, 2
percentage points over last year. In the same period, both real estate sales volume and area
achieved rapid growth, which would facilitate the rebound of real estate investment through the
channel of “sales recovery - price hike - investment rise”.
The investment in the tertiary industry is expected to maintain a high growth rate, which will
strongly prop up the steady rise of investment. In recent years, the tertiary industry has played an
increasingly important role in Chinese economy; in 2015, its proportion exceeded more than 50%
for the first time. Either the accelerated upgrade of consumer structure or more reliance of
production on start-up innovation requires fast investment growth of modern service industry and
producer service industry. In the first two months of 2016, the investment in the tertiary industry
presented a growth rate of 11.1%, 0.5 percentage points higher than that in the previous year and
3.2 percentage points higher than that of the secondary industry. In which, compared to the same
period of last year, the growth rate of investment in public management, social security and social
organizations climbed by 32.3 percentage points, the investment in education increased by 9.2
percentage points, and that in water conservancy, environment and public facilities management
rose by 7.3 percentage points.
Thirdly, some restrictive factors might be available in the continued investment recovery, of which,
the biggest problem lies in the source of funds. In the first two months of 2016, the growth rate of
investment funds in place was significantly decreased (Figure 19), especially, that of the self-raised
funds dropped by 14.1 percentage points, reflecting the limited investment capacity and weak
investment desire of enterprises. Due to the relatively high proportion of self-raised funds in the
investment funds (70.5% in 2015), the negative growth of such type of funds would obviously
generate adverse impact on the rebound of investment growth. Even the funds available for real
estate investment which has started to pick up is not so optimistic. A year-on-year reduction of 1%
was recorded in the first two months of 2016, falling by 2.6 percentage points from the same
period of previous year. In addition, de-capacity is likely to lower the investment growth of

China’s Economic and Financial Outlook
BOC Institute of International Finance 12 2016Q2
manufacturing industry, and deleverage will also restrict the investment capability of some
enterprises, which is unfavourable to the growth of investment.
Albeit that the 2016 budget of the central government for investment only increases by 4.7%
compared to previous year, the amount of special construction funds is estimated to exceed RMB1
trillion;. As a new tool in the investment policy, the special construction funds will be primarily
used for the transformation and upgrade projects with right investment direction, favourable return
and no excess capacity. With respect to social capital investment, RMB180 billion of PPP guidance
funds will play an important role. As of the end of February 2016, the country launched a total of
7,116 PPP projects in different places. In addition, a number of key projects outlined in the “13th
Five-Year Plan” will also be commenced. All of these factors will propel investment growth. Based
on the above analysis, the investment in fixed assets is expected to grow by about 11% in Q2
Figure 19: Growing Investment Funds and Projects Figure 20: Ratio of Planed Investment in New
Projects to That in Projects under Construction
Sources: Wind, BOC Institute of International Finance
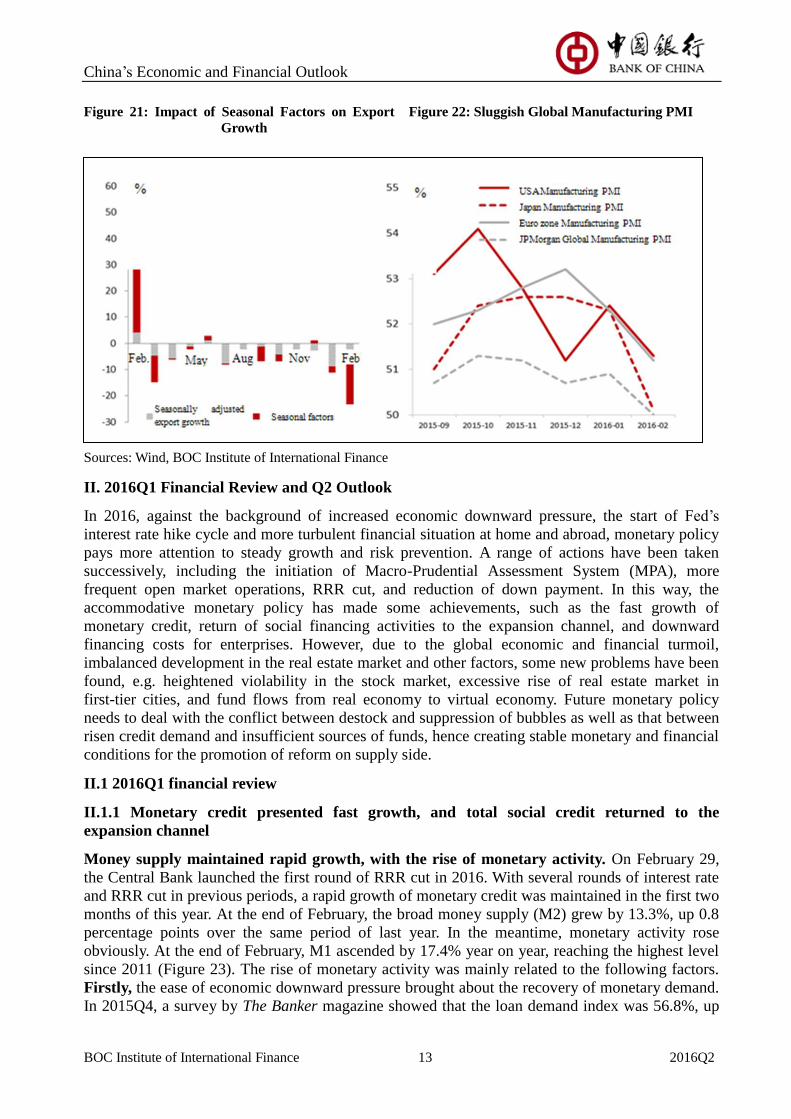
The export will be impeded by the sluggish external demand, while import is to be boosted by
the improved domestic demand. In Q2, the export trend will be cautiously optimistic. On one
hand, the seasonal factors resulting in a sharp decline of exports will fade off. The cargo trade
exports fell sharply in January and February, the largest decline since the global financial crisis in
2009, which was mainly attributable to seasonal factors (Figure 21). It is estimated that in February
exports dropped considerably by 25.4%, while seasonal factors contributed 78% of the decline. It
could be also estimated, due to the impact of seasonal factors, the export growth would be
significantly improved in March. On the other hand, the rising downward pressure on global
manufacturing industries will restrict the rapid rise in exports. In the past four months, the world's
major economies reported weak manufacturing PMI in succession, of which, the JP Morgan Global
Manufacturing PMI dropped from 51.2 in November last year to 50 in February this year (Figure
22).
Owing to the recovered domestic demand and commodity prices, the declining range of imports is
expected to narrow. Despite of the continued substantial drop of trade imports in the first two
months this year, it was still better than that in the same period of 2015. In February, the seasonally
adjusted imports in February tumbled by 11.3% year on year, lower than the 12-month average
decline in last year. Firstly, the demand for investment in infrastructure and real estate has
improved; secondly, the risen commodity prices have led to the rise of import prices. Both the
factors will jointly give rise to the narrowed declining range of imports.
China’s Economic and Financial Outlook
BOC Institute of International Finance 13 2016Q2
Figure 21: Impact of Seasonal Factors on Export
Growth Figure 22: Sluggish Global Manufacturing PMI
Sources: Wind, BOC Institute of International Finance
II. 2016Q1 Financial Review and Q2 Outlook
In 2016, against the background of increased economic downward pressure, the start of Fed’s
interest rate hike cycle and more turbulent financial situation at home and abroad, monetary policy
pays more attention to steady growth and risk prevention. A range of actions have been taken
successively, including the initiation of Macro-Prudential Assessment System (MPA), more
frequent open market operations, RRR cut, and reduction of down payment. In this way, the
accommodative monetary policy has made some achievements, such as the fast growth of
monetary credit, return of social financing activities to the expansion channel, and downward
financing costs for enterprises. However, due to the global economic and financial turmoil,
imbalanced development in the real estate market and other factors, some new problems have been
found, e.g. heightened violability in the stock market, excessive rise of real estate market in
first-tier cities, and fund flows from real economy to virtual economy. Future monetary policy
needs to deal with the conflict between destock and suppression of bubbles as well as that between
risen credit demand and insufficient sources of funds, hence creating stable monetary and financial
conditions for the promotion of reform on supply side.
II.1 2016Q1 financial review
II.1.1 Monetary credit presented fast growth, and total social credit returned to the
expansion channel
Money supply maintained rapid growth, with the rise of monetary activity. On February 29,
the Central Bank launched the first round of RRR cut in 2016. With several rounds of interest rate
and RRR cut in previous periods, a rapid growth of monetary credit was maintained in the first two
months of this year. At the end of February, the broad money supply (M2) grew by 13.3%, up 0.8
percentage points over the same period of last year. In the meantime, monetary activity rose
obviously. At the end of February, M1 ascended by 17.4% year on year, reaching the highest level
since 2011 (Figure 23). The rise of monetary activity was mainly related to the following factors.
Firstly, the ease of economic downward pressure brought about the recovery of monetary demand.
In 2015Q4, a survey by The Banker magazine showed that the loan demand index was 56.8%, up
China’s Economic and Financial Outlook
BOC Institute of International Finance 14 2016Q2
0.1 percentage points from the end of Q3. Secondly, the real estate prices rose faster in the first-tier
cities, channelling more funds to virtual economy from real economy. Some short-term loans might
flow into the real estate market in the name of consumer loans, and part of private financing, such
as down payment loans and P2P, might also flow into the real estate market. In the first two months,
the sources of funds for investment in fixed assets increased by only 0.9%, and its gap with
investment growth reached a record high since 2001, implying the phenomenon of fund flowing to
virtual economy from real economy.
Steady growth of social financing made the financing activities of the whole society return to
the expansion channel. With the gradual restoration of monetary demand in the real economy, the
scale of social financing began to expand, changing the continued tightening state since 2015. In
the first two months of this year, the scale of new social financing reached RMB4.2 trillion, a
year-on-year increase of RMB793 billion (Figure 24). The increase of new social financing mainly
had a bearing on the factors such as rise of new RMB loans, accelerated development of direct
financing and renewed growth of trust and entrusted loans. Affected by the risk exposures of some
notes at the beginning of the year and reduction of foreign currency liabilities by enterprises under
the expectation on exchange rate depreciation, new bank acceptance bills without discounting and
foreign currency loans kept declining, down RMB373.5 billion and RMB236.2 billion respectively
over the same period of previous year.
RMB loans increased a lot mainly due to real estate boom and loan conversion. In the first two
months, RMB loans rose by RMB3.3 trillion, RMB733 billion more than the increment a year
earlier, which accounted for 79.5% of new social financing scale in the same period, up 2.7
percentage points over the same period of last year, thus becoming the main driving force for the
growth in the scale of social financing. Rapid credit growth was primarily attributed to the
following factors: first, real estate market transactions rose faster in the first-tier and second-tier
cities, leading to the growth of medium and long-term loans to residents. In the first two months,
new medium and long-term loans amounted to RMB2.2 trillion, representing 66.4% of total new
loans, up 7.9 percentage points compared to the end of 2015. Second, under the expectation on
RMB depreciation, the impact of decreasing USD debts by enterprises was one of the factors. In
the first two months, foreign exchange loans fell by 9.6%, and the fall was 3.8 percentage points
higher than the end of previous year. The third was the seasonal factor of “fast return for early
investment”. From 2013 to January 2015, new RMB loans accounted for 12.1%, 13.5% and 12.5%
of total new loans granted in the year. In February, affected by the factors such as macro-prudential
supervision and strengthened liquidity management of commercial banks, the credit scale returned
to the normal level, and RMB726.6 billion of new loans were granted in the month.
Figure 23: Rapid Growth of Money Aggregates Figure 24: Steadily Growing Social Financing Scale
Sources: Wind, BOC Institute of International Finance

China’s Economic and Financial Outlook
BOC Institute of International Finance 15 2016Q2
II.1.2 Money market rate declined after rising, and capital interest rate of the whole society
kept falling
Since the beginning of the year, the funds outstanding for foreign exchange have continued to
decline sharply, with the collection of required reserves in foreign currency and rising demand for
cash before the Spring Festival, thus leading to the short-term liquidity squeeze in the money
market. From January 21 to 23, the overnight rate of SHIBOR exceeded 2%, a rate which had
existed since 2015Q3 (Figure 25). With the release of RRR cut policy at the end of February, the
money market rate slipped once again, resulting in a falling capital interest rate of the whole
society. Overall, compared to Q4 of last year, the money market operation showed the following
characteristics: firstly, the centre of interest rate was basically stable. As of March 25, the
overnight SHIBOR stood at 1.98%, up 0.13 percentage points over the previous quarter, but still
lower than 2%. Secondly, volatility declined. The standard deviation for overnight lending rate of
SHIBOR was 0.049, down 0.17 compared to the previous quarter. Thirdly, the capital rate of the
whole society showed a downward trend. In March 2016, the loan prime rate (LPR) was reported
at 4.3%, decreasing by 100BPs compared to the same period of last year; the issuance rates of
corporate bonds, medium-term notes and SME private placement notes (PPN) fell by 62BPs,
61BPs and 43BPs respectively from the end of 2015Q4 (Figure 26); meanwhile, the composite
interest rate of private financing in Wenzhou was 18.7% on average, down 7BPs compared with
that at the end of the fourth quarter of previous year.
Figure 25: Trends of Overnight and 7-day SHIBOR Figure 26: Issuance Rates of Corporate Bonds and
Other Bonds
Sources: Wind, BOC Institute of International Finance
II.1.3 The bond market went up despite of certain volatility, with the steep term spread
In Q1, due to the ease of economic downward pressure, accelerated bond supply and increased
default events, the bond market exhibited a new pattern with volatile upward trend and steep term
spread. Specifically, the first was the slowdown of rising speed. On March 25, 2016, ChinaBond
Composite Index was recorded at 169.4 points, up 1.67 points from the end of previous year;
compared with the fourth quarter of last year (nearly 5 points), the rising speed slowed down
significantly (Figure 27). The second was the rising bond default risk. Since the beginning of 2016,
six bonds have been found default, accounting for about half of the defaulted bonds in last year,
with the bond default presenting a spreading trend from “one point to a whole area”. The third
was the steep term spread. On March 25, the 1-year T-bond yield closed at 2.069%, down about
23BPs compared to the end of 2015, while the 10-year T-bond yield rose by 10BPs. The yield
spread between the 10-year and 1-year T-bonds widened to 76BPs (Figure 28) from 52BPs at the

China’s Economic and Financial Outlook
BOC Institute of International Finance 16 2016Q2
end of last year. Faster decline in short-term interest rate was mainly caused by the following
factors: benefiting from the new round of RRR cut policy, short-term interest rate significantly
tumbled, while long-term interest rate was confronted with upward pressure due to the factors such
as rising real estate market in the first-tier cities, rebounded bulk commodity prices and nascent
inflation.
Figure 27: Movements of China Bond Composite Index Figure 28: T-bond Yield Curve and
Changes in Interest Spread
Sources: Wind, BOC Institute of International Finance
II.1.4 Stock indexes kept falling, mainly due to the previous overvaluation
Since early 2016, stock indexes have presented a falling trend. The SSE Composite Index declined
to 2979 points on March 25 from 3539 points at the end of previous year, down 15.8%; meanwhile,
the SZSE Component Index fell by 18.3% (Figure 29). The main reasons are described as follows.
Firstly, China’s economic and financial fundamentals were relatively weak, and the stock market
required correction internally. Under the backdrop of ongoing weakened fundamentals of the
economy, however, the turnover rate of financing transactions in 2015Q4 reached the level at the
stock market peak in Q2; in which, only 12% stocks had a P/E ratio of lower than 30x. Such
excessively high turnover rate and watered valuation would easily give rise to correction upon any
change in the external environment (Figure 30). Secondly, global stock market fluctuated wildly.
Affected by the less-than-expected global economic recovery, intensified exchange rate fluctuation,
and unexpectedly huge deficits faced by European banks including Deutsche Bank, the stock
markets of major developed economies have suffered substantial decline since the beginning of the
year. From the year beginning to January 11, the indexes including S&P 500, Nikkei 225 and FTSE
100 fell by 5.9%, 9.5% and 6.4% respectively. Consequently, market panic intensified and spread
to China’s stock market. Thirdly, the “circuit breakers” escalated the stock market volatility. Such
mechanism, generally adopted by developed countries to prevent excessive volatility, could not be
"acclimatized" at the time of trial operation in early 2016 (China's stock market is mainly
dominated by retail investors and institutional investors hold less than 40% of tradable stocks,
while in developed countries, institutional investors constitute the main force); instead, it turned
into a booster of amplifying volatility in the stock market.

China’s Economic and Financial Outlook
BOC Institute of International Finance 17 2016Q2
Figure 29: Substantial Decline of SSE Composite
Index and SZSE Composite Index at Year
Beginning
Figure 30: Rising Turnover Rate of Financing
Transactions in Early Stage
Sources: Wind, BOC Institute of International Finance
II.1.5 RMB exchange rate recently showed a sign of stabilization, despite of a rocky start
Since the beginning of the year, the RMB/USD exchange rate has once undergone the expectation
on significant depreciation. The substantial fluctuation of market exchange rate was not only
reflected in the spot exchange rate of CNY and CNH against USD, but also manifested by the
spread between onshore RMB (i.e. CNY) and offshore RMB (i.e. CNH) which would increase with
the intensification of exchange rate volatility (CNH often higher than CNY, see Figure 31). The
main reasons are: firstly, due to the Fed’s interest rate hike and strengthening trend of USD, most
countries in the world experienced substantial exchange rate volatility and depreciation. Secondly,
the pressure on capital outflow increased under the expectation on depreciation, which generated a
feedback strengthening effect with the depreciation of RMB exchange rate. Thirdly, with the
increasing impact of stock market and other financial markets on the RMB exchange rate, market
factors have played a more and more important role in the RMB exchange rate formation
mechanism. As China's economic fundamentals have shown signs of improvement since March
and the Fed has decided to suspend interest rate hike, the RMB exchange rate has started to
stabilize, with the offshore and onshore RMB exchange rates tending to be consistent. As of March
25, the spot exchange rate of RMB against USD was announced at 6.5223, basically the same with
that at the end of 2015.
Figure 31: Movements of RMB/USD Exchange Rate
Sources: Wind, BOC Institute of International Finance
China’s Economic and Financial Outlook
BOC Institute of International Finance 18 2016Q2
II.2 Judgments on financial situation in Q2
II.2.1 Room available for monetary credit expansion, and steady growth as the main tone
In Q2, the scale of social financing and credit are expected to maintain stable and rapid growth.
First, there is a sign of recovery on the demand side; in particular, the growth rate of investment is
rebounding fast, suggesting certain room for credit growth. Second, insufficient funds still
constitute the constraint on investment, thus requiring further credit extension. Third, since the
release of the “13th
Five-Year Plan”, major projects have entered the period of implement and
accelerated propulsion, hence increasing the supply of credit is the key to "steady growth" in the
year. Considering the further execution of macro-prudential assessment system and the governance
of “down payment loans” by the Central Bank, financial institutions will make more efforts in the
liquidity management. As it is unlikely to promote credit expansion on a large scale, steady growth
will be taken as the main tone.
II.2.2 Unchanged liquidity easing pattern, and money market rate to slip steadily
In Q2, the money market is expected to maintain an easing pattern, with the interest rate declining
steadily. Main reasons are described as follows. Firstly, the Fed’s suspension of interest rate hike
will alleviate the pressures brought about by capital outflow and excessively fast reduction of funds
outstanding for foreign exchange, thus improving the supply of base currency. In February, the
Central Bank’s funds outstanding for foreign exchange stood at RMB23.98 trillion, declining by
RMB227.8 billion from January, with the obviously contracted declining range. Secondly, the
"interest rate corridor" has gradually become a new tool for the Central Bank’s liquidity
management, which is conducive to the mitigation of excessive volatility of money market rate. In
future, the Central Bank will strengthen the use of liquidity management tools such as SLF, MLF
and PSL, to deal with the disturbance resulted from tax payment and other seasonal factors, and
maintain the steady decline of central money market rate.
II.2.3 Continued consolidation of bond market, with steeper term spread
In Q2, the factors boosting the bond market include the followings. First, the accelerated bond
market reform will help enhance investor confidence and mitigate the risks in connection with the
bond market. Since February, PBC has successively issued the Administrative Measures for OTC
Business in the National Interbank Bond Market and the Circular on Further Liberalizing the
Investment in the Interbank Bond Market by Overseas Institutions, to initiate the pilot on
securitization of non-performing assets and put the discussion about debt-to-equity on agenda. The
issue of these policies marks that the bond market has taken a bigger step toward wider opening-up,
acceleration of interconnectivity and innovation of bond products. Second, the alleviated pressure
of capital outflow will be favourable to the development of bond market. The introduction of new
easing policy by the ECB and the postponement of interest rate hike by the Fed have weakened the
pressure related to RMB exchange rate and capital outflow. At the FOMC meeting held on March
17, the Fed decided to maintain the federal funds rate target unchanged at 0.25%-0.5%. Third, the
bullish bond market will not end thanks to the vast economic potential. A variety of signs show that
there is still downward pressure on the macro-economy. The following factors have certain effect
on the downward trend of bond market. The first is the intensified shock to bond supply. In 2016,
the Central Government's debt-deficit ratio would stand at 3%, which means that about RMB2.6
trillion of T-bonds and RMB4.5 trillion of local bonds might be issued additionally, and the interest
rate bonds are likely to increase by nearly RMB1.4 trillion. . The second is the deteriorating
profitability of some enterprises, which leads to the rise of default risk for some bond types and
further expansion of spread. Overall, the bond rate has dropped to a low level, with limited
possibility of further substantial decline; therefore, the consolidation of bond market will continue.

China’s Economic and Financial Outlook
BOC Institute of International Finance 19 2016Q2
II.2.4 A new stage of slight consolidation for the stock market, with the focus on stability
In Q2, the stock market will be faced with a number of benign factors: firstly, economic
fundamentals will see a sign of improvement, thus shoring up the stabilization of stock market.
Secondly, the introduction of “13th
Five-Year Plan”, accelerated reform of state-owned enterprises
and the “Shenzhen-Hong Kong Stock Connect” expected to launch in the second half of the year
will constitute favourable policy factors. Thirdly, regulators will pay more attention to market
stability, which is conducive to the long-term steady development of the stock market. However, a
variety of phenomena also show that investors are not so confident in the development of the stock
market. Firstly, the sustained low balance of “margin trading” suggests that investors are not
enthusiastic about putting additional capital into the market. Secondly, due to the ongoing
de-capability, some risks exposed to enterprises in an accelerated manner will spread to the stock
market. Thirdly, the recovery of real estate market and stabilization of bulk commodities might
have certain crowding-out effect on the stock market. On the whole, the stock market is expected
to bottom out in Q2; and it is also likely to present slight rise with the improvement of corporate
profitability and accelerated supply-side reform.
II.2.5 Weakened expectation on exchange rate depreciation, with two-way movements as the
new normal state
In Q2, the expectation on exchange rate depreciation of RMB against USD will weaken further,
and RMB exchange rate is to gradually stabilize. The main reasons include the followings. The
first is the favourable external environment. Both the expansion of "negative interest rate" by the
ECB and the suspension of interest rate hike by the Fed will help alleviate the expectation on
depreciation. The second is the reduced economic downward pressure, which is also conducive to
maintaining the stability of RMB exchange rate. The third is the decreased pressure of
cross-border capital outflows. Since the beginning of this year, the deficit in exchange
settlement/sales and foreign payments/receipts of non-bank sectors including enterprises and
individuals has presented a declining trend. In February, the deficit in exchange settlement/sales of
non-bank sectors was reported at USD35 billion, a decrease of 50% compared to January.
Nevertheless, considering that China still faces the downward pressure on economic fundamentals
and market factors play a more important role in the RMB exchange rate pricing mechanism,
certain fluctuation of RMB exchange rate in future will be quite normal.
III. Issues of Concern in Current Economic and Financial Operation
III.1 Growth engine is still weak, with unstable foundation for economic stabilization
Despite the steady recovery of investment growth, the sources of funds are not optimistic. In the
first two months, the sources of funds for investment in fixed assets increased by 0.9%, 5.8
percentage points lower than that in the same period of last year; in which, foreign capital and
self-raised funds dropped by 34.2% and 3.1% respectively. Meanwhile, due to the slowdown of
income growth, residents have pessimistic expectation on future employment and income, and new
consumer goods have declined from rapid growth, bringing about a variety of challenges to the
growth of consumption. On the supply side, the manufacturing PMI has fallen for four consecutive
months; in February, PMI further slipped to 49, indicating the relatively sluggish manufacturing
industry by and large. As a result of intensified de-capacity, the added value growth rate of
overcapacity industries will continue to fall. Notwithstanding the rapid growth of emerging
industries, the proportion of such industries is relatively low, with the impact on the economy not
as obvious as that of traditional industries. In February, the services PMI was reported at 52.2, still
staying in the expansion range of more than 50; as it has dropped for two consecutive months, the
growth rate of service sector is expected to slightly decline in Q2.
China’s Economic and Financial Outlook
BOC Institute of International Finance 20 2016Q2
III.2 The marginal effect of monetary policy is abating, and a new round of housing price rise
is found in the first-tier and second-tier cities
Several rounds of interest rate and RRR cuts have gradually lowered social financing costs, but
haven’t effectively alleviated the problem of insufficient effective demand.Since the beginning of
this year, the investment capital in place has seen a sharp slowdown in growth, indicating the
inadequate utilization of monetary credit in the field of investment in fixed assets in spite of rapid
growth; instead, a tendency of “capital flow to virtual economy from real economy” has been
found, giving rise to a new round of housing price rise in the country. In February this year, the
country's new housing price index for 70 large and medium-sized cities rose by 1.9% year on year,
up 0.9 and 7.6 percentage points compared with the previous month and the same period of last
year respectively. In which, new commercial housing prices of the first-tier and second-tier cities
respectively increased by 25.6% and 3.5% year on year in February, up 29.5 and 9.2 percentage
points over the same period of last year; that of the third-tier cities slipped by 1.0% year on year,
4.9 percentage points higher than that in the same period of previous year. A month-on-month
positive growth could be seen in terms of the new commercial housing prices of the first-tier,
second-tier and third-tier cities; of which, changing to positive growth from negative growth in the
third-tier cities has become an important symbol for general housing price rise in the country.
Overall, housing prices have presented a new feature of “convergence” instead of the
“differentiation and overall decline" in last year.
III.3 Various fiscal & financial risks accumulate and spread across different markets
China's economy currently stays is a critical period which could be characterized as “de-capacity,
destock and deleverage”, with the reform of banking, fiscal and taxation systems lying in a crucial
period and rapid development of new financial patterns, hence all kinds of fiscal & financial risks
may further accumulate. First, the bond default risk has increased; especially, with the progress of
"de-capacity", such risk is getting bigger in some overcapacity enterprises. In 2016Q1, 10 solvency
risk events occurred in the bond market; of which, 6 cases constituted material breach of contract,
involving Shandong Shanshui, Baoding Tianwei, Guangxi Nonferrous Metals, Yabang Group,
Yunfeng group and Zibo Hongda. Second, the risk of substantial volatility is rising in the foreign
exchange market. Affected by a series of factors in early 2016, the exchange rate of RMB against
USD once showed a phasic depreciation trend, and domestic and overseas spread once soared to
1800 points above, thus stirring up short selling and panic in the market, and further exacerbating
the trend of RMB depreciation. With the increase of economic and financial uncertainties at home
and abroad, the risk of phasic substantial volatility has been intensifying in the foreign exchange
market. Third, some local governments still have disguised borrowings such as “debts in the
disguise of shares” and illegal guarantees. Meanwhile, from January to February this year, the
revenue of local governments from land sales gained zero growth, though it actually improved
compared to the negative growth of last year. This year, under the positive fiscal policy which
encourages increase of spending and decrease of revenue, under the background, the occurrence of
local risks is still very likely in some regions.
III.4 Commercial banks face a grim operating situation, implying more difficulties for
coordinative implementation of monetary policy
Due to the current severe operating situation, commercial banks are confronted with more
difficulties and challenges. First, both NPLs and NPL ratio are rising, and profit growth is slowing
down. At the end of 2015, the NPL balance of commercial banks stood at RMB1,274.4 billion, an
increase of RMB431.8 billion from the end of last year; the NPL ratio was reported at 1.67%, up
0.42 percentage points from the end of 2014; and net profit had a year-on-year increase of 2.43%,
down 7.22 percentage points over the previous year. Although the previous cut of benchmark

China’s Economic and Financial Outlook
BOC Institute of International Finance 21 2016Q2
interest rates for deposits and loans by the Central Bank is considered as symmetrical interest rate
cut, the decrease of deposit rate is actually lower than that of lending rate, causing further decline
of the deposit-loan spread. In 2016Q1, the impact of successive interest rate cut on net interest
margin gradually took effect, bringing about the further drop of net interest income of commercial
banks. Second, the four major domestic banks currently are actively implementing the pricing
self-discipline management requirements (as of the end of March of 2015, the assets of large banks
accounted for more than 25%), while joint-stock banks, local commercial banks and rural credit
cooperatives are not subject to the requirements. The latter’s irrational quotations for the purpose
of seizing market share have resulted in the excessive rise of overall deposit rate in the market,
which is inimical to the reduction of social financing cost. Third, in the context of
macro-prudential supervision (MPA), the size of bank assets is restricted. In Q1, the open market
operations conducted by the Central Bank on each working day stepped onto the normal track,
making banks’ collateral management more difficult. Currently, the collaterals covered by the
Central Bank’s open market operations only include T-bonds, central bank bills and policy
financial bonds, without the inclusion of local government bonds (at the end of February 2016,
local government bonds under custody accounted for 19% of total of these bonds under custody). If
the frequency and scale of open market operations continue to expand, banks might be faced with a
plight of insufficient collaterals in future.
IV. Macroeconomic Policy Orientations
IV.1 Fiscal policy plays a significant role in growth stabilization and structural reform on
supply side
The Government Work Report of 2016 clearly proposes to make more efforts in the
implementation of proactive fiscal policy and raise the deficit from RMB560 billion to RMB2.18
trillion, with the deficit ratio increasing to 3% (Table 4). The main task is to moderately expand
aggregate demand and stabilize economic growth, with the focus on propping up the structural
reform on supply side from the aspects of cost reduction, de-capacity and shoring up weak spots.
Table 3: Forecasts on China’s Main Economic and Financial Indicators in 2016Q2 (%)
Indicators 2012
(R)
2013
(R)
2014
(R)
2015
(R)
2016
Q1(E) Q2(F)
GDP 7.7 7.7 7.3 6.9 6.6 6.7
Added value of industries above
a designated size 10.0 9.7 8.3 6.1 5.4 5.5
Investment in fixed assets 20.6 19.6 15.7 10.0 10.5 11.0
Total retail sales of consumer
goods 14.3 13.1 12.0 10.7 10.2 10.5
Exports 7.9 7.9 6.1 -2.9 -10.0 2.0
Imports 4.3 7.3 0.4 -14.2 -16.0 -12.0
Consumer Price Index (CPI) 2.6 2.6 2.0 1.4 2.1 2.1
Producer Price Index (PPI) -1.7 -1.9 -1.9 -5.2 -4.5 -3.0
Broad money (M2, period-end) 13.8 13.6 12.2 13.3 13.3 13.5
Social financing scale (existing) 19.1 17.5 14.3 12.4 12.5 13.0
Source: BOC Institute of International Finance

China’s Economic and Financial Outlook
BOC Institute of International Finance 22 2016Q2
First, intensify tax cut and fee clearance, to reduce the tax burden of enterprises. The first is
to push forward the “collection of VAT instead of business tax”. From May 1 this year, the pilot on
“collection of VAT instead of business tax” will be extended to cover such industries as
construction, real estate, finance and life services, and new immovable properties of all enterprises
will be incorporated into the scope of VAT deduction, for the purpose of creating a fair taxation
environment; the second is to strengthen the clearance of fees and charges. A number of
government funds will be stopped or merged, and the scope of exemption from collection of
administrative charges will be expanded, so as to alleviate the non-tax burden of enterprises; and
the third is to improve the taxation system, for the support of policies regarding “mass innovation
and entrepreneurship”, technological R&D, industrial upgrading, and "the Belt and Road"
initiative.
Table 4: Anticipated Economic Development Targets in 2016
Main indicators (anticipated
targets) 2016 2015 Change
GDP 6.5%-7% 7% ↘
CPI 3% 3% -
New jobs in urban areas Over 10 million persons Over 10 million persons -
Registered unemployment rate in
urban areas 4.5% below 4.5% below -
Decline of energy consumption per
unit of GDP 3.4% above 3.1% above ↗
Fiscal deficit RMB2.18 trillion RMB1.62 trillion ↗
Fiscal deficit rate 3% 2.3% ↗
M2 13% 12% ↗
Total social financing (TFS) 13% -- --
Source: Government Work Report
Second, maintain reasonable fiscal expenditure and government investment, and improve the
efficiency of public service supply. The first is to play the supportive role of finance in the
de-capacity. The Central Government will arrange RMB100 billion of funds to address the problem
of staff resettlement arising from overcapacity, hence maintaining social stability; the second is to
input more fiscal resources to shore up weak spots. In addition to boosting the investment in the
construction of key projects including the major water conservancy projects, railway construction,
shantytown transformation in 2016, further efforts will be made to strengthen the construction of
modernized agricultural infrastructure and elevate the efficiency and precision of investment; The
third is to improve the performance of fiscal expenditure. Local governments at all levels will be
promoted to strengthen budget execution management, avoid too much closing balance carried
forward to the next year, and continue the efficient use and coordination of existing fiscal funds;
the fourth is to bolster PPP projects and government guidance funds, and enhance the efficiency of
public service supply.
Third, further regulate the management of local government debts, to guard against financial
risks. The first is to further accelerate the debt replacement of local governments and the
construction of local government bond market; the second is that the newly issued bonds will be
linked to the risk level of different regions, to strictly control the debt limits for the regions with
higher debt ratio; the third is to establish and perfect the local government debt disclosure
mechanism and strengthen the supervision of the public; the fourth is to properly handle the

China’s Economic and Financial Outlook
BOC Institute of International Finance 23 2016Q2
contingent debts of local governments and strengthen the punishment against the debts of local
governments in the disguised form of shares and illegal guarantees provided for enterprises, thus
preventing the superposition of fiscal & financial risks .
IV.2 Monetary policy will guide the steady growth of monetary credit through intensified use
of structural tools
In Q2, monetary policy will be faced with both favourable situation and some problems to be
solved urgently. On one hand, accelerated initiation of major projects and weak recovery of
corporate credit demand require monetary policy to further play the role in shoring up the
development of real economy and supply side reform. Meanwhile, the Fed’s postponement of
interest rate hike and weakened expectation on RMB depreciation will provide possibility and time
window for the easing of monetary policy. On the other hand, the emergence of inflation and
excessive rise of housing prices in the first-tier cities, to a certain degree, restrict the extent of
monetary easing. Therefore, monetary policy is anticipated to carry on the keynote of stability and
easing, with more flexibility and moderation, thus maintaining appropriate and sufficient liquidity.
First, guide the steady growth of monetary credit, with the attention paid to the strength and
timing. Q2 is deemed as a critical period for China’s economic stabilization. To maintain
reasonable growth of credit and social financing, monetary policy generally should continue the
steady and easing orientation and speed up the supplement of base currency, in the context of
continuously declining funds outstanding for foreign exchange, insufficient funding, intensified
fiscal policy and high reserve requirement ratio for banks. For one thing, the time window
generated from the Fed’s suspension of interest rate hike can be used to properly lower the reserve
requirement ratio by 0.5 percentage points; if the funds outstanding for foreign exchange decline
considerably, the expansion of declining range can be taken into consideration. Alternatively,
interest rate cut can be suspended. The benchmark interest rates for deposits and loans currently
stand at record lows. Further interest rate cut might impose limited marginal effect on the
mitigation of problems including difficulty in obtaining loans and high financing costs; instead, it
is likely to push up the housing prices in the first-tier and second-tier cities. Consequently, a new
round of asset price bubbles may appear, thus bringing about more pressure in connection with
cross-border capital outflow and RMB depreciation.
Second, strengthen open market operations, and guide money market rate down steadily. By
reinforcing the use of new liquidity management tools including MLF, the 7-day repo rate can be
guided to stabilize at 2% or lower, in order to create conditions for further reduction of financing
costs in the real economy. Through improvement of interest rate transmission mechanism, financial
institutions can be guided to link product pricing with SHIBOR and develop a reasonable and
unified capital pricing mechanism in various markets. Besides, the range of collaterals under open
market operations can be expanded to raise the proportion of outright repo and stabilize the
expectation on liquidity, and the guidance on market interest rate pricing can be cemented to
circumvent the negative impact of excessive competition in interest rate pricing on the decrease of
corporate financing costs.
Third, tighten up targeted regulation, and boost economic restructuring. The first is to give
more credit support to major areas and key processes such as MSEs, “agriculture, rural areas and
farmers”, affordable housing and high-end equipment manufacturing. The second is to buttress the
implementation of new regional strategies including coordinated development of Beijing, Tianjin
and Hebei as well as construction of the Yangtze River Economic Belt. The third is to apply the
RRR cut policy to targeted financial institutions which can give more support to “the Belt and
Road” projects. The fourth is to formulate reasonable window guidelines, to avoid “one-size-fit-all”
measures for overcapacity industries. And the fifth is to keep exerting the targeted supporting

China’s Economic and Financial Outlook
BOC Institute of International Finance 24 2016Q2
function of reserves, and apply preferential RRR incentive policy to the financial institutions with
certain percentage of loans granted to the encouraged industries.
Fourth, strengthen the coordination with regulators, to prevent the rise of local risks.
According to the latest development of real estate market, the policy concerning mortgage ratio can
be duly tuned up. For the first-tier cities with “overheating” housing market, housing prices should
be contained for the avoidance of excessive rise, and tailor-made credit policies can be performed
to properly tighten credit. The micro-regulation mechanism ought to be executed on a rigid and
practical basis, with the intensified governance of down payment loans and strict implementation
of property-purchasing restrictions. Moreover, in addition to the consolidated guidance for
commercial banking services, the risk assessment and risk warning for real estate loans need to be
enhanced.
Fifth, keep track of the changes in the financial market, to prevent the cross-market
contagion of relevant risks. On one hand, the capabilities in identifying and coping with the risks
spreading across different markets should be elevated, including: acceleration of unified regulation
over financial infrastructure and comprehensive financial statistics system, establishment of risk
identification and market turbulence warning mechanism, formation of coordination mechanism
for regulators in turbulent times, and integration of risk disposal tools of various regulatory
authorities. On the other hand, regulation should be reinforced. To be aligned with the development
of modern financial system, greater importance should be attached to the regulation over functions
and conducts based on institutional regulation. The codes of conduct and regulatory standards
regarding financial products with the same functions and financial services with identical business
attributes can be gradually unified, to abate regulatory arbitrage and avoid regulatory gap.
IV.3 The hard-won investment revival should be carefully maintained from the perspective of
policy orientation
With regard to investment policy, two sorts of tendencies should be avoided. One is the “useless
investment theory”, which holds that China’s investment rate is too high, while investment
efficiency is too low, so future economic growth should depend on consumption. According to
such theory, investment revival might make the economy go back to the old way, i.e. driven by
investment and exports. The other is the “only investment theory”, which believes, “whatever it is
right”, and China's economic growth must rely on investment at current stage. In fact, at the
present stage, keeping a certain pace (for example, 10%) of investment is absolutely necessary.
Investment should not be demonized; instead, it should be regarded as the most important tool for
the supply-side structural reform and strengthened management of demand side. The key is to
grasp three points, namely, adjusting investment direction, improving investment system, and
enhancing the efficiency of investment.
Based on the “plus-minus method”, credit funds should be channelled into the real economy, with
the avoidance of “uncompleted” projects. Albeit lots of new projects have been launched, the huge
capital gap (if any) is very likely to result in “uncompleted” projects. With regard to the guidance
on capital flow, the “plus-minus method” should also be applied in the macroeconomic policy. For
the fields such as promotion of regional coordinated development, "agriculture, countryside and
farmers", energy conservation and environmental protection, urban underground pipe network, and
the "three major strategies", the “plus method” can be adopted; while for the overcapacity
industries (including traditional industries and some emerging industries) and the real estate
industry with excess inventory, market should be directed to perform the “minus method”. By
making use of the instruments such as industrial guidance fund, investment-credit linkage and
equity financing, more support should be given to the emerging industries of strategic importance,
start-up and innovative industries; besides, the moves including PPP project financing, bond issue,
China’s Economic and Financial Outlook
BOC Institute of International Finance 25 2016Q2
debt replacement, development financing should be taken, so that additional financial aids can be
provided to the key areas including urban infrastructure, water conservancy, and "agriculture,
countryside and farmers".
In response to the “sunk” investment in the Northeast China, great importance should be attached
and multi-pronged actions should be taken to address the problem. If the investment growth of the
northeast is the same with that of the whole country, as estimated, China’s investment growth
would rise by 0.5 percentage points, and then national GDP would be driven to move forward by
about 0.2 percentage points. For the purpose of coping with the investment downturn in the
Northeast China, the Central Government can pump more resources into the areas including
regional infrastructure, industrial upgrading and staff resettlement through the introduction of
policies on transfer payment, tax breaks and industrial guidance, to ensure the sufficient
implementation of national policies for revitalizing the old industrial base in the northeast. At the
local level, local governments should cultivate and optimize the soft market environment by further
emancipating their mind and spurning the thoughts on “waiting, relying and requesting”. At the
same time, the government should learn to "let go", release the direct control over the economy and
create a good market environment, thus forcing enterprises to find their own way to solve the
problem.
IV.4 Differentiated policies should be applied to different cities, to balance the relationship
between the destock of real estate sector and the suppression of asset bubbles
The government should avoid excessive capital flows to the real estate market, curb the new
inventories resulted from soaring housing prices, and prevent the adopted solutions from being the
cause of exacerbating these problems". For the recent "overheating" housing market in the first-tier
cities, local governments should curb the excessive rise of housing prices by adherence to the
bottom line of policy, with moderate credit tightening, increase the supply of land and real estate,
and prevent excessive real estate speculation by the introduction of price guidelines. For the
third-tier and fourth-tier cities, the government should develop supporting destock policy in line
with market rules and boost the destock of real estate sector by comprehensive use of fiscal,
financial, land and other such means, including but not limited to, financially supporting migrant
workers for housing purchase, transferring commercial housing to the leasing market, controlling
the supply of new land, innovating homestead transfer and mortgage methods.
V. Special Subject: Multi-Year Budget Balance – Progress, Difficulties and Policy
Recommendations
With the ongoing slowdown of economic growth in recent years, China's fiscal policy has been
more proactive, albeit the greater pressure on revenue and expenditure. China’s fiscal deficit target
has gradually increased to 3% in 2016 from 1.6% in 2012. In the past year, the constraints of
management system for annual budget balance were substantially weakened, which is not
conducive to the regulation of financial "counter-cyclicity". Furthermore, it has become
increasingly difficult to adapt to the needs of China's macroeconomic management. The Third
Plenary Session of the 18th
CPC Central Committee, for the first time, proposed to improve the
budget management system and establish a multi-year budget balance mechanism. The “13th
Five-Year Plan” also put forward the betterment of government budget system, implementation of
multi-year budget balance mechanism and performance of interim financial planning and
management. In respect of budget management, the movement from annual balance to multi-year
balance is of great significance to the establishment of a modern financial system and achievement
of macroeconomic regulation objectives. In this part, the progress of key links and some issues to
be focused are elaborated.
China’s Economic and Financial Outlook
BOC Institute of International Finance 26 2016Q2
V.1 Progress of key links
In recent years, China has made a lot of beneficial explorations and attempts on the building of
through-the-cycle budget balance, in order to meet the requirements of modern finance and
economic development, thus laying certain foundation for the reform of budget management
system.
First, initiate the interim financial planning, and prepare a three-year rolling budget. In 2008,
Hebei Province, Jiaozuo City (Henan) and Wuhu County (Anhui) were selected by the Department
of Budget of the Ministry of Finance, to respectively serve as the provincial, municipal and
county-level pilot units for interim budgeting, marking the commencement of regional pilot at the
local government level. In 2014, the Ministry of Finance required to initiate the preparation of
three-year rolling budget for 2015-2017. From then on, enthusiastic explorations have been carried
out in different regions. On January 21, 2015, the Circular of the General Office of the State
Council on Further Revitalizing Existing Fiscal Funds was issued, which definitely provides,
“from 2015, during the preparation of national three-year financial planning by the Ministry of
Finance and regional three-year financial planning by local fiscal authorities, all the authorities
should prepare a three-year rolling budget for the projects with definite objectives at the same time;
particularly, the three-year rolling budget pilot should be conducted in the key areas including
water conservancy investment and operation, compulsory education, health, social security,
employment and environmental protection ”. The Opinions on Carrying out Interim Financial
Planning Management, released by the State Council on January 23, 2015, put forward that “the
interim financial planning should be prepared on a three-year rolling basis, in which, the planning
for the first year restricts the budget of corresponding year, and the planning for the second and
third year plays a guiding role for the budget of corresponding year. Upon the completion of
budget for a year, the planning for the following two years should be promptly adjusted, with the
supplement of planning for another year, to form the new three-year interim financial planning”.
The interim financial planning, as the transitional form of interim budget, focuses on the study and
formulation of fiscal policy based on the scientific anticipation for overall fiscal revenue and
expenditure, so that the main fiscal policies can be implemented in a relatively stable manner. In
the future, the government will make duly research and adjustment according to economic and
social development situation, for the gradual transition of interim financial planning to true interim
budget.
Second, establish a sound budget stabilization fund mechanism. The budget stabilization fund
mechanism, one of the important means to achieve steady operation of budget, acts as the
important link between interim budget and annual budget. In 2007, the Central Government set up
a budget stabilization fund. Local fiscal authorities can also establish local budget stabilization
fund based on local financial resources. In January 2008, Shanghai became the first city which
substantively established a budget stabilization fund. As of the end of 2012, the vast majority of
cities in the country have issued their own management measures for the budget stabilization fund
and explained the measures in the annual budget reports.
The new Budget Law further standardizes and institutionalizes the sources and use of budget
stabilization fund. The Circular of the General Office of the State Council on Further Revitalizing
Existing Fiscal Funds specifies the size of budget stabilization fund; and it also provides that the
“size of budget stabilization fund after the inclusion of the budget for the year of preparation
generally should not exceed 5% of total expenditure in the general public budget at corresponding
level for that year; if exceeding 5%, the local government should increase the deficit to be written
down or strengthen the mitigation of governments debts”.
Third, propel the reform of government accounting system. Government accounting constitutes

China’s Economic and Financial Outlook
BOC Institute of International Finance 27 2016Q2
the foundation of budget management. In the past, the government usually adopted the accounting
method on cash basis, which could only reflect the actual cash flow information including receipt
and payment. However, it could neither fully present the government's financial position, nor
provide the detailed basic information for the preparation of rolling budget. With the
transformation of China's government functions and the establishment and improvement of public
finance system, the accounting system on cash basis has been difficult to meet the needs of new
situation. To this end, the third Plenary Session of the 18th
CPC Central Committee proposed to
reform the government accounting system and establish an accrual-basis consolidated government
financial reporting system. The new Budget Law clearly put forward that, "the financial
departments of the governments at various levels shall prepare a consolidated government financial
reports on the accrual basis each year, to report the government's overall financial position,
operation as well as medium and long-term financial sustainability".
In recent years, China has been doing a lot of explorations and practices with respect to the
establishment of government accounting system on the accrual basis. In 2010, the new system was
initially promoted in administrative institutions. At the end of the year, 11 provinces including
Zhejiang were selected to experimentally prepare the consolidated government financial reports on
the accrual basis. The Proposal on Reform of Accrual-Basis Consolidated Government Financial
Reporting System released in 2014 proposed to build a government accounting standard system
with Chinese characteristics and an accrual-basis consolidated government financial reporting
system by 2020, with providing specific implementation steps.
Fourth, ameliorate relevant legislative guarantee. The new Budget Law as adopted in 2014
modifies the previous clause, i.e. “the budgets at various levels shall maintain a balance between
receipts and payments", to “the governments at all levels shall establish a multi-year budget
balance mechanism”. Besides, it defines that the focus of budget review should be shifted to
expenditure, including, whether the budget arrangements can accord with the policies on national
economy and social development, and whether the budget arrangements for key spending items
and major investment projects are appropriate. In addition, it is provided that a budget stabilization
fund can be set in the general public budgets at all levels to cover the inadequacy of budgetary
funds in subsequent years, and the consolidated government financial reports on the accrual basis
should be prepared. All these factors have laid a legal foundation for promoting the establishment
of a multi-year budget balance system, provided legal basis for relevant reforms, and turned the
past simple departmental guidance documents into legally binding guidance plans.
V.2 Difficulties and problems in building of multi-year budget balance mechanism
Building of multi-year budget balance mechanism involves many technical issues and needs to be
constantly practiced and improved in a long time. In the process, it is necessary to properly deal
with the following issues.
First, effective links between the medium-term financial planning and the national economic
development planning. First of all, coordination between finance and projects within the planning
period. According to the medium-term financial planning, significant reform and policies and
major projects involving fiscal revenue or expenditure in the next three years should be studied and
determined based on the five-year plan on national economic and social development, special plans
and regional plans. Major projects will be demonstrated scientifically for a long and medium term,
and project reserve should be made properly. Since China’s medium-term financial planning is in
the early period of implementation, construction of departmental expenditure project library is
behind the schedule, with problems of noncompliance or imprudence in preparation and poor
ability in development planning. Second, macroeconomic and financial revenue and expenditure
forecast. Multi-year budget is intended to analyze various factors affecting financial revenue and

China’s Economic and Financial Outlook
BOC Institute of International Finance 28 2016Q2
expenditure based on reliable data and measurement models, and to predict future fiscal revenue
and expenditure, while properly making economic forecast.
Second, coordination between annual budget and multi-year budget. During the
implementation of a multi-year balanced budget, it is necessary to draft an annual budget within
the framework of a medium-term budget. If the budget is inaccurate or cannot be effectively
implemented, or fulfillment of the annual budget falls behind the schedule, it will make the budget
of the current year unable to cover the expenditure in key and priority fields, thereby affecting the
budget arrangement and implementation in the coming years. Inadequate constraint of annual
budget will impair the effect of cross-cycle regulation of medium-term financial plan.
Third, performance assessment on budget expenditure. Performance management is key to
standardization of budget management. For the purpose of making budget decisions more scientific,
solve the inconsistency between budget drafting and implementation and improving the utilization
efficiency of budget fund, China should effectively link budget performance management to
budget drafting and implementation and bring the feedback and guidance role of performance
information into play. The government published the Guidelines on Pushing forward Budget
Performance Management in 2011, calling for driving budget performance management as a
significant task for promoting budget management reform at present and in the future. However,
budget performance management is just getting start. China’s performance assessment system is
relatively outdated, and relevant implementing rules and performance assessment indicators,
standards and methods remain imperfect. There is still a long way to go in building a scientific, fair
and reasonable budget performance management system.
Fourth, coordination and cooperation among departments. Multi-year budget balance involves
many departments, and needs to be consulted with tax, customs, development, reform and other
related departments about tax reform and adjustment to major tax policies. In regard to expenditure
policies, it is also necessary to comb expenditure policies and projects within the planning period,
and to clarify the policy objectives and tasks. We may determine the total amount of budgetary
resources in a top-down manner and departmental expenditure plan and budget items in a
bottom-up manner. There are a lot of problems, including “fragmentation of business lines and
departments” and “poor management or cooperation of different departments”, in China’s
management system. Besides, some departments don’t have proper awareness, and were reluctant
to take part. That posed higher requirements on China’s administrative management capability.
V.3 Policy recommendations
Building the multi-year budget balance mechanism is a complicated and enormous system
engineering that concerns many areas with huge workload and high policy requirements. It requires
all parties to work together and strengthen the follow-up of supporting measures.
V.3.1 Enhance top-level design
China may set up an interdepartmental budget management committee with the Ministry of
Finance as the core, to reinforce the coordination and cooperation between the finance department
and the departments and units at various levels, study major reform and policy measures in related
industries and fields, scientifically demonstrate the long and medium-term significant events and
determine the priority of budget arrangements.
The finance department should play a leading part in improving medium-term financial plan and
the amendment to the three-year rolling budget preparation methods, contents and technique,
clarifying budget adjustment procedures, approval authority and responsible parties and
intensifying the publicity and application of related policies to governments at various levels and
relevant budget units; the finance department will develop and improve information systems,
China’s Economic and Financial Outlook
BOC Institute of International Finance 29 2016Q2
including budget preparation and accounting systems, and reinforce the sharing and unification of
information between various departments.
V.3.2 Strengthen the coordination between medium-term budget and medium and long-term
plan of the government
Project library construction and management should be improved. China should develop a uniform
project management and budget review system, and strengthen the link of medium-term budget
expenditure plan to the information on special fiscal fund project library and synchronous update
of information. China should also classify and comb projects and prepare for project reserves in
advance by selecting, demonstrating, sorting and reviewing expenditure items.
Economic and financial forecast capability should be enhanced. China should create a complete
economic and financial database, including information on economy, society, tax and finance, so as
to lay a foundation for budget management. China should enhance the data mining ability and
analysis technique for modern economic models, and improve the accuracy and reliability of
medium and long-term economic forecast and financial revenue and expenditure prediction. China
should reinforce the basic study of related fields, widely give play to the social strength, and work
closely with colleges, research institutes and experts in related fields.
V.3.3 Reinforce the system building
China should specify the management policies concerning establishment, transfer-in, use and
oversight of budget stabilization fund and budget revolving fund. According to the financial
strength of each region, China should appropriately adjust the requirements on proportion of
budget stability fund and budget revolving fund, and link the setup and transfer-in of these funds to
local financial revenue and expenditure structure.
China should gradually improve and implement budget performance management. China should
establish the management system covering performance objective, performance monitoring,
performance assessment and application of performance results, develop detailed workflow and
operating rules, and effectively link them to budget drafting, implementation and supervision.
China should improve the building of assessment system, enhance the leading role of financial and
budgetary departments in performance assessment, and manage to introduce third party force,
including intermediary agencies; system building includes the assessment indicator system and
assessment standards relating to comprehensive expenditure and project expenditure; performance
assessment results will be linked to budget fund arrangements.

Disclaimer
This report is prepared by BOC Institute of International Finance. The information contained in this report is
from publicly available sources.
The views or estimates contained in this report only represent the judgment of the author as of the date hereof.
They don’t necessarily reflect the views of BOC. BOC Institute of International Finance may change the views or
estimates without prior notice, and shall not be held liable for update, correction or revision of this report.
The contents and views in the report are for information purpose only and don not constitute any investment
advice. No responsibility is held for any direct and indirect investment consequences as a result of the
information provided in the report.
The copyright of this report is exclusively owned by BOC Institute of International Finance. No individuals and
institutions shall be allowed to copy, reproduce and publish the whole or part of the report without written
consent. In case of quotation, reference to BOC Institute of International Finance shall be given, and any
quotation, abridgment and revision that deviate from the original meaning of the report shall be prohibited. BOC
Institute of International Finance reserves the right to take legal actions on any violation and any quotation that
deviates the original meaning of the report.