global adaptation to a lipid environment triggers the...
TRANSCRIPT

Global Adaptation to a Lipid Environment Triggers the Dormancy-Related Phenotype of Mycobacterium tuberculosis
Juan G. Rodríguez,a Adriana C. Hernández,a Cecilia Helguera-Repetto,b Diana Aguilar Ayala,b Rosalina Guadarrama-Medina,b
Juan M. Anzóla,a Jose R. Bustos,a María M. Zambrano,a Jorge González-y-Merchand,b María J. García,c Patricia Del Portilloa
Departamento de Biotecnología Molecular y Genética Molecular, Corporación CorpoGen, Bogotá, Colombiaa; Escuela Nacional de Ciencias Biológicas, InstitutoPolitécnico Nacional (IPN), Mexico Distrito Federalb; Departamento de Medicina Preventiva, Facultad de Medicina, Universidad Autónoma de Madrid, Madrid, Spainc
ABSTRACT Strong evidence supports the idea that fatty acids rather than carbohydrates are the main energy source of Mycobacte-rium tuberculosis during infection and latency. Despite that important role, a complete scenario of the bacterium’s metabolismwhen lipids are the main energy source is still lacking. Here we report the development of an in vitro model to analyze adapta-tion of M. tuberculosis during assimilation of long-chain fatty acids as sole carbon sources. The global lipid transcriptome re-vealed a shift toward the glyoxylate cycle, the overexpression of main regulators whiB3, dosR, and Rv0081, and the increased ex-pression of several genes related to reductive stress. Our evidence showed that lipid storage seems to be the selected mechanismused by M. tuberculosis to ameliorate the assumed damage of reductive stress and that concomitantly the bacilli acquired aslowed-growth and drug-tolerant phenotype, all characteristics previously associated with the dormant stage. Additionally, in-tergenic regions were also detected, including the unexpected upregulation of tRNAs that suggest a new role for these moleculesin the acquisition of a drug-tolerant phenotype by dormant bacilli. Finally, a set of lipid signature genes for the adaptation pro-cess was also identified. This in vitro model represents a suitable condition to illustrate the participation of reductive stress indrugs’ activity against dormant bacilli, an aspect scarcely investigated to date. This approach provides a new perspective to theunderstanding of latent infection and suggests the participation of previously undetected molecules.
IMPORTANCE Mycobacterium tuberculosis establishes long-lasting highly prevalent infection inside the human body, called latenttuberculosis. The known involvement of fatty acids is changing our understanding of that silent infection; however, question ofhow tubercle bacilli globally adapt to a lipid-enriched environment is still an unanswered. With the single change of providingfatty acids as carbon sources, the bacilli switch on their program related to dormant stage: slowed growth, accumulation of lipidbodies, and development of drug tolerance. In this stage, unexpected and previously unknown participants were found to playputatively important roles during the process. For the first time, this work compares the global transcriptomics of bacteria byusing strand-specific RNA sequencing under two different growth conditions. This study suggests novel targets for the control oftuberculosis and provides a new straightforward in vitro model that could help to test the activity of drugs against dormant ba-cilli from a novel perspective.
Received 4 April 2014 Accepted 8 April 2014 Published 20 May 2014
Citation Rodríguez JG, Hernández AC, Helguera-Repetto C, Aguilar Ayala D, Guadarrama-Medina R, Anzóla JM, Bustos JR, Zambrano MM, González-y-Merchand J, García MJ,Del Portillo P. 2014. Global adaptation to a lipid environment triggers the dormancy-related phenotype of Mycobacterium tuberculosis. mBio 5(3):e01125-14. doi:10.1128/mBio.01125-14.
Editor Carol Nacy, Sequella, Inc.
Copyright © 2014 Rodríguez et al. This is an open-access article distributed under the terms of the Creative Commons Attribution-Noncommercial-ShareAlike 3.0 Unportedlicense, which permits unrestricted noncommercial use, distribution, and reproduction in any medium, provided the original author and source are credited.
Address correspondence to Patricia Del Portillo, [email protected], or María J. García, [email protected].
It is estimated that 2 billion people are latently infected withMycobacterium tuberculosis, representing potential cases of reac-
tivation and transmission and hampering better control of thedisease (1). As tuberculosis (TB) infection progresses, the bacilliface adverse environmental conditions to which they respond byentering into a silent phase known as dormancy. In this phase, thebacteria are able to survive for the entire life of the host causinglatent infection. Eventually, they can also reactivate and cause ac-tive disease when the host’s immune system becomes weakened(2). Bacterial adaptation to the different stages of the infectioninvolves fine regulation of gene expression. Global transcriptomeanalysis has identified critical regulators of gene expression such asthe phoP virulence regulator (3), the kstR cholesterol regulator (4),
the dosR hypoxia regulator (5), or Rv0081, which was also recentlyproposed as a hypoxia regulator (6). The identification of noncod-ing RNAs in M. tuberculosis also suggests that these moleculescould regulate microbial adaptation (7, 8). During latency, M. tu-berculosis is presumed to reside in lipid-rich foamy macrophages(9) and accumulate internal lipid droplets full of triacylglycerols(TAGs) that are used subsequently as an energy source for persis-tence (10). Nevertheless, the bacilli continue replication (11) andretain low but detectable metabolic activity (12). It has also beenshown that M. tuberculosis uses host lipids, in particular, fattyacids and cholesterol, as energy sources during intracellulargrowth and persistence (13–15).
Although several in vitro models have been used to mimic the
RESEARCH ARTICLE
May/June 2014 Volume 5 Issue 3 e01125-14 ® mbio.asm.org 1
m
bio.asm.org
on June 6, 2018 - Published by
mbio.asm
.orgD
ownloaded from
mbio.asm
.org on June 6, 2018 - P
ublished by m
bio.asm.org
Dow
nloaded from
m
bio.asm.org
on June 6, 2018 - Published by
mbio.asm
.orgD
ownloaded from

environment of dormant bacilli during latency (16–18), culturesgrown in the presence of lipids, the most abundant moleculessurrounding bacilli in vivo, have not been extensively analyzed.
To gain insight into the process of M. tuberculosis adaptation toa fatty acid environment, we developed an in vitro model wherebacilli were grown in even-length long-chain fatty acids (LC-FAs)as the sole carbon source. Even-length LC-FAs were selected be-cause they are the main LC-FAs found in human cells (19) and area major component of TAGs (20). Although other in vivo lipidenergy sources cannot be ignored, it is possible that for long-terminfection, bacilli might benefit by selecting even-length LC-FAs,avoiding the toxicity associated with other lipid sources (21).
We analyzed changes in the global transcriptome of M. tuber-culosis by using high-throughput methods such as strand-specificRNA sequencing (ss-RNA-seq) (22).
RESULTS AND DISCUSSIONThe global transcriptome of M. tuberculosis in the LC-FA invitro model. In order to mimic the nutrient conditions presumedto be encountered by M. tuberculosis during in vivo infection (23),we cultured M. tuberculosis H37Rv in a medium supplementedwith a mixture of even-length LC-FAs as the sole carbon source.Growth in LC-FAs was compared to growth in dextrose as a con-trol. We found that growth in LC-FAs was slower than growth indextrose but reached similar saturation points (see Fig. S1 in thesupplemental material).
RNA was analyzed by ss-RNA-seq with material from bacilligrown in dextrose to the exponential (DE) and stationary (DS)phases and in LC-FA to the exponential (FE) and stationary (FS)phases (see Fig. S1). The sequence depth obtained showed goodcoverage of the M. tuberculosis genome, as indicated by the pla-teaus reached in all instances by mapping reads against codingsequences (CDS) (see Fig. S2A). A normal distribution of the datawas achieved in all cases (see Fig. S2B) (24). The number of se-quences retained after processing for quality was 13.1 to 19.3 mil-lion reads (Table 1). To facilitate the comparison of gene expres-sion, the data were normalized as reads per kilobase per millionreads (RPKM). Only genes showing �1 RPKM were consideredfor analysis. Statistical analysis for significant differential gene ex-pression was performed with Fisher exact test (see Table S1A andB in the supplemental material). That analysis gave results consis-tent with those obtained with the DEGseq package for biologicalreplicates (see Table S1C and D) (see Materials and Methods).
We identified all 45 tRNAs (25) (see Table S2A), all of the mosthighly expressed small RNAs (7), and most of the previously iden-tified noncoding RNAs (8) (see Table S2B). During growth in
LC-FAs, gene expression (reads mapped to CDS) was greatly re-duced compared with the control, particularly in the stationaryphase (Table 1). This low gene expression contrasts with the highnumber of reads that mapped to intergenic regions (IGRs), sug-gesting close control mediated by small RNAs in cultures grownwith LC-FAs.
Consistent with the high number of reads mapping to IGRs inthe FS culture, the four most highly expressed IGRs correspondedto this sample (see Table S2B and C). Two of them, namely,MTS2823 and MTS0977 (see Table S2C), have also shown in-creased expression during infection (7), suggesting that theymight be important regulators and highlighting the association ofthe conditions used in our model with the conditions encounteredby the bacilli in vivo.
More remarkable was the overexpression of tRNAs in FS (seeTable S2A), which contrasts with the few transcripts mapped toCDS in FS and which, presumably, was a reflection of low trans-lation activity (Table 1). Aminoacyl tRNAs are involved in cellularprocesses other than protein synthesis, such as the modification ofbacterial membrane lipids via the multiple-peptide resistance fac-tor (MprF) protein (26). MprF attaches positively charged aminoacids to the polar heads of phosphatidylglycerol, effectively neu-tralizing the negative charge of the membrane (27) and thus de-creasing membrane permeability and susceptibility to antibacte-rial peptides and cationic antibiotics (28). The tRNAs involved inthese changes are tRNA-Lys, tRNA-Ala, and less frequently tRNA-Arg (26, 29), the same tRNAs that were expressed more in FS thanin DS in our model (Fig. 1). We hypothesize that, in the presenceof FA, bacilli modify their envelope by aminoacyl-tRNAs, confer-ring adaptation to stress and possibly increasing tolerance to an-tibiotics, a process associated with the dormant stage of M. tuber-culosis (17). Whether this attractive mechanism to modify the cellenvelope is, in fact, involved in the adaptation and survival of thebacilli during long-term infection remains to be investigated.
Comparative analysis of CDS between growth in dextrose andLC-FA showed that majority of genes had similar expression lev-els, both at exponential and stationary phases (see Fig. S3A and Bin the supplemental material), with only 10% of the potential CDSbeing differentially expressed (Fig. 2; see Table S3). This analysisidentified genes with differential expression in all of the functionalcategories of TubercuList (http://www.tuberculist.epfl.ch), withthe exception of genes belonging to the PE/PPE category in theexponential phase (Fig. 2; see Table S3). On the contrary, thePE/PPE category was overrepresented in the stationary phase(Fig. 2 and Table S3), suggesting that when M. tuberculosis growsin a fatty acid environment, these abundant proteins (25) might
TABLE 1 Transcriptomic profile of M. tuberculosis in different carbon sourcesa
Reads
No. (%) of reads in following growth phase:
DE DS FE FS
All 13.12 19.29 18.314 16.054All mapped 8.17 (62.3) 10.78 (55.9) 9.56 (53.4) 8.01 (51.2)
Mapped without rRNAMapped to CDS 0.52 (71.3) 0.51 (57.6) 0.28 (61.6) 0.10 (13.4)Mapped to IGRs 0.17 (22.4) 0.25 (28.0) 0.149 (32.9) 0.62 (83.0)Mapped to antisense CDS 0.05 (6.4) 0.13 (14.4) 0.02 (5.4) 0.03 (3.6)
a Total numbers (in millions) of reads determined under the different conditions tested (upper part) and numbers (percentages) of reads determined by excluding thosecorresponding to rRNA (lower part) are shown.
Rodríguez et al.
2 ® mbio.asm.org May/June 2014 Volume 5 Issue 3 e01125-14
m
bio.asm.org
on June 6, 2018 - Published by
mbio.asm
.orgD
ownloaded from

play an additional role in antigenic variation and immune evasion(30, 31). Contrary to our expectations, genes belonging to thefunctional category “lipid metabolism” were not overrepresentedin either the exponential or the stationary phase (Fig. 2; see Ta-ble S3), a result that could be attributed to the gene redundancypresent within this category (25). Among the most highly differ-entially expressed genes in FS, we identified pckA (P � 4�14) andtgs-1 (P � 2�13) (see Table S1F), both of which play critical roles inthe lipid metabolic pathways of M. tuberculosis (10, 32). As hap-pens with pckA, the gene icl-1 was also upregulated within thetrichloroacetic acid (TCA) cycle (see Table S1E and F), consistentwith the central role of these enzymes in M. tuberculosis lipid me-tabolism (13). Because of the use of only even-length LC-FAs, wedid not expect production of propionyl coenzyme A (CoA) fromlipid degradation. In agreement with this, we did not detect in-creased expression of genes belonging to the methylcitrate andmethylmalonate pathways (33).
The functional category of “regulatory proteins” was under-
represented in the stationary phase, highlighting the involvementof four genes upregulated in the same phase (FS) (Fig. 2; see Ta-ble S3). Two of these correspond to the known regulators WhiB3,which is associated with redox balance (34), and DosR, which isrelated to redox balance, and a major regulator of hypoxia inM. tuberculosis (5). As a result, a large number of DosR-regulatedgenes were also expressed more in FS than in DS (Table 2; seeTable S1F). We also identified the recently reported regulatorRv0081, which is considered a global hypoxic response regulator(6) and the presumptive transcriptional regulator nrdR (http://www.tuberculist.epfl.ch).
Given that WhiB3 and DosR, two heme sensor proteins relatedto intracellular redox balance (34, 35), were identified as key com-ponents of the adaptation of M. tuberculosis to growth in LC-FA,we searched for significantly overexpressed genes involved in re-dox balance. Independently of the phase of growth, bacilli cul-tured in LC-FAs had a higher percentage of significantly overex-pressed genes associated with reductive stress (see Table S4A).
These results suggest that growing M. tu-berculosis in a fatty acid medium puta-tively causes a burst in reductive stressand thus the required molecules to main-tain redox balance would be induced inorder to allow cell growth under theseconditions. An imbalance of the redoxequilibrium leads to either reductive oroxidative stress responses, the latter welldocumented to be involved in M. tuber-culosis infection (36). However, the con-tribution of its counterpart, namely, re-ductive stress, has barely been consideredthus far and occurs when reducing equiv-alents, such as NADH, FADH, or NA-DPH, are abnormally increased (34, 37).In our LC-FA cultures, the reducingequivalents that could be generated byboth �-oxidation of LC-FAs and TCAmetabolic activities would result in re-ductive stress that must be cleared forsurvival via reductive sinks, such as poly-
FIG 1 Differential expression of tRNAs in the fatty acid model. Fold change comparison of tRNAs between the stationary and exponential phases under bothculture conditions. Fold changes were calculated by calculating DS/DE (black bars) and FS/FE (light brown bars) RPKM ratios.
FIG 2 Genes differentially expressed in the fatty acid model. Numbers of genes differentially expressedby functional categories according to TubercuList (http://www.tuberculist.epfl.ch/) are shown. Circlesizes correspond to the numbers of genes with significant differential expression in fatty acid mediumversus dextrose medium. (A) Exponential phase. (B) Stationary phase.
RNA-seq of M. tuberculosis in a Fatty Acid Environment
May/June 2014 Volume 5 Issue 3 e01125-14 ® mbio.asm.org 3
m
bio.asm.org
on June 6, 2018 - Published by
mbio.asm
.orgD
ownloaded from

mer deposition, reverse TCA, or nitrate reductase activity, amongothers (35, 37). The induced expression of 11 genes with allegedlyreductive sink activity, 8 of which are involved in polymer depo-sition, might indicate the participation of reductive stress duringgrowth of M. tuberculosis in LC-FA (Table 3). Our results suggestthat polymer deposition, which includes TAG accumulation, aswell as the formation of other complex lipids, such as SL-1, PAT,DAT, and PDIM (Table 3), was the main reductive sink mecha-nism used by M. tuberculosis when grown on fatty acids as carbonsources. This is consistent with the observed lipid droplets insideM. tuberculosis during the stationary phase of growth in LC-FAmedium (Fig. 3A) and agrees with the suggestion that lipid accu-mulation could be a reputed marker of M. tuberculosis duringlatent infection (17, 38). The accumulation of lipid droplets insideM. tuberculosis in our LC-FA in vitro model, together with the highexpression of tgs-1, prompted us to test for drug tolerance, an-other dormancy-related characteristic of the bacilli. To do this, wedetermined the drug susceptibility of M. tuberculosis to a mixtureof four drugs known to be active against replicating and nonrep-licating bacilli (39). Our results showed that M. tuberculosis man-ifested greater drug tolerance in the presence of lipids than during
growth in dextrose (Fig. 3B and 3C). The relationship between thedetected overexpression of tRNAs and drug tolerance deservesfurther investigation, as it represents an attractive idea regardingthe participation of tRNAs in the dormant stage of M. tuberculosis.
Comparison of the LC-FA model with other dormancy-related in vitro models. The host environmental cues that triggerthe M. tuberculosis dormant stage or long-term infection are notfully elucidated, although changes associated with hypoxia, star-vation, and low pH have been shown to be important (17). To testthe suitability of growth in LC-FA as an in vitro model, we com-pared the gene expression profile of our lipid-enriched conditionwith other well-established in vitro models designed to mimic thehypoxic and starvation conditions faced by the pathogen withinthe host. Genes with significantly higher expression during growthin LC-FAs (see Table S1E and F in the supplemental material)were compared with the highest-scoring genes derived from arraydata obtained from the meta-analysis published by Murphy andBrown (40). The total number of genes shared by any two condi-tions was very similar, with no significant differences in percent-ages (see Fig. S4A). Therefore, growth in LC-FA can be anothersuitable in vitro model for the analysis of genes related to the dor-
TABLE 2 Member genes of the dormancy regulon with significantly increased expression in the fatty acid model
Gene tagGenename
Functionalcategorya Function (reference)
RPKM ratiob P valuec
FE/DE FS/DS FE vs DE FS vs DS
Rv0079 10 Unknown; probable transduction regulatoryprotein (42)
1.59 2.10 1.09 E-12 3.37 E-07
Rv0080 10 —d 9.00 — 1.19 E-09Rv0081 9 Global regulator in hypoxia — 1.10 — 0.014Rv0243 fadA2 1 Lipid degradation — 1.60 — 9.87 E-05Rv0569 10 — 3.07 — 0.90 E-14Rv0570 nrdZ 2 Ribonucleoside-diphosphate reductase — 2.67 — 0.004Rv1436 gap 7 1.15 — 0.028 —Rv1652 argC 7 Arginine biosynthesis — 3.00 — 8.33 E-05Rv1733c 3 Unknown; probable conserved transmembrane
protein2.77 1.50 2.62 E-08 0.012
Rv1738 10 — 1.15 — 0.90 E-14Rv1813c 10 3.53 — 1.09 E-12 —Rv1996 0 Unknown; universal stress family protein 1.93 1.19 1.09 E-12 6.27 E-06Rv2005c 0 Unknown; universal stress family protein — 6.50 — 3.15 E-13Rv2007c fdxA 7 Ferredoxin FdxA — 2,18 — 1.09 E-12Rv2030c 10 — 5.25 — 3.88 E-10Rv2031c hspX 0 Stress protein induced in hypoxia — 6.05 — 0.90 E-14Rv2623 TB31.7 0 Unknown; universal stress family protein — 3.08 — 0.90 E-14Rv2625c 3 Unknown; probable conserved transmembrane
protein— 3.20 — 1.44 E-06
Rv2626c hrp-1 10 — 4.67 — 0.90 E-14Rv2627c 10 — 2.43 — 2.96 E-06Rv2628 10 — 1.40 — 1.18 E-05Rv2629 10 — 1.13 — 4.16 E-08Rv3127 10 — 1.33 — 0.003Rv3130c tgs-1 1 TAG — 2.31 — 2.07 E-13Rv3131 10 Unknown; putative NAD(P)H nitroreductase 2.89 4.00 1.09 E-12 9.04 E-13Rv3133c devR 9 Regulator part of the Dos TCSe — 2.60 — 6.54 E-05Rv3134c 0 Unknown; universal stress protein family 1.03 3.43 5.99 E-06 3.19 E-10a Functional categories based on http://www.tuberculist.epfl.ch: 0, virulence, detoxification, and adaptation; 1, lipid metabolism; 2, information pathways; 3, cell wall and cell pro-cesses; 7, intermediary metabolism and respiration; 9, regulatory proteins; 10, conserved hypothetical proteins.b RPKM ratio according to phase of growth: exponential (FE/DE) or stationary (FS/DS). See Table S1A and B in the supplemental material for the complete set of data. The gene isoverexpressed in FE or FS if the ratio is above 1.c Determined by Fisher exact test, in which statistically significant differential expression between two conditions was determined by looking at genes with FDRs of �0.05 (seeMaterials and Methods for details).d —, gene with a ratio of �1 or with no significantly increased expression under those conditions.e TCS, two-component regulatory system.
Rodríguez et al.
4 ® mbio.asm.org May/June 2014 Volume 5 Issue 3 e01125-14
m
bio.asm.org
on June 6, 2018 - Published by
mbio.asm
.orgD
ownloaded from

mant stage of M. tuberculosis. It is noteworthy that growth in LC-FAs and growth under hypoxia conditions shared more genes be-longing to the DosR regulon than either condition compared togrowth during starvation (see Fig. S4A). Interestingly, one of theLC-FAs used was palmitate, a fatty acid present in the culturemedium used in one of the classical in vitro models of persistence(41).
Because of the suggested involvement of reductive stress in thegrowth of M. tuberculosis in a lipid-enriched medium, we soughtto identify genes related to reductive stress in the same hypoxiaand starvation data set used for the above analysis (40). Of the 371genes associated with reductive stress in the M. tuberculosis ge-nome (http://www.tuberculist.epfl.ch), we excluded genes be-longing to the functional category of “lipid metabolism” to avoidbias toward the fatty acid model. We compared the remaining 216genes with the 206 highest-scoring genes for all three data sets (seeFig. S4B). The number of genes related to reductive stress identi-fied in each case was different, with the highest represented byLC-FA (24/206 genes, 11.1%), followed by hypoxia (14/206 genes,6.5%), and the lowest represented by starvation (7/206 genes,3.2%). The differences among percentages were close to signifi-cant between hypoxia and LC-FA and clearly significant betweenstarvation and LC-FA (see Fig. S4B). Recently, it has been shownthat reductive stress could play a role during long-term mycobac-terial infection and that lipids could be stakeholders in this process
(37). Our results also indicate that growth in LC-FAs might be amore suitable in vitro model to better test the putative involve-ment of reductive stress during the long-term infection of M. tu-berculosis.
Genes involved in the adaptation of M. tuberculosis to a lipidenvironment. The global analysis of the M. tuberculosis transcrip-tome showed increased expression of genes involved in variousmetabolic processes and identified specific genes that provide in-sight into cellular adaptation during growth with fatty acids as thesole carbon sources (Fig. 2; see Table S1E and F). Searching for aset of genes related to the pathways used by M. tuberculosis toadapt to a lipid environment, we identified 14 genes that had sig-nificantly increased expression in FE and FS than in DE and DS,respectively (Table 4) (42, 43). These genes therefore character-ized the adaptation of the bacilli to growth in LC-FA medium andthus provide a lipid signature for M. tuberculosis; this overexpres-sion was confirmed by quantitative reverse transcription (qRT)-PCR (see Fig. S5).
Several of these lipid signature genes are involved in cellularintermediary metabolism. This includes the genes pckA and icl,indicating that bacteria are actively using the glyoxylate shunt,consistent with the central role of these enzymes in M. tuberculosislipid metabolism (13, 32). The gene pckA is required for growth infatty acids, and mutants defective in pckA are attenuated in bothmacrophage and mouse infections (32). Moreover, icl and pckA
TABLE 3 Genes with significantly increased expression and their putative relation to reductive stress
Gene tagGenename
Growthphase
Functionalcategoryb Function
Putative influenceon reductive stressc
RPKMratiod P valuee
Rv0243a fadA2 FS 1 Lipid degradation 1.60 9.87 E-05Rv0570a nrdZ FS 2 Ribonucleoside-diphosphate reductase NADH/NADPH 2.67 0.004Rv0694 lldD1 FE 7 L-Lactate dehydrogenase 1.09 0.029Rv0697 FE 7 Unknown; probable dehydrogenase 4.33 0.001Rv1180 pks-3 FE 1 Probable polyketide synthase Polymer deposition 3.20 5.9 E-04Rv1436a gap FE 7 Probable GADPHf NADH 1.15 0.028Rv1652a argC FS 7 Arginine biosynthesis NADH/NADPH 3.00 8.33 E-05Rv1908c katG FE 0 Catalase/peroxidase 1.57 0.004Rv2382c mbtC FE 1 Polyketide synthase Polymer deposition 4.00 0.032Rv2590 fadD9 FE 1 Lipid degradation NADH/NADPH 3.71 5.68 E-07Rv2781 FE 7 Oxidoreductase 3.80 1.94 E-10Rv2794c pptT FE 1 4=-Phosphopantetheinyl transferase Polymer deposition 1.18 0.041
FS 3.00 8.33 E-05Rv2931 ppsA FS 1 PDIM biosynthesis Polymer deposition 2.00 0.041Rv2995c leuB FS 7 Leucine synthesis NADH/NADPH 2.60 6.54 E-05Rv2996c serA1 FS 7 L-Serine synthesis NADH/NADPH 3.00 0.019Rv3130ca tgs-1 FS 1 TAG synthase Polymer deposition 2.31 2.07 E-13Rv3131a FE 10 Unknown Reductant collector 2.89 1.09 E-12
FS Putative NAD(P)H nitroreductase 4.00 9.04 E-13Rv3145 nuoA FE 7 Probable NADH-dehydrogenase Reductant collector 1.03 0.008Rv3229c desA3 FE 1 Lipid desaturase Polymer deposition 3.80 1.09 E-12Rv3230 FE 7 Oxidoreductase 1.32 0.006Rv3371 FS 1 TAG synthesis Polymer deposition 2.00 0.041Rv3825c pks-2 FE 1 Probable polyketide synthase Polymer deposition 1.27 1.34 E-04a Member of the DosR regulon.b Functional categories based on http://www.tuberculist.epfl.ch: 0, virulence, detoxification, and adaptation; 1, lipid metabolism; 2, information pathways; 7, intermediary metabo-lism and respiration; 10, conserved hypothetical proteins.c RPKM ratio according to phase of growth: exponential (FE/DE) or stationary (FS/DS). The gene is overexpressed in FE or FS if the ratio is �1. See Table S1A and B in thesupplemental material for the complete set of data.d Arrows indicate the putative contributions of genes to the increase (up arrow) or decrease (down arrow) in reductive equivalents. Absence of an arrow indicates a gene that couldcontribute to both an increase and a decrease in reductive equivalents, for example, an oxidoreductase-encoding gene.e Determined by Fisher exact test, in which statistically significant differential expression between two conditions was determined by looking at genes with FDRs of �0.05 (seeMaterials and Methods for details).f GAPDH, glyceraldehyde 3-phosphate dehydrogenase.
RNA-seq of M. tuberculosis in a Fatty Acid Environment
May/June 2014 Volume 5 Issue 3 e01125-14 ® mbio.asm.org 5
m
bio.asm.org
on June 6, 2018 - Published by
mbio.asm
.orgD
ownloaded from
are also upregulated in nongrowing bacilli in murine models (13,15).
Two lipid signature genes belong to the functional category of“lipid metabolism” (http://www.tuberculist.epfl.ch): Rv1184,which codes for an exported protein that is able to perform lipiddegradation and pptT, which encodes a phosphopantetheinyltransferase that activates the polyketide synthases (44). Two addi-tional genes are related to membrane activity allegedly involved ineither the transport of metabolites (Rv1733) or associated with theESX-1 secretion system of M. tuberculosis (Rv3614c), the lattercoding for EspD.
WhiB3 was the single transcriptional regulator detected as partof the signature. This heme-based sensor, which is associated withintracellular redox balance, links environmental signaling withcellular metabolism (34). Interestingly, five of the members of thelipid signature belong to the DosR hypoxia regulon. This suggeststhat induction of the DosR transcriptional regulator could resultfrom cotranscription from the upstream Rv3134c gene (45, 46),which is part of the lipid signature. The Rv3134c gene harbors ausp domain, as does another gene of the lipid signature, Rv1996.One of the DosR-regulated genes, Rv0079c, has recently been re-ported as a dormancy-associated translation inhibitor (DATIN)
that inhibits in vitro protein synthesis. Overexpression of a recom-binant DATIN in Escherichia coli and in Mycobacterium bovis BCGdecreased the growth rate of these microorganisms (42). Wetherefore suggest that the overexpression of this gene in both theexponential and stationary phases could be the responsible for theobserved slower growth of M. tuberculosis in LC-FA (see Fig. S1 inthe supplemental material). Many of the genes included in thelipid signature are of unknown function, showing our scarceknowledge of how M. tuberculosis adapts to a lipid-enriched con-dition. One of these genes, Rv1733c, codes for a hypothetical pro-tein reported to be induced by hypoxia and starvation (5).
To investigate whether these genes could be coregulated at thetranscriptional level, we searched for a possible consensus motif500 nucleotides (nt) upstream of each open reading frame (ORF)(47). We identified a DNA motif in 12 of the 14 genes analyzed(Fig. 4). The probability that this motif could be present in thesegenes by chance was 1E-07, thus suggesting a biological functionof the motif in genes of the lipid signature. Interestingly, the motifwas not found upstream of whiB3, opening the possibility that thisgene product could be involved in transcriptional regulation ofthe lipid signature genes. The identification of an antisense tran-script of the whiB3 gene in DS (Fig. 4B.2) strongly suggests the
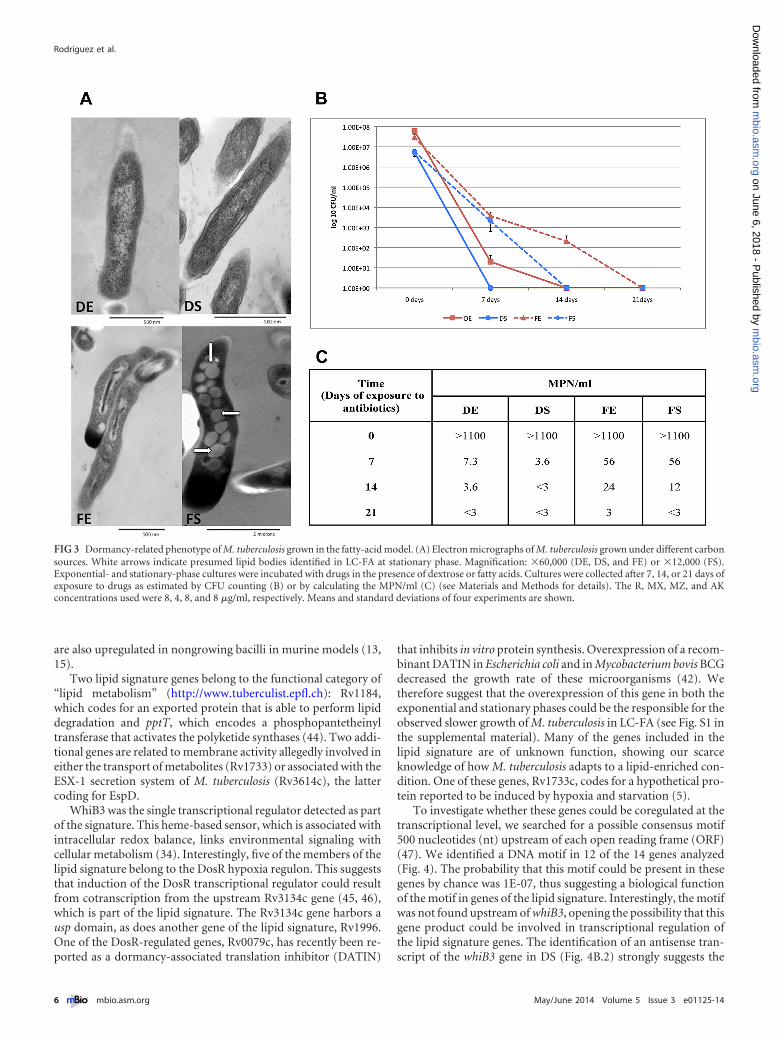
FIG 3 Dormancy-related phenotype of M. tuberculosis grown in the fatty-acid model. (A) Electron micrographs of M. tuberculosis grown under different carbonsources. White arrows indicate presumed lipid bodies identified in LC-FA at stationary phase. Magnification: �60,000 (DE, DS, and FE) or �12,000 (FS).Exponential- and stationary-phase cultures were incubated with drugs in the presence of dextrose or fatty acids. Cultures were collected after 7, 14, or 21 days ofexposure to drugs as estimated by CFU counting (B) or by calculating the MPN/ml (C) (see Materials and Methods for details). The R, MX, MZ, and AKconcentrations used were 8, 4, 8, and 8 �g/ml, respectively. Means and standard deviations of four experiments are shown.
Rodríguez et al.
6 ® mbio.asm.org May/June 2014 Volume 5 Issue 3 e01125-14
m
bio.asm.org
on June 6, 2018 - Published by
mbio.asm
.orgD
ownloaded from

involvement of noncoding RNA in whiB3 gene regulation underlipid-enriched conditions.
To assess the relevance of these genes for M. tuberculosisgrowth, we next compared this list with previously reported stud-ies aimed at identifying essential genes. Interestingly, none of the14 lipid signature genes were found to contain IS6110 insertions inthe in vivo survey of 533 isolates worldwide, with the exception ofRv1733, which had an IS6110 insertion in 2 of the 533 isolatesanalyzed (48). In contrast, 10 of the 14 genes are considered non-essential for in vitro M. tuberculosis growth, based on transposonmutagenesis (49). These data support our proposal that theLC-FA model could be more closely related to the conditions thatthe bacilli confront in vivo during TB infection.
Final remarks. On the basis of the results presented here, wepropose the following scenario for M. tuberculosis growing oneven-length LC-FAs (Fig. 5). Lipids surrounding the bacilli, TAGor LC-FAs, are hydrolyzed by lipases (such as Rv1184) and theninternalized through receptors (Rv1733c). The lipids are subse-quently converted to acetyl-CoA by �-oxidation and consumedby the glyoxylate cycle (Icl1). At this point, PckA can regeneratephosphoenolpyruvate to continue the cycle. As a consequence,both CO2 and the reducing equivalents NADH and NADPH in-crease and are sensed by the DosR, Rv0081, and WhiB3 transcrip-tional regulators. These and probably other stress conditions in-duce the expression of genes such as pptT, pks-2, pks-3, and tgs-1,which are responsible for the synthesis of complex lipids that bal-ance the redox state of the cell by polymer deposition. The detec-
tion of espD suggests secretion, possibly of toxic compounds. Onthe other hand, several genes of the DosR regulon are induced:stress proteins (Rv1996, and Rv3134c, which are cotranscribedwith dosR) and other reductive sinks (Rv3131), inhibitors of pro-tein synthesis (Rv0079), and heme stabilization proteins (fdxA).Proteins required for porphyrin synthesis (HemA and HemC) arealso induced (see Table S4B). Finally, the high expression oftRNAs could modify membrane properties, resulting in toleranceto environmental stresses and antibiotics. We propose that whenM. tuberculosis grows on LC-FAs as sole carbon sources, the cellschange their gene expression profile by inducing genes requiredfor stress protection, as well as genes required for its survival dur-ing long-term infection. Our results therefore provide insight intothe physiological responses of tubercle bacilli when grown in alipid-rich environment, a poorly studied aspect of TB infection.
Studying the metabolic activity of M. tuberculosis during latentinfection is not an easy task (50). TB was recently described as acontinuum, from active disease to latent infection, and the accu-mulation of data indicates that latency might not be considered asingle condition either (50). Although it is still unclear, it appearsthat dormant bacilli include cells with different metabolic activi-ties, from slowly growing to nondividing stages that vary in termsof redox balance and require responses to oxidative stress or re-ductive stress, balanced by the cooperation of main regulators,such as WhiB3, DosR, and the recently identified Rv0081 (6). Thedevelopment of new drugs against dormant bacilli has been diffi-cult probably because of our poor knowledge of real metabolic
TABLE 4 Lipid signature of M. tuberculosis grown in the fatty acid model
Gene tagGenename
Functionalcategoryb Function (reference)
RPKM ratioc P valued
FE/DE FS/DS FE vs DE FS vs DS
Rv0079a 10 Unknown; probable transductionregulatory protein (42)
1.59 2.10 01.09 E-12 3.37 E-07
Rv0211 pckA 7 Phosphoenolpyruvate carboxykinase 1.03 1.83 0.021 4.03 E-14Rv0467 icl-1 7 Isocitrate lyase 3.88 1.52 1.58 E-08 3.89 E-09Rv1066 10 Unknown; rhodanase like domaine 2.11 4.10 1.28 E-07 9.04 E-13Rv1184c 3 Unknown; possible exported
protein, probable lipase, esteraseor quitinase (43)
4.80 5.00 3.69 E-07 0.024
Rv1733ca 3 Unknown; probable conservedtransmembrane protein
2.77 1.50 2.62 E-08 0.012
Rv1996a 0 Unknown; universal stress proteinfamily
1.93 1.19 1.09 E-12 6.27 E-06
Rv2794c pptT 1 4=-Phosphopantetheinyl transferase 1.18 3.00 0.041 8.33 E-05Rv3131a 10 Unknown; putative NAD(P)H
nitroreductase2.89 4.00 1.09 E-12 9.04 E-13
Rv3134ca 10 Unknown; universal stress proteinfamily
1.03 3.43 5.99 E-06 3.19 E-10
Rv3416 whiB3 9 Redox sensor; transcriptionalregulatory protein
2.50 1.09 0.003 0.009
Rv3612c 10 Unknown 2.00 1.10 0.029 0.014Rv3614c espD 3 Unknown; ESX-1 secretion
associated protein2.81 1.50 1.09 E-12 9.04 E-13
Rv3686c 10 Unknown 1.82 3.00 1.60 E-08 3.26 E-07a Member of the DosR regulon.b Functional categories based on http://www.tuberculist.epfl.ch: 0, virulence, detoxification, and adaptation; 1, lipid metabolism; 3, cell wall and cell processes; 7, intermediary me-tabolism and respiration; 9, regulatory proteins; 10, conserved hypothetical proteins.c RPKM ratio according to phase of growth: exponential (FE/DE) or stationary (FS/DS). The gene is overexpressed in FE or FS if the ratio is �1. See Table S1A and B in thesupplemental material for the complete set of data.d Determined by Fisher exact test, in which statistically significant differential expression between two conditions was determined by looking at genes with FDRs of �0.05 (seeMaterials and Methods for details).e http://genome.tbdb.org, accessed December 2012.
RNA-seq of M. tuberculosis in a Fatty Acid Environment
May/June 2014 Volume 5 Issue 3 e01125-14 ® mbio.asm.org 7
m
bio.asm.org
on June 6, 2018 - Published by
mbio.asm
.orgD
ownloaded from

activity of M. tuberculosis during the complex period of latency.The data derived from the use of the LC-FA in vitro model repre-
sent a novel tool suitable for the study of the susceptibility ofM. tuberculosis to drugs during latency from a new perspective.
FIG 4 Features of lipid signature genes. (A) Sequence logo of the lipid signature motif. The nucleotide sequence was determined by performing Gibbs samplingof the 500 bp upstream of the initiation codon of the lipid signature genes (see Materials and Methods for details). In the representation of the consensus sequenceshown in the graph, the height of each nucleotide indicates the level of conservation. (B) Differential transcription of the whiB3 gene. Artemis view of the readsmapped to the whiB3 gene under the conditions tested. The blue arrow indicates the orientation of whiB3 transcription. (B.1) Exponential phase: red, dextrose;purple, LC-FA. (B.2) Stationary phase: green, dextrose; blue, LC-FA. Antisense transcription is identified in the stationary phase of growth in dextrose.
FIG 5 Proposed scenario of M. tuberculosis growth in the fatty acid model. Growth of M. tuberculosis during the in vitro model of even-LC-FA is shown. See thetext (final remarks) for details.
Rodríguez et al.
8 ® mbio.asm.org May/June 2014 Volume 5 Issue 3 e01125-14
m
bio.asm.org
on June 6, 2018 - Published by
mbio.asm
.orgD
ownloaded from

In summary, our results show a new scenario for the adapta-tion of M. tuberculosis to a lipid-rich environment, presentingevidence of the role of reductive stress and giving insights into theparticipation of novel molecules such as noncoding RNAs andtRNAs. These could play important roles in the adaptation of thebacteria for long-term survival. During the coevolution of the hu-man host and the tubercle bacilli, these adaptations have probablybeen crucial for bacterial survival and the establishment of a bal-anced coexistence, represented by a successful infection withoutdisease, which we know as latent TB.
MATERIALS AND METHODSBacterial strain and culture conditions. M. tuberculosis H37Rv (donatedby The Pasteur Institute, Paris, France) was grown at 37°C in 100 ml ofDubos broth (Difco) supplemented with 10% ADC (Middlebrook) in a1-liter flask to an optical density at 600 nm (OD600) of 0.5. The culture wasdivided in two, and cells were pelleted by centrifugation and resuspendedin (i) Dubos broth base (without glycerol) (BD Difco) containing 0.5%albumin (Sigma Fraction V, fatty acid free) and supplemented with amixture of 0.003% FA with even an number of carbon atoms (0.001%each oleic [18 carbon atoms], palmitic [16 carbon atoms], and stearic [18carbon atoms] acids) or (ii) Dubos medium with 0.5% albumin– 0.75%dextrose– 0.04% catalase (ADC enrichment). Cultures were grown withagitation at 200 rpm at 37°C, and growth was monitored by measuring theOD600.
RNA isolation. Total RNA was isolated from cultures in the exponen-tial and stationary phases as previously described (51). Basically, cultureswere harvested by centrifugation and pellets were resuspended in guani-dinium chloride buffer (6 M guanidinium chloride, 0.1% Tween 80,1 mM 2-mercaptoethanol, 10 mM EDTA) in a proportion of 1 ml ofbuffer/100 ml of culture. Cells were lysed mechanically in a FastPrep(Thermo Scientific) with 150- to 200-�m glass beads (Sigma-Aldrich) byperforming four lysis cycles of 15 s each at high speed (6.5 m/s). Nucleicacids were purified with phenol-chloroform-isoamyl alcohol (25:24:1),and RNA was differentially precipitated with 0.4 volume of absolute eth-anol (added drop by drop). Finally, RNA was washed three times withTrizol reagent (Invitrogen). RNA integrity was analyzed with a bioana-lyzer (Agilent Technologies) and quantified by spectrophotometry withthe NanoDrop ND-1000 (Thermo Scientific).
Library preparation and sequencing. Strand-specific RNA-seq li-braries were prepared in accordance with the protocol described by Wald-bauer and coworkers (52). Briefly, The DNase-treated RNA (100 ng) wasfragmented by divalent-cation hydrolysis (Fragmentation Buffer; Am-bion, Austin, TX) at 70°C for 12 min to yield fragment sizes between 50and 300 nt. After precipitation with ethanol, fragments were subjected topoly(A) tailing and end repairing (NEB Reagents). RNA was treated withAntarctic phosphatase (New England Biolabs) and then phosphorylatedat the 5= RNA end with T4 polynucleotide kinase. The transcribing strandwas labeled by ligation of a 5= hybrid DNA-RNA primer and after purifi-cation with RNA clean XP beads (Beckman Coulter Genomics), the first-strand cDNA synthesis reaction was carried out with SuperScript II re-verse transcriptase (Invitrogen) and Illumina’s poly(T) primer anddeoxynucleoside triphosphates (20 mM). Reaction components were re-moved with Agencourt AMPure XP SPRI beads (Beckman), and primarytranscripts were enriched with Pfu Hi Fidelity polymerase (Invitrogen)and the Illumina spacers as primers. Illumina adaptors and bar codes wereligated by PCR in accordance with the manufacturer’s instructions. Li-braries were purified with SPRI beads (Beckman) and quantified with aNanoDrop (Bio-Rad). Sequencing was performed with the Illumina tech-nology at Ambry Genetics.
RNA-seq data analysis. Sequence reads were processed to removepoly(A) and spacer sequences, and only those with quality scores of �30(Illumina 1.3�) and a minimal length of 50 bases were used for analysis.Assessment of read quality was done with the FASTX toolkit v. 0.0.13(http://hannonlab.cshl.edu/fastx_toolkit/index.html). The reads were
mapped against the M. tuberculosis H37Rv reference genome (accessionno. NC000962.2) with Bow tie v. 0.12.7 (53) and visualized with the Ar-temis sequence visualization and annotation tool (54). Reads that mappedto more than one site where excluded. For the analysis, only those readsfor which 50% of the sequence length fell within the annotated ORF wereconsidered part of the ORF. For the identification of novel expressed IGRsin the transcriptome, clean reads were analyzed with an in-house algo-rithm that identifies genomic regions with a minimum depth of 10 readsand a minimum length of 50 nt. These zones were then annotated bycomparison with the reference genome, with annotation coming fromliterature and the TubercuList database (http://www.tuberculist.epfl.ch).For example, transcripts are annotated as novel intergenic if they showexpression according to the criteria mentioned and they do not overlapany previously annotated feature in the genome.
Measurement of drug activity. The activity of a drug mixture contain-ing rifampin (R), moxifloxacin (MX), metronidazole (MZ) and amikacin(AK) against exponential- and stationary-phase cultures of M. tuberculosisgrown in dextrose or FA medium was tested. R, MZ, and AK were pur-chased from Sigma Chemicals (United States); MX was obtained fromBayer (Mexico). R was dissolved in ethanol; MZ, AK, and MX were dis-solved in distilled water. To determine drug activity, 4- to 6-day-old(exponential-phase) cultures and 15-day-old (stationary-phase) cultures(containing at least 1 � 106 CFU/ml) were incubated with the drug com-bination for 0, 7, 14, or 21 days; R, MX, MZ, and AK were used at theirmaximum drug concentration in serum at 8, 4, 8, and 8 �g/ml, respec-tively (39). After incubation, culture CFU counts per milliliter were de-termined by plating appropriate dilutions as described previously (55). Inparallel, 1 ml of each culture was taken to perform 10�1 to 10�3 dilutionswith Dubos broth. One milliliter of every dilution was transferred to eachof three tubes containing 9 ml of Dubos broth with or without the fattyacid mixture, accordingly. These broth cultures were examined for visibleturbidity every 7 days over a 3-week period of incubation at 37°C. Themost probable number (MPN) of viable bacilli was then estimated whiletaking in account the patterns of positive and negative tubes (http://www.fda.gov/food/foodscienceresearch/laboratorymethods/ucm109656.htm;accessed January 2013). Plating of different culture samples on blood agarmedium showed the absence of bacteria other than mycobacteria. Growthof M. tuberculosis in turbid tubes was confirmed by Ziehl-Neelsen stainingand colonial morphology on Middlebrook 7H11
Analysis of the upstream regions of the genes belonged to the lipidsignature. For each gene, 500 nt were taken upstream of the initiationcodon. These regions were fed into the Gibbs sampling algorithm, and thesequences were analyzed to detect any possible bias in their composition.This was done by means of the program “unifiedcpp.” Once corrected forpossible bias, the samples were run with the following parameters: k-mer,12 to 24 nt; -n, for nucleic acid alphabet; -E 3, maximum number of sitesto find; -S 20, number of seeds to try; -i 1,000, number of iterations. Theprobability of the motif arising by chance was determined by means of thehypergeometric distribution (56). For this, the number of genes in whichthe motif was present in the 500-nt upstream region in H37Rv was calcu-lated. It turned out that 767 of the 4,060 genes had the motif (this is thepopulation distribution), so we wanted to calculate the probability ofdrawing 12 out of 14 genes given the population distribution (767/4,060).
qRT-PCR of selected genes. The total transcripts of selected geneswere measured by real-time qRT-PCR. Quantification was performedwith gene-specific primers (see Table S5) and SYBR green (MolecularProbes, Inc.). Samples were subjected to 40 cycles of amplification (dena-turation at 95°C for 30 s, specific annealing temperature for 15 s, andextension at 72°C for 15 s) with a final extension at 72°C for 5 min. Toensure that the fluorescence levels detected were due to the amplificationof a specific product, a melting curve analysis was performed. Absoluteanalysis was carried out. To do this, a standard curve was obtained for eachset of primers by using 10-fold dilutions of known amounts of M. tuber-culosis H37RV chromosomal DNA (1,000, 10,000, 100,000, and 1,000,000theoretical copies). Threshold cycle values of each RNA quantitation were
RNA-seq of M. tuberculosis in a Fatty Acid Environment
May/June 2014 Volume 5 Issue 3 e01125-14 ® mbio.asm.org 9
m
bio.asm.org
on June 6, 2018 - Published by
mbio.asm
.orgD
ownloaded from

interpolated to standard curve to obtain gene expression (number of genecopies per microliter). Normalization of these data was performed byusing 16S rRNA expression levels.
Transmission electron microscopy. Cells were harvested by centrif-ugation at 16,000 � g, washed in sterile phosphate-buffered saline (PBS),and fixed in 2.5% (vol/vol) glutaraldehyde– 0.1 M sodium phosphate for1 h. Cells were recovered and resuspended in 1% (wt/vol) osmium tetrox-ide for 1 h. Cells were then dehydrated through treatment with a series ofethanol solutions (30, 40, 50, 60, 70, 80, and 90%); each treatment wasperformed twice for 10 min each time. A final dehydration step was donetwice with 100% ethanol for 15 min. Samples were embedded in EPON812 resin (EMS). This resin was polymerized at 60°C for 24 h. Resin blockswere cut in a Leica Ultracut UCT Ultratome to a 70-nm thickness, placedon 200-mesh copper grids (EMS), and stained with 30% (wt/vol) uranylacetate–70% (vol/vol) methanol and counterstained with Reynolds leadcitrate buffer. Samples were examined with a JEOL JEM-1010 transmis-sion electron microscope with an acceleration voltage of 60 kV.
Statistical analysis. Statistical analysis for differential gene expressionwas evaluated by using RPKMs as expression values and Fisher’s exact teston a two-by-two contingency table (57) on a per-gene basis in which thetwo columns of the table were separated by reads that overlap the gene’sORF and reads that do not overlap the ORF, and the two rows wereseparated by the two compared samples (FE versus DE or FS versus DS).Significant differences were determined with Fisher’s exact test with theadditional criteria of a false-discovery rate (FDR) of �5%. The resultswere consistent with those obtained with the DEGseq package for biolog-ical replicates (58).
Nucleotide sequence accession number. The RNA-seq data sets havebeen deposited in the NCBI Gene Expression Omnibus (59) under acces-sion number GSE47863.
SUPPLEMENTAL MATERIALSupplemental material for this article may be found at http://mbio.asm.org/lookup/suppl/doi:10.1128/mBio.01125-14/-/DCSupplemental.
Figure S1, JPG file, 0.2 MB.Figure S2, JPG file, 0.5 MB.Figure S3, JPG file, 1.4 MB.Figure S4, JPG file, 0.4 MB.Figure S5, JPG file, 0.2 MB.Table S1, PDF file, 1.7 MB.Table S2, PDF file, 0.2 MB.Table S3, PDF file, 0.1 MB.Table S4, PDF file, 0.1 MB.Table S5, PDF file, 0.1 MB.
ACKNOWLEDGMENTS
We thank Robert A. Cox for his helpful advice and comments and JuanCarlos Palomino for his critical reading of the manuscript. We are alsograteful to Liliana López, Department of Statistic of the Universidad Na-cional de Colombia for her contribution with statistical analysis. Wethank Oliver Ornelas-Lopez and Esther Ramirez-Espindola, from the Mi-croscopy Unit of ENCB, IPN, for their help with electron microscopy. Wethank Miguel Bernabe for his assistance in figure preparation.
This work was supported by the StopLatent-TB Collaborative Project,which is supported by the European Commission under the Health Co-operation Work Programme of the 7th Framework Programme (GA no.200999); International Cooperation UAM-Banco Santander and LatinAmerica (Centro de Estudios de America Latina, CEAL), UAM, Spain;and the Colombian Agency to Support Science and Technology, COL-CIENCIAS (GA no. 439-2012). This work was partially supported bygrants 156347 and 169063, CONACYT, Mexico, and SIP 20130951 and20131271, IPN, Mexico. J. González-y-Merchand and C. Helguera-Repetto are fellows of COFAA and EDI, IPN, Mexico.
REFERENCES1. Dye C, Scheele S, Dolin P, Pathania V, Raviglione MC. 1999. Consensus
statement. Global burden of tuberculosis: estimated incidence, preva-
lence, and mortality by country. WHO Global Surveillance and Monitor-ing Project. JAMA 282:677– 686.
2. Gengenbacher M, Kaufmann SH. 2012. Mycobacterium tuberculosis: suc-cess through dormancy. FEMS Microbiol. Rev. 36:514 –532. http://dx.doi.org/10.1111/j.1574-6976.2012.00331.x.
3. Gonzalo-Asensio J, Mostowy S, Harders-Westerveen J, Huygen K,Hernández-Pando R, Thole J, Behr M, Gicquel B, Martín C. 2008.PhoP: a missing piece in the intricate puzzle of Mycobacterium tuberculosisviru lence . PLoS One 3:e3496 . ht tp : / /dx .doi .org/10 .1371/journal.pone.0003496.
4. Kendall SL, Withers M, Soffair CN, Moreland NJ, Gurcha S, Sidders B,Frita R, Ten Bokum A, Besra GS, Lott JS, Stoker NG. 2007. A highlyconserved transcriptional repressor controls a large regulon involved inlipid degradation in Mycobacterium smegmatis and Mycobacterium tuber-culosis. Mol. Microbiol. 65:684 – 699. http://dx.doi.org/10.1111/j.1365-2958.2007.05827.x.
5. Voskuil MI, Visconti KC, Schoolnik GK. 2004. Mycobacterium tubercu-losis gene expression during adaptation to stationary phase and low-oxygen dormancy. Tuberculosis (Edinb) 84:218 –227. http://dx.doi.org/10.1016/j.tube.2004.02.003.
6. Galagan JE, Minch K, Peterson M, Lyubetskaya A, Azizi E, Sweet L,Gomes A, Rustad T, Dolganov G, Glotova I, Abeel T, Mahwinney C,Kennedy AD, Allard R, Brabant W, Krueger A, Jaini S, Honda B, YuWH, Hickey MJ, Zucker J, Garay C, Weiner B, Sisk P, Stolte C, WinklerJK, Van de Peer Y, Iazzetti P, Camacho D, Dreyfuss J, Liu Y, Dorhoi A,Mollenkopf HJ, Drogaris P, Lamontagne J, Zhou Y, Piquenot J, ParkST, Raman S, Kaufmann SH, Mohney RP, Chelsky D, Moody DB,Sherman DR, Schoolnik GK. 2013. The Mycobacterium tuberculosis reg-ulatory network and hypoxia. Nature 499:178 –183. http://dx.doi.org/10.1038/nature12337.
7. Arnvig KB, Comas I, Thomson NR, Houghton J, Boshoff HI, CroucherNJ, Rose G, Perkins TT, Parkhill J, Dougan G, Young DB. 2011.Sequence-based analysis uncovers an abundance of non-coding RNA inthe total transcriptome of Mycobacterium tuberculosis. PLoS Pathog.7:e1002342. http://dx.doi.org/10.1371/journal.ppat.1002342.
8. Miotto P, Forti F, Ambrosi A, Pellin D, Veiga DF, Balazsi G, GennaroML, Di Serio C, Ghisotti D, Cirillo DM. 2012. Genome-wide discoveryof small RNAs in Mycobacterium tuberculosis. PLoS One 7:e51950. http://dx.doi.org/10.1371/journal.pone.0051950.
9. Peyron P, Vaubourgeix J, Poquet Y, Levillain F, Botanch C, Bardou F,Daffé M, Emile JF, Marchou B, Cardona PJ, de Chastellier C, Altare F.2008. Foamy macrophages from tuberculous patients’ granulomas consti-tute a nutrient-rich reservoir for M. tuberculosis persistence. PLoS Pathog.4:e1000204. http://dx.doi.org/10.1371/journal.ppat.1000204.
10. Daniel J, Maamar H, Deb C, Sirakova TD, Kolattukudy PE. 2011.Mycobacterium tuberculosis uses host triacylglycerol to accumulate lipiddroplets and acquires a dormancy-like phenotype in lipid-loaded macro-phages. PLoS Pathog. 7:e1002093. http://dx.doi.org/10.1371/journal.ppat.1002093.
11. Gill WP, Harik NS, Whiddon MR, Liao RP, Mittler JE, Sherman DR.2009. A replication clock for Mycobacterium tuberculosis. Nat. Med. 15:211–214. http://dx.doi.org/10.1038/nm.1915.
12. Cubero N, Esteban J, Palenque E, Rosell A, Garcia MJ. 2013. Evaluationof the detection of Mycobacterium tuberculosis with metabolic activity inculture-negative human clinical samples. Clin. Microbiol. Infect. 19:273–278. http://dx.doi.org/10.1111/j.1469-0691.2012.03779.x.
13. Muñoz-Elías EJ, McKinney JD. 2005. Mycobacterium tuberculosis isocit-rate lyases 1 and 2 are jointly required for in vivo growth and virulence.Nat. Med. 11:638 – 644. http://dx.doi.org/10.1038/nm1252.
14. Ouellet H, Johnston JB, de Montellano PR. 2011. Cholesterol catabolismas a therapeutic target in Mycobacterium tuberculosis. Trends Microbiol.19:530 –539. http://dx.doi.org/10.1016/j.tim.2011.07.009.
15. Schnappinger D, Ehrt S, Voskuil MI, Liu Y, Mangan JA, Monahan IM,Dolganov G, Efron B, Butcher PD, Nathan C, Schoolnik GK. 2003.Transcriptional adaptation of Mycobacterium tuberculosis withinmacrophages: insights into the phagosomal environment. J. Exp. Med.198:693–704. http://dx.doi.org/10.1084/jem.20030846.
16. Betts JC, Lukey PT, Robb LC, McAdam RA, Duncan K. 2002. Evalua-tion of a nutrient starvation model of Mycobacterium tuberculosis persis-tence by gene and protein expression profiling. Mol. Microbiol. 43:717–731. http://dx.doi.org/10.1046/j.1365-2958.2002.02779.x.
17. Deb C, Lee CM, Dubey VS, Daniel J, Abomoelak B, Sirakova TD, PawarS, Rogers L, Kolattukudy PE. 2009. A novel in vitro multiple-stress
Rodríguez et al.
10 ® mbio.asm.org May/June 2014 Volume 5 Issue 3 e01125-14
m
bio.asm.org
on June 6, 2018 - Published by
mbio.asm
.orgD
ownloaded from

dormancy model for Mycobacterium tuberculosis generates a lipid-loaded,drug-tolerant, dormant pathogen. PLoS One 4:e6077. http://dx.doi.org/10.1371/journal.pone.0006077.
18. Voskuil MI, Schnappinger D, Visconti KC, Harrell MI, Dolganov GM,Sherman DR, Schoolnik GK. 2003. Inhibition of respiration by nitricoxide induces a Mycobacterium tuberculosis dormancy program. J. Exp.Med. 198:705–713. http://dx.doi.org/10.1084/jem.20030205.
19. Lehninger A, Nelson D, Cox M. 2008. Lehninger principles of biochem-istry, 5th ed. W. H. Freeman, New York, NY.
20. Jackson SK, Stark JM, Taylor S, Harwood JL. 1989. Changes in phos-pholipid fatty acid composition and triacylglycerol content in mouse tis-sues after infection with bacille Calmette-Guérin. Br. J. Exp. Pathol. 70:435– 441.
21. Lee W, VanderVen BC, Fahey RJ, Russell DG. 2013. Intracellular My-cobacterium tuberculosis exploits host-derived fatty acids to limit meta-bolic stress. J. Biol. Chem. 288:6788 – 6800. http://dx.doi.org/10.1074/jbc.M112.445056.
22. Wang Z, Gerstein M, Snyder M. 2009. RNA-Seq: a revolutionary tool fortranscriptomics. Nat. Rev. Genet. 10:57– 63. http://dx.doi.org/10.1038/nrg2484.
23. Ehrt S, Schnappinger D. 2007. Mycobacterium tuberculosis virulence:lipids inside and out. Nat. Med. 13:284 –285. http://dx.doi.org/10.1038/nm0307-284.
24. Huber W, von Heydebreck A, Sueltmann H, Poustka A, Vingron M.2003. Parameter estimation for the calibration and variance stabilizationof microarray data. Stat. Appl. Genet. Mol. Biol. 2:Article3. http://dx.doi.org/10.2202/1544-6115.1008.
25. Cole ST, Brosch R, Parkhill J, Garnier T, Churcher C, Harris D, GordonSV, Eiglmeier K, Gas S, Barry CE III, Tekaia F, Badcock K, Basham D,Brown D, Chillingworth T, Connor R, Davies R, Devlin K, Feltwell T,Gentles S, Hamlin N, Holroyd S, Hornsby T, Jagels K, Krogh A,McLean J, Moule S, Murphy L, Oliver K, Osborne J, Quail MA,Rajandream MA, Rogers J, Rutter S, Seeger K, Skelton J, Squares R,Squares S, Sulston JE, Taylor K, Whitehead S, Barrell BG. 1998. Deci-phering the biology of Mycobacterium tuberculosis from the complete ge-nome sequence. Nature 393:537–544. http://dx.doi.org/10.1038/31159.
26. Roy H, Ibba M. 2008. RNA-dependent lipid remodeling by bacterialmultiple peptide resistance factors. Proc. Natl. Acad. Sci. U. S. A. 105:4667– 4672. http://dx.doi.org/10.1073/pnas.0800006105.
27. Maloney E, Stankowska D, Zhang J, Fol M, Cheng QJ, Lun S, BishaiWR, Rajagopalan M, Chatterjee D, Madiraju MV. 2009. The two-domain LysX protein of Mycobacterium tuberculosis is required for pro-duction of lysinylated phosphatidylglycerol and resistance to cationic an-timicrobial peptides. 5:e1000534. http://dx.doi.org/10.1371/journal.ppat.1000534. PLoS Pathog.
28. Francklyn CS, Minajigi A. 2010. tRNA as an active chemical scaffold fordiverse chemical transformations. FEBS Lett. 584:366 –375. http://dx.doi.org/10.1016/j.febslet.2009.11.045.
29. Ernst CM, Peschel A. 2011. Broad-spectrum antimicrobial peptide resis-tance by MprF-mediated aminoacylation and flipping of phospholipids.Mol. Microbiol. 80:290 –299. http://dx.doi.org/10.1111/j.1365-2958.2011.07576.x.
30. Flores J, Espitia C. 2003. Differential expression of PE and PE_PGRSgenes in Mycobacterium tuberculosis strains. Gene 318:75– 81. http://dx.doi.org/10.1016/S0378-1119(03)00751-0.
31. McEvoy CR, Cloete R, Müller B, Schürch AC, van Helden PD, GagneuxS, Warren RM, Gey van Pittius NC. 2012. Comparative analysis ofMycobacterium tuberculosis pe and ppe genes reveals high sequence varia-tion and an apparent absence of selective constraints. PLoS One 7:e30593.http://dx.doi.org/10.1371/journal.pone.0030593.
32. Marrero J, Rhee KY, Schnappinger D, Pethe K, Ehrt S. 2010. Gluco-neogenic carbon flow of tricarboxylic acid cycle intermediates is criticalfor Mycobacterium tuberculosis to establish and maintain infection. Proc.Natl. Acad. Sci. U. S. A. 107:9819 –9824. http://dx.doi.org/10.1073/pnas.1000715107.
33. Rhee KY, Carvalho LP, Bryk R, Ehrt S, Marrero J, Park SW, Schnap-pinger D, Venugopal A, Nathan C. 2011. Central carbon metabolism inMycobacterium tuberculosis: an unexpected frontier. Trends Microbiol.19:307–314. http://dx.doi.org/10.1016/j.tim.2011.03.008.
34. Singh A, Crossman DK, Mai D, Guidry L, Voskuil MI, Renfrow MB,Steyn AJ. 2009. Mycobacterium tuberculosis WhiB3 maintains redox ho-meostasis by regulating virulence lipid anabolism to modulate macro-
phage response. PLoS Pathog. 5:e1000545. http://dx.doi.org/10.1371/journal.ppat.1000545.
35. Honaker RW, Dhiman RK, Narayanasamy P, Crick DC, Voskuil MI.2010. DosS Responds to a Reduced electron transport system to induce theMycobacterium tuberculosis DosR regulon. J. Bacteriol. 192:6447– 6455.http://dx.doi.org/10.1128/JB.00978-10.
36. Mukhopadhyay S, Nair S, Ghosh S. 2012. Pathogenesis in tuberculosis:transcriptomic approaches to unraveling virulence mechanisms and find-ing new drug targets. FEMS Microbiol. Rev. 36:463– 485. http://dx.doi.org/10.1111/j.1574-6976.2011.00302.x.
37. Farhana A, Guidry L, Srivastava A, Singh A, Hondalus MK, Steyn AJ.2010. Reductive stress in microbes: implications for understanding Myco-bacterium tuberculosis disease and persistence. Adv. Microb. Physiol. 57:43–117. http://dx.doi.org/10.1016/B978-0-12-381045-8.00002-3.
38. Garton NJ, Waddell SJ, Sherratt AL, Lee SM, Smith RJ, Senner C, HindsJ, Rajakumar K, Adegbola RA, Besra GS, Butcher PD, Barer MR. 2008.Cytological and transcript analyses reveal fat and lazy persister-like bacilliin tuberculous sputum. PLoS Med. 5:e75. http://dx.doi.org/10.1371/journal.pmed.0050075.
39. Piccaro G, Giannoni F, Filippini P, Mustazzolu A, Fattorini L. 2013.Activities of drug combinations against Mycobacterium tuberculosis grownin aerobic and hypoxic acidic conditions. Antimicrob. Agents Chemother.57:1428 –1433. http://dx.doi.org/10.1128/AAC.02154-12.
40. Murphy DJ, Brown JR. 2007. Identification of gene targets against dor-mant phase Mycobacterium tuberculosis infections. BMC Infect. Dis. 7:84.http://dx.doi.org/10.1186/1471-2334-7-84.
41. Wallis RS, Patil S, Cheon SH, Edmonds K, Phillips M, Perkins MD,Joloba M, Namale A, Johnson JL, Teixeira L, Dietze R, Siddiqi S,Mugerwa RD, Eisenach K, Ellner JJ. 1999. Drug tolerance in Mycobac-terium tuberculosis. Antimicrob. Agents Chemother. 43:2600 –2606.
42. Kumar A, Majid M, Kunisch R, Rani PS, Qureshi IA, Lewin A, HasnainSE, Ahmed N. 2012. Mycobacterium tuberculosis DosR regulon geneRv0079 encodes a putative, “dormancy associated translation inhibitor(DATIN).” PLoS One 7:e38709. http://dx.doi .org/10.1371/journal.pone.0038709.
43. Sultana R, Tanneeru K, Guruprasad L. 2011. The PE-PPE domain inmycobacterium reveals a serine �/� hydrolase fold and function: an in-silico analysis. PLoS One 6:e16745. http://dx.doi.org/10.1371/journal.pone.0016745.
44. Leblanc C, Prudhomme T, Tabouret G, Ray A, Burbaud S, CabantousS, Mourey L, Guilhot C, Chalut C. 2012. 4=-Phosphopantetheinyl trans-ferase PptT, a new drug target required for Mycobacterium tuberculosisgrowth and persistence in vivo. PLoS Pathog. 8:e1003097. http://dx.doi.org/10.1371/journal.ppat.1003097.
45. Rodriguez JG, Burbano CS, Nuñez C, González CE, Zambrano MM,García MJ, Del Portillo P. 2008. Rv3134c/devR/devS operon of Myco-bacterium bovis BCG is differentially transcribed under “in vitro” stressconditions. Tuberculosis (Edinb) 88:273–282. http://dx.doi.org/10.1016/j.tube.2007.11.011.
46. Uplekar S, Rougemont J, Cole ST, Sala C. 2013. High-resolution tran-scriptome and genome-wide dynamics of RNA polymerase and NusA inMycobacterium tuberculosis. Nucleic Acids Res. 41:961–977. http://dx.doi.org/10.1093/nar/gks1260.
47. Thompson WA, Newberg LA, Conlan S, McCue LA, Lawrence CE.2007. The Gibbs centroid sampler. Nucleic Acids Res. 35:W232–W237.http://dx.doi.org/10.1093/nar/gkm265.
48. Reyes A, Sandoval A, Cubillos-Ruiz A, Varley KE, Hernández-Neuta I,Samper S, Martín C, García MJ, Ritacco V, López L, Robledo J,Zambrano MM, Mitra RD, Del Portillo P. 2012. IS-seq: a novel highthroughput survey of in vivo IS6110 transposition in multiple Mycobacte-rium tuberculosis genomes. BMC Genomics 13:249. http://dx.doi.org/10.1186/1471-2164-13-249.
49. Griffin JE, Gawronski JD, Dejesus MA, Ioerger TR, Akerley BJ, SassettiCM. 2011. High-resolution phenotypic profiling defines genes essentialfor mycobacterial growth and cholesterol catabolism. PLoS Pathog.7:e1002251. http://dx.doi.org/10.1371/journal.ppat.1002251.
50. Barry CE, Boshoff HI, Dartois V, Dick T, Ehrt S, Flynn J, SchnappingerD, Wilkinson RJ, Young D. 2009. The spectrum of latent tuberculosis:rethinking the biology and intervention strategies. Nat. Rev. Microbiol.7:845– 855. http://dx.doi.org/10.1038/nrmicro2236.
51. Gonzalez-y-Merchand JA, Garcia MJ, Gonzalez-Rico S, Colston MJ,Cox RA. 1997. Strategies used by pathogenic and nonpathogenic myco-bacteria to synthesize rRNA. J. Bacteriol. 179:6949 – 6958.
RNA-seq of M. tuberculosis in a Fatty Acid Environment
May/June 2014 Volume 5 Issue 3 e01125-14 ® mbio.asm.org 11
m
bio.asm.org
on June 6, 2018 - Published by
mbio.asm
.orgD
ownloaded from

52. Waldbauer JR, Rodrigue S, Coleman ML, Chisholm SW. 2012. Tran-scriptome and proteome dynamics of a light-dark synchronized bacterialce l l cycle . PLoS One 7:e43432. http: / /dx.doi .org/10.1371/journal.pone.0043432.
53. Langmead B, Trapnell C, Pop M, Salzberg SL. 2009. Ultrafast andmemory-efficient alignment of short DNA sequences to the human ge-nome. Genome Biol. 10:R25. http://dx.doi.org/10.1186/gb-2009-10-3-r25.
54. Rutherford K, Parkhill J, Crook J, Horsnell T, Rice P, Rajandream MA,Barrell B. 2000. Artemis: sequence visualization and annotation. Bioin-formatics 16:944 –945. http://dx.doi.org/10.1093/bioinformatics/16.10.944.
55. Gonzalez-Y-Merchand JA, Zaragoza-Contreras R, Guadarrama-MedinaR, Helguera-Repetto AC, Rivera-Gutierrez S, Cerna-Cortes JF, Santos-Argumedo L, Cox RA. 2012. Evaluation of the cell growth of mycobac-
teria using Mycobacterium smegmatis mc2 155 as a representative species.J. Microbiol. 50:419 – 425. http://dx.doi.org/10.1007/s12275-012-1556-0.
56. Rivals I, Personnaz L, Taing L, Potier MC. 2007. Enrichment or deple-tion of a GO category within a class of genes: which test? Bioinformatics23:401– 407. http://dx.doi.org/10.1093/bioinformatics/btl633.
57. Carlson J, Heckerman D, Shani G. 2009. Estimating false discovery ratesfor contingency tables. Microsoft Research, Redmond, WA. http://research.microsoft.com/pubs/80571/fdr%20for%20contingency%20tables.pdf.
58. Wang L, Feng Z, Wang X, Zhang X. 2010. DEGseq: an R package foridentifying differentially expressed genes from RNA-seq data. Bioinfor-matics 26:136 –138. http://dx.doi.org/10.1093/bioinformatics/btp612.
59. Edgar R, Domrachev M, Lash AE. 2002. Gene Expression Omnibus:NCBI gene expression and hybridization array data repository. NucleicAcids Res. 30:207–210. http://dx.doi.org/10.1093/nar/30.1.207.
Rodríguez et al.
12 ® mbio.asm.org May/June 2014 Volume 5 Issue 3 e01125-14
m
bio.asm.org
on June 6, 2018 - Published by
mbio.asm
.orgD
ownloaded from

Erratum for Rodriguez et al., Global Adaptation to a LipidEnvironment Triggers the Dormancy-Related Phenotype ofMycobacterium tuberculosis
Juan G. Rodríguez,a Adriana C. Hernández,a Cecilia Helguera-Repetto,b Diana Aguilar Ayala,b Rosalina Guadarrama-Medina,b
Juan M. Anzóla,a Jose R. Bustos,a María M. Zambrano,a Jorge González-y-Merchand,b María J. García,c Patricia Del Portilloa
Departamento de Biotecnología Molecular y Genética Molecular, Corporación CorpoGen, Bogotá, Colombiaa; Escuela Nacional de Ciencias Biológicas, InstitutoPolitécnico Nacional (IPN), Distrito Federal, Mexicob; Departamento de Medicina Preventiva, Facultad de Medicina, Universidad Autónoma de Madrid, Madrid, Spainc
Volume 5, no. 3, doi: 10.1128/mBio.01125-14, 2014.
In the Results and Discussion section (PDF page 3, line 11), TCA should have been introduced as an abbreviation for tricarboxylicacid, not trichloroacetic acid.
In the Supplemental Material, for Table S1B (Fisher Exact Test in Stationary Phase of Growth), the explanation of the parts of thetable should read as follows:
Top to bottom parts: Genes are ordered from highest to lowest FDR valuesUpper part: Genes with significant lower expression in FS versus DSMiddle part: Genes with significant higher expression in FS versus DSLower part: Genes with no significant differential expression
Published 30 December 2014
Citation Rodríguez JG, Hernández AC, Helguera-Repetto C, Aguilar Ayala D,Guadarrama-Medina R, Anzóla JM, Bustos JR, Zambrano MM, González-y-Merchand J,García MJ, Del Portillo P. 2015. Erratum for Rodriguez et al., Global adaptation to a lipidenvironment triggers the dormancy-related phenotype of Mycobacterium tuberculosis.mBio 6(1):e02373-14. doi:10.1128/mBio.02373-14.
Copyright © 2014 Rodríguez et al. This is an open-access article distributed under theterms of the Creative Commons Attribution-Noncommercial-ShareAlike 3.0 Unportedlicense, which permits unrestricted noncommercial use, distribution, and reproductionin any medium, provided the original author and source are credited.
Address correspondence to Patricia Del Portillo, [email protected], or Maria J.Garcia, [email protected].
ERRATUM crossmark
January/February 2015 Volume 6 Issue 1 e02373-14 ® mbio.asm.org 1