conversation triggers
TRANSCRIPT

Ed Keller CEO, Keller Fay Group
Twitter.com/kellerfay
Emily Vanides VP Connections Research
& Analytics MediaVest
Conversation Triggers: Sparking Conversations with
Advertising & Media
Insert Photo
Insert Photo
June 13, 2011
Word of Mouth is Powerful
“The rewards of pursuing excellence in word-of-mouth are huge, and it can deliver a significant competitive edge few other
marketing approaches can match”
“It’s the most disruptive factor in marketing”
“Marketing-induced consumer-to-consumer word of mouth generates more than twice the sales of paid advertising”
2
McKinsey Quarterly, April, 2010

But What Sparks Conversation?
Many assume WOM is generated by great brand experiences – Highly satisfied customers become evangelists for brands.
However, marketing often sparks WOM, as well
– Half of conversations about brands refer to media/marketing.
To maximizing WOM, we need a clear sense of how marketing can most effectively “trigger” conversations.
– Which media, at what time of day, in what venues, and relating to what topics of conversation?
3

WOM is at the core of SMG’s approach to marketing communications
4
Simplifying human
understanding to deliver
meaningful brand experiences
Our framework for designing
experiences that matter

Ultimately, brands need to be a part of the conversation
We live in a networked world
The role of marketing is to be a spark in the communities where people live and play
We have to harness the power of people‟s shared purpose & voice – Weaving into the fabric that bonds people together
5
We must listen & understand the conversations and how we can trigger them

We looked to our partners at Keller Fay to provide new insights
5+ year partnership with SMG
Proven approach to WOM tracking and analysis – Inclusive of both online AND offline
International perspective
Successful and market-leading insights into the relationships between marketing and brand WOM – E.g. Super Bowl, Olympics, Cross-media studies, etc
6
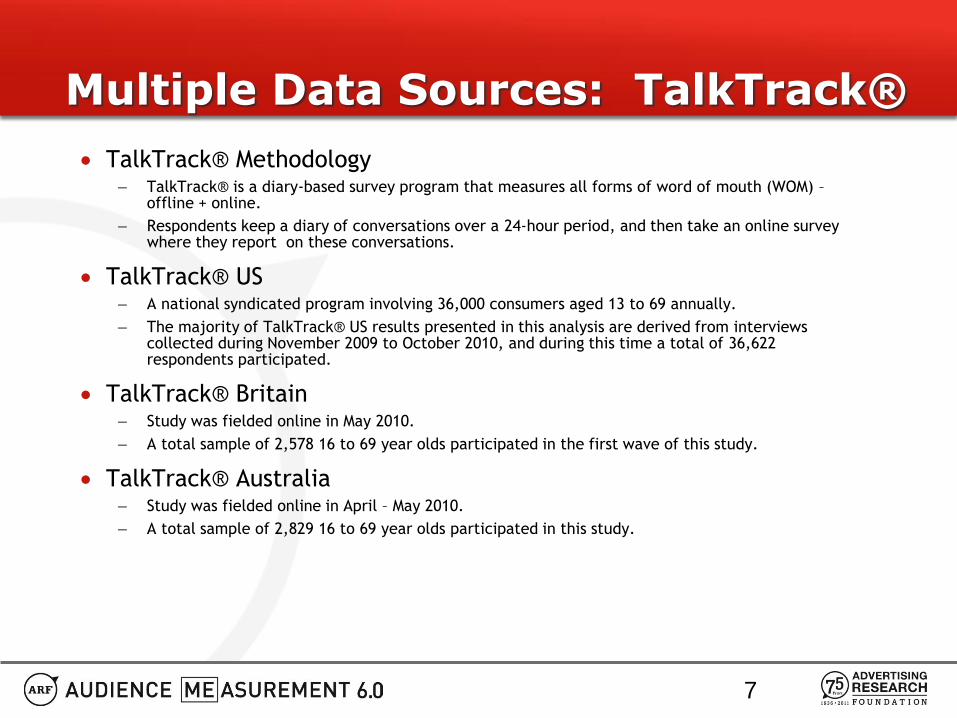
Multiple Data Sources: TalkTrack®
TalkTrack® Methodology – TalkTrack® is a diary-based survey program that measures all forms of word of mouth (WOM) –
offline + online.
– Respondents keep a diary of conversations over a 24-hour period, and then take an online survey where they report on these conversations.
TalkTrack® US – A national syndicated program involving 36,000 consumers aged 13 to 69 annually.
– The majority of TalkTrack® US results presented in this analysis are derived from interviews collected during November 2009 to October 2010, and during this time a total of 36,622 respondents participated.
TalkTrack® Britain – Study was fielded online in May 2010.
– A total sample of 2,578 16 to 69 year olds participated in the first wave of this study.
TalkTrack® Australia – Study was fielded online in April – May 2010.
– A total sample of 2,829 16 to 69 year olds participated in this study.
7

Multiple Data Sources: IPA TouchPoints 3
Unique and original survey of 5,400 British adults aged 15+ – Information gathered through individual PDA diaries and self-completion
questionnaires.
The findings presented here focus on the diary portion of TP3.
The diary records information on a half hourly basis on the following:
– Location of respondent
– Who they were with
– What they were doing (consuming media, communicating, etc.)
– What media they were consuming
– Their mood
Research was conducted during September 2009 through February 2010.
8

Regardless of Market (or Category), Offline Conversations Dominate
9
US = 7% Britain = 7% Australia = 7%
US = 91% Britain = 92% Australia = 91%
Source: TalkTrack®: US, July 2009 – June 2010; Australia, April 2010, Britain, May 2010
How Brand Conversations Take Place

Presentation to Cover
What triggers WOM, according to consumers
Role of media/marketing in WOM
10

What Triggers WOM, According to Consumers
11
Base: Conversations (All WOM, n=17,653)
Source: Keller Fay Group‟s TalkTrack® Australia, April – May 2010
“Which one of the following comes closest to describing what
prompted or “sparked” the conversation? “
(TalkTrack® Australia)
“Something else” generally relates to “neutral” or
factual talk about brand experiences or purchase plans.

Important Differences in WOM Triggers by Category
12
Base: Conversations (Beauty & Personal Care, n=634; Beverages, n=1,390; Technology, n=1,368; Financial, n=1,003)
Note: Percentages will not add to 100% because “something else” is not shown. These figures are 32%, 46%, 27%, and 42%, respectively.
Source: Keller Fay Group‟s TalkTrack® Australia, April – May 2010
What “Sparked” The Conversation Ranked by “All WOM” Results on Previous Slide
(TalkTrack® Australia)
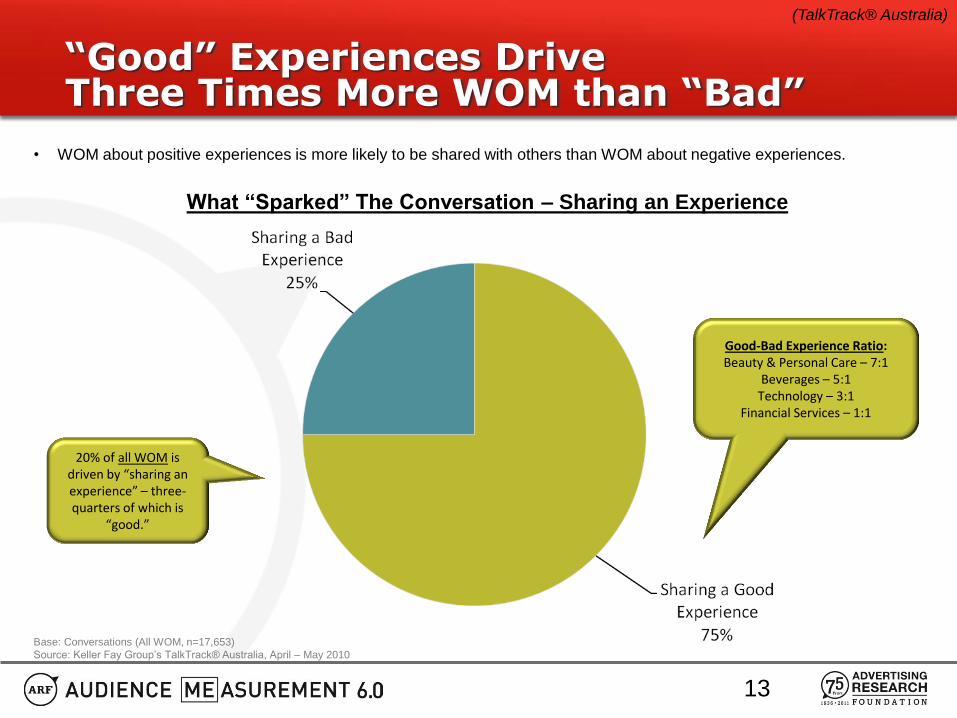
“Good” Experiences Drive Three Times More WOM than “Bad”
13
Base: Conversations (All WOM, n=17,653)
Source: Keller Fay Group‟s TalkTrack® Australia, April – May 2010
What “Sparked” The Conversation – Sharing an Experience
(TalkTrack® Australia)
20% of all WOM is driven by “sharing an experience” – three-quarters of which is
“good.”
Good-Bad Experience Ratio: Beauty & Personal Care – 7:1
Beverages – 5:1 Technology – 3:1
Financial Services – 1:1
• WOM about positive experiences is more likely to be shared with others than WOM about negative experiences.

Positive, Strong Emotions Trigger the Most WOM
14
Beauty & Personal Care Beverages
Topics Surfacing in Each Category Highly Likely Not Likely Highly Likely Not Likely
Superlative Brand Enthusiasm (Love, Excellent…) 10% 6% 11% 6%
General Brand Enthusiasm (Great, Good…) 15% 11% 11% 11%
General “Like” /Think Brand is OK 8% 7% 10% 11%
Brand Criticism (Terrible, Bad, Hate, Worst) 3% 5% 2% 5%
Brand Reputation (Positive) 6% 4% 2% 2%
Brand Works Well 14% 9% 17%* 11%*
Brand Does Not Work Well 3% 6% 3%* 3%*
Purchase Decision 10% 10% 15% 17%
“Need” The Brand 10% 7% 5% 5%
“Want” The Brand 1% 3% 5% 5%
Summary Table: WOM Topics Surfacing in Each Category by Pass-Along Likelihood
*For “Works Well” for beverages examined “tastes good” and brand hydrates, wakes me up, etc.
**For “Works Well” we examined “rate of return/earning interest” and positive feedback on customer service, since finance is a services oriented category. “Doesn‟t Work Well” is negative customer service.
***For “Cost” examined charges/fees/interest/rates positive and negative.
Note: Shading denotes statistical significance at the 90% confidence level.
Source: Keller Fay Group‟s TalkTrack®, October 2009 – September 2010
(TalkTrack® US)

Positive Emotions Also Key Trigger for Tech & Financial WOM
15
Technology Financial
Topics Surfacing in Each Category Highly Likely Not Likely Highly Likely Not Likely
Superlative Brand Enthusiasm (Love, Excellent…) 11% 5% 6% 3%
General Brand Enthusiasm (Great, Good…) 25% 18% 13% 7%
General “Like” /Think Brand is OK 5% 5% 2% 2%
Brand Criticism (Terrible, Bad, Hate, Worst) 7% 9% 14% 11%
Brand Reputation (Positive) 8% 3% 3% 1%
Brand Works Well 5% 2% 5%** 4%**
Brand Does Not Work Well 1% 3% 3%** 5%**
Purchase Decision 5% 6% N/A N/A
“Need” The Brand 2% 1% N/A N\/A
“Want” The Brand 6% 2% N/A N/A
Summary Table: WOM Topics Surfacing in Each Category by Pass-Along Likelihood
*For “Works Well” for beverages examined “tastes good” and brand hydrates, wakes me up, etc.
**For “Works Well” we examined “rate of return/earning interest” and positive feedback on customer service, since finance is a services oriented category. “Doesn‟t Work Well” is negative customer service.
***For “Cost” examined charges/fees/interest/rates positive and negative.
Note: Shading denotes statistical significance at the 90% confidence level.
Source: Keller Fay Group‟s TalkTrack®, October 2009 – September 2010
(TalkTrack® US)

Media Play a Big Role in Driving WOM
16
~ Half of consumer brand conversations
refer to marketing or media
…led by television (17%)
Internet (15%)
point of sale (9%)
newspapers (6%)
magazines (5%)
direct mail/email (5%)
Marketing and media are tools for encouraging WOM
(TalkTrack® US)
Source: Keller Fay Group‟s TalkTrack®, November 2009 – October 2010

Which Media that Trigger WOM? Plan by Category
All WOM Beauty & Personal
Care Beverages Technology
Financial Services
Brand Mentions Involving One or More References*
52% 59% 44% 55% 41%
Television 17% 15% 12% 13% 8%
Internet 15% 13% 8% 26% 19%
Point Of Sale 9% 14% 15% 12% 4%
Promotion 8% 18% 12% 6% 3%
Newspaper 6% 6% 5% 6% 5%
Direct Mail/E-Marketing 5% 5% 3% 5% 10%
Magazine 5% 9% 4% 6% 3%
Any Other Ad 3% 3% 3% 3% 3%
Radio 3% 3% 3% 3% 3%
Billboard 2% 2% 2% 2% 1%
17
Base: Brand Mentions (All WOM, n=170,380; Beauty, n=7,361; Technology, n=13,523; Beverages, n=17,822; Financial Services, n=8,324)
*Up to two media/marketing references can be selected so figures will not add to this total row.
Source: Keller Fay Group‟s TalkTrack®, November 2009 – October 2010
Media and Marketing References (% of WOM conversations citing media or marketing; top 3 references highlighted)
Magazines are disproportionately
referenced in beauty WOM.
(TalkTrack® US)

Introducing the Media Sociability Index™
Which media give advertisers the best access to consumers while they are in a conversational mode?
– Based on proximity of media use and conversation.
– TouchPoints3 (UK) is data source.
The Media Sociability Index™ reveals “highly sociable media.” – This is an index which compares „those consuming media and
communicating‟ with the average percentage of people communicating at any given half-hour interval over the course of the day.
18

Conversations Happen More Often at Times When Media are Being Consumed
19
Media Sociability Index*** = 141
• The baseline Media Sociability Index for conversations is 141 (based on 45% divided by 32%).
% of Total Adults Having
Conversations
During Each Half Hour
(Average Day*)
% of People Consuming Media
Who Are Simultaneously**
Conversing with Others Offline or
Online (Average Day)
All Forms of Conversation (Offline or Online)
(IPA TouchPoints 3)
*An average of the average percentage of offline./online or offline conversations during each half hour was taken to arrive at this figure.
**Same half hour
***Media Sociability Index compares „those consuming media & communicating‟ with the average percentage of people communicating during the day.
Source: IPA TouchPoints3

Internet & Radio are Highly Sociable, Coinciding Most with Conversations
20
*Same half hour
**Media Sociability Index compares the above results to the average percentage of people communicating overall (32%) or just offline (30%) over the
course of the day.
Source: IPA TouchPoints3
163 153 141 103 100
Boxed figures
represent Keller Fay‟s
Media Sociability
Index** metric
(IPA TouchPoints 3)

Large Variances in Times of Day People Socialize While Using Media
21
*Same half hour
**Midnight to 4AM excluded for print media due to low base sizes during these hours.
Source: IPA TouchPoints3
(IPA TouchPoints 3)
Workplace use drives the sociability of Internet use during
the morning hours.

Media Consumption at Work & School Enjoy Highest Sociability
22
*Same half hour
**Media Sociability Index compares the above results to the average percentage of people communicating overall (32%) across each day part.
Source: IPA TouchPoints3
141 225 219 131 128
Boxed figures
represent
Keller Fay‟s
Media
Sociability
Index** metric
The Percentage of People Consuming Media Who are Simultaneously* Conversing with Others Offline or Online – By Location (During Average Day – Monday through Sunday)
(IPA TouchPoints 3)

Digital Channels Related to Kids & Music Earn Highest Sociability Scores
23
Type of Digital Channel Watched % Communicating
with Others Media Sociability Index**
Children’s 73% 228
Music 54% 169
Home/DIY/Gardening 49% 153
Sport 48% 150
Reality 47% 147
News/Current Affairs 47% 147
Entertainment 46% 144
Shopping 44% 138
Game Show 41% 128
Movie 41% 128
Nature 39% 122
*Same half hour
**Media Sociability Index compares the above results to the average percentage of people communicating overall (32%) across each day part.
Source: IPA TouchPoints3
The Percentage of People Watching Digital TV Channels Who are Simultaneously* Conversing with Others Offline or Online
(During Average Day – Monday through Sunday)
(IPA TouchPoints 3)

Conclusions: Opportunities to Trigger WOM
24
Marketing and media play important roles in triggering WOM: – Consumers tell us media “triggers” WOM 20% of the time.
– Consumers report both conversing and consuming media during the same day parts.
– Consumers report nearly half their conversations contain a reference to content they found in marketing.
Conversations often happen close to the times when media are being consumed, providing marketers access to conversations.
– Early morning and early evening are especially good times to reach people who are consuming media and socializing.

Conclusions: Opportunities to Trigger WOM
25
TV & Internet are referenced in the largest volume of conversations, while point of sale & promotions play a key role in CPG WOM.
The Internet is possibly the most “sociable” of media, especially at work.
– Radio surprisingly effective at reaching people in social context.
– Television, especially programming/channels related to children, DIY, or sports, is effective in triggering conversations at home.
Positive experiences trigger more WOM than negative. – WOM containing stronger emotions tends to be the most viral.
– Positive talk related to product efficacy, such as “works well,” is also more likely to be shared with others.

Thank you!
Ed Keller, [email protected]
Facebook.com/kellerfay
Twitter.com/kellerfay
Emily Vanides
Insert Photo Insert Photo