gjetc st4 final report 20171130.1 · in 2015, final energy consumption totalled 8,877 pj (bmwi...
TRANSCRIPT

Study Program of the German-‐Japanese Energy Transition Council
Energy end-‐use efficiency potentials and policies and the development of energy service markets Study performed by:
The Study program received financial support from Stiftung Mercator Foundation, Essen, Germany

Energy end-use efficiency potentials and policies and the development of
energy service markets
Germany and Japan
Final Report

Ecofys - A Navigant Company
Ecofys Germany GmbH | Albrechtstraße 10 c | 10117 Berlin | T +49 (0)30 29773579-0 | F +49 (0)30 29773579-99 | E [email protected] | I ecofys.com
Register Court: Local Court Cologne | Chamber of commerce Cologne HRB 28527 | VAT ID DE 187378615
Managing Director Scott S. Harper, Julie M. Howard, Monica M. Weed
Energy end-use efficiency potentials and policies and the development of energy service markets Germany and Japan Final Report
Country Report Germany
Country Report Japan
Mutual Review and recommendations
Date: 28 November 2017
Project number: EPODE17393
© Ecofys and IAE 2017 by order of: GJETC

Ecofys - A Navigant Company
Ecofys Germany GmbH | Albrechtstraße 10 c | 10117 Berlin | T +49 (0)30 29773579-0 | F +49 (0)30 29773579-99 | E [email protected] | I ecofys.com
Register Court: Local Court Cologne | Chamber of commerce Cologne HRB 28527 | VAT ID DE 187378615
Managing Director Scott S. Harper, Julie M. Howard, Monica M. Weed
Executive Summary
Germany
This report presents the analysis of energy efficiency potentials, barriers and policies in Germany. It
takes a detailed look at the sectors buildings, appliances, industry and transport. Additionally, the
role of information and communication technologies, demand response, smart cities, behavioural
aspects and the energy service market are analysed.
Energy efficiency policies in Germany date back several decades with the first laws on efficiency in
buildings being passed in 1976 in response to the first oil price crisis. Today, energy efficiency
policies are embedded in the so-called energy transition (Energiewende) which was initiated in
Germany in 2010. The concept of the energy transition implies a comprehensive transformation of
energy supply and use. The German energy transition comes with ambitious climate and energy goals
for 2050 that are laid out in the Energy Concept. By 2050 Germany strives to cut CO2 emissions by
80 to 95%, boost renewables to a share of 80% in electricity generation, and reduce primary energy
consumption by 50% until 2050 (compared to 2008) (cf. BMWi/BMU 2010). Strategies and measures
to achieve the German energy efficiency targets for 2020 are laid out in the National Action Plan
on Energy Efficiency (NAPE) adopted in 2014. In November 2016, the Climate Action Plan 2050
was adopted. It is the first official document that describes the path to a nearly greenhouse gas
neutral Germany in 2050. While Germany has made considerable efforts in improving its energy
efficiency and reducing the primary energy consumption, by reducing the primary energy demand of
buildings by 15.9% (compared to 2008) for example, significant work remains in order to reach the
set targets. This is the case in the transport sector for example, where final energy consumption has
increased by 16% since 1990, as absolute traffic volume continues to rise and offset efficiency gains
via technical improvements (BMWi 2017a).
In 2015, final energy consumption totalled 8,877 PJ (BMWi 2017a). The transport sector
consumed 29.5% (2,616 PJ) of final energy, the industrial sector used 29% (2,576 PJ), and
households used 25.8%, (2,289 PJ) while the service sector consumed 15.7% (1,393 PJ).
The total additional savings potential that can be achieved through strong policies for all sectors
until 2030, relative to the reference scenario, which already includes the current policies, is estimated
at 1,158 PJ of final energy (Fraunhofer ISI, TU Vienna, PwC 2014b, p. 25). The largest savings
potential lies in the buildings sector with 417 PJ, corresponding to about 36% of total savings
potential. On one hand, even these strong policies are not assumed to achieve to total technical
potential, which is estimated to allow reducing the absolute energy consumption by more than 50%
within 20 years (Fraunhofer ISI 2012a, p. 182). On the other hand, when reaping these potentials,
the rebound effect needs to be considered.

Ecofys - A Navigant Company
Ecofys Germany GmbH | Albrechtstraße 10 c | 10117 Berlin | T +49 (0)30 29773579-0 | F +49 (0)30 29773579-99 | E [email protected] | I ecofys.com
Register Court: Local Court Cologne | Chamber of commerce Cologne HRB 28527 | VAT ID DE 187378615
Managing Director Scott S. Harper, Julie M. Howard, Monica M. Weed
The buildings sector must be virtually climate neutral by 2050. In order to reach this target,
renovation rates, which are currently about 1%, need to double. The efforts of the German
government to improve energy efficiency in buildings were, until recently, mainly focused on
residential buildings as data on non-residential buildings is still weaker. Yet in the last years, various
programmes and research projects were implemented to overcome this gap. The German building
stock is quite old, which contributes to the fact that out of the 19 million residential buildings with ca.
40 million apartments, 50% must be renovated in the next 20 years (BMWi 2017b). In the buildings
sector, financial and informational barriers present a large obstacle for realizing energy efficiency. For
years, the government has followed the three-pronged policy approach of ‘Inform, Support, Regulate’
and will continue this approach in the future. Best practices are the continuously tightened building
codes under the Energy Saving Ordinance (EnEV) which led to steep learning curves in the buildings
sector (best practice example 1, Figure 10). Additionally, the KfW Programmes (best practice
example 2, Figure 12) which link the amount of funding available for energy efficiency refurbishments
or new built houses to the Minimum Energy Performance Standard also serve as an example of best
practice in Germany.
Looking at residential and tertiary appliances, the total savings potential for 2030 is estimated to
be 244 PJ, where slightly more savings can be realised in the tertiary sector (Fraunhofer ISI, TU
Vienna, PwC 2014b, p.25). Appliances are regulated EU-wide by the Ecodesign and Energy Labelling
Directives (best practice example 3). The Ecodesign Directive involves a large number of
stakeholders in the regulatory process, which makes it very transparent; however, this also means
that tightening product standards often takes a long time (cf. Energy Efficiency Watch 3). Also for
some appliances, e.g. in ICT, technological developments are moving very fast, making it difficult to
keep up with adequate standard setting. While financial incentives for product replacements for poor
households are in place, further push and pull strategies are absent to a large extent. Additionally,
while benchmarks are available for absolute consumption levels, benchmarks for the operation of
appliances are often absent in the tertiary sector.
The industrial sector does not have an implicit energy efficiency target, yet under Germany’s long-
term climate action plan, it needs to reduce its CO2 emissions by 51-49% (compared to 1990) until
2030, which is equivalent to 140-143 MtCO2eq. The final energy consumption in the industry sector
varies enormously for the different branches. The most energy-intensive branches in Germany are
iron and steel, chemical and mineral industry as well as paper and pulp industry. For 2030, the total
savings potentials in the industrial sector are estimated to be 222 PJ (Fraunhofer ISI, TU Vienna, PwC
2014b, p. 25). Cross-cutting electric measures (77 PJ) and cross-cutting thermal measures (73 PJ)
have the largest saving potential. The German energy intensive industry, which has the highest
energy savings potentials in this sector, is covered by the EU ETS; however, the small and medium
sized companies (SMEs) are also an important part of the industry sector in Germany, representing
99.95% of all companies and employing 68% of the work force (KfW 2015d). In these smaller
enterprises, information deficits play a major role in the financing of energy efficiency investments,
whereas in larger enterprises, organisational aspects, such as the distribution of responsibilities for
energy efficiency or the in-house flow of information, are inhibitive. Germany has implemented a
variety of financial instruments aiming to reduce financial barriers. However, currently there is still a

Ecofys - A Navigant Company
Ecofys Germany GmbH | Albrechtstraße 10 c | 10117 Berlin | T +49 (0)30 29773579-0 | F +49 (0)30 29773579-99 | E [email protected] | I ecofys.com
Register Court: Local Court Cologne | Chamber of commerce Cologne HRB 28527 | VAT ID DE 187378615
Managing Director Scott S. Harper, Julie M. Howard, Monica M. Weed
reduced willingness of companies to implement energy saving measures with pay-back times of more
than three years. Energy efficiency networks (best practice example 4, Figure 17) allow for a goal-
oriented, non-bureaucratic exchange between companies.
The transport sector has to reduce final energy consumption by 10% until 2020 and by ca. 40%
until 2050 (compared to 2005). Since 1990, final energy consumption has increased by 16%. 90% of
fuels used are fossil fuels, meaning that biofuels and electricity only play a minor role. The largest
share in the transport sector is road traffic. The high investment costs for the expansion of the
transport infrastructure and a lack of technical innovations for vehicle efficiency constitute a major
obstacle to energy efficiency in the transport sector. Various tax-related instruments have been
implemented in the transport sector. However, tax rates have not been progressively adjusted and
remain too low to increase energy efficiency.
The digitalisation of the energy system is expected to yield energy efficiency potentials through the
analysis of increasing volumes of data on energy flows. The Digital Agenda 2014-2017 sets out the
guiding principles of the digitalisation and in June 2016, the law on the digitalisation of the energy
transition was passed. Under the premise of data security and protection, modern technologies such
as smart grids and smart metering shall positively impact energy efficiency. Information and
communication technologies (ICT) can manage considerable amounts of data needed to allow for
flexible distribution of energy supply and demand. Real-time information and communication about
energy supply, grid load and storage capacity opens opportunities for the optimal and efficient use of
energy. Smart metres in industries and private households are envisioned to provide detailed
information about energy consumption patterns and are therefore a key technology for new demand
response applications. According to estimates, the introduction of smart meters coupled with
monitoring tools can account for electricity savings of 3-5%. For heating, energy savings are
expected to be slightly higher (up to 6,5%) (Hoffmann et al. 2012). In particular, the visualisation of
energy use has been found to be crucial as it enables the consumer to use energy more consciously.
Automated energy management systems in buildings can make up for 10-20% of energy savings.
Another key technology is the internet of things. The internet of things (IoT) refers to things and
communication networks, whose primary function is not directly related to information and
communication technology, e.g. a washing machine. Despite the considerable potential, mass-market
applications of IoT are not yet economically feasible. In particular, German SMEs are hesitant to
become part of “industry 4.0” as the advantages are often unclear (Deloitte 2016).
ICT, big data and the internet of things are also key for the future of smart cities and urban
planning. Smart cities may increase energy efficiency through smart street lights, smart grids and
intelligent building systems. German cities currently face a huge challenge to adapt to technology
developments and implement fundamental changes in urban infrastructure (e.g. for e-mobility). Many
cities are suffering from investment lags in conventional urban infrastructure. Due to a shift from an
industrial economy to a service economy and the related demographical changes, some cities are
growing rapidly while others are shrinking along with the local economy.

Ecofys - A Navigant Company
Ecofys Germany GmbH | Albrechtstraße 10 c | 10117 Berlin | T +49 (0)30 29773579-0 | F +49 (0)30 29773579-99 | E [email protected] | I ecofys.com
Register Court: Local Court Cologne | Chamber of commerce Cologne HRB 28527 | VAT ID DE 187378615
Managing Director Scott S. Harper, Julie M. Howard, Monica M. Weed
Compared to other European countries, the German energy service market is particularly well
developed on the supply side, which is characterised by a high level of competition. The market
comprises the product groups of information, consulting, energy management and energy
(performance) contracting (best practice example 5, Figure 23). Despite different market situations
for the different products, around 77% and more of energy service providers see growth potential or
strong growth potential for the market for energy services. Yet, various barriers slow the
development of the energy service markets in Germany. Among them are an uncertainty of
investments, capital shortages, investor-user dilemma, as well as information and motivation
deficiencies of the final customer (cf. BAFA 2013). Important policies have been the promotion of
energy consultations for residential buildings (renters and owners) as well as for SMEs and industry
(buildings and processes). Additionally, the availability of tax relief for companies that have
implemented an energy management system has led to a great push in demand since 2011.
Nevertheless, a gap between existing policies, energy efficiency targets and potentials remains,
hence further energy efficiency policies are necessary.

Ecofys - A Navigant Company
Ecofys Germany GmbH | Albrechtstraße 10 c | 10117 Berlin | T +49 (0)30 29773579-0 | F +49 (0)30 29773579-99 | E [email protected] | I ecofys.com
Register Court: Local Court Cologne | Chamber of commerce Cologne HRB 28527 | VAT ID DE 187378615
Managing Director Scott S. Harper, Julie M. Howard, Monica M. Weed
Japan
Motivations of energy efficiency improvement in Japan
Two oil shocks in the 1970s were the initial milestones that influenced energy efficiency improvement
in Japan. After the shocks, various energy saving technologies have been widely disseminated
through energy efficiency improvement in production processes and end-use energy equipment
developments by businesses and institutions for energy management and energy efficiency. From
other perspectives, the issues raised after the 1990s, such as the global environmental agenda and
the Great East Japan Earthquake, were the influential factors in energy efficiency improvement in
Japan.
Policy targets of energy efficiency in Japan
The Paris Agreement of United Nations Framework of Climate Change requested mid-century target
for parties. Currently, some Japanese government ministries discuss mid-century low carbon social
system but comprehensive energy package plan with policy initiatives has not shown. Therefore, we
should limit the policy related discussion up to 2030 in Japan report. Transition of final energy
consumption in the Long-term Energy Supply and Demand Outlook is consistent with greenhouse gas
emission national target of 2030. Both the reference case and the aggressive conservation case are
shown for 2030.
Energy saving potentials
Difference between the reference and aggressive conservation corresponds to the energy saving
potential in Japan in 2030. In February 2015, the Energy Conservation Division of Agency of Natural
Resource and Energy reported a provisional estimate of energy saving potential. Through the
formulation of the long-term energy supply and demand forecast for 2030, the estimate is also the
basis of the greenhouse gases reduction target of 2030, which the Japanese government submitted
to the UN Framework Climate Change Convention in July 2015 as an Intended Nationally Determined
Contributions (INDC) document. Provisional energy saving potential is defined as the differences
between reference case and aggressive conservation case. Total potential is 14% of reference
energy demand, and 6% for industry, 19% for commercial, 24% for residential and 21% for
transportation.
In addition, The Institute of Energy Economics Japan published the IEEJ Outlook 2018 in October
2017. Its assessment time horizon has extended to 2050 and prepares a reference scenario and an
advanced technology scenario by global region. Japan is one of the global regions, and the demand
difference between reference and advanced technology scenario in 2050 can be regarded as energy
saving potential of Japan in 2050. Best practice industrial demand technology, clean energy
automobile for transportation as well as home appliances, hot water supply, illumination, thermal
insulation of buildings technologies are listed for building energy saving technologies. The estimated
potential numbers are smaller than Agency of Natural Resource and Energy assessment targeted in
2030, and further saving opportunities should be elaborated.

Ecofys - A Navigant Company
Ecofys Germany GmbH | Albrechtstraße 10 c | 10117 Berlin | T +49 (0)30 29773579-0 | F +49 (0)30 29773579-99 | E [email protected] | I ecofys.com
Register Court: Local Court Cologne | Chamber of commerce Cologne HRB 28527 | VAT ID DE 187378615
Managing Director Scott S. Harper, Julie M. Howard, Monica M. Weed
Regulation measures on energy conservation
The Energy Conservation Act is the foundation of Japanese energy efficiency and conservation policy.
Building performance is now regulated under the Building Energy Conservation Act, which was
established in 2015 and enforced in 2016. Two acts cover industrial, commercial, residential, and
transportation, in terms of product performance and business operation.
Supporting measures on energy conservation
Supporting measures are categorized into subsidy, demonstration, energy saving diagnosis, research
and development, and tax institution. Subsidies are found in all sectors for energy systems or
individual equipment. Demonstration is underway with subsidies in building and transportation.
Energy saving diagnosis for small and medium enterprise is also one of the conservation policies.
Industrial production process is a strategic area of R&D, while a broad range of energy efficiency R&D
has been conducted covering all sectors. Tax is another tool to accelerate energy efficiency in
building and transportation.
Market opportunity in energy saving business
Energy saving itself has business opportunity. The energy service company or energy service
provider aims at initial conservation related cost recovery by energy saved. It is closely coupled with
building energy management system diffusion and it will provide energy saving opportunity especially
in commercial sector.

Ecofys - A Navigant Company
Ecofys Germany GmbH | Albrechtstraße 10 c | 10117 Berlin | T +49 (0)30 29773579-0 | F +49 (0)30 29773579-99 | E [email protected] | I ecofys.com
Register Court: Local Court Cologne | Chamber of commerce Cologne HRB 28527 | VAT ID DE 187378615
Managing Director Scott S. Harper, Julie M. Howard, Monica M. Weed
Mutual Review and Recommendations: Germany and Japan
The findings of the German and the Japanese country reports are compared to each other in Part III
of the report. This includes a mutual review of the two individual country reports with a focus on
similarities and differences in potentials as well as the regulatory frameworks. It also aims to explain
the historical, political and cultural background of differences where relevant. The second part
formulates policy and business recommendations for both countries, highlights opportunities for
mutual learning, and identifies areas for further research.
Conclusions on the mutual review
The mutual review of the individual country reports has revealed a number of parallel developments
as well as clear differences in the regulation of energy efficiency in both countries.
While energy efficiency is regulated by two comprehensive Acts in Japan including the Energy
Conservation Act and Buildings Energy Performance Act, the regulatory landscape in Germany has
more complexity, also due to the EU which has created an additional governance layer.
In contrast to Germany, which has a comprehensive energy transition strategy in place known under
the term “Energiewende”, a similar, but less comprehensive strategy called "Long-term Energy
Outlook" exists in Japan. However, while Germany has formulated targets for 2050, there are no
such long-term quantitative energy targets in Japan.
Especially for the regulation of buildings and in the industry as well as appliances covering both
sectors, mandatory competitive benchmarks play an important role in Japan. This instrument is not
commonly used in Germany, where standards for appliances are agreed for each individual appliance
at EU level. In Germany, the building envelope performance regulation is advanced. The Japanese
regulation however, was rather weak in the past, but the recent establishment of the Building Energy
Conservation Act will accelerate energy efficiency especially in large buildings. In contrast to the
German energy performance certificate, labelling for new and existing buildings is encouraged, but
not mandatory in Japan.
Energy efficiency developments and regulation in the industry are difficult to compare in detail
because the production style of each industry differs. However, the monitoring and compliance
systems are different. While in Germany, mostly third party audits are contracted for energy
consumption reports, Japan requires in-house reporting from each company. In some cases, energy
diagnosis for small and medium enterprises are done by third parties as well in Japan.
Efficiency improvement of vehicle and next generation vehicle diffusion are a common agenda for
Germany and Japan, as the automobile (i.e. passenger cars, buses, freight trucks) share is dominant
in both countries’ transportation energy demand.

Ecofys - A Navigant Company
Ecofys Germany GmbH | Albrechtstraße 10 c | 10117 Berlin | T +49 (0)30 29773579-0 | F +49 (0)30 29773579-99 | E [email protected] | I ecofys.com
Register Court: Local Court Cologne | Chamber of commerce Cologne HRB 28527 | VAT ID DE 187378615
Managing Director Scott S. Harper, Julie M. Howard, Monica M. Weed
With regard to information and communication technologies, demand management and response
measures and smart cities and communities, both countries seem to be in a similar position.
Research and development is being undertaken and supported by the government. Yet, there are no
wide-scale applications employed for improved energy efficiency and the energy savings potential
remains largely unclear.
Energy consulting services as well as energy providing services exist in both countries. Yet, the
energy efficiency service market seems to be more defined in Germany compared to Japan. One
explanation is that most energy services are done by in-house management as energy managers are
required by Japanese law. Nevertheless, both countries expect a growth in energy services especially
with regard to digitisation.
Summary on the recommendations part
Both countries, Germany and Japan, are already among those with the highest energy productivity in
the world. The fact that there have been energy efficiency policies in place in both countries for many
years has contributed to this. Still, both countries have ambitious energy efficiency targets for the
future and high energy efficiency potentials. Hence, the overarching policy recommendation for
both countries is to continuously assess, develop, and strengthen the overall and sectoral packages
of energy efficiency policies. In general, more balanced and comprehensive policy packages that use
regulatory, financial, informational and all other instrument types can be expected to be effective in
overcoming the multiple barriers for actors in the value chain of energy efficiency. The report then
offers potential improvements to the existing policies, overarching and per sector, for each Germany
and Japan.
Energy efficiency policies will be one driver for business opportunities. Digitisation can also provide
an opportunity for new consulting tools to save energy in equipment by enabling cost-effective
consulting services, which at the same time are more responsive to individual, real-world use. This
also includes building automation. For the industry sector, business opportunities lie in demand
response. Big data and a market for energy savings can bring further business opportunities. An
example is autonomous driving, which in the future would combine driving data and traffic data to
assure the driving function as a service.
All of these areas also provide manifold opportunities for mutual learning. From the analysis, it
appears that Germany could learn for example, from Japan’s experiences with using energy efficiency
benchmarks in industry, the Japanese Top-Runner approach, and Japan’s transport system and
policies. On the other hand, Japan could learn from Germany about the long-term view on an energy
transition, also related to energy efficiency targets and policies, as well as in policies to advance
energy efficiency in buildings.
Finally, the report includes recommendations for further research.

Ecofys - A Navigant Company
Ecofys Germany GmbH | Albrechtstraße 10 c | 10117 Berlin | T +49 (0)30 29773579-0 | F +49 (0)30 29773579-99 | E [email protected] | I ecofys.com
Register Court: Local Court Cologne | Chamber of commerce Cologne HRB 28527 | VAT ID DE 187378615
Managing Director Scott S. Harper, Julie M. Howard, Monica M. Weed
The information on energy efficiency potentials varies between Germany and Japan and also within
sectors. More detailed studies about energy efficiency potentials in Japan will be beneficial and would
allow for a more detailed comparison between the two countries. Additionally, also for Germany
energy efficiency potential studies for the timeframe 2050 are needed. This also includes studies
analysing the cost-effective saving potentials containing information on economic efficiency (e.g. Net
benefit/Cost curves of negawatts). It should be expanded to the multiple impacts of energy
efficiency.
Further analysis is also needed to understand the differences in per capita energy consumption in
buildings and transport between the two countries. This will allow to learn on the role of energy
efficiency and daily routines of use in both countries, and how policy can influence and support these.
For a better understanding of the differences in energy service markets, a dedicated line-up by type
of services would provide insights why and in what services the German market has a higher
turnover.
Additionally, a more detailed assessment on the impact of existing and potential new or improved
energy policies is needed. This includes their impact on energy prices in both countries as well as the
role of energy prices as drivers for energy efficiency.

Ecofys - A Navigant Company
Ecofys Germany GmbH | Albrechtstraße 10 c | 10117 Berlin | T +49 (0)30 29773579-0 | F +49 (0)30 29773579-99 | E [email protected] | I ecofys.com
Register Court: Local Court Cologne | Chamber of commerce Cologne HRB 28527 | VAT ID DE 187378615
Managing Director Scott S. Harper, Julie M. Howard, Monica M. Weed
Table of contents
Part I: Country Report Germany 16 1 Introduction to this study 17 2 Energy efficiency targets, strategies, institutions, and potentials in Germany 19
2.1 Energy efficiency targets and strategies within the German
“Energiewende” and the European Union 19 2.2 Energy efficiency governance 23 2.3 Energy statistics and energy efficiency developments 24 2.4 Energy efficiency potentials in Germany 28
3 Buildings 32 3.1 Energy statistics and developments 32 3.2 Potentials 34 3.3 Barriers 35 3.4 Policies 36
4 Appliances 46 4.1 Energy statistics and developments 46 4.2 Potentials 47 4.3 Barriers 48 4.4 Policies 49
5 Industry 52 5.1 Energy statistics and developments 52 5.2 Potentials 53 5.3 Barriers 54 5.4 Policies 55
6 Transport 60 6.1 Indicators 60 6.2 Potentials 61 6.3 Barriers 61 6.4 Policies 63
7 Cross-sector 66 7.1 Information and communication technologies 66
7.1.1 Potentials 66 7.1.2 Barriers 67 7.1.3 Policies 68
7.2 Demand response 70 7.2.1 Potentials 70 7.2.2 Barriers 71 7.2.3 Policies 72
7.3 Impacts of Smart Cities and communities & city planning 72 7.3.1 Potentials 72 7.3.2 Barriers 75

Ecofys - A Navigant Company
Ecofys Germany GmbH | Albrechtstraße 10 c | 10117 Berlin | T +49 (0)30 29773579-0 | F +49 (0)30 29773579-99 | E [email protected] | I ecofys.com
Register Court: Local Court Cologne | Chamber of commerce Cologne HRB 28527 | VAT ID DE 187378615
Managing Director Scott S. Harper, Julie M. Howard, Monica M. Weed
7.3.3 Smart City Policies 75 7.3.4 CHP and district heating networks in Germany 77
7.4 Rebound effect and behavioural approach 78 7.4.1 Impact of the rebound effect on energy efficiency potentials 78 7.4.2 Policy measures to minimise the rebound effect 79 7.4.3 Impact of behavioural approaches 81 7.4.4 The role of sufficiency in current energy efficiency policy 83
7.5 Energy service market 84 7.5.1 Potential of the energy service market 84 7.5.2 Barriers in energy service markets 87 7.5.3 Policies supporting energy service markets 88
8 Outlook 91 9 Sources 93
Part II: Country Report Japan 104 1 Introduction 105
1.1 About this study 105 1.2 End-use energy consumption trends 105 1.3 Long-term energy supply and demand outlook 106 1.4 Energy saving potential in 2030 and 2050 107
2 Industry sector 110 2.1 End-use energy consumption 110 2.2 Energy efficiency indicators 110 2.3 Potentials 111 2.4 Barriers 112
3 Commercial sector 114 3.1 End-use energy consumption 114 3.2 Energy efficiency indicators 114 3.3 Potentials 115 3.4 Barriers 116
4 Residential sector 117 4.1 End-use energy consumption 117 4.2 Energy efficiency indicators 118 4.3 Potentials 119 4.4 Barriers 120
5 Transportation sector 122 5.1 End-use energy consumption 122 5.2 Energy efficiency indicators 122 5.3 Potentials 124 5.4 Barriers 124
6 Cross-sectoral approach 125 6.1 Information and communication 125 6.2 Demand response in smart community 125

Ecofys - A Navigant Company
Ecofys Germany GmbH | Albrechtstraße 10 c | 10117 Berlin | T +49 (0)30 29773579-0 | F +49 (0)30 29773579-99 | E [email protected] | I ecofys.com
Register Court: Local Court Cologne | Chamber of commerce Cologne HRB 28527 | VAT ID DE 187378615
Managing Director Scott S. Harper, Julie M. Howard, Monica M. Weed
6.3 Building energy management system 128 6.4 Big data 130 6.5 Energy service provider and energy service companies 131 6.6 Rebound effects 132 6.7 Setsuden initiative 133
7 Policy analysis 135 7.1 Regulation measures 135 7.2 Supporting measures 136 7.3 Best practices 137 7.4 Cross-sectoral governance framework 137
8 Sources 139 Annex 1 Revision history of the Energy Conservation Act 141 Annex 2 Top runner program 146 Annex 3 Energy efficiency institution for large scale energy consumers 147 Annex 4 ZEB/ZEH program and labelling system for buildings 149 Annex 5 Tax breaks for eco-cars 151
Part III: Mutual Review and recommendations: Germany and Japan 152 1 Introduction 153
1.1 Indicators 153 1.2 Energy efficiency potentials 154 1.3 Cross-sectoral governance framework 157
2 Buildings 160 3 Industry 165 4 Transport 168 5 Cross-sector 170
5.1 Information and communication technologies, smart cities and smart
communities 170 5.2 Demand Response 171 5.3 Rebound effects and the behavioural approach 173
6 Conclusion on the mutual review 176 7 Recommendations 178
7.1 Policy recommendations and business opportunities 178 7.2 Mutual learning opportunities 182 7.3 Further need for research 183
8 Conclusion 186 9 Sources 187

EPODE17393 16
Part I: Country Report Germany
By:
Moritz Schäfer, Sonja Kotin-Förster, Katja Dinges, Korinna Jörling, Kristen Brand, Sigrid
Lindner

EPODE17393 17
1 Introduction to this study
The German Japanese Energy Transition Council (GJETC) has been established to exchange
knowledge in the field of energy between two high-tech countries. Both countries must overcome
great challenges in the coming years and decades to decarbonise their energy systems while at the
same time develop smart, reliable and low-risk systems with competitive energy prices. Both
countries can learn from each other to better tackle the energy transition.
Ecofys and Japan’s Institute of Applied Energy in parallel conducted studies on the energy end-use
efficiency potentials, barriers and policies as well as the development of energy service markets in
both Germany and Japan. As one of the Council’s four study programmes, the aim of this project is to
analyse topics of mutual interests to both countries, facilitate research-based exchange between
experts, and ultimately craft solutions and policy advice to enable the sustainable energy transition.
In this study the energy end-use efficiency potential and the potential for demand response in the
buildings, appliances, industry, and transport sectors along with the barriers and policy landscape
thereof, were studied by both the German and Japanese teams. In addition, they examined how ICT,
the Internet of Things, and Big Data impacts these potentials and promote Smart Cities and
Communities. Energy service markets were also examined as well as how the rebound effect and
behavioural change impact energy efficiency. By comparing the German and Japanese approaches,
we outline similarities and differences, best practices, policy recommendations, and business
opportunities.
This part of the report is the result of the analysis of energy efficiency potentials, barriers and policies
in Germany. It has been structured to provide a holistic overview of the specific situation of Germany
and provides readers who are not familiar with the German context with background information on
policy targets, indicators and the structure of the German energy market. It is structured in the
following chapters:
• Chapter 2 “Energy efficiency targets, strategies, institutions and potentials in Germany”: This
chapter sets the context for understanding energy efficiency policies in Germany. It does so
by providing an overview of national and sectoral energy efficiency targets and strategies as
well as showing energy statistics and historical developments of energy efficiency and
quantifying energy efficiency potentials.
• Chapter 3 “Buildings”: This chapter discusses energy statistics and developments of the
buildings sector, as well as sector-specific potentials, barriers and existing policies.
Additionally, best practice examples are highlighted.
• Chapter 4 “Appliances”: The “Appliances” chapter discusses energy statistics and
developments of the appliance sector, as well as sector-specific potentials, barriers and
existing policies. Additionally, best practice examples are highlighted.
• Chapter 5: “Industry” deals with developments, potentials, barriers and policies in the
industry sector.

EPODE17393 18
• Chapter 6: “Transport” follows the same structure as outlined for the previous chapters and
discusses transport-specific aspects.
• Chapter 7: “Cross-sector”: This chapter comprises the potentials, barriers, and policies of
information and communication technologies, demand response measures, smart cities,
behavioural measures, sufficiency, and the energy service market respectively.
• Chapter 8: “Summary and Outlook” gives a summary of all sectors and provides an outlook
on energy efficiency policy developments until 2050.
Chapters 3-7 include information about energy statistics and developments and present the
potentials, barriers, and current policies of the respective sector. The existing policies are categorised
into different types, including regulatory, financial, informational, and research and development. The
individual policies are assessed according to their relevance in the respective sector. The aim is to
pinpoint and describe these main policies and instruments that support end-use energy efficiency and
demand response, and in doing so, identify sector-specific instruments that make up coherent policy
packages. The instruments are outlined in easy-to-read tables, followed by a description of the most
important instruments and the impact thereof.
The categorisation of instruments can be understood as follows:
• Regulatory and planning: National and EU legal regulations including ordinances, technical
standards and mandatory product labelling requirements.
• Financial: subsidies and public infrastructure spending, public investments, tax benefits,
direct grants, interest-reduced loans in connection with redemption payments, and price
controlling instruments like energy taxes and toll models
• Informational and consulting: Provision of information by the public authorities and
consulting services, such as on-site consultation, energy audits and checks
• Research & development: support for energy efficiency research, the development of new
technologies, and ways in which such technologies can be brought to the market.

EPODE17393 19
2 Energy efficiency targets, strategies,
institutions, and potentials in Germany
2.1 Energy efficiency targets and strategies within the German “Energiewende” and the European Union
Energy efficiency targets and policies in Germany are mainly embedded in the climate and energy
framework of the European Union (EU). With the 20-20-20 goals, the EU has set climate protection
targets for the reduction of energy consumption and greenhouse gas emissions and the increase of
renewable energies. By 2020, greenhouse gas emissions shall be reduced by 20% compared to 1990,
the share of renewable energies shall increase to at least 20%, and efficiency improvements shall
save at least 20% of the primary and final energy consumption forecasted for 2020. In October 2014,
the European Council agreed to increase energy efficiency by at least 27% by 2030 (with a view to
increase this target to 30%) under the 2030 Climate and Energy Policy Framework (European Council
2014). In November 2016, the European Commission proposed an amended Energy Efficiency
Directive with a binding target of 30% for 2030 in its “Winter Package”. Four EU directives describe
the main framework of EU energy efficiency policies1 and significantly influence German policies.
The Energy Efficiency Directive (2012/27/EU, EED) aims for a 20% reduction in the EU’s
primary energy consumption by 2020, relative to the 2007 reference scenario. The directive is
a set of measures to target energy efficiency potentials in energy use, energy supply, and
horizontally. Article 7 of the EED places an obligation on each Member State to achieve final
energy savings of 1.5% annually by using energy efficiency obligation schemes or other
targeted policy measures to improve energy efficiency in households, industries and transport
sectors. Germany does not have energy efficiency obligations for energy companies but opted
for achieving the savings through policy measures. Additionally, large enterprises are obliged
to carry out an energy audit at least every four years. The exemplary role of public bodies is
also emphasised. Central governments in EU countries must carry out energy efficient
renovations annually on at least 3% (by floor area) of the buildings they own and occupy. The
public sector is encouraged to purchase energy efficient buildings, products and services.
The Energy Performance of Buildings Directive (2010/31/EU, EPBD) regulates energy
efficiency in the building sector. In order to increase energy efficiency, Member States must
implement minimum energy performance requirements for new buildings and when retrofitting
existing buildings. The level of energy performance requirements is decided by each Member
State. Additionally, energy performance certificates have to be included in all sales or rental
1 EU directives need to be transposed into national law and often allow flexibility in the way measures are implemented at national level.

EPODE17393 20
advertisements of buildings. Furthermore, Member States are required to ensure that all new
buildings are 'nearly zero-energy'2 by 2021.
The Ecodesign Directive (2009/125/EG, ED) establishes a framework to set mandatory
minimum energy efficiency standards for energy-using and energy-related products. More than
40 product groups are covered under this framework. The standards are EU-wide, which means
that manufacturers do not have to comply with disparate national legislations. This also
strengthens intra-EU trade. Energy efficiency standards are developed through extensive
product studies, by examining market data, technological status and recommendations for the
European Commission. Stakeholders are actively included in the product studies.
The Energy Labelling Directive (2010/30/EU, ELD) introduced a coloured EU Energy
Efficiency Label to inform consumers on the energy efficiency of energy-related products. In
principle, the directive covers all energy-related products. Such products include home
appliances, as well as products for commercial applications and products which themselves do
not consume energy, but significantly influence energy consumption (e.g. windows or tyres).
Energy efficiency policies in Germany date back several decades. The first laws on efficiency in
buildings were passed in 1976 in response to the first oil price crisis. Today, energy efficiency policies
are embedded in the so-called energy transition (Energiewende) which was initiated in Germany in
2010. The concept of the energy transition implies a comprehensive transformation of energy supply
and use. The initial document was the Energy Concept 2010, which formulated guidelines for an
environmentally-friendly, reliable, and affordable energy supply and a pathway for a new age of
renewable energies. While the Energy Concept formulated a long-term phase-out of non-renewable
energies, it also proposed longer lifetimes of nuclear power plants. In the wake of the Fukushima
accident, however, the German government changed its position on nuclear power plants and decided
to immediately shut down eight nuclear power plants and proceed with the phase out of all nuclear
power by 2022. So far, the focus of the energy transition debate has been on the phase out of
nuclear power stations, the expansion (and the costs) of renewable energies, the associated
requirements for energy infrastructure, and the role of conventional power, especially coal fired
power plants, in the energy mix. Besides the generation of renewable energies, energy efficiency is
considered the second pillar of the energy transition.
The German energy transition comes with ambitious climate and energy goals until 2050 that are laid
out in the Energy Concept. By 2050 Germany wants to cut CO2 emissions by 80 to 95%, boost
renewables to a share of 80% in electricity and reduce primary energy consumption by 50% until
2050 (compared to 2008) (cf. BMWi/BMU 2010). According to the International Energy Agency (IEA),
energy efficiency plays a key role in contributing to CO2 emission reductions, approximately 49%
2 ‘nearly zero-energy building’ (NZEB) are defined by the EPBD as “a building that has a very high energy performance […]. The nearly zero
or very low amount of energy required should be covered to a very significant extent by energy from renewable sources, including energy
from renewable sources produced on-site or nearby.
EPODE17393 21
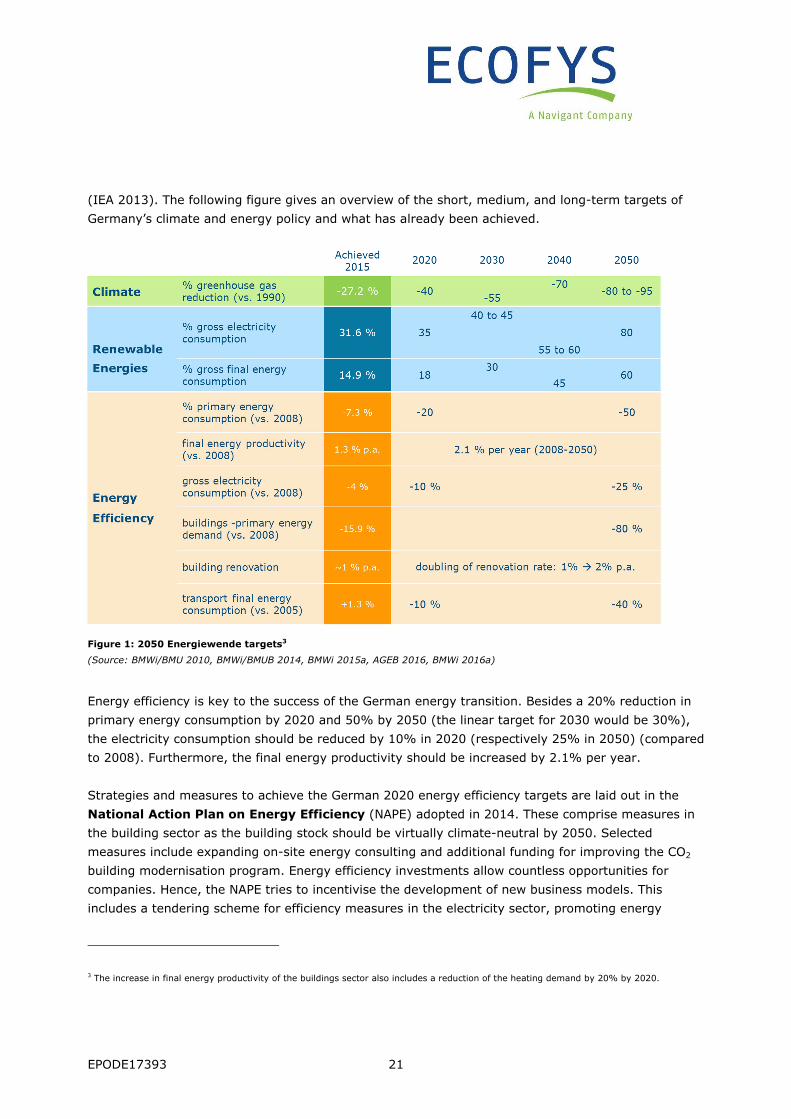
(IEA 2013). The following figure gives an overview of the short, medium, and long-term targets of
Germany’s climate and energy policy and what has already been achieved.
Figure 1: 2050 Energiewende targets3
(Source: BMWi/BMU 2010, BMWi/BMUB 2014, BMWi 2015a, AGEB 2016, BMWi 2016a)
Energy efficiency is key to the success of the German energy transition. Besides a 20% reduction in
primary energy consumption by 2020 and 50% by 2050 (the linear target for 2030 would be 30%),
the electricity consumption should be reduced by 10% in 2020 (respectively 25% in 2050) (compared
to 2008). Furthermore, the final energy productivity should be increased by 2.1% per year.
Strategies and measures to achieve the German 2020 energy efficiency targets are laid out in the
National Action Plan on Energy Efficiency (NAPE) adopted in 2014. These comprise measures in
the building sector as the building stock should be virtually climate-neutral by 2050. Selected
measures include expanding on-site energy consulting and additional funding for improving the CO2
building modernisation program. Energy efficiency investments allow countless opportunities for
companies. Hence, the NAPE tries to incentivise the development of new business models. This
includes a tendering scheme for efficiency measures in the electricity sector, promoting energy
3 The increase in final energy productivity of the buildings sector also includes a reduction of the heating demand by 20% by 2020.

EPODE17393 22
performance contracting with energy saving guarantees and a focus on heat recovery. Furthermore,
consumers are empowered to conserve more energy. Measures for this include energy efficiency
networks for industry to share best practices, highlighting energy-efficiency products (“National Top
Runner Initiative”), and labelling old, inefficient heating systems to promote replacement. The NAPE
is part of the Climate Action Program 2020, which offers additional policy measures to enhance
climate mitigation. To increase participation by responsible stakeholders and civil society, an energy
efficiency platform and other stakeholder dialogues were initiated by the government. The central
financing instrument of energy efficiency measures is the energy and climate fund, which is fed by
public funds and revenues of the EU emission trading system (BMWi 2016b).
Within the EU the "energy efficiency first" principle is a key element of energy policy. In 2016, the
German Ministry for Economic Affairs and Energy (BMWi) published the Green Paper on Energy
Efficiency (Grünbuch Energieeffizienz), which initiates public dialogue on additional efficiency
measures and thereby prioritises the principle of energy efficiency first in Germany. This principle
means considering the potential value of investing in energy efficiency in all decisions on energy
system development. Where efficiency improvements are shown to be most cost-effective, they
should be prioritised over any investment in new power generation, grids or pipelines, or fuel
supplies.
In November 2016, the Climate Action Plan 2050 was adopted. It is the first official document that
describes the path to a nearly greenhouse gas neutral Germany in 2050. The plan comprises
greenhouse gas reduction targets for the different sectors for the first time and provides guidance for
strategic decisions in the coming decade. The following table shows the different greenhouse gas
reduction targets of the sectors until 2030.
Figure 2: GHG reduction targets of different sectors until 2030
(Source: BMUB 2016a)

EPODE17393 23
The German energy transition is accompanied by a comprehensive monitoring process called the
“Energy of the Future”4. This monitoring process is accompanied by an annual Climate Protection
Report that evaluates the energy and CO2 savings achieved by each measure.
Two important cross sectoral policy measures are energy taxation which applies to all sectors and
the Emissions Trading Scheme which impacts the industry and transport sectors. Both measures
are regulated at EU level by the Energy Taxation Directive (2003/96/EC) and the Emission Trading
Directive (2003/87/EC) respectively.
The energy tax is a consumption tax on the use of fossil resources and electricity. Different tax rates
apply to different energy carriers. Tax rates can be found under §2 of the law (Energiesteuergesetz,
EnergieStG). Until 31.12.2018, lower tariffs apply to the use of natural gas. Industrial producers in
general pay a reduced tariff. Compared to other European countries, German electricity prices are
among the highest (Eurostat 2017). Nevertheless, a number of environmentally harmful subsidies
exist. Low electricity prices reduce the incentive to save energy.5 These include tax breaks for
industrial companies and free allocation of CO2-emission allowances. According to the Electricity Tax
Law (Stromsteuergesetz, StromStG) the tax is fully reimbursed for electrolysis, glass, ceramics,
cement, lime, metals, fertilisers and chemical reduction methods. The company pays the tax in full
and then applies for a complete reimbursement for the electricity used in eligible processes.
Under the Emissions Trading System (ETS), installation operators had to reduce their greenhouse
gas emissions by 57 million tonnes annually in the second trading period (2008-2012). Compared to
the first trading period (2005-2007), the amount of emission allowances was reduced by more than
7% (BMUB 2016b). The ETS only has a secondary effect on energy efficiency. The increase in the
price of CO2-intensive energy is an incentive to implement greenhouse gas mitigation measures,
which can also reduce energy consumption. However, the effect is small due to low certificate prices.
2.2 Energy efficiency governance
To achieve the objectives of the German Energiewende, an effective and good governance is an
important prerequisite. On the national level, six ministries have relevant jurisdiction concerning the
Energiewende. The three most important actors are the Federal Ministry of Economic Affairs and
Energy (BMWi), the Federal Ministry for the Environment, Nature Conservation, Building and Nuclear
Safety (BMUB) and the Federal Ministry of Transport and Digital Infrastructure (BMVI).
4 Annual reports are published as well as strategic progress reports every three years. The first progress report was published in 2014 (BMWi
2014b). 5 For a detailed assessment of environmentally harmful subsidies in Germany see: UBA (2014): Fachbroschüre Umweltschädliche
Subventionen in Deutschland. Aktualisierte Ausgabe 2014.

EPODE17393 24
As Germany has a federalist system, the sixteen states (Bundesländer) additionally operate
autonomously on subjects such as state support schemes, land-use planning and permitting
procedures.
Besides the national and federal ministries, other governing bodies support the Energiewende. For
energy efficiency policies, important bodies are the Federal Office of Economics and Export Control
(Bafa) and the federal government’s KfW investment bank, which are responsible for various support
schemes, and the German Energy Agency (dena), which provides expertise and awareness raising to
support the implementation of energy efficiency measures. The dena also provides a list of qualified
energy consultants and energy efficiency experts for energy efficiency measures in the building and
industrial sector. Furthermore, consumer protection agencies provide advice and information on
energy efficiency policies and measures.
Additionally, Germany installed the so-called “Energy and Climate Fund”. To accelerate the
Energiewende, the German Government earmarks three billion Euros annually for the fund. With the
Energy and Climate Fund various energy efficiency research, building renovation and energy advice
programmes are financed (BMWi 2016b).
2.3 Energy statistics and energy efficiency developments
To fully understand the German context surrounding energy efficiency, it is necessary to not only look
at the policy landscape, but have an overview of relevant indicators. The following section presents
indicators and trends about Germany and of each of the four sectors buildings, appliances, industry,
and transport.
Germany has a population of 82 million and is the largest economy in Europe and the fourth largest
economy in the world. Primary energy consumption in 2016 totalled 13,400 PJ (BMWi 2017a,
p.12). Compared to the year 2008, Germany reduced its primary energy consumption by 1,000 PJ,
which is larger than Portugal’s entire primary energy consumption in 2016. Out of 13,300 PJ in
primary energy in 2015, ca. 8,900 PJ (70%) in final energy remained, due to conversion losses
during power generation and transmission of ca. 30%.
Primary energy consumption in 2016 was comprised of 34% oil, 22.7% gas, 12.6% renewables,
12.2% black coal, 11.4% lignite and 7.5% nuclear energy. While the percentage of other energy
carriers for primary energy consumption decreased from 2014 to 2016, oil, gas, and renewables
increased their shares. The following table shows the developments of primary energy consumption
from 1990 until 2016 including future milestones in 2020 and 2050.

EPODE17393 25
Figure 3: Development of primary energy consumption per energy carrier
(Source: UBA 2017 in BMWi 2017a, p. 13).
The figure below shows the development of final energy consumption per sector. In 2015, the
transport sector consumed 29.5% (2,616 PJ) of final energy, the industrial sector used 29% (2,576
PJ), households used 25.8% (2,289 PJ) while the service sector consumed 15.7% (1,393 PJ).

EPODE17393 26
Figure 4: Development of final energy consumption per sector
(Source: UBA 2017 in BMWi 2017a, p. 18)
In 2015, final energy consumption totalled 8,877 PJ, the largest portion of which was oil 37%,
followed by gas 24%, electricity 21%, renewables 6.9%, black coal 4.2%, and lastly lignite and other
sources at less than 1% each. With the exception of transport, the absolute consumption in
households, industry, and trade and services has decreased since 1990 (as of 2015).
Gross annual electricity generation now hovers around the levels achieved in the years 2006,
2007, 2008. In 2016, electricity production stemmed from coal (17.2%), lignite (23.1%), oil (0.9%),
gas (12.4%), nuclear energy (13%), renewables (29%) and other sources (4.2%).

EPODE17393 27
Figure 5: Gross electricity generation in Germany in 2016 in TWh
(Source: BMWI 2017c)
Energy efficiency has also, with a few exceptions, risen since 1990. Primary energy consumption per
capita has dropped from 187 GJ/capita in 1990 to 162 in 2015. Energy productivity, the real gross
domestic product (GDP) per unit energy consumption, has increased by more than 53.6% since
1990. The average annual increase from 1990 to 2015 was 1.7% per year. While GDP has increased
by 43.9% during that time, energy consumption was reduced by 6.3%. The following table shows the
development of final energy consumption and energy productivity between 1990 and 2015.

EPODE17393 28
Figure 6: Final energy consumption and energy productivity
(Source: UBA 2017 in BMWi 2017a, p. 17)
The largest share of final energy consumption (3,441 PJ, 38.8%) was used in the production of
mechanical energy, followed by space heating (2,408 PJ, 27.1%) and process heat 1,917 PJ (21.6%).
2.4 Energy efficiency potentials in Germany
This chapter gives an overview of the size of the cost-effective, energy end-use efficiency potential
across sectors in Germany. More details of the potentials in the respective sectors are shown in the
sector specific chapters 3 to 7. The analysis is based on data of saving potentials until 2030 (cf.
Fraunhofer ISI, TU Vienna, PwC 2014a). This is one of the most current potential studies available for
Germany. Further potential studies are available such as ifeu, Fraunhofer ISI, et al. 2011; Fraunhofer
ISI, Ecofys et al. 2012; Fraunhofer ISI, Prognos et al. 2014, however, they are based on different
time horizons, assumptions, baselines and other indicators.
The academic literature distinguishes four different types of potentials. These are the physical,
technical, economic and achievable potential. The physical potential gives an estimate of the
theoretically possible savings. The technical potential considers the technical engineering limitations.
The economic potential considers economic restrictions in addition to the technical limitations and
makes assumptions about the lifetime of measures and opportunity costs. The achievable potential
describes the potential that can be realistically achieved by a very aggressive intervention. In
EPODE17393 29
addition to economic restrictions achievable potential also considers information deficits,
organisational obstacles (user/investor dilemma) and other barriers to implementation that cannot
fully be overcome by policies.
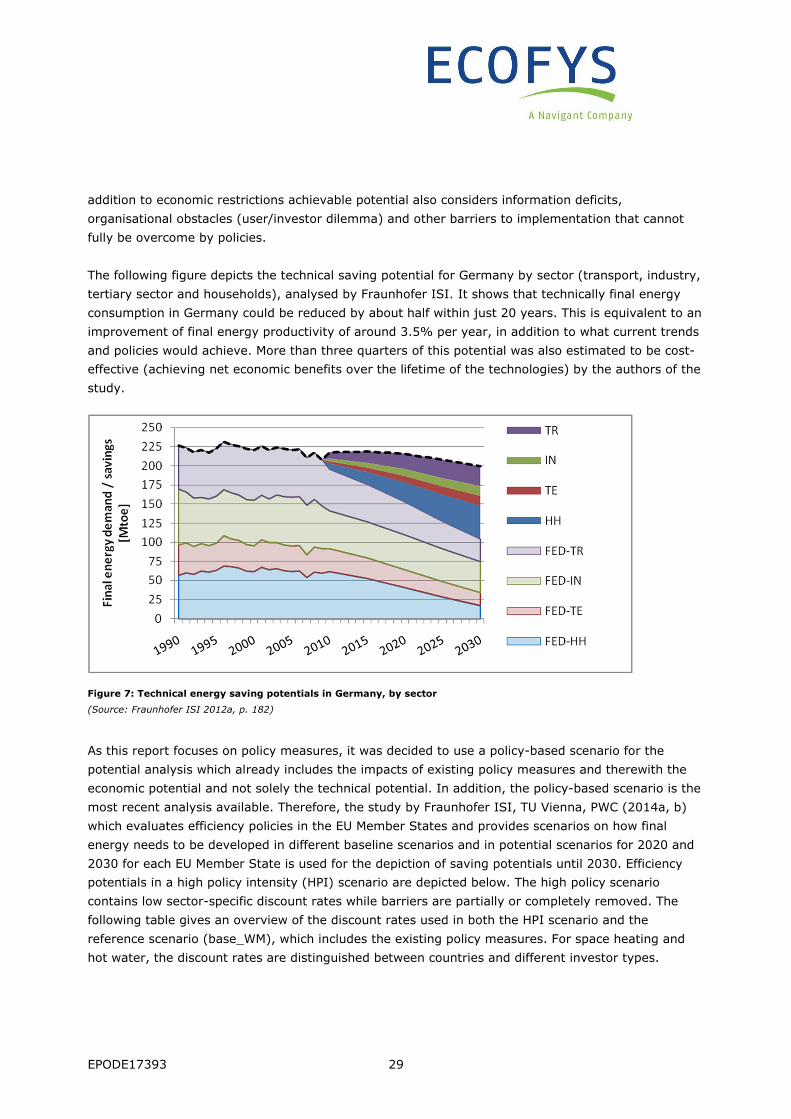
The following figure depicts the technical saving potential for Germany by sector (transport, industry,
tertiary sector and households), analysed by Fraunhofer ISI. It shows that technically final energy
consumption in Germany could be reduced by about half within just 20 years. This is equivalent to an
improvement of final energy productivity of around 3.5% per year, in addition to what current trends
and policies would achieve. More than three quarters of this potential was also estimated to be cost-
effective (achieving net economic benefits over the lifetime of the technologies) by the authors of the
study.
Figure 7: Technical energy saving potentials in Germany, by sector
(Source: Fraunhofer ISI 2012a, p. 182)
As this report focuses on policy measures, it was decided to use a policy-based scenario for the
potential analysis which already includes the impacts of existing policy measures and therewith the
economic potential and not solely the technical potential. In addition, the policy-based scenario is the
most recent analysis available. Therefore, the study by Fraunhofer ISI, TU Vienna, PWC (2014a, b)
which evaluates efficiency policies in the EU Member States and provides scenarios on how final
energy needs to be developed in different baseline scenarios and in potential scenarios for 2020 and
2030 for each EU Member State is used for the depiction of saving potentials until 2030. Efficiency
potentials in a high policy intensity (HPI) scenario are depicted below. The high policy scenario
contains low sector-specific discount rates while barriers are partially or completely removed. The
following table gives an overview of the discount rates used in both the HPI scenario and the
reference scenario (base_WM), which includes the existing policy measures. For space heating and
hot water, the discount rates are distinguished between countries and different investor types.

EPODE17393 30
Table 1: Overview of discount rates used
Sector Scenario Discount rates
Households – space heating and hot water
HPI, base_WM 3.1% to 3.7%
Tertiary – space heating and hot water
HPI, base_WM 4.7% to 5.4%
Household - appliances HPI 2% (assuming removal of barriers from 2020)
Tertiary – appliances base_WM HPI
30% 5%
Industry HPI Payback up to 5 years accepted by 60% of companies; heating systems 15%
Transport N/A N/A
(Source: Fraunhofer ISI, TU Vienna, PWC 2014a, p. 89)
The high policy intensity scenario shows economic potentials that require ambitious efficiency policies
to be realised. It is evaluated against a baseline scenario (“baseline with measures” base_WM), which
includes measures that have been implemented in 2014 or were about to be implemented
(Fraunhofer ISI, TU Vienna, PWC 2014a, p. 82f.).6 By calculating the difference between the two
scenarios, the efficiency potentials that are deemed achievable through the additional policies
assumed for the HPI scenario until 2030 can be estimated.
To ensure comparability with the PRIMES projects, drivers such as the international fuel prices, the
energy wholesale prices, the number of dwellings and the carbon prices were adapted from PRIMES
2013 in the scenario. Based on the international fuel prices and country-specific electricity wholesale
prices, the end-use energy prices were projected based on historical country- and sector-specific tax
rates. The following table gives an overview of international fuel prices.
Table 2: International fuel prices (in €'10 per boe)
Fuel 2010 2015 2020 2025 2030
Oil 60.0 86.0 88.5 89.2 93.1
Gas 37.9 53.8 61.5 58.9 64.5 Coal 16.0 22.0 22.6 23.7 24.0
(Source: PRIMES 2013)
Total savings potential for all sectors, including transport, until 2030 is estimated at 1158 PJ final
energy (Fraunhofer ISI, TU Vienna, PwC 2014b, p. 25). The largest savings potential lies in the
buildings sector with 417 PJ, corresponding to about 36% of the total savings potential. This is
equivalent to 19% of the energy consumption in the baseline scenario. The transport sector has a
6 The following models were used in the study to estimate savings: INVERT/EE_Lab for buildings, FORECAST for the industrial, residential
and service sectors and the ASTRA model for the transport sector.

EPODE17393 31
savings potential of 275 PJ which is equivalent to 14% of the baseline scenario. The appliances and
the industry sector have savings potentials of 244 PJ and 222 PJ respectively, which are equivalent to
19% and 10% of energy savings. Figure 8 presents these potentials by sector, while Figure 43 in the
comparison part of this study compares the base year consumption, the baseline scenario, and the
HPI scenario.
It should be noted that this is only a part of the technical energy efficiency potential that would exist
until 2030 (cf. figure 7), and that further energy efficiency potential exists until 2050. Especially in
the buildings sector, renovation cycles providing opportunities to achieve energy efficiency potentials
are often 30 to 40 years long. The report on GJETC Strategic Topic 1 provides more data on energy
efficiency potentials and energy demand modelled in scenarios for 2050.
Figure 8: Energy saving potentials in Germany from ambitious new policies vs. existing policies until 2030 (in PJ)
(Source: Fraunhofer ISI, TU Vienna, PwC 2014b)

EPODE17393 32
3 Buildings
� The buildings sector must be virtually climate neutral by 2050. To reach this target,
renovation rates need to be doubled.
3.1 Energy statistics and developments
The buildings sector in Germany is responsible for 35% of final energy consumption and one third of
greenhouse gas emissions. The final energy consumption of households totalled 2,289 PJ in 2015.
The share of renewable energies in the heating sector is about 13.4% (BMWi 2017a). In Germany
about 5.5 million apartments are connected to district heating, especially in the larger cities in the
north and east of Germany. This corresponds with approximately 13.5% (2015) of heat supply (bdew
2016).
The average household in Germany is composed of 2.01 people and with the exception of 2012, the
number of households has risen consistently since 1990, reaching 40.3 million in 2015 (Eurostat
2016). The housing stock and amount of living space has also increased steadily since 1990. The
living space per inhabitant increased only between 2000 and 2014 from 39.5 m² to 46.5 m². One
reason for this was the increase in one-person households, but also the tendency to remain in larger
family homes in old age.
The efforts of the German government to develop energy efficiency policies and measures in
buildings used to be predominantly focused on residential buildings as data on non-residential
buildings was largely absent (BMWi 2014a). In recent years, however the German Government has
made considerable efforts to improve the data on the non-residential building stock and also
introduced more policies targeting it, e.g. with financial support for energy advice and energy
efficiency investments.
The German building stock is quite old, which leads to the fact that out of the 19 million residential
buildings with ca. 40 million apartments, 50% have to be renovated in the next 20 years (BMWi
2017b).

EPODE17393 33
The following figure gives an overview of the distribution of the building stock per age of the building
Figure 9: Distribution of the building stock per age of building
(Source: Wohnen und Bauen in Zahlen in BMWi 2014a)
The structure of the buildings sector is very heterogenous, with 83% of the residential building stock
being comprised of one-and two-family houses. Multi-family dwellings only make up 3 million of the
building stock, yet 53% of all apartments. Additionally, the building market in Germany is dominated
by renters, which traditionally make up close to 60% of the population, while 40% own an apartment
or a house (Destatista 2013). This is an important factor to consider for energy efficiency
improvements in the existing building stock as the split incentive between landlord and tenant has a
large effect. This barrier is discussed in section 3.3.
Compared to the residential building stock, estimates on the total number of non-residential buildings
vary. Without buildings for the industrial sector, the total number of non-residential buildings is
assumed to be 2.7 million (dena 2015). Industrial buildings are estimated to be around 300,000 to
600,000. Additionally, 3.8 million buildings have a mixed usage. A large share of the non-residential
building stock is also rather old. It is estimated that 80% of buildings used for commerce are older
than 40 years. Due to the economic revival after the reunification of Germany in 1990, more than
38,000 new non-residential buildings were built annually until 2005. After 2005, this rate declined
and remains constant at around 27,500 since 2013 (dena 2015). In total, non-residential buildings
are responsible for around 37% of the energy demand within the building stock.

EPODE17393 34
3.2 Potentials
As new-build rates are quite low in Germany (between 0.5 and 1% per year relative to the existing
stock) and the stock is quite old, most potential rests with renovation of the existing stock. The
technical and economic potential is high. In Germany’s heating-dominated climate, new very energy-
efficient buildings, such as Passive Houses, now need around 90% less heating energy than before
1970 vintages (cf. Figure 10 below which shows ‘Research (Model projects)’ with building concepts
achieving zero or below net heat demand while relying on building-integrated renewable energies to
cover the remaining 10% of heat demand). Although this cannot normally be achieved in renovation
of existing buildings, there are model projects achieving up to 80 or 90 % savings at least in primary
energy for heating and cooling, and more than 50% is easily achieved in most pre-1970 buildings7.
The energy savings potential that can be achieved with additional policies relative to the baseline in
the building sector until 2030 is estimated at 417 PJ. This is split into 332 PJ for residential buildings
and 85 PJ for tertiary buildings (Fraunhofer ISI, TU Vienna, PwC 2014b, p. 25), of which 75% can be
realised by renovating existing buildings. The HPI scenario assumes renovation rates from 1.4% to
2.5%8. The share of renovation depth in total renovation activities is presented in the following
table.9
Table 3: Share of renovation depth on total renovation activities in 2030
Building Type Base_WM HPI 2030
Residential
Share of standard renovation 65% 25%
Share of ‘deeper’ renovation 21% 32%
Share of ambitious renovation 15% 43%
Tertiary
Share of standard renovation 72% 33%
Share of ‘deeper’ renovation 16% 24%
Share of ambitious renovation 13% 43%
The following table shows the estimated energy consumption in the baseline scenario, the high policy
intensity scenario as well as the resulting absolute and relative potentials for energy savings.
7 Cf, eg, the database of the German energy agency at https://effizienzhaus.zukunft-haus.info/effizienzhaeuser/ 8 All values average from 2008-2030, differing between building categories. 9 Numbers were rounded. ‘Deep’ renovation means very energy-efficient renovation.

EPODE17393 35
Table 4: Energy saving potentials in the buildings sector until 203010
Building type
Energy saving measures/technologies
Energy consumption Base_WM in 2030 (in PJ)
Energy consumption HPI in 2030 (in PJ)
Absolute energy savings until 2030 (in PJ)
Relative Energy Savings until 2030
Residential
New buildings 118 93 26 22%
Existing buildings 1266 990 276 22%
Hot water 288 250 38 13%
Tertiary
New buildings 38 32 6 15%
Existing buildings 446 374 72 16%
Hot water 61 55 6 10%
Total 2217 1794 424 19%
3.3 Barriers
In the buildings sector, financial and informational barriers present a large obstacle for realising
energy efficiency. For many market players, energy consumption is not yet an important decision
criterion, which often leads to sub-optimal actions and therewith lock-in effects. Underlying reasons
are a lack of awareness, anticipated inconvenience during the renovation period or lacking visibility of
energy efficiency technologies. Property owners often have insufficient knowledge of energy savings
potentials and are not certain whether renovation measures will bring the anticipated savings. This is
often aggravated by the split incentive between landlord and tenant. Additionally, measures in the
building sector are very costly and access to loans is associated with administrative effort. The
following table summarises main existing barriers (cf. Fraunhofer ISI, Ecofys, Öko-Institut, IREES
2016):
10 Saving potentials include heating and hot water, but not lighting and ventilation. Lighting and ventilation are counted towards appliances
for residential buildings and in industry for tertiary buildings.
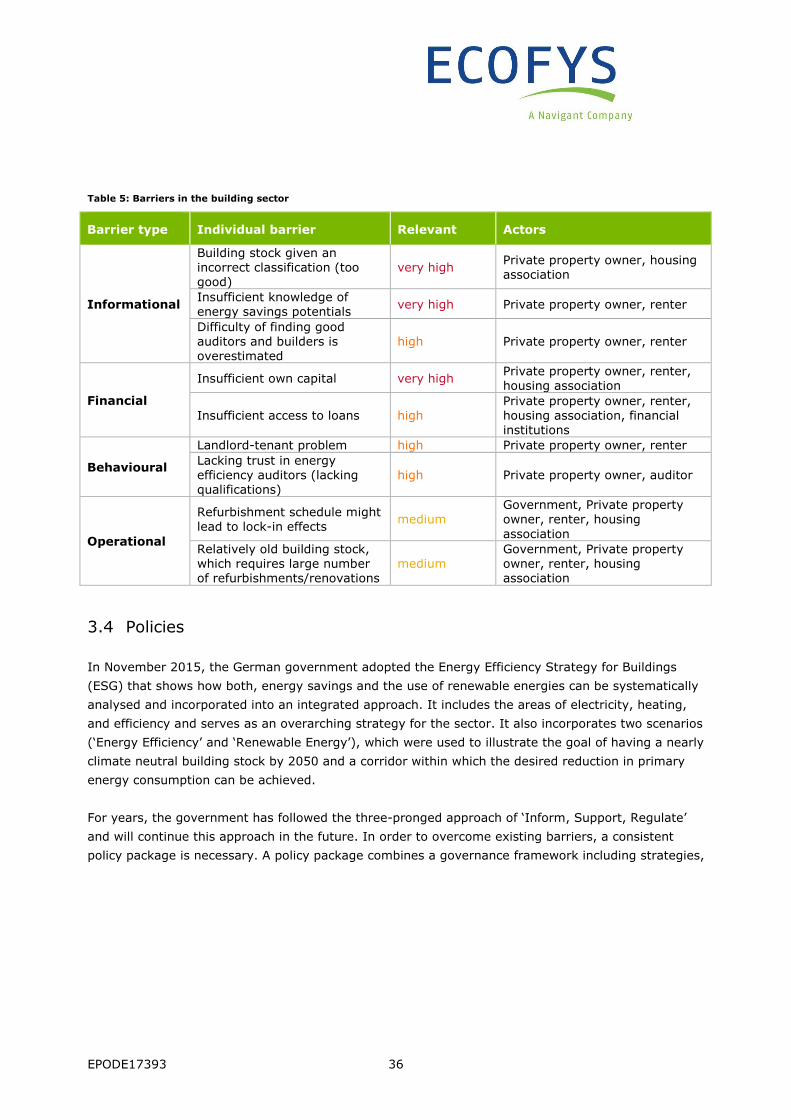
EPODE17393 36
Table 5: Barriers in the building sector
Barrier type Individual barrier Relevant Actors
Informational
Building stock given an incorrect classification (too good)
very high Private property owner, housing association
Insufficient knowledge of energy savings potentials
very high Private property owner, renter
Difficulty of finding good auditors and builders is overestimated
high Private property owner, renter
Financial
Insufficient own capital very high Private property owner, renter, housing association
Insufficient access to loans high Private property owner, renter, housing association, financial institutions
Behavioural
Landlord-tenant problem high Private property owner, renter Lacking trust in energy efficiency auditors (lacking qualifications)
high Private property owner, auditor
Operational
Refurbishment schedule might lead to lock-in effects
medium Government, Private property owner, renter, housing association
Relatively old building stock, which requires large number of refurbishments/renovations
medium Government, Private property owner, renter, housing association
3.4 Policies
In November 2015, the German government adopted the Energy Efficiency Strategy for Buildings
(ESG) that shows how both, energy savings and the use of renewable energies can be systematically
analysed and incorporated into an integrated approach. It includes the areas of electricity, heating,
and efficiency and serves as an overarching strategy for the sector. It also incorporates two scenarios
(‘Energy Efficiency’ and ‘Renewable Energy’), which were used to illustrate the goal of having a nearly
climate neutral building stock by 2050 and a corridor within which the desired reduction in primary
energy consumption can be achieved.
For years, the government has followed the three-pronged approach of ‘Inform, Support, Regulate’
and will continue this approach in the future. In order to overcome existing barriers, a consistent
policy package is necessary. A policy package combines a governance framework including strategies,

EPODE17393 37
concepts, institutions and all types of policies (regulatory, financial, information, capacity building,
research and development).11
By combining both energy savings and the use of renewable energies, Germany aims to achieve an
80% reduction in primary energy consumption of buildings by 2050. The instruments currently used
in this realm have, for the most part, reached out to building owners and created incentives for
energy saving construction investments. The success of Germany’s approach can be seen in the fact
that absolute energy consumption is declining and facilitating the decoupling of building use and
energy consumption. In addition, the increase in the share of renewables in final energy consumption
has and will continue to significantly reduce carbon emissions in Germany’s buildings sector. Despite
these advancements further measures and instruments are needed to meet the ambitious goals. The
challenge Germany faces is to successfully meet its Energiewende targets while at the same time
addressing increased demand for affordable housing and ensuring that the solutions implemented are
feasible and affordable.
The Energy Efficiency Directive and the German Energy Service Law (EDL-G) confer a special role in
the improvement of energy efficiency to the public sector. Therefore, economic energy efficiency
measures, which lead to comprehensive energy savings in the shortest possible time, have to be
implemented by the public sector. Although the public sector accounts for a relatively small share of
the total final energy consumption, there are considerable energy savings potentials, for example, in
the areas of energy efficient renovation of public buildings. In Germany, which is comprised of 16
federal states and some 11,000 municipalities, along with the Confederation, the former are of great
importance in increasing energy efficiency. All sub-national units combined account for about two-
thirds of the total energy consumption of the public sector. In 2011, the public sector was responsible
for 11.6% of investment in buildings (BfEE 2017a).
11 More detailed analyses on how to address barriers can be found at http://www.bigee.net/, or Ecofys, Wuppertal Institut, Ifeu (2017):
Weiterentwicklung der Energieeffizienzpolitiken zur Erreichung der Klimaschutzziele der Europäischen Union bis 2050. For
Umweltbundesamt.

EPODE17393 38
The following table gives an overview of the main policy instruments in the building sector and
indicating the type of measure. The measures are further described below:
Table 6: Overview of policy measures in the building sector
Type National-level Instrument
Regulatory
Energy Conservation Act (EnEG) / Energy Conservation Ordinance
(EnEV)
Renewable Energies Heat Act (EEWärmeG)
Heating Cost Ordinance
Tenancy law (rent increases allowed following modernisation)
Financial
Energy efficient buildings: CO2-Building Renovation and New Build
Programme – KfW support programmes and “Renewable energy”
Market Incentive Programme
KfW-Programme: Energy efficient building and refurbishing (non-
residential buildings)
“Energy Efficiency” Market Incentive Programme
Tax deductibility of craftsmen’s bills
Subsidies for Informational measures: On-site consulting, energy
check
Informational
Energy Performance Certificates
National heating label
“Energy-saving meters” pilot programme
Research & Development
The “Energy in buildings and neighbourhoods” research network
The Energy-Optimised Building (EnOB) research initiative
The EnEff:Stadt/Wärme (energy-efficient city/heat) research
initiative
The “Energy in buildings and neighbourhoods” research network
Regulatory instruments
Energy Conservation Act (EnEG) / Energy Conservation Ordinance (EnEV): Both of these pieces of
legislation are key instruments of the German government’s energy efficiency policy and address
state of the art energy-savings requirements for buildings. The revised version of the EnEV entered
into effect on 1 May 2014. One of the requirements contained in this legislation is the decrease in the
maximum allowed primary energy demand for new buildings by 25% on average, which is effective
as of 1 January 2016. The allowed primary energy demand is compared to a “reference house” with a
specific floor area, window size etc. For example, primary energy consumption of a one family house
is approx. 56-96 kWh/m²a, of multi-family house ca. 60 kWh/m²a. This requirement is a

EPODE17393 39
transposition of EU’s Energy Performance of Buildings Directive and represents a step towards the
nearly zero-energy building standard, which according to the EPBD, will be standard for new public
sector buildings in 2019 and all buildings in 2021.12 Through the implementation of the EnEV it is
expected to achieve final energy savings of 103 PJ (cumulative for 2014-2020) for new buildings and
316 PJ for existing buildings (see NEEAP 2017). The effectiveness of the EnEV requirements for new
buildings is considered as high.
Renewable Energies Heat Act (EEWärmeG): Since coming into effect on 1 January 2009, the
EEWärmeG has required building owners to meet a portion of the heat demand of new buildings with
any form of renewable energy. The public sector is required to use renewables in large-scale
renovations of its building stock. Through this law the share of renewable energy in heating and
cooling should be increased to 14% by 2020. Through the implementation of the EEWärmeG it is
expected to achieve final energy savings of 24 PJ (cumulative for 2014-2020) (see NEEAP 2017).
Heating Cost Ordinance: This ordinance is part of energy saving legislation and regulates the
metering, distribution and accounting of heating costs and hot water between tenants and landlords.
The introduction of the Heating Cost Ordinance has contributed towards an average reduction in
energy consumption of around 15%. Efforts are currently underway to examine the extent to which
updating and upgrading the rules for accounting and/or user information, whilst fulfilling the
requirement of economic efficiency, can make a reasonable contribution towards energy savings
above and beyond this level.
Tenancy law: The right to increase rents after modernisation (section 559 of the German Civil Code
(BGB)) is an important economic precondition for energy-saving modernisation of existing leasehold
property. A revision of the option to increase rents after modernisation must ensure that housing
remains affordable for the tenants on the one hand and that incentives for landlords to invest are not
reduced on the other.
Financial instruments
“Energy efficient buildings”: Since May 2017, the following two programmes (CO2 building renovation
programme and “Renewable energy” Market Incentive Programme) have been combined under the
programme “Energy efficiency buildings”. According to the principle - the more ambitious the
investment, the more attractive the subsidy, there are subsidies for the "easy entry" into energy
saving measures, as well as for holistic, comprehensive renovation measures.
CO2 building renovation programme: The CO2 building renovation programme is a central
promotional instrument for energy saving and climate protection in the buildings sector. Funds
from the CO2 building renovation programme are used to finance promotional programmes of
12 See also Example 1: Energy Savings Ordinance for further information (Figure 10).

EPODE17393 40
KfW for energy-efficient building and renovation. Funds are available for new buildings and
comprehensive renovation with the aim of achieving the so-called KfW Efficiency House
standard as well as energy-efficient individual measures in existing buildings.13 The promotional
standards of these programmes go significantly beyond the requirements of the energy saving
legislation. The CO2 building renovation programme also provides special promotional rates for
best practice projects (for instance, via model projects). The Federal Government uses the
promotional lever that is available in this respect in order to speed up the dissemination of
efficient and innovative projects, such as the KfW energy-efficient buildings 40 and 55.14
“Renewable energy” Market Incentive Programme: The Market Incentive Programme is a
central instrument designed to promote renewable energy in the heat area. Since 2009, the
support programme has been anchored in section 13 of the Renewable Energies Heat Act which
provides for support for renewable energy for heating and cooling. The programme contributes
to increasing the share of renewable energy in the heat sector to 14% by the year 2020 and is
additionally making an important contribution towards achievement of the goal of a virtually
climate-neutral building stock by 2050. The Market Incentive Programme promotes, for
instance, solar panel installations, biomass plants, heat pumps, deep geothermal energy plants,
heat grids fed from renewable energy as well as large heat storage systems for renewable
energy. The amended Market Incentive Programme came into effect on 1 April 2015 and sets
forth new and improved conditions for support.
KfW-Energy efficient constructing and refurbishing for non-residential buildings: KfW makes
loans up to 25 million EUR available for building and renovation of non-residential buildings.
“Energy Efficiency” Market Incentive Programme: The “Energy Efficiency” Incentive Programme
replaces the tax support scheme for energy-efficiency building renovation measures that was
originally planned in the National Action Plan on Energy Efficiency (NAPE). The support volume totals
EUR 165 million per annum. The programme supports: the introduction to market of innovative fuel
cell heating systems; the installation of ventilation systems in conjunction with measures for the
building envelope in order to avoid damage to the building (for instance mould); and the replacement
of inefficient heating systems with efficient ones. This includes measures to optimise the heating
system (heating and heat distribution) which address the entire efficiency potential of the heating
system, as well as a quality, efficiency and outreach initiative. The programme is expected to achieve
18 PJ in final energy savings (cumulative 2014-2020) (see NEEAP 2017).
13 See also Example 2: KfW programmes, Figure 12 14 The Energy Saving Ordinance sets the benchmark for the ‘KfW Efficiency House 100’. However, it is possible to build houses that are even
more energy efficient. While a ‘KfW Efficiency House 100’ meets all of the statutory minimum requirements; an ‘KfW Efficiency House 70’
needs no more than 70% of the energy a ‘KfW Efficiency House 100’ would need. A ‘KfW Efficiency House 55’ needs even less than that,
namely 55% of the ‘KfW Efficiency House 100’. KfW provides funding for the construction of new residential buildings that meet the ‘KfW
Efficiency House 40, 55 or 70’ standards.
EPODE17393 41
Tax deductibility of craftsmen’s bills: Owner-occupants and tenants can deduct 20% of the labour
costs – maximum of EUR 1,200 – of craftsmen’s bills from their income tax bill (section 35a (3) of the
Income Tax Act (EStG)) unless other public funds were received. Landlords can treat the costs of
energy-saving renovation measures as maintenance costs and thereby reduce their tax bill, often
reducing taxable income by the full amount of such costs.
Financial support for personal energy advice: 60% of the costs for personal energy advice are borne
by the Federal Ministry for Economic Affairs and Energy (BMWi). The funding application is done by
the energy consultant and not the building owner.
Informational instruments
Energy Performance Certificate: The Energy Conservation Ordinance (EnEV) prescribes energy
performance certificates for assessing the energetic status of buildings, whenever these are sold or
rented out. The certificates contain general information on the building, energy sources used for
heating (e.g. gas, oil) and the energy characteristics of the building. New certificates for residential
buildings also have an energy efficiency class from A+ to H. The energy performance certificate
intends to allow comparisons between buildings throughout Germany. However, no direct conclusions
can be drawn about the expected energy consumption and energy costs because many dependent
factors are not reflected in the certificate.
Energy consulting: Various energy consulting providers are available in Germany. Among them are
for example “energy checks”. This is a consulting program, funded by the Ministry for Economic
Affairs and Energy and run by the Federation of German Consumer Organisations, that allows tenants
and house owners to bring in experts to examine their homes for energy conservation opportunities.
Energy checks are free for low-income households. All consulting programmes for the building sector
(including advice for SMEs) are expected to achieve final energy savings of 49 PJ (cumulative for
2014-2020) (see NEEAP 2017).
Heating label: Since autumn 2016, the EU energy label for new heaters is compulsory. The label
indicates the efficiencies of the various options on sale to consumers who want to buy a new heating
system. Additionally, the German government introduced a label for existing old heating systems
which uses the same logic as the labelling method applied to new heaters. Supporting consumers in
the application of the label, a webpage called “Heating Check” was also developed, where consumers
can check the CO2 emission and energy performance of their heating equipment. The programme is
expected to achieve 23 PJ in cumulative final energy savings (see NEEAP 2017).

EPODE17393 42
Main take-away messages
While a variety of subsidy programs and information are available in Germany, the landlord-tenant
problem still represents a major barrier for the renovation of buildings especially given the high share
of renters in Germany.
Additionally, given the old age and, hence, the low energy performance of the large existing building
stock, deep renovations15 are crucial to avoid a “lock in” effect of investments. Currently the
renovation rate of buildings is around 1.1% per year. In order to meet energy efficiency targets, this
rate needs to be increased to 2% or more. The German government has therefore introduced
renovation roadmaps that outline which part of the building best needs to be renovated when.
Nevertheless, in order to achieve renovation rates of 2% per year to reach the efficiency targets for
the building sector, further policy implementation work is crucial.
15 According to a study of the Global Building Performance Network (GBPN) deep renovations in Europe focus on heating, cooling, ventilation
and hot water and define these “deep” renovation as retrofits with at least 75% energy savings.

EPODE17393 43
Example 1: The Energy Saving Ordinance (EnEV)
Germany began to implement building codes as early as the 1970s due to pressures from the oil price
crisis. These standards have been continuously tightened, while remaining technically and
economically achievable, which makes it a best practice example. A comparison of the trajectories of
legal minimum requirements and research activities in the building sector show that research results
were successfully transferred into building practice and led to a continuous decrease in energy
consumption. Already in the early 1980s solar houses were built, progressing into low-energy houses
in the mid-1980s and eventually to 3 litre houses and zero-energy buildings in 1998. ENEV is
expected to achieve final energy savings of 103 PJ (cumulative for 2014-2020) for new buildings and
316 PJ for existing buildings (see NEEAP 2017). The effectiveness of the EnEV requirements for new
buildings is seen as high.
The following figure shows learning curves in the energy efficient buildings sector.
Figure 10: Energy efficiency savings ordinance (Best practice example 1)

EPODE17393 44
Example 2: KfW Programmes
The German state-owned Bank for Reconstruction (“KfW”) manages two
programmes to improve the energy efficiency of German residential buildings: the EEC
(Energy-Efficient Construction) that targets the construction of new buildings and the EER (Energy-
Efficient Refurbishment) that addresses the refurbishment of existing buildings. Both programmes
offer financial products (upfront grants or soft loans, which may have a grant component) to
building owners to overcome economic barriers (e.g. lack of sufficient loan financing or own
upfront capital, short payback expectations) to realising energy-efficient investments.
The amount of funding that is given out is tied to Germany’s Minimum Energy
Performance Standard (also known as energy building codes).
For the refurbishment program, KfW defines six levels of support from KfW Efficiency House 115 to
KfW House 55 (40 kWh/m2a) (incl. KfW Efficiency House Monument). The figures indicate in
percent how much of the maximum primary energy requirement specified by the Energy
Conservation Ordinance (EnEV) the house consumes. The best standard (55) receives the highest
support with a grant of up to EUR 30,000. In order to meet the high energy standard of a KfW
Efficiency House, extensive investments such as the renewal of heating systems, thermal
insulation and replacement of windows, are required. KfW provides funding for the construction of
new residential buildings that meet the ‘Efficiency House 40, 55 or 70’ standards.
Figure 11: Overview of KfW’s financing mechanisms for new and existing buildings
(Source: EEW 2016)
Due to government liabilities, KfW, an AAA-rated bank, can raise capital at low costs. In 2012, the
Government allocated EUR 1.5 billion to finance the grants and reduced interest rates of loans in
the scheme. Additionally, KfW raised EUR 8.4 billion for the efficiency programs. These add up to
EUR 9.9 billion of loans and grants, which leverage another EUR 17.2 billion of investment.
Furthermore, KfW makes use of local commercial bank offices to facilitate loans.

EPODE17393 45
Between 2006 and 2014, 3.8 million homes underwent energy efficiency retrofits or were newly
built in compliance with high energy efficiency standards in Germany. In 2013, the programme
“Energy-efficient Construction” recorded 129,000 subsidy applications. This is more than 50% of
all new residential buildings. Therewith, CO2 savings of 94,000 tonnes of CO2eq or energy savings
of 1.2 PJ were achieved. The programme "Energy-efficient Refurbishment" recorded in the same
period 276,000 subsidy cases, achieving savings of 650,000 tons of CO2eq and 6.3 PJ of energy. In
total, these two programmes save the equivalent of 744,000 tCO2eq/a (BMWi 2015d; Institut
Wohnen und Umwelt, Fraunhofer IFAM 2014).
Tying the funding to the Minimum Energy Performance Standard and the common availability of
funds makes this a best practice example.
Figure 12: KfW Programmes (Best practice example 2)

EPODE17393 46
4 Appliances
� The implementation of the EU Ecodesign and Labelling Directives are the main
regulatory policies for appliances.
4.1 Energy statistics and developments
In German national statistics, appliances are not listed as a separate category, hence, the information
must be compiled from different sources to create a well-rounded picture of this sector. The specific
electricity consumption of most major household appliances in Germany decreased considerably
between 1991 and 2011. However, for TV sets an increasing trend was observed since 2006
accounting for the larger size of TV screens. Currently, nearly 7 million TVs are sold in Germany each
year. More than 99% of all households have a refrigerator.
The following figure shows the specific consumption of new electrical household appliances from
1991-2010.
Figure 13: Specific consumption of new electrical household appliances from 1991-2010
(Source: Fraunhofer ISI 2012b, p. 19)
For the tertiary sector, large energy savings were achieved by improving the heat insulation of
buildings, increasing the automation and process optimisation as well as improving the efficiency of
appliances by modernising machinery and equipment used (UBA 2017).

EPODE17393 47
4.2 Potentials
Looking at residential and tertiary appliances, the total savings potential for 2030 is estimated to be
244 PJ, where slightly more savings can be realised in the tertiary sector (Fraunhofer ISI, TU Vienna,
PwC 2014b, p.25). The following table shows the estimated savings in the baseline scenario, the high
policy intensity scenario as well as the resulting absolute and relative potentials.16
Table 7: Energy savings potentials in appliances until 2030
Energy saving measures/technologies
Energy consumption Base_WM in 2030 (in PJ)
Energy consumption HPI in 2030 (in PJ)
Absolute energy savings until 2030 (in PJ)
Relative Energy Savings until 2030
Residential
appliances
Various household
appliances
(IT appliances, non-IT
electric appliances,
lighting, & non-
electric cooking)
422 309 113 27%
Heating and cooling
technology
(electric cooking and
air conditioning)
65 55 10 16%
Tertiary
appliances
ICT in offices and
data centres 59 56 3 6%
Street lighting 18 12 6 33%
Lighting 139 78 61 44%
Cooking 25 20 5 20%
Refrigeration 56 54 2 4%
Ventilation and air-
conditioning 53 26 28 52%
Others 103 77 26 26%
Total 244 28%
16 Numbers were rounded.

EPODE17393 48
4.3 Barriers
Appliances are regulated EU-wide by the Ecodesign and Energy Labelling Directives. Especially the
Ecodesign Directive involves a large number of stakeholders in the regulatory process, which makes
it more transparent. This also means that tightening product standards takes a long time (cf. Energy
Efficiency Watch 3). Also for some appliances, e.g. in ICT, technological developments are moving
very fast, making it difficult to keep up with adequate standard setting. For purchasing decisions,
energy and water consumption of appliances is only a secondary decision criterion for consumers and
the energy label is often not well understood (BUND 2012). Additionally, the mind-set of consumers
has shifted over the last decades and now products are rarely repaired, but substituted by new often
even bigger appliances (INER 2015). Financial incentives for product replacements for poorer
households are in place, yet further push and pull strategies are to a large extent absent.
Table 8: Barriers for energy efficiency in appliances
Barrier type Individual barrier Relevant Actors
Informational
Lack of product-related consumer advice
very high Government, manufacturers, associations, consumers
Classification of energy labels not very well understood
very high Government, consumers
Poor reputation of EU energy efficiency standards caused by negative media coverage
Medium Media; individual politicians, consumers
Financial
Product replacement schemes are largely absent17
very high Government, manufacturers, consumers
Financial limitations for poor households to busy energy efficient appliances
very high Government, consumers
Behavioural
Tendency to buy larger, more energy-consuming products before end of lifetime
high Government, manufacturers, consumers
Tendency not to repair products, but buy new ones
high Government, manufacturers, associations, consumers
17 In the tertiary sector, several product replacement schemes for appliances are in place (e.g. for heat pumps).

EPODE17393 49
4.4 Policies
Although, as already mentioned, the public sector accounts for a relatively small share of the total
final energy consumption in Germany, considerable energy savings potentials can also be achieved in
this sector with more efficient appliances. Around 4.5% of investments in efficient machinery,
equipment and vehicles came from the public sector in 2011 (BfEE 2017a). Public purchasing
decisions can therefore promote energy-efficient technologies and services and improve their overall
market position. In order to overcome the large number of barriers, a policy package is necessary. A
policy package combines a governance framework including strategies, concepts, institutions and all
types of policies (regulatory, financial, information, capacity building, research and development).18
Table 9: Policy instruments for energy efficiency in appliances
Type National-level Instrument
Regulatory
Energy Consumption-Relevant Products Act (EPPG), Energy efficiency
Labelling Act (mandatory information measure)
Top-Runner Programme
Financial Heating pump replacement scheme
Information Information campaigns: e.g. “Deutschland macht’s effizient” (Germany
does it the efficient way)
Description of key instruments
Energy Consumption-Relevant Products Act (EPPG), Energy efficiency Labelling Act: The label has
turned out to be an effective consumer information tool. These two instruments are combined within
the scope of the EU’s top-runner strategy. The EPPG represents the national implementation of the
Ecodesign Directive (2005/32/EC). The EU Ecodesign directive, for instance, with its staged increase
in minimum requirements, fosters the gradual displacement from the market of products with
relatively high energy consumption, and energy consumption labels for products support the market
penetration of efficient products. These two tools in tandem create incentives for manufacturers to
develop innovative, energy-efficient technologies and make energy consumption transparent for
consumers. In order to strengthen energy efficiency even further, the German government supports
the introduction of ambitious requirements for the respective product groups. At the same time, it
must be ensured that the requirements are designed in a technology-neutral manner and that they
are ecologically sensible and economically reasonable. This will enable a further reduction in energy
demand.
18 More detailed analyses on how to address barriers can be found at http://www.bigee.net/, or Ecofys, Wuppertal Institut, Ifeu (2017):
Weiterentwicklung der Energieeffizienzpolitiken zur Erreichung der Klimaschutzziele der Europäischen Union bis 2050. For
Umweltbundesamt.

EPODE17393 50
National Top-Runner-Initiative (NTRI): The National Top Runner Initiative (NTRI) bundles measures
to speed up the market penetration of high-quality services and products (top runners) that
contribute to reducing energy consumption. The NTRI aims to mobilise energy efficiency
improvements along the entire value chain. Besides facilitating a continuous stakeholder dialogue to
identify further potentials for energy savings and to develop products to meet consumer needs, the
EU Energy Star will also be integrated into NTRI. Around EUR 6 million in funding per year are
provided by the German government. It is expected that 85 PJ in primary energy savings will be
achieved until 2020.
Heating pump replacement scheme: Since August 2016, subsidies have been available for the
replacement of heat pumps, hydraulic balancing and additional low-expenditure measures. Subsides
cover 30% of the total investment costs.
Germany makes it efficient: An energy efficiency campaign capturing all sectors and highlighting
programmes that offer efficiency funding and advice. The aim of the campaign is to provide all
consumer groups with quick and simple access to the right information. This includes details on what
efficiency measures are open to them, where they can obtain expert advice, and how much
government support is available to them.
Main take-away messages
The implementation of the EU Ecodesign and Labelling Directives are the main regulatory policies
for appliances. As shown in the following Example box, these standards and labels have had a
large effect on energy savings - in Germany, both instruments are responsible for 80% of
electricity savings. However, for several appliances, further improvements in energy efficiency are
limited which will reduce additional savings.
As the development of new standards is a long and iterative process at EU level that involves
various stakeholders, it often takes a long time. Additionally, while benchmarks are available for
absolute consumption levels, benchmarks for the operation of appliances are often absent in the
tertiary sector.

EPODE17393 51
Figure 14: Energy Efficiency Label (Source: EU Energy Labels 2015)
Example 3: The Ecodesign and Energy Labelling Directives
The Ecodesign Directive (2009/125/EG, ED) sets minimum energy efficiency standards for
products and appliances. These standards are EU-wide, which means that manufacturers do not
have to comply with disparate national legislations. Energy efficiency standards are developed
through extensive product studies by examining market data, technological status, least lifecycle-
cost options, and recommendations for the European Commission.
The Energy Labelling Directive (2010/30/EU, ELD) introduced a multi-
colour EU Energy Efficiency Label to inform consumers and increase
energy efficiency understanding of all energy-related products. Not only
home appliances are included, but also products for commercial applications
and products that do not consume energy, but have significant influence on
energy consumption (e.g. windows).
The aim of the coloured EU Energy Efficiency Labels is to inform the
consumer and to increase their understanding of energy efficiency. The
prospective buyer should gain an improved information base and be aware
of energy consumption or consumption of other essential resources
available. In July 2015, the European Commission proposed a return to a
single A to G (without “A+” or “A++”) label scale that will enter into force
by mid-2017.
The impact assessment of the European Commission (2015) concludes that the ecodesign and
energy labelling measures adopted by March 2015 save an estimated 7,327 PJ primary energy
per year in 2020, including rebound effects. In Germany, both instruments are responsible for
80% of the electricity savings in Germany due to
state regulatory law (BMWi 2017a).
As of February 2017, 31 product groups are
covered by the Ecodesign Directive.
Figure 15: Ecodesign and energy labelling directives (Best practice example 3)

EPODE17393 52
5 Industry
� The industrial sector does not have an explicit energy efficiency target, yet under
Germany’s long-term climate action plan, it needs to reduce its CO2 emissions by
51-49% (compared to 1990) until 2030. This is equivalent to 140-143 MtCO2eq.
5.1 Energy statistics and developments
Final energy consumption of the industrial sector was 2,576 PJ in 2015 (BMWi 2017a). Energy
productivity increased from 1991 to 2015 by 1.7% per year, totally 48.7%. In terms of application,
process heat with 65% is the largest application for industry, followed by mechanical energy with
23%.
Figure 16: Final energy consumption per application in the industrial sector
(Source: UBA 2017 in BMWi 2017a, p. 21)

EPODE17393 53
The final energy consumption of the different sectors varies enormously. The most energy-intensive
sectors19 in Germany are iron and steel, chemical and mineral industry as well as paper and pulp
industry.
5.2 Potentials
For 2030, the total savings potentials in the industrial sector are estimated to be 222 PJ (Fraunhofer
ISI, TU Vienna, PwC 2014b, p. 25). Cross-cutting electric measures (77 PJ) such as pumps, motors
and lighting and cross-cutting thermal measures (73 PJ) such as waste heat recovery and cooling
have the largest saving potential. This is followed by process-specific thermal measures (54 PJ).
Process-specific measures for example include process optimisation by regular maintenance and
modernisation of the combustion plants for non-ferrous metals as well as new drying processes in
paper production, new cement grades, final dimensions in steel mills etc. (Fleiter et al. 2013). In
terms of industry sector, the iron and steel sector as well as the chemical industry have the largest
saving potentials with ca. 39 PJ each (ibid). The following table shows the estimated savings in the
baseline scenario, the high policy intensity scenario as well as the resulting absolute and relative
potentials.20
Table 10: Energy efficiency potentials in the industrial sector until 2030
Sector
Energy saving measures/technologies
Energy consumption Base_WM in 2030 (in PJ)
Energy consumption HPI in 2030 (in PJ)
Absolute energy savings until 2030 (in PJ)
Relative Energy Savings until 2030
Industry
Cross-sectoral electric
measures 582 504 77 13%
Cross-sectoral thermal
measures 421 348 73 17%
Process-specific electric
measures 190 185 5 3%
Process-specific thermal
measures 823 789 54 7%
Space heating 106 93 13 12%
Total 222 10%
19 Energy-intensive industries are defined as companies whose energy intensity is more than 3%. This means that their energy costs are at
least 3% or more of their total production costs (EU Directive 2008/1/EC). 20 Numbers were rounded.

EPODE17393 54
5.3 Barriers
The industry sector is confronted with a variety of barriers, of which some apply to all sectors, while
each sector also has specific barriers. In smaller enterprises, information deficits play a major role in
the financing of investments, whereas in larger enterprises, organisational aspects such as the
distribution of responsibilities for energy efficiency or the in-house flow of information are inhibitive.
The following barriers apply to the sectors (cf. Fraunhofer ISI et al. 2012):
Table 11: Barriers to energy efficiency in industry
Barrier type Individual barrier Relevant Actors
Informational
Companies fear that external energy efficiency service providers do not know production processes well enough and might cause disruptions
high Plant owner, energy efficiency service providers
Financial
High return of investment rates are expected (max. 2 years) for energy efficiency investments.
very high Board of company
Energy efficiency investments are in competition with other (more strategic) investments which do not have to meet the high return rates.
very high Board of company
Low energy tariffs for industrial companies due to tariff exemptions
very high Government
High transactional costs for the application to subsidy programs high
Government, smaller enterprises
Behavioural
General fear of disruption in the production process when realising replacement of technology
high Plant owner
Operational
Average lifetime of plants with 30 to 50 years high Plant owner
Lack of dedicated energy efficiency personnel and lack of knowledge about profitability calculations and energy efficient technologies
high Smaller enterprises
Lack of interest in/awareness of energy efficiency, other priorities of companies´ decision makers
high Board of company
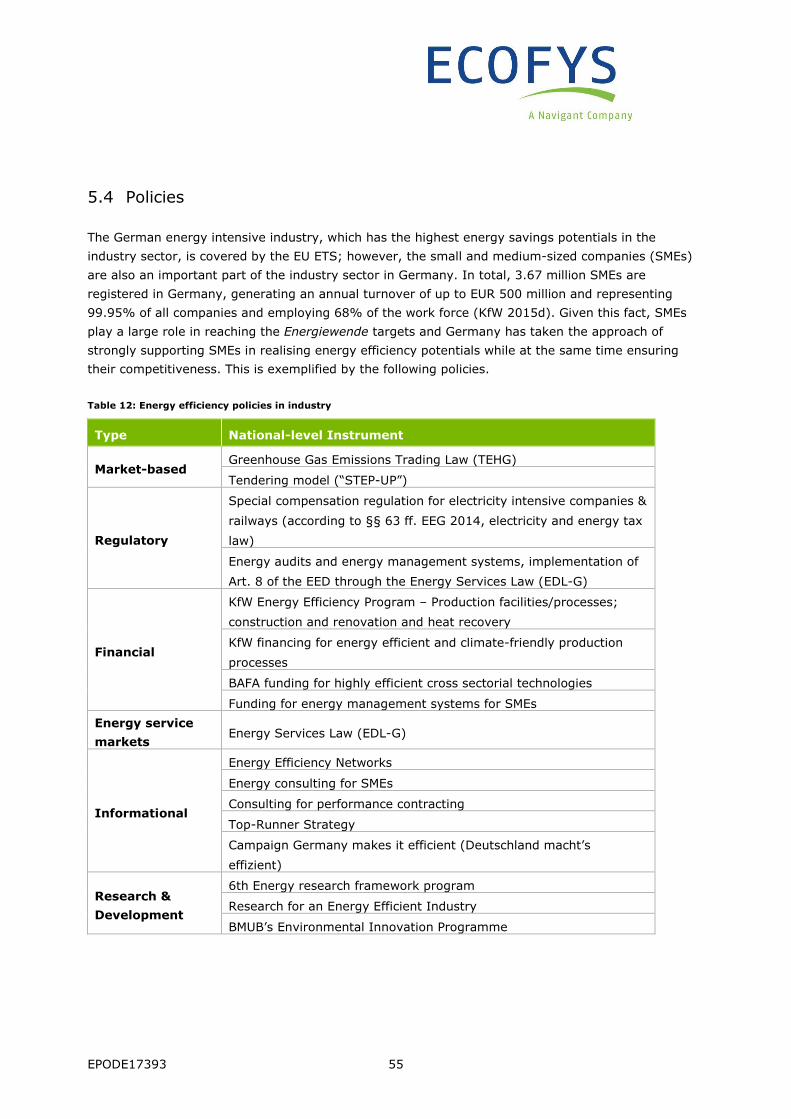
EPODE17393 55
5.4 Policies
The German energy intensive industry, which has the highest energy savings potentials in the
industry sector, is covered by the EU ETS; however, the small and medium-sized companies (SMEs)
are also an important part of the industry sector in Germany. In total, 3.67 million SMEs are
registered in Germany, generating an annual turnover of up to EUR 500 million and representing
99.95% of all companies and employing 68% of the work force (KfW 2015d). Given this fact, SMEs
play a large role in reaching the Energiewende targets and Germany has taken the approach of
strongly supporting SMEs in realising energy efficiency potentials while at the same time ensuring
their competitiveness. This is exemplified by the following policies.
Table 12: Energy efficiency policies in industry
Type National-level Instrument
Market-based Greenhouse Gas Emissions Trading Law (TEHG)
Tendering model (“STEP-UP”)
Regulatory
Special compensation regulation for electricity intensive companies &
railways (according to §§ 63 ff. EEG 2014, electricity and energy tax
law)
Energy audits and energy management systems, implementation of
Art. 8 of the EED through the Energy Services Law (EDL-G)
Financial
KfW Energy Efficiency Program – Production facilities/processes;
construction and renovation and heat recovery
KfW financing for energy efficient and climate-friendly production
processes
BAFA funding for highly efficient cross sectorial technologies
Funding for energy management systems for SMEs
Energy service
markets Energy Services Law (EDL-G)
Informational
Energy Efficiency Networks
Energy consulting for SMEs
Consulting for performance contracting
Top-Runner Strategy
Campaign Germany makes it efficient (Deutschland macht’s
effizient)
Research &
Development
6th Energy research framework program
Research for an Energy Efficient Industry
BMUB’s Environmental Innovation Programme

EPODE17393 56
In order to overcome the large number of barriers, a policy package is necessary. A policy package
combines a governance framework including strategies, concepts, institutions and all types of policies
(regulatory, financial, information, capacity building, research and development).21
Description of key instruments
Market based instruments
Greenhouse Gas Emissions Trading Law (TEHG): The TEHG implements the EU emissions trading
system (EU-ETS) into national law. The EU's emissions trading system is generally regarded as the
central economic mechanism for GHG reduction in the industry sector but only has a secondary effect
on energy efficiency. The increase in the price of CO2-intensive energy provides an incentive to
implement GHG mitigation measures, which can also reduce energy consumption depending on the
measure. However, the effect on energy consumption is low due to very low ETS certificate prices. In
total, the ETS is expected to achieve 12 PJ in cumulative final energy savings (2014-2020) (German
Government, NEEAP 2017).
Tender Model (“STEP-up”): In 2016 Germany introduced a competitive tendering scheme for energy
efficiency. The initial focus is on electricity, but an extension to cover heat is planned. In a tender
model, users submit projects with estimated energy savings for a given price. Measures with the
most economic cost-benefit ratio are then awarded. Open auctions as well as closed auctions for
specific technologies are taking place. Although it is an innovative and market-based approach,
participation by companies has been rather limited up to now. The German Government estimates
the final energy savings of the tender model between 29 PJ and 57 PJ cumulative in 2020 (see NEEAP
2017).
Regulatory instruments
Special exemption regulations: According to §55 EnergieStG, companies of the manufacturing
industry can receive an energy tax relief of up to 90% if they fulfil certain prerequisites. If a company
can provide evidence that it has operated an energy management system, it can claim an energy tax
relief. As a precondition for this exemption, a voluntary agreement between the association of the
manufacturing industry and the German government was concluded indicating that compensation will
be granted if the manufacturing industry increases its energy efficiency by 1.3% in the years 2013 to
2015 and by 1.35% in 2016 compared with the yearly average energy intensity of the 2007 to 2012
base years. A further condition is that by the end of 2015 the companies are to introduce a certified
energy or environmental management system. Small and medium-sized enterprises can also operate
alternative systems to improve energy efficiency.
21 More detailed analyses on how to address barriers can be found at http://www.bigee.net/, or Ecofys, Wuppertal Instiut, Ifeu (2017):
Weiterentwicklung der Energieeffizienzpolitiken zur Erreichung der Klimaschutzziele der Europäischen Union bis 2050. For
Umweltbundesamt.

EPODE17393 57
Furthermore, the special equalisation scheme under the Renewable Energy Law (EEG) demands the
implementation of a certified energy and environmental management system. Companies that
consumed less than 5 gigawatt hours of electricity during the previous financial year can have an
alternative system to improve their energy efficiency. This compensation measure for the peak
equalisation for the energy and electricity tax is expected to achieve 115 PJ final energy savings
(2014-2020) (see NEEAP 2014).
Energy Services Law (EDL-G): The EDL-G implements, among other things, Art. 8 of the EED and
commits all companies in Germany that are not SMEs to carry out an energy audit according to EN
16247-1 every four years, an energy management according to ISO 50001, or an environmental
management according to EMAS (Federal Law Gazette 2015a). The number of affected companies for
the energy audits are ca. 50,000 in Germany. Companies that have already implemented energy
management systems to obtain tax breaks are not considered in this number. Given these numbers,
a current evaluation shows that it is likely that only 30 PJ instead of the expected 50 PJ until 2020
can be achieved and often organisational measures or low-investment measures in lighting, heating
and cooling have been realised.
Financial instruments
KfW programs: The German state-owned Bank for Reconstruction (“KfW”) manages several energy
efficiency subsidy programmes. KfW's energy efficiency program "production facilities/processes"
promotes investment measures that achieve energy savings of at least 10% in the production
facilities and processes of commercial enterprises in Germany and abroad. This includes, among
other things, the promotion of efficient electric motors for pumps, heat recovery and waste heat
utilisation for production processes, and combined heat and power (KfW 2015 a, b). The KfW
financing initiative ‘Energiewende’ is used to finance larger company projects in Germany in
connection with the Energiewende. One focus of the program is on measures to increase energy
efficiency (KfW 2015c).
BAFA (Federal Office for Economic Affairs and Export Control) state grants for cross sectorial and
process technologies: Grants for the replacement or acquisition of new plants are subsidised from a
net investment volume of EUR 2,000 with a funding amount of up to EUR 30,000 per project
(location) (BAFA 2016). The state grants for cross sectorial technologies has been broadly accepted.
A total of 35,500 subsidy applications were submitted during October 2012 to November 2015) and
around 12,500 companies were supported with a total sum of EUR 73 million. As a result, over 360
GWh/a of electrical and 45 GWh/a thermal energy could be saved.
All KfW investment promotion programmes in companies including the BAFA programme are
expected to achieve 139 PJ in cumulative final energy savings in 2020 (see NEEAP 2017).

EPODE17393 58
Informational measures
Energy consulting for SMEs: Energy consulting is an important tool for the reduction of information
deficits in SMEs through qualified and independent advice, identifying energy saving potentials in the
company and ultimately realising energy savings. BAFA support a program that aims at advancing
the number of energy consultations carried out in SMEs. In addition to the initial consultation, the
implementation of measures is accompanied by energy consultants in order to further increase the
implementation rate. The energy consulting for SME is well received by the target group. In the
period from 2010 to 2013, 18,368 enterprises used this service.
Energy efficiency networks: An energy-efficiency network consists of 8 to 15 companies. These
companies commit to working together to increase their energy efficiency over two to three years. An
energy consultant (internal or external) estimates the energy savings potential of the participating
company and helps companies identify energy saving measures. Based on this analysis, each
company sets a conservation target and selects accompanying measures to implement. Additionally,
the network also sets itself an overall efficiency target for the duration of the network activities.
Participating companies exchange experiences and ideas during a moderated dialogue three to four
times per year. The German government plans to establish 500 networks by 2020 and thereby
achieve energy savings of 74.5 PJ within this timeframe. See also Example 4 for further details. Until
May 2017, 123 energy efficiency network have been founded.
Main take-away messages
Germany has implemented a variety of financial instruments aiming to reduce financial barriers.
However, the focus on financial incentives is not sufficient for efficiency measures to be
implemented by the industry sector. Currently there is still a reduced willingness of companies to
implement energy saving measures with pay-back times of more than three years. Companies that
operate an energy management system and reduce their energy intensity by a defined factor will
benefit from tax relief, but there is no obligation to implement identified measures to reduce
energy consumption. Furthermore, no uniform consulting standard has been established in energy
efficiency consulting, which has had a negative impact on the consulting firms and its perception
by end users.

EPODE17393 59
Example 4: 500 Energy efficiency networks by 2020
Energy efficiency networks allow for a goal-oriented, non-
bureaucratic exchange between companies.
An energy-efficiency network consists of 8 to 15 companies.
These companies commit to working together to increase their
energy efficiency over two to three years. An energy consultant (internal or external) estimates
the energy savings potential of the participating company and helps companies identify energy
saving measures. Based on this analysis, each company sets a conservation target and selects
accompanying measures to implement. Additionally, the network also sets itself an overall
efficiency target for the duration of the network activities. Participating companies exchange
experience and ideas during a moderated dialogue three to four times per year.
The methodology of the energy efficiency networks aims at strengthening energy efficiency
related know-how in companies and motivating them to implement energy efficiency
measures. An accompanying evaluation of pilot project in Germany (Fraunhofer ISI/IREES 2009
to 2015) has shown that participating companies can significantly accelerate the reduction of their
energy costs compared to the industry average. Thus, companies increased their energy
efficiency twice as fast as the industry average. Main points of the joint work are efficiency
improvements in the cross-sectoral technologies (e.g. production and distribution of compressed
air, heating and cooling as well as electrical motors, lighting, waste heat) and organisational
measures.
When the initiative was launched in 2015, 29 networks were set up. By the end of 2016, 76
networks were added and in April 2017 at total of 114 energy efficiency networks were registered
(dena 2017). The German government plans to establish 500 networks by 2020 and thereby
achieve energy savings of 74.5 PJ within this timeframe. Up to now (May 2017) 123 energy
efficiency networks have been founded.
During Germany's G7 Presidency in 2015, the Federal Government and the business community
began to promote the concept of energy-efficiency networks at the international level. Together
with the International Partnership for Energy Efficiency Cooperation (IPEEC) a global dialogue on
energy efficiency networks has been ongoing since 2016.
Figure 17: 500 Energy efficiency networks by 2020 (Best practice example 4)
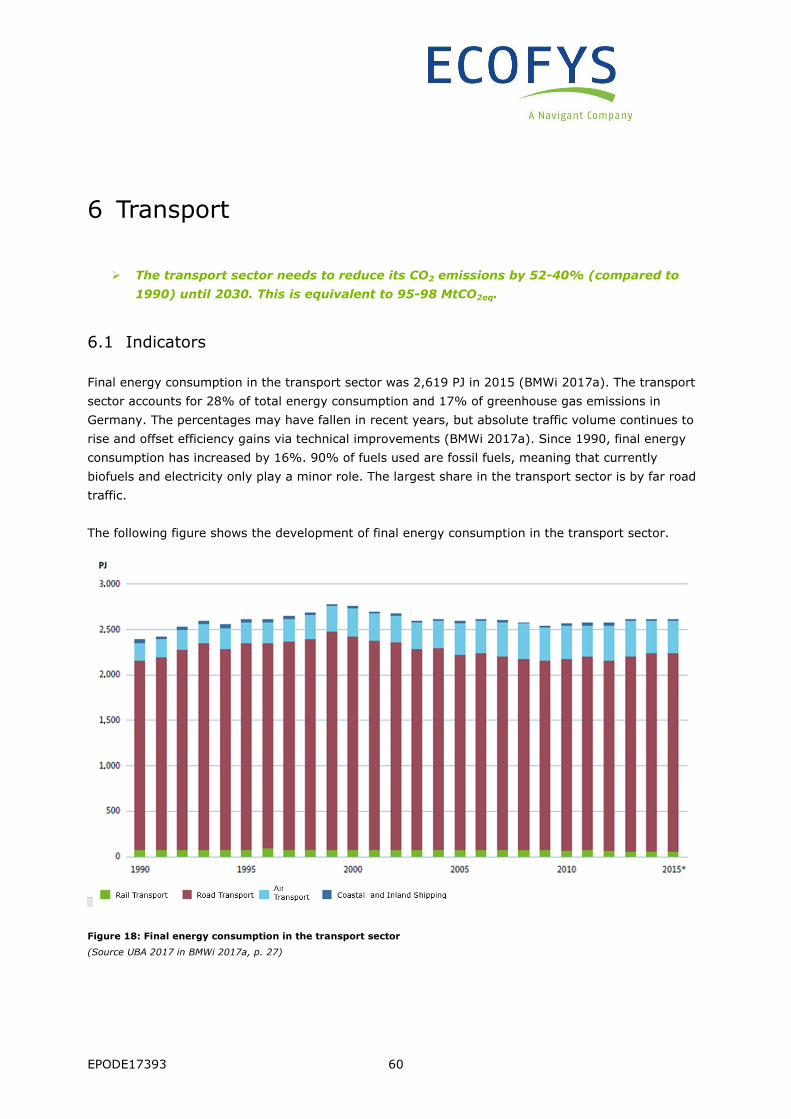
EPODE17393 60
6 Transport
� The transport sector needs to reduce its CO2 emissions by 52-40% (compared to
1990) until 2030. This is equivalent to 95-98 MtCO2eq.
6.1 Indicators
Final energy consumption in the transport sector was 2,619 PJ in 2015 (BMWi 2017a). The transport
sector accounts for 28% of total energy consumption and 17% of greenhouse gas emissions in
Germany. The percentages may have fallen in recent years, but absolute traffic volume continues to
rise and offset efficiency gains via technical improvements (BMWi 2017a). Since 1990, final energy
consumption has increased by 16%. 90% of fuels used are fossil fuels, meaning that currently
biofuels and electricity only play a minor role. The largest share in the transport sector is by far road
traffic.
The following figure shows the development of final energy consumption in the transport sector.
Figure 18: Final energy consumption in the transport sector
(Source UBA 2017 in BMWi 2017a, p. 27)

EPODE17393 61
6.2 Potentials
The estimate of the total savings potential in the transport sector is 275 PJ for 2030. These numbers
can be broken down into passenger transport and goods transport (Fraunhofer ISI, TU Vienna, PwC
2014b, p.25). The greatest potentials are in the road transport for cars and light and heavy vehicles.
However, these can be tapped not only through an increase of vehicle efficiency but also via
significant modal shifts that increase system efficiency. The following table shows the estimated
savings in the baseline scenario, the high policy intensity scenario as well as the resulting absolute
and relative potentials.22
Table 13: Energy efficiency potentials in the transport sector
Segment
Energy consumption Base_WM in 2030 (in PJ)
Energy consumption HPI in 2030 (in PJ)
Absolute energy savings until 2030 (in PJ)
Relative Energy Savings until 2030
Passenger
transport 1437 1234 203 14%
- Road
(cars/motorcycles) 1056 92 203 19%
- Road (buses) 59 49 10 16%
- Air23 294 -10
Goods transport 561 489 72 13%
- Road (light &
heavy duty
vehicles)
506 437 69 14%
- Rail 15 14 2 11%
- Ship (maritime) 9 8.5 0.5 5%
- Ship (inland
navigation) 29 28.5 0.5 1%
6.3 Barriers
Efficiency in the transport sector can be split into three areas: system efficiency (reductions in traffic
performance), transport efficiency (transport shifts to energy efficient means of transport) and
vehicle efficiency (improvement of energy consumption per vehicle km). Especially the first two areas
require changes in the mobility behaviour and/or mobility management as well as organisational
changes. The high investment costs for the expansion of the transport infrastructure constitute a
22 Numbers were rounded. 23 The negative values indicate that no savings potentials are presumed and air travel will increase further.

EPODE17393 62
major obstacle to energy efficiency in the transport sector. On the other hand, an increase in vehicle
efficiency is inhibited by a lack of technical innovations and high investment costs.
The following table summarises barriers of the transport sector (cf. Ecofys, ifeu, Wuppertal Institut
2017, UBA 2014a, UBA 2011, SRU 2005, Aral 2015):
Table 14: Barriers for energy efficiency in the transport sector
Barrier type Individual barrier Relevant Actors
Governance
Conflict over responsibility/jurisdiction (financing vs. planning) for transport infrastructure
very high Government
Globalisation and the resulting abandonment of regional economic cycles
very high Government
Organisational (infrastructure, planning)
Lack of holistic concept for an integrated (energy efficiency) transport policy
very high Government
Urban sprawl, increase in travel distance high Government
Missing integration of transportation and urban development
high Government, associations
Lacking capacity of rail transport high Government, railway association
Lacking connection between transport modes (multimodality)
high Government, associations
Informational (behavioural)
Status symbol car very high Individuals, manufacturers, auto lobby
Reduced cost awareness in transport choice high Individuals
Strong automobile lobby: difficulties in enforcing restrictions against motorised transport
very high Automobile lobby
Scepticism over new drive technologies and alternative fuels
Very high Individuals, automobile lobby
Financial
Inadequate internalisation of external costs and competitive difference in taxes, duties and subsidises
very high Government
High investment requirements for a high-quality public transport system
very high Government
Tendency to promote large-scale infrastructure projects rather than smaller ones
high Government
Higher costs of energy efficient vehicles very high Manufacturers, individuals
Incentive for manufacturers to produce large and heavy cars
Very high Manufacturers, government

EPODE17393 63
6.4 Policies
The expansion of renewable energies in final energy consumption and the increase in energy
efficiency also play an important role in the transport sector. Amendments in energy efficiency are
expected to reduce final energy consumption in the transport sector by 10% in 2020 or by 40% in
2050 compared to 2005. In addition to the Action Plan for Climate Protection 2020, the Climate
Protection Plan 2050 and the National Energy Efficiency Action Plan, sector-specific programs and
strategies have been initiated for the transport sector, such as the government program for
electromobility (Bundesregierung 2011) and the mobility and fuel strategy (BMVBS 2013). However,
an overall strategy for the implementation of a transport policy is lacking. In order to overcome the
large number of barriers, a policy package is necessary. A policy package combines a governance
framework including strategies, concepts, institutions and all types of policies (regulatory, financial,
information, capacity building, research and development).24
The following table lists selected measures:
Table 15: Energy efficiency policies in the transport sector
Type National-level instrument
Planning
Federal road planning National bicycle traffic plan Government program electromobility Commitment to build up a tanker and charging infrastructure for alternative fuels > national strategy plan to 2016
Regulatory
CO2 fleet limit values for passenger cars and light commercial vehicles Adaptation of European Renewable Energy Sources Act (EAG EE) Biofuel Sustainability Regulation Ordinance on Energy Consumption Labelling Energy labelling of car tyres
Financial
Vehicle-related taxes: CO2-based vehicle tax 5-year car tax exemption for cars with only electric motors Energy tax Reduced taxation of natural gas and liquefied natural gas beyond 2018 Other: Funding program for electric vehicles Mode-independent distance (tax) refund Air traffic tax
24 More detailed analyses on how to address barriers can be found at http://www.bigee.net, or Ecofys, Wuppertal Institut, Ifeu (2017):
Weiterentwicklung der Energieeffizienzpolitiken zur Erreichung der Klimaschutzziele der Europäischen Union bis 2050. For
Umweltbundesamt.

EPODE17393 64
Type National-level instrument
Truck toll (and further development)
Informational Initiatives and pilot projects in the field of company/municipal mobility management
Research & Development Innovation programme for hydrogen and fuel cell technology Field trials of electric motors in heavy commercial vehicles
Description of key instruments
Planning instruments:
Federal Road Planning: The Federal Road Planning is the planning instrument for transport
infrastructure development at the national level (federal highways, federal railways and federal
waterways).
Regulatory instruments:
CO2 fleet limit values for passenger cars and light commercial vehicles: EU legislation sets mandatory
emission reduction targets for new cars and light commercial vehicles. The current limits for
passenger cars are set at 120 g CO2/km since 2015. From 2021 they will decrease to 95 g CO2/km.
For light commercial vehicles, they are set at 175 g CO2/km since 2017 and will decrease to 147 g
CO2/km from 2020.
Ordinance on Energy Consumption Labelling: The Ordinance on Energy Consumption provides
information on the energy efficiency of passenger cars. For this purpose, a website was created
where prospective buyers can get information on the most efficient car models within each class of
vehicle.
Financial instruments:
CO2-tax: The annual circulation tax for cars registered as from 1 July 2009 is based on CO2
emissions. It is comprised of a base tax and a CO2 tax. The base tax is EUR 2 per 100 cc (petrol) and
EUR 9.50 per 100 cc (diesel) respectively. The CO2 tax is linear at EUR 2 per g CO2/km emitted above
95 g CO2/km (see CO2 fleet limit). Any car with emissions below 95 g CO2/km is exempt from the CO2
tax component (ACEA 2017).
Truck toll: Germany imposes distance-based tolls on motorway use by all trucks as from 7.5 t
maximum gross weight. The toll amount depends on emission class, axle number and the length of
the toll stretch (DKV 2017).
Funding program for electric vehicles (Environmental bonus): The purchase or lease of a new, first-
approved electric vehicle is funded with EUR 1,500 - 2000 depending on the amount of CO2 emissions
per km which has to be at least smaller than 50g CO2/km (BAFA 2017b). Until July 2017, in total

EPODE17393 65
23,024 vehicles were approved for funding. This is split into 13,083 electric battery cars, 9,937 plug-
in hybrid bars and four fuel cell cars.
Research & Demonstration instruments:
Electromobility program: Under the electromobility program, funding of EUR 1 billion will be devoted
to technological research and development projects and a further EUR 180 million for practice-
oriented (regional) demonstration and pilot projects (e.g. "Schaufenster Elektromobilität").
Additionally, the government program also includes further measures, such as education and training
or financial incentives (exemption of motor vehicles for pure electric passenger cars).
Main take-away messages
While the Ministry for Economic Affairs and Energy jointly with the Ministry for the Environment
(BMUB) initiates regulation for the buildings, appliance and industry sectors, the responsibility for
transport policy lies with the Federal Ministry of Transport and Digital Infrastructure. Germany has
implemented a variety of measures in the transport sector to overcome existing barriers. Yet, gaps
in the current policy framework still lead to increasing emissions and less energy efficiency in the
transport sector.
Regarding system efficiency, the federal road planning system (BVWP) consists of sectoral plans
for infrastructure development and individual projects as opposed to an integrated and weighted
network plan.
In terms of travel and transport efficiency, various tax-related instruments that try to incentivise a
modal shift, present deficits in the regulatory framework. Since the ecological tax reform in 1999,
the tax rates have not been adjusted. The steering effect of the CO2-based passenger vehicle tax
is also rather small, since the tax rate applied is too low to effect significant changes in buyer's
behaviour. These taxes also focus on direct emissions and do not take the other parts of the value
chain into account.
Vehicle efficiency is another area in which there are deficits in the regulatory framework.
Currently, there is a lack of knowledge about the extent to which the energy consumption labelling
obligation for passenger vehicles influences purchasing behaviour of consumers. Additionally, the
goal to deploy 1 billion electric vehicles by 2020 was cancelled by the German government in May
2017 due to lack of supply and demand.

EPODE17393 66
7 Cross-sector
7.1 Information and communication technologies
7.1.1 Potentials
According to Germany’s Climate Action Plan 2050, the digitalisation of the energy system is expected
to yield energy efficiency potentials through the analysis of increasing volumes of data on energy
flows. Under the premise of data security and protection, modern technologies such as smart grids
and smart metering shall positively impact energy efficiency.
The digitalisation of the energy system is still in an early phase. In principle, information and
communication technologies (ICT) can manage considerable amounts of data needed to allow for
flexible distribution of energy supply and demand. Real-time information and communication about
energy supply, grid load and storage capacity opens opportunities for the optimal and efficient use of
energy.
As clearly, digitalisation per se does not lead to energy savings, its energy efficiency potential will
largely depend on how digitalised processes will be designed for the purpose of energy savings. The
digitalisation of the energy system will to a large extent be technology-driven rather than policy-
driven and hence can only be steered to some extent. These factors make it difficult to quantify the
energy savings potentials of information and communication technologies.
Accurate, real-time data on energy flows can generate positive results for energy efficiency through
different effects.
• Firstly, detailed monitoring and analysis of energy use coupled with user feedback allows
industrial and private consumers to optimise their energy input and identify individual savings
potentials (BMWi 2016c). According to estimates, the introduction of smart meters coupled
with monitoring tools can account for electricity savings of 3-5%. For heating, energy savings
are expected to be slightly higher (up to 6,5%) (Hoffmann et al. 2012). In particular, the
visualisation of energy use has been found to be crucial as it enables the consumer to use
energy more consciously. Automated energy management systems in buildings can make up
for 10-20% of energy savings.
• Secondly, user information and the development of cost-effective energy advice is made
possible. Innovations based on automatic energy metering may include improved,
continuous, and automatic energy advice (BMWi 2016c).
• Thirdly, it allows policymakers to base energy efficiency measures on a more realistic set of
data and improved forecasts.

EPODE17393 67
• Fourthly, the availability of data is a precondition for demand response management and
technology innovations (section 7.2) (BMWi 2016c).
A digitalised, smart grid does not only use energy supply efficiently, but also reduces the need to
expand grid infrastructure. A study conducted on behalf of the BMWi suggests that the expected
costs of grid extension until 2032 could be reduced by 20% as a result of new approaches to grid
planning and intelligent grid technologies (E-Bridge, IAEW, OFFIS 2014). This would be in addition to
the significant reduction in grid extension costs that could be induced by energy efficiency. (Prognos,
IAEW 2014). As an indication for digitalisation of the grid, it can be noted that in 2015, more than
77% of installed renewable energy capacity in Germany could be remotely metered and controlled
(BMWi 2015c).
7.1.2 Barriers
The potentials of ICT for increased energy efficiency cannot currently be fully leveraged due to
multiple barriers that are only beginning to be understood and addressed.
Institutional barriers range from insufficient policies and a missing regulatory framework to no
legal or investment certainty and not enough steering of R&D activities. Furthermore, digitalisation
allows for multiple subsystems to become interconnected. This may create complications as it is
unclear, to which extent the different technologies will be compatible, whether the regulator will be
needed to coordinate the subsystems and whether this will increase or diminish efficiency, stability
and controllability of the system (BMWi 2016a).
Knowledge barriers refer to the need for further research and development, information
asymmetries, a lack of knowledge exchange and insufficient networks. Despite the considerable
potential, mass-market applications are not yet economically feasible. In particular, German SMEs
are hesitant to become part of “industry 4.0” as the advantages are often not clear (Deloitte 2016).
On a global range, customers tend to lack a clear understanding of the value of the Internet of Things
(IoT), so that there is a need to demonstrate concrete solutions and capabilities of connected
appliances.
Further, there is some disagreement about the efficiency gains acquired through specific
technologies. For instance, energy efficiency gains by smart metres and IoT may be outweighed by
increased consumption of the devices. Smart meters, for instance, have been criticised for their high
energy use, which may not be compensated by their efficiency gains (Theron 2015). Global standby
energy consumption caused by the necessity of IoT devices to always be reachable is estimated at
130 PJ per year by 2025 in the area of home automation alone (IEA 2016).
Security barriers are a major challenge from a systemic perspective and in the context of privacy
protection. ICT systems are potentially prone to hackers, viruses and even cyber-war attacks,
presenting serious threats to the security of the system (BMWi 2016a). In the German context, there

EPODE17393 68
is particular scepticism towards open data resources and the misuse of consumer data, which are
linked in part to the prominence of the right to privacy in the German constitution. It remains to be
seen how detailed energy metering will be harmonised with German data protection laws (BMWi
2015c).
Market barriers to information and communication technologies include insufficient available capital
and long amortisation periods. Established technologies have high returns, while new technologies
are very cost-intensive and there is an insufficient demand from potential buyers.
7.1.3 Policies
The current policy landscape addressing digitalisation of the energy sector is comprised of multiple
support programs and information platforms.
Table 16: ICT related energy policies
Laws
Law on the digitalisation of the energy transition
Strategies
High-tech Strategy “Innovation for Germany”
Digital Agenda 2014-2017
Digital Strategy 2025
Support programs
Smart Energy Large-scale demonstrators (‘Showcases’) - Digital agenda for the energy transition
(SINTEG)
Technology programme Smart Data
Technology programme SMART SERVICE WORLD
Technology programme – ICT for electric mobility II
6th energy research framework programme
• Support initiative “Energy storage”
• Support initiative “Future-proof Power Grids”
Support measures “E-energy – ICT based energy systems of the future“
Support initiative „material science research for the energy transition“
Large-scale demonstrators (‘Showcases‘) electric mobility
Pilot programme Savings Meter (“Einsparzähler”)
Green IT initiative
Information Platforms
Platform Industry 4.0
Energy transition platform research and innovation
Digital networking in the framework of the digital agenda

EPODE17393 69
Description of key instruments
In June 2016, the law on the digitalisation of the energy transition was passed. It determines
the gradual roll-out of smart metres. In contrast to most EU members, Germany will only oblige large
consumers and producers (consumers with over 10,000 kWh/year and producers between 7-100 kW
installed capacity) to install smart meters in the medium term until 2024 (until 2032 for consumers
with more than 100,000 kWh/year), while the roll-out for smaller consumers and producers is
envisioned for the period 2020 to 2027. The law further comprises technical guidelines, protection
profiles and a communication platform tool and aims to warrant data protection and interoperability
(Sachverständigen Rat 2016). Only smart metering systems that adhere to very high data protection
and data security standards will be awarded with the according certificate (BMWi 2016d).
The pilot program “Savings Meter” is scheduled to run from 2016 to 2018 (BMWi 2016a) with the
aim of supporting private and industrial consumers in finding options to decrease their energy use.
Innovative, IT-based pilot projects are tested with voluntary end consumers, who are enabled to
identify the energy uses of individual appliances and monitor energy saving successes and associated
cost savings. Besides testing innovative solutions for demand side response, co-benefits including
load management for sector coupling or private financial services for energy efficiency are
incentivised through the programme (BAFA 2017a).
As part of the digital agenda, the support program SINTEG, funded with over EUR 200 million and
200 companies, aims to demonstrate how smart grids can optimise the interplay of power
generation, consumption, storage and grids. Five showcases projects, focussing on different solutions
for a climate-friendly, secure and efficient energy supply with high shares of variable renewable
energy, are supported. The project “C/sells” is a large-scale showcase with a focus on solar energy in
southern Germany designed to test an energy system that is organised into sub-cells. “Designnetz”
tests send requests for flexibility from higher grid levels to lower ones, using data from ca. 140,000
meters to generate forecasts on the grid status. “Enera” aims to showcase regional energy system
services and solutions. In “NEW 4.0” flexibility options such as demand side management, storage
units and sector coupling are tested in Northern Germany, and in “WindNODE” digital networking is
leveraged for flexibility options at multiple levels (BMWi 2017d).
In the context of the Green IT-Initiative, the energy consumption of all public sector IT-appliances
was to be reduced. By 2013, the energy consumption had been reduced by 40% against the 2009
baseline for peak energy consumption. The initiative is being continued with the aim to achieve
further energy savings (UBA 2014b).

EPODE17393 70
7.2 Demand response
7.2.1 Potentials
Demand Response refers to balancing the electricity grid through changes in electricity usage
(Department of Energy 2017).25 With increasing shares of variable renewable energy, the grid needs
to be stabilised and demand response is one option for providing the needed flexibility, while at the
same time reducing the need for additional back up capacities. Demand response is a promising low-
cost option to balance varying electricity supply and demand, especially through levelling out load
peaks and valleys, which eases the further integration of variable renewables to power systems.
However, the effects on energy efficiency are indirect and twofold. In many cases increasing the
energy efficiency of an installation leads to a decrease of its flexibility. Yet, some cases have
opportunities for synergies. For instance, an upgrade of control technology is likely to lead to
improvements in both, energy efficiency and flexibility. As a second indirect effect demand response
potentially decreases the need for back up capacities and grid extension, which increases the
efficiency of the system as a whole.
Germany has a high potential for demand response. Indicative figures for the theoretical potential per
sector are presented in table 14.
Table 17: Theoretical demand response potential in Germany in MW
Potential for load reduction in MW Potential for load increase in MW
Industry 3543 734
Commercial 3397 3671
Residential 6023 27413
Water Supply and
Treatment 559 501
Total 13522 32319
(Source: Gils 2014)
In general, it is easier to implement demand response for a few large industrial consumers than to
leverage the flexibility potential of many small actors. A successful example for a large consumer
offering flexibility to the grid is the aluminium producer Trimet, which regularly provides grid
balancing services by adjusting the electrolysis process according to extraordinary peaks and valleys
in the electricity supply. This is done at 12 production sites, which employ modern technology that
25 Note that the European Commission’s definition refers only to reductions in electricity usage at times when the capacity is jeopardised
(European Commission 2016a).

EPODE17393 71
have proven to increase efficiency in the electrolysis process while at the same time provide flexibility
to the grid (Agora Energiewende 2015). Scaling up such successful examples depends on the
individual technologies and a coordinated approach of utilising them for the purpose of greater
energy efficiency.
A key technology for new demand response applications is smart metering. Smart metres in
industries and private households are envisioned to provide detailed information about energy
consumption patterns. Besides enabling individual energy consumers to save energy, smart metering
opens up business opportunities such as variable electricity tariffs which provide direct financial
incentive for demand response. Large industrial actors could market flexible loads themselves while
smaller companies could do so via demand response aggregators.
Another key technology for demand response management is the internet of things. The internet of
things refers to things and communication networks, whose primary function is not directly related to
information and communication technology, i.e. a washing machine. Those things are “identifiable,
addressable and can be integrated in communication networks” (IEA 2016). The internet of things
can impact the energy sector and energy efficiency using connected devices and appliances to better
moderate electricity demand. In theory, appliances connected to the internet could automatically
respond to fluctuations in the electricity grid, thereby helping to balance out extremes. For instance,
a washing machine connected to the internet could automatically start once electricity supply is
higher than demand.
7.2.2 Barriers
In principle, current regulation allows for demand response measures. However, market regulation
creates considerable barriers to most forms of demand response, including programs by retailers and
independent aggregators. The current configuration of the electricity market inhibits most forms of
demand response services provided by both retailers and independent aggregators because of the
specific regulations balancing power must meet (e.g. referring to volume and duration). Hence,
actual participation is hardly possible despite increasing demand for balancing services. The
wholesale market as well as re-dispatch are not available for demand response. The GJETC study on
electricity market design provides more detail on this.
Aggregation of smaller actors can currently only be implemented by retailers, and there are
significant barriers to entry. Intra-day markets are in principle open for consumers working through
their retailer (assuming the retailer offers this service).

EPODE17393 72
7.2.3 Policies
The responsibility to balance the grid lies with the system operators. Since the liberalisation of the
electricity market in 2001, the system operators have been purchasing balancing power in an open
and transparent market. This works through auctions, in which power plants as well as end
consumers can offer flexibility. As there are specific rules for each type of balancing power (primary
balancing power, secondary balancing power, minute balancing power), smaller actors have to pool
their flexibility resources in order to meet those criteria. The rules and criteria of the auctions are
regulated by the electricity network access directive (“Netzzugangsverordnung”) and the Network Fee
Regulation (“Netzentgeltverordnung”). In principle, balancing power can be traded across European
borders.
The German government has reviewed the current barriers to demand response in its white paper
“An electricity market for the energy transition” (BMWi 2015b). Among other things, the intended
measures would open up balancing power markets for new actors, allow for modifications of the grid
fees and regulate the aggregation pools of smaller actors. Consequently, the potential for demand
response in Germany would be greatly improved.
There is currently no capacity market in Germany and according to the white paper, a possible
capacity reserve would be closed for demand response. In the long term, daily auctions with volumes
of one hour are envisioned. According to the European Commission (2016), the measures proposed
in the white paper on the electricity market would, if implemented, solve the current barriers to
demand response.
7.3 Impacts of Smart Cities and communities & city planning
7.3.1 Potentials
ICT, big data and the internet of things are also key for the future of smart cities and urban planning.
The term “smart city” refers to the intelligent, digitalised and cross-linked city of the future. Smart
cities may increase energy efficiency through smart street lights, smart grids and intelligent building
systems.
The overall benefits of the smart city concept are based on a resource efficient management of the
city’s needs, which leads to low carbon, sustainable development. Digitalisation and data
management can optimise urban mobility, living, working etc., reducing the amount of time and
energy spent on many activities. Also, the sharing economy, linked via digital networks, is supporting
the efficient use of resources by avoiding unnecessary production.

EPODE17393 73
Figure 19: Relation of smart city and urban sustainability
(Source: Khansari et al. 2014)
A smart and integrated urban planning practice reduces land-use and promotes redensification of
urban structures and short distances. In the urban context in particular, the optimisation of the
energy infrastructure via ICT solutions and M2M (machine to machine) communication provides a
high energy and CO2-emission saving potential, connecting the demand and supply sides of all
relevant sectors (heating, cooling, power, transport, water, waste, communication etc.). E.g. the
report “Smart Stories, Amsterdam Smart City 2011” states that Amsterdam’s projects generated
projected savings of 12.7 kt CO2 per year, which account for a reduction of 0.5% of overall CO2
emissions of Amsterdam per year. Full up-scaling of smart city projects has not been achieved so far,
but it is estimated that this would lead to a reduction of 6% and 148 kt CO2 (Mapping Smart Cities in
the EU, 2014).
Overall energy management systems on city-level (digital city models) are not yet available and the
digitalisation of the urban infrastructure needs to develop in-line with a circular economy and social
sustainability approach to reach its maximum potential.

EPODE17393 74
The following table shows indicative energy saving potentials of smart technologies in the context of
smart cities and communities:
Table 18: Energy savings potential of smart technologies
(smart) Technology Energy saving potential
Smart urban energy system (integration of decentralised
renewable energy sources – buildings as producer and
consumer “prosumer”)
high
Virtual power plants high
Heating/cooling/gas infrastructure as energy storage (power to
heat/gas)
medium (GHG emission reduction
through flexibility of power
generation via renewable energy
systems)
Using e-mobility sector as energy storage – integration in
smart grid medium
Energy management system which predicts the energy
production and demand in the city medium
Combination of different sectors (recycling, heating, electricity,
waste water, …) medium
Sharing concepts for mobility (bikes, cars, …) medium
Sharing economy in general low
Optimisation of public transportation through big data access
of users (possible, question of privacy) medium
Smart meter (savings ~2% (Allcott and Mullainathan 2010;
Van Elburg 2014), M2M~20%(GeSi and BCG 2012) medium
Smart lighting (savings up to 60%) (Manville et al 2014) high
Sensors for traffic (transport demand management) �
optimised traffic control medium
(Source: own assessment by Ecofys, 2017)
Currently, the smart city approach still does not have a large impact on energy and GHG-emission
savings. So far, the effects of this approach are not fulfilling the expectations. Instead, conventional
efficiency measures like building insulation and modal shift continue to result in higher energy
savings. Nonetheless, the smart city approach has the power to fundamentally change user behaviour
and therefore offers the possibility for significant energy savings.
EPODE17393 75
7.3.2 Barriers
German cities are currently facing a huge challenge to adapt to technology developments and
implement fundamental changes in the urban infrastructure (e.g. for e-mobility). Many cities are
suffering from investment lags in conventional urban infrastructure. Due to a shift from an industrial
economy to a service economy and the related demographical changes, some cities are growing
rapidly while others are shrinking along with the local economy. These developments are already
challenging many German cities and investment in innovation and smart technologies is lagging
behind (smart lamp post, e-cars etc.).
The development towards a “smart city” requires a multi-stakeholder approach: citizens need to be
involved in the planning and development process to increase the acceptance of the digitalisation of
the urban infrastructure. Moreover, the smart city process should integrate all relevant technology
sectors, which requires a coordinating entity within the municipal administration. And finally, private
partners must be identified to invest in new smart technologies that are linked to public
infrastructure. Therefore, the governance structure needs to be adapted to this challenge in order
fulfil these tasks.
The municipality must make reliable decisions with positive, long-term impacts on infrastructure and
the welfare of citizens. Unknown dependencies and new relationships are to be taken into account by
a smart approach. Data security should also be respected while opening up new data sources e.g. via
public cameras and sensors. It is crucial to decide which data could be opened up for the public (open
data) and vis-a-versa. The risk of security shortcomings and cyber-attacks is increasing through the
digitalisation of infrastructure. And finally, the digital revolution also impacts social divide and
disruption (WGBU 2016).
It is clear that smart-city technologies will create new regulatory frameworks across all governance
levels, as well as challenge existing social norms and expectations regarding privacy (Kitchin 2016).
An open and broad discourse on the effects of digitalisation in the city context should therefore be
conducted. This requires a strengthening of IT and media competencies within the population as well
as in public and private institutions. As the technical possibilities and associated risks are rapidly
evolving, an urban governance is required that is able to shape the digitalisation process associated
with great uncertainties in the city and create a socially acceptable and sustainable, digitised city.
7.3.3 Smart City Policies
The function of a smart city refers to the digitalisation of all essential sectors of the urban
environment. However, there is no common definition of a smart city. E.g. for the City of Vienna, the
Smart City “represents the overarching framework for an innovation-driven, resource efficient and
liveable city that includes an innovation strategy as well as a sustainability strategy (City of Vienna
2014).” (Radecki et al. 2015).

EPODE17393 76
In recent years, the relevant institutions have been attempting to define and set standards relating to
this term.
International and European standards
China, Japan and Germany founded an evaluation group under the umbrella of the International
Electronical Committee (IEC SEG 1) in 2013. Eight working groups were created with a focus on
smart cities and the following topics: city service continuity, planning and simulation system, facilities
management, smart homes, smart education, smart cities assessment, smart cities framework, and
mobility and logistics). ISO and IEC founded additional committees that deal with international
standardisation of smart cities (e.g. cloud computing, identification of requirements for cities,
potential interface problems). Moreover, the International Telecommunication Union (ITU, part of the
UN) is currently developing studies and recommendations concerning smart and sustainable cities.
Additionally, DIN (German Institute for Standardisation) and DKE (German Commission for
Electrotechnology) are cooperating in a national strategy group on smart cities, working on
• buildings and urban processes
• mobility and logistics: intelligent transport systems, navigation and use of open data
• protection and security: emergency response, reaction to crisis, civil security
• digital city: role of ICT in smart cities
• energy: production and demand (electricity, heat, gas, water) - smart grid and smart home
• production (industry 4.0) (DIN & DKE 2014).
In Europe, the CEN-CENELEC-ETSI Coordination Group on Smart and Sustainable Cities and Com-
munities (SSCC-CG) (ETSI 2015) is defining European standards with a focus on smart cities.
Further, the EU Directive 2013/37/EU on re-use of public sector information, is in place. It focuses on
the economic aspects of the re-use of information rather than on the access of citizens to
information. It encourages Member States to make as much of their data publicly available as
possible to support innovative and future-internet-based services, new companies, transparency, and
participation in urban spaces (European Commission 2017). Germany has transferred the directive
into national law, but still has issues with data security referring to Open Data. The research institute
Fraunhofer FOKUS, together with the Berlin-based data-portal BerlinOnline, are working on the
integration of a City Data Cloud, in order to make selected data publicly available. The aim is for The
Data Cloud to be available in several cities to support innovative urban processes and implement
smart city solutions.
Information platforms
Another strategy to promote the smart city development is via communication and the stimulation of
the multi stakeholder process. The European Innovation Partnership on Smart Cities and
Communities (EIP-SCC) brings together cities, industry and citizens to improve urban life through
more sustainable, integrated solutions. The partnership aims to overcome bottlenecks, co-fund
demonstration projects, and help coordinate existing city initiatives by pooling its resources together.

EPODE17393 77
This includes applied innovation, better planning, a more participatory approach, higher energy
efficiency, better transport solutions, intelligent use of Information and Communication Technologies
(ICT), etc. (European Commission 2016b).
In 2016 the German government under the lead of the Federal Institute for Research on Building,
Urban Affairs and Spatial Development (BBSR) and the BMUB created the research cluster "Smart
Cities" (BBSR 2017) to understand the impact of digitalisation on urban development, the use of
digitalisation and big-data for urban development, and possibilities for cities to become a digital and
sustainable city. The projects range from mobility issues to citizen participation and influence of
digitalisation on urban structures. In this framework the inter-ministerial working group on
sustainable urban development (IMA)(BMUB 2017) offers a dialogue platform for discourse between
political representatives from federal, provincial and local level to improve the cooperation between
the federal government and municipalities.
To support digitalisation in Germany, the Digital Agenda of Germany’s Federal Government (Digital
Agenda 2014 – 2017) was developed, which represents a roadmap with goals for Germany’s digital
development. It aims to strengthen Germany’s role as an innovative and highly productive economy
and ensure that Germany takes the international lead in the digital transformation (Federal
Government of Germany 2014). At the same time, the cornerstones for a "Smart City Charter for
Germany" are being developed at the federal level, from the point of view of urban development
policy. It is intended to showcase all aspects of a Smart City and to outline strategic paths for the
digitisation of German cities and municipalities.
Various companies are also developing technologies and accompanying instruments for an intelligent
infrastructure of densely populated urban areas. For example, Siemens has developed a "City
Performance Tool" to help cities create their environmental balance. The aim is to identify the most
efficient instruments for reducing CO2 emissions and improve air quality, while at the same time
indicating the number of jobs created in the city by the measure presented. Cisco has also entered
into agreements with the city councils to advise and test different ICT applications - in Germany, for
example, with the cities of Hamburg and Berlin. These examples indicate that smart cities may aim
for resource efficiency or sustainability, but it is not granted that each smart city concept will, as
there is no common definition.
7.3.4 CHP and district heating networks in Germany
The existing district heating networks are an important infrastructure for the integration of renewable
energies and flexible sector-clustering technologies in densely populated urban areas. The Federal
Government aims to increase the share of renewable energies in the heating sector to 14% by 2020.
At present, about 225 of the municipalities in Germany have large district heating areas. Over the
past few years, district heating has accounted for about 9% of final energy consumption for the
provision of space heating and hot water in private households and the sector of trade, commerce

EPODE17393 78
and services (BMWi 2016a). District heat is mainly generated by CHP plants, but there is still a clear
dominance of fossil fuels with regard to the primary energy sources used. Renewable heat sources
have only a share of around 10% (ifeu & GEF 2013) in the form of biomass and waste incineration.
The future role of the heating networks should not be restricted to the collection and distribution of
heat, but should create flexibility options for the electricity market. Hence, smart regulation of heat
demand and heat supply, coordinated with the requirements of the electricity system, should be
included in a smart city approach.
Existing national regulations and incentives in this field refer to the Act on Combined Heat and Power
Generation (KWKG) and the Market Incentive Program (MAP), as well as the KfW programme 432
"Energetic urban regeneration - provision of investment for energy efficiency measures in urban
redevelopment areas” and the KfW programme 294 on “waste heat use”.
The KWKG promotes the construction and expansion of heat networks based on fossil-fuelled heat
producers, which provide coupled electricity and heat generation, with certain, fixed surcharges per
grid meter as well as the expansion of heat and cold storages. The MAP favours energy efficient
heating plants in the building stock and additionally supports the construction of heat networks that
meet specific efficiency requirements as well as heat storage within defined limits. The MAP also
promotes the construction of heat production facilities, including biomass plants, large-scale heat
pumps, biogenic cogeneration plants and solar thermal collectors.
The lack of “municipal heating plans” as the main coordination and planning instrument is seen as a
hindrance for the further expansion of district heating. As a result, it is often not known to the
municipalities which areas are suitable for large heat generation plants and how much unused waste
heat potential is locally available. The promotion of local heat plans is supported within the
framework of the national climate initiative (NKI). However, thus far only a few municipalities have
made use of this funding.
7.4 Rebound effect and behavioural approach
7.4.1 Impact of the rebound effect on energy efficiency potentials
The discrepancy between an increase in energy productivity of the German economy by 56.2% since
1990 on the one hand and a comparatively small decrease in total energy consumption by only
10.5% (Statistisches Bundesamt 2016) on the other, shows that absolute energy savings through
energy efficiency increases have diminished. This can be explained both by larger economic and
societal trends such as increased GDP, production, wealth and smaller household size leading to
greater energy use, and by rebound effects.
The term rebound effects describes the phenomenon of increased energy use caused by energy
efficiency measures. Rebound effects can be broken down into three types. Direct rebound effects

EPODE17393 79
stem from increased demand for the more energy efficient product or service. An example is the
purchase of a new, more efficient yet bigger car that will be used more than the old, less efficient
vehicle. Indirect effects refer to an energy efficiency increase of one product or service that leads
to increased demand for another different product or service, e.g. because of greater available
financial resources. In the case of a new car, the fuel savings induced by greater efficiency will be
partially compensated by more frequent flights as the consumer has more financial resources and/or
a cleaner conscience due to the lower CO2 emissions of their car. Macroeconomic effects emerge
as a result of energy efficiency increases, which cause an overall increase in energy consumption. For
instance, increased demand for efficient cars may lead to lower fuel prices, ultimately resulting in
greater fuel demand than what was anticipated as the result of energy efficiency (UBA 2016).
It is generally agreed that the impact of rebound effects can be significant; however, there is large
disagreement about the scope of the impact. The German Environmental Agency (UBA) estimates
that direct rebound effects can account for a 20-30% decrease of the actual energy savings caused
by an energy efficiency measure (UBA 2016). For example, in the case of motorised private
transport, 10 – 30% rebound effect are a realistic assumption, although Frondel et al (2012) find that
this amounts to over 50%. For space heating, 10 – 30% are estimated. For space cooling, existing
studies point to a 1 – 25% rebound effect, 2 – 20% for warm water, 2 – 15% for industrial processes
and 2 – 9% for residential lighting (UBA 2016, Sorell 2007). The large variation can be explained by
the different data sets, evaluation periods and geographic scopes of the reports. On average,
however, direct rebound effects may be in the range of 10% (Thomas 2012, Nadel 2012, Gillingham
2013).
In addition to direct ones, indirect effects are estimated at 5 – 15% under the assumption that
consumers distribute their financial savings evenly over their existing expenditures (Schipper and
Grubb 2000, Santarius 2014). In the case of macroeconomic effects, no reliable numbers are
available.
Direct, indirect and to some extent macroeconomic rebound effects are usually taken into account in
energy efficiency scenarios; however, underlying assumptions about the range of effects impedes
comparability. It should be noted that rebound effects are hard to reliably quantify. This is
particularly true for indirect and macroeconomic effects. Nevertheless, the existing evidence indicates
that they pose a non-negligible challenge to energy savings policies.
7.4.2 Policy measures to minimise the rebound effect
The Ministry for Economic Affairs and Energy acknowledges in its Greenbook on Energy Efficiency that
current policy instruments of energy efficiency do not sufficiently take rebound effects into account.
Given the potential reduction in energy savings caused by rebound effects, they should be considered
from the early stages of policy development onwards in order to fully reap their energy consumption
reduction potential (BMWi 2016e).

EPODE17393 80
The UBA has ranked different policy instruments by their susceptibility to strong rebound effects,
which is presented in Table 16.
Table 19: Susceptibility of policy instruments to the rebound effect
Policy instrument Susceptibility Example
Subsidies strong Subsidies for cross-sectoral technologies
Requirements, efficiency
standards strong
Eco-design directive, CO2 guideline for
automobiles
Licenses for use medium Authorisation according to the Federal
Emission Control Act
Voluntary agreements with the
private sector medium
Climate protection declaration of the German
petroleum industry for the heating market
Public procurement medium Requirement for certified products, e.g. The
Blue Angel certificate
Charges (taxes, fees, special
levies) weak “EEG levy”
Traded certificates weak European emissions trading
Information and communication
measures weak Efficiency labels
(Source: UBA 2016)
The ranking is a general indication, to which there are exceptions. For instance, efficiency labels as
an information measure have shown significant rebound effects in the case of washing machines. Due
to the definition of the energy efficiency index (EEI) label which tends to rate large machines
positively, the average size of washing machines is increasing. As in many households, this is not
matched by corresponding amounts of laundry, final energy consumption per unit of laundry may
increase.
Charges such us energy taxes can counteract the rebound effect as they target final energy
consumption. Similarly, communication measures with the aim to motivate clever use of energy as
well as energy sufficient behaviour are a way to counterbalance rebound effects.
Generally, setting concrete envisioned energy savings rather than energy efficiency measures as
policy targets helps to incorporate rebound effects from the indicator perspective. In spite of the
difficulty to quantify rebound effects, there is an urgent need to close the evidence gap, in particular
for indirect and macroeconomic effects.

EPODE17393 81
7.4.3 Impact of behavioural approaches
As determined in the Climate Action Plan 2050, the German government will strive to foster
participation and the development of an environmental consciousness as well as behavioural change
in the context of climate protection (BMUB 2016a). Behavioural approaches can target either
consumer purchasing decisions or use patterns.
The potential for energy savings from replacement of appliances is estimated at 60% and the
savings potential from changed use routines is estimated at 20% of residential electricity
consumption in Germany (Bürger 2009). The top three applications with regard to savings potential
are cooling and freezing (ca. 6TWh), washing and drying laundry (ca. 5 TWh) and cooking (ca. 4
TWh). Feedback mechanisms play a central role in this context. It is generally acknowledged that
they have measurable effects on behaviour change, if it is clear and easy to process. Direct feedback,
such as immediate feedback from savings meters (e.g. visualised on a monitor) is expected to
motivate energy savings in the range of 5-15%. Indirect feedback, such as bills may account for
energy savings between 0-10%. Clearly, this varies depending on the quality of information as well
as the context (Darby 2006).
Technological developments and corresponding policies such as smart meters connected to feedback
mechanisms can be employed for the behavioural approach. The introduction of efficiency measures
through the internet of things would also have a significant behavioural component that has to be
considered both in the technical design and in complementary policy measures. Furthermore,
information campaigns, energy advice and measures to incentivise energy sufficiency (see section
7.4.4) aim for a general change of behaviour. However, as discussed in the context of rebound
effects (section 7.4.1), the behavioural approach is not only leveraged for positive change but can
frequently have considerable adverse effects on the success of efficiency measures. Therefore, it is
important to have a basic understanding of behavioural dynamics.
First, it is important to considered that pro-environmental values do not necessarily lead to pro-
environmental behaviour. For example, Information campaigns as a policy measure implicitly
assume that awareness of the consequences of a certain behaviour combined with the ascription of
personal responsibility will lead to individual pro-environmental behaviour. Because of the so-called
value-action gap, which describes the disparity between individual’s concern for the environment
and their consumption patterns, this is not necessarily the case. An extreme example would be
environmental activists who frequently fly to their holiday destinations.
Another behavioural key is the importance of habit. It has been shown that individuals pay
disproportionate attention to options which are readily available (Wilson and Dowlatabadi 2007). This
has been leveraged in the case of electricity consumers in the city of Schönau in southern Germany.
There, the standard electricity utility “EWS Schönau” provides electricity from renewable energy
sources. Although this electricity is slightly more expensive than other options, most people tend to
stay with their default provider (Pichert and Katsikopoulos 2008). A possible option would be, hence,
to set the energy saving mode of new appliances as the default mode, as people are likely to keep

EPODE17393 82
this default setting (Stiftung Marktwirtschaft 2013). Interventions designed to leverage the role of
habit and subconscious decision-making are referred to as nudges by Thaler and Sunstein, who
ascribe significant energy savings potentials to this opportunity. As opposed to the Anglo-Saxon
context, nudging has not played a prominent role in German policy design to date. However, in 2014,
behavioural scientists were hired in the policy planning department of the German Government (FAZ
2014).
Another well-known theory with regards to the behavioural approach is the social learning theory
(Bandura 1977), which suggests that people learn from one another. Accordingly, energy efficiency
interventions based on teamwork have been shown to achieve better results than providing simple
energy saving tips (Rat für nachhaltige Entwicklung 2017). An example of an initiative leveraging
social learning are the “energy efficiency networks in industry”. These foster social learning effects by
supporting the formation of networks between different companies that exchange their approaches to
energy efficiency (DENA 2017).
Individuals are also strongly influenced by social norms, i.e. what “ought to be done” because their
peers do it (Steg et al 2013). In the American context, the energy utility Opower achieved a 2%
reduction in electricity use simply by informing consumers about their energy use relative to their
neighbours in so-called “Home Energy Reports” (Rat für nachhaltige Entwicklung 2017).
Another aspect refers to people’s self-identity, which is forged, negotiated and affirmed by material
goods or status symbols (Noppers et al 2014). Therefore, trends play an important role. In the case
of the large consumer base for organic food in Germany, it seems that organic food has become part
of the self-identity of a social group because it is possible to ascribe status with green product
choices.
In conclusion, further research on the behavioural dimension is needed. Pro-environmental behaviour
cannot be easily achieved by straightforward information campaigns. Rather, it is a complex issue, for
which there is certainly no perfect solution. While low-cost behavioural change might be induced by
information provision, costly or problematic behaviour changes require other, more sophisticated
interventions. Civic engagement, public dialogue and social networks need to be employed
particularly for progressive scenarios of sustainability, as those require profound changes in values,
norms and identities.

EPODE17393 83
7.4.4 The role of sufficiency in current energy efficiency policy
The concept of sufficiency adds an additional dimension to the discourse on energy savings. Rather
than seeing it in contrast to efficiency, it should be considered an alternative path towards the end
goal of energy savings. Sufficiency is closely intertwined with behavioural change and all its
complications and potentials. Policies aimed at a shift towards sufficiency must therefore be informed
by the behavioural approach discussed in section 7.4.3. Notwithstanding the complexity of changing
human behaviour, sufficiency can make an impact in the short term as unlike energy efficiency, it
does not require that old devices be swapped out over time.
The Öko-Institut defines sufficiency as a modification of consumption patterns that respect the
Earth’s ecological limits, while aspects of consumer benefits change (Öko-Institut 2013). The
sufficiency approach is helpful in providing a different perspective on energy savings than the
efficiency discourse offers: it puts needs and desires into the focus of attention and poses a question
about how these can be transformed (Wuppertal Institut 2015).
Policy instruments can enable sufficiency action through framework conditions, infrastructures and
service offerings. Supporting, regulating and informing instruments touch on device design, the
purchase and use of devices. Investing in sufficiency-related infrastructure in households belongs to
this category of instruments. These instruments aim to make energy sufficiency more acceptable and
practical in everyday life. For example, supporting communal laundry facilities or pick-up and delivery
laundry services, or even changing housing regulations to allow for a common drying room, can
foster less individual clothes drying and thereby sufficiency.
Examples of special cross-applications instruments is the idea to make electricity suppliers
responsible for the reduction of electricity consumption in households (via a cap and trade scheme on
the electricity consumption of all customers of a supply company together) and the support of
municipalities in reducing or stopping the growth of living space per person. As part of this, the
federal and state governments would need to finance the development of municipal living space
agencies that combine consultations, moving assistance and the transfer of grants or subsidies. In
addition, in the medium term, alternative living forms would need to be expanded (Wuppertal Institut
2015).
Ifeu et al. (2016) calculated the hypothetical case of complete implementation of measures in what
they refer to as the ‘sufficiency spectrum’ in combination with maximum exhaustion of energy
efficiency potential, which would theoretically result in electricity savings of up to 77% for the
households sector in Germany. This correlates with a reduction of up to 360 PJ/a, of which at least in
the short term two-third stems from energy sufficiency. In the medium to long term, efficient
appliances would take over a larger share of these savings.
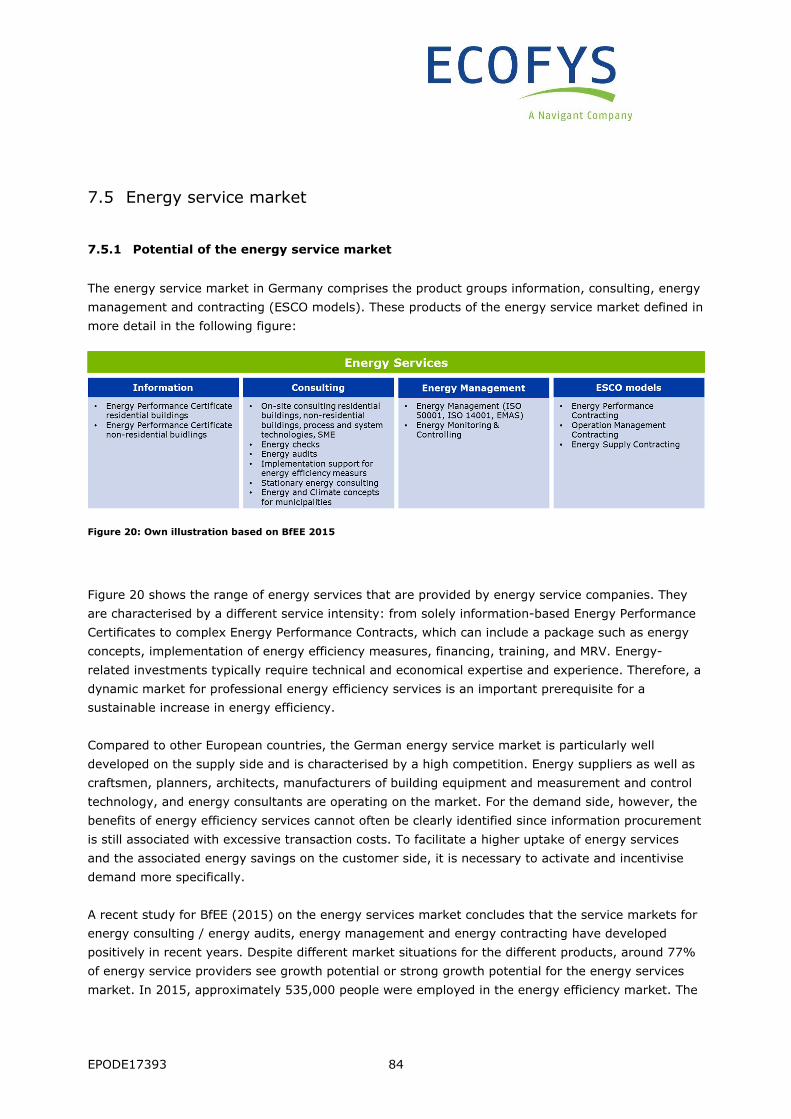
EPODE17393 84
7.5 Energy service market
7.5.1 Potential of the energy service market
The energy service market in Germany comprises the product groups information, consulting, energy
management and contracting (ESCO models). These products of the energy service market defined in
more detail in the following figure:
Figure 20: Own illustration based on BfEE 2015
Figure 20 shows the range of energy services that are provided by energy service companies. They
are characterised by a different service intensity: from solely information-based Energy Performance
Certificates to complex Energy Performance Contracts, which can include a package such as energy
concepts, implementation of energy efficiency measures, financing, training, and MRV. Energy-
related investments typically require technical and economical expertise and experience. Therefore, a
dynamic market for professional energy efficiency services is an important prerequisite for a
sustainable increase in energy efficiency.
Compared to other European countries, the German energy service market is particularly well
developed on the supply side and is characterised by a high competition. Energy suppliers as well as
craftsmen, planners, architects, manufacturers of building equipment and measurement and control
technology, and energy consultants are operating on the market. For the demand side, however, the
benefits of energy efficiency services cannot often be clearly identified since information procurement
is still associated with excessive transaction costs. To facilitate a higher uptake of energy services
and the associated energy savings on the customer side, it is necessary to activate and incentivise
demand more specifically.
A recent study for BfEE (2015) on the energy services market concludes that the service markets for
energy consulting / energy audits, energy management and energy contracting have developed
positively in recent years. Despite different market situations for the different products, around 77%
of energy service providers see growth potential or strong growth potential for the energy services
market. In 2015, approximately 535,000 people were employed in the energy efficiency market. The

EPODE17393 85
total turnover was about EUR 135 billion or 10% higher than in the previous year (DENEFF/PwC
2016).
Energy Performance Certificates provide information about the energy performance of a building for
the owner or potential buyers and tenants of an object. As laid down in the EU Energy Performance of
Buildings directive (EPBD), Energy Performance Certificates are mandatory for all buildings that are
newly constructed, sold or newly rented-out. All public buildings of more than 250m2 need to display
their Energy Performance Certificate. In 2015, more than 250,000 Energy Performance Certificates
had been registered in Germany.
According to the findings of the above-mentioned research, energy consulting is the most offered
and demanded energy service product. Around 14,000 companies are estimated to provide a variety
of energy consulting services. The market has increased from a volume of EUR 270 to 460 million in
2012 to EUR 480 to 520 million in 2015. Energy consulting is often an entry point for further energy
efficiency services and investments. A high potential on demand side is estimated, while currently
only around 1% of objects have been subject to energy consulting. Positive expectations dominate
the market as around 73% of energy service providers expect a market growth in terms of turnover
in the coming three years.
In the European Union, it is a prerequisite for non-SME companies to have a certified Energy
Management System in place or carry out energy audits every four years. Since 2016, in Germany,
all companies – which are not SMEs – need to have a certified Energy Management System in place
or an energy audit. For SMEs, this can alternatively be an energy audit or alternative systems to
improve energy efficiency. The market volume for energy management services is estimated around
EUR 250-500 million per year with a growth tendency.
Energy Performance Contracting (EPC) and Energy Supply Contracting have the highest
market volume of around EUR 7.2-8.4 billion with a steady annual increase (BfEE 2017b). The market
volume has increased from EUR 3.5-5 billion (2012) and EUR 1.7-2.4 billion (2010) (JRC, 2014).
More than 60% of energy service suppliers expect growth or even strong growth of the ESCO market
until 2020 (BfEE 2017b).
The market research conducted by BfEE finds around 500 specialised ESCOs and utilities providing
ESCO models while only around 10-15 ESCOs provide EPC in their portfolio. And while utilities only
generate 17%, ESCOs generate almost two thirds of their turnover from energy services (BfEE
2017b). ESCOs mainly originate from utilities, energy companies and independent energy service
companies (e.g. provider of building automation). Other market participants are energy consultants,
engineering firms, crafts businesses and planners. The following figure shows their share in the
market.

EPODE17393 86
Figure 21: Origin of ESCO model provider
(Source: based on BfEE 2017b)
Approximately 80-85% of all ESCO projects are energy supply contracts, while only 8-10% of the
market is covered with EPC (JRC, 2014). The remaining projects are other ESCO services which are
of less relevance in the market, e.g. operation contracting.
Energy supply contracts are usually smaller than Energy Performance Contracts. Energy supply
contracts target the supply of energy to the customer by fuel switching, the installation of renewable
energies, or efficient technologies such as small CHP plants. They are focussed on carbon emission
reduction rather than end-use energy consumption reduction. However, contracts may also include
such elements and can achieve savings of 15-20%. Energy Performance Contracts, on the other
hand, are larger in size and are often in the public sector. These contracts target energy savings, e.g.
through efficiency measures in the heating system, lighting, ventilation but can also include measures
targeting behavioural aspects of the users of a building. Some EPC contracts also include measures
with longer payback periods such as windows or building insulation if additional financial resources
are provided by the building owner. EPCs provide savings of usually around 20-25%.

EPODE17393 87
7.5.2 Barriers in energy service markets
Various barriers slow the development of the energy service markets in Germany. Among them are
(cf. BAFA 2013):
• Uncertainty regarding investments
• Capital shortages
• Investor-user dilemma
• Information and motivation deficiencies of the final customer
While an uncertainty regarding investments especially applies for measures with long return rates,
uncertainty also exists over the transaction burden as well as the cost-benefit ratio of measures.
Capital shortages exist in particular for private households and the public sector, but industry and
commerce also experience these shortages when energy efficiency investments compete with
investments in their core business. Given the large share of renters in Germany (cf. Chapter 2), the
investor-user dilemma remains a large barrier. This means that the person investing in energy
efficiency measures is not necessarily the beneficiary of the measure. ESCO models were originally
discussed as a potential way to overcome this barrier, in case the landlord agrees for the tenants to
pay the contracting fee, however in practice this remains uncommon.
Furthermore, an excess of information and no targeted attempts to address the information deficits
by consumers slows the uptake of efficiency measures. In addition, specific barriers can be found in
the energy service market. These include a lack of transparency for energy consulting, a mixing of
different energy services and the low willingness of consumers to pay (HRW, IFEU, Prognos 2013).
With regard to contracting as an energy service, barriers are the investment risks for the contractor,
information deficits of the customer and the complex legal set-up of contracting models, accompanied
by regulations on energy and electricity taxes. Small and medium sized companies in particular are
reluctant to take up energy services because energy costs only represent a small fraction of total
costs. Therefore, they lack incentives to invest outside of the core business and are often also lacking
dedicated energy efficiency staff.
The identification of suitable and innovative technologies in Germany is primarily the task of the
market actors. In the long run, technological solutions are only financially viable if there is a
matching demand. It is expected that digitalisation will create new opportunities for the development
of the energy market.

EPODE17393 88
7.5.3 Policies supporting energy service markets
Regulatory development as well as economic and social trends set the framework for the energy
service market. The development of energy prices and the environmental consciousness of
consumers play a large role and regulatory frameworks are important to provide investor confidence,
both for the supply and demand sides. Market transparency, quality standards and availability of
professionals jointly increase the attractiveness of the market for suppliers and consumers
(DENEFF/PWC 2015).
Important policies have promoted energy consultations for residential buildings (renters and owners)
as well as for SMEs and industry (buildings and processes). Additionally, the availability of tax relief
for companies that have implemented an energy management system has led to increased demand
since 2011. While in 2011 only 40 energy management systems were certified, in 2014 over 6,000
energy management systems were certified. Yet, so far it is not mandatory that energy saving
measures recommended by the energy management system certification process are implemented.
Furthermore, the German government has implemented two policies to improve the qualification of
professionals in this field (“Qualifizierungs- und Weiterbildungsoffensive” and “Qualitätssicherung am
Bau bei der Sanierung”). These policies are seen by 60% of energy service companies surveyed
annually by DENEFF as an important policy to expand their business (DENEFF/PWC 2015). However,
almost the same amount of survey companies sees further improvements as necessary. This is due
to the fact that different energy consultations (e.g. for industry or residential buildings) are not a
circumscribed product with limited transparency for customers. Therefore, no competition over
quality is currently taking place.
Two policies promoted by the National Action Plan Energy Efficiency, namely raising the ceiling of the
existing loan guarantee scheme for energy performance contracting and the tendering scheme for
energy savings, are not yet seen as important drivers for business development on the energy
service market (DENEFF/PWC 2015). Given their recent introduction, this could very well be
attributed to limited publicity of the measures and a small funding volume at present.
It is expected that digitalisation will create new opportunities for the development of the energy
saving contracting and will also help develop new business models (e.g. accounting, measurement of
energy savings, cost allocation) (BMWi 2016e).

EPODE17393 89
Example 5: Energy Performance Contracting
Energy Performance Contracting (EPC) is a concept in which an Energy Service Company (ESCO)
invests in energy efficiency measures in several buildings of a similar kind (pool of buildings) or a
single large building and obtains returns on its investments through the achieved energy efficiency
gains. In Berlin, this concept was introduced in the mid-90s mainly for public buildings and is
known as “Energy Saving Partnership”. The state’s energy agency acts as a facilitator for the
process and supports the public administrations of the districts in implementing the concept.
The public authority selects the buildings and looks for the best offer through a public tender
procedure. The winning ESCO is selected by elements such as:
Quantifiable criteria Non-quantifiable criteria
Volume of investment Evaluation of concept of measures
Guaranteed energy cost savings Energy management concept
Reduction of CO2 emissions Maintenance concept
Evaluation of user motivation concept
After the best proposal is selected, the ESCO implements the proposed measures and validates its
energy savings compared to a baseline. An important aspect of the contract are the guaranteed
energy cost savings which means that if the ESCO does not achieve the amount of savings
guaranteed in the contract, it either needs to implement additional energy efficiency measures or
pay the difference to the contracting authority. The following figure shows the development of
energy costs over time within an EPC contract. The “contracting rate” represents the achieved
energy costs savings by the ESCO. After the end of the contract, the building owner is the
beneficiary of the cost savings.
Figure 22: Simplified presentation of an EPC model
(Own figure)
Contract start Contract end
Saved energy costs (Contracting Rate)
Energy costs before and after the implementation of measures
Energy cost (€)
Time

EPODE17393 90
In Berlin, more than 27 building pools, including more than 1,600 buildings have been modernised
through this concept since 1996. On average, the projects achieved energy savings of more than
25%, creating energy cost savings of around EUR 2.8 million per year which makes this a best
practice example. Overall EUR 55 million have been invested.
Figure 23: Energy performance contracting (Best practice example 5)

EPODE17393 91
8 Outlook
In Germany, significant steps have been taken to promote the Energiewende. At the same time,
considerable efforts will still be needed to reach the target path and tap the existing energy savings
potentials. Currently, the renewable energy targets for 2020 are expected to be achieved, but
presumably there will be a significant gap (~8%) in the climate protection target and also in energy
efficiency targets. The achievement of German energy efficiency targets depends also on ambitious
policies on EU level. These are currently not overly ambitious but the European Commission proposed
a binding 30% energy efficiency target for 2030, which would consequently result in additional
efforts. However, not all European Member States support a more ambitious energy and climate
policy and try to create loopholes to water down energy efficiency targets and obligations.
The German Energiewende has been focused on power generation and the development of renewable
energies so far. But the heating and transport sector will be crucial in the future to show the way to
reach the energy transition. On the one hand, a climate-neutral building stock can only be reached by
significantly increasing the renovation rate, promote deep renovation of the existing building stock
and setting ambitious requirements for new buildings. In the transport sector, on the other hand, the
efficiency of vehicles needs to be drastically increased but reducing the total fleet and improving
modal shift are considerable challenges as well. Here, current developments move in the other
direction, e.g. the target of 1 million electric vehicles in 2020 was dropped by the government, the
share of road freight transport still ranges by three-quarter of the entire freight transport and both,
passenger and freight vehicles have constantly increased in total numbers in the last years.
Consequently, the existing policy mix which comprises in particular subsidy and energy advisory
programmes is not sufficient to meet the challenges also in the longer run towards 2030 and 2050.
The government has substantially build up capacities (staff and finance) in energy efficiency in recent
years but the demand for many subsidy programmes is rather low. About one third of the funds,
which were made available for energy savings measures by the Energy and Climate Fund in 2016 and
which would have added up to 2.4 billion EUR, were not drawn down. This means that other barriers
need to be removed and further policies and instruments be developed in order to achieve the
required energy savings. Climate protection and energy efficiency considerations need to be
mainstreamed through all policy and investment decisions, e.g. by consequently implementing the
‘energy efficiency first’ principle. Thus, even stronger interfering instruments as regulatory or price
control measures as well as planning measures need to be considered.
In addition, the co-benefits deriving from the energy efficiency actions must be clearly stressed, e.g.
improved air quality, health, comfort of living as well as macroeconomic impacts. According to model
calculations, additional investments of more than 100 billion Euros2005 are needed by the year 2020
which need to be triggered by the energy efficiency policy. A large part of these investments are in
the construction sector. Co-benefits of an ambitious energy efficiency policy will also materialise in
terms of employment. The model calculations also show a positive effect on employment of almost

EPODE17393 92
190,000 full-time jobs in 2020 (BMWi 2016e, p.12/13). Finally, resource and energy efficiency will
become increasingly important international competitive advantages in the next few years.
The Climate Action Plan 2050 and the Green Book Energy Efficiency introduce a paradigm shift which
aims to rethink renewable energies and energy efficiency. While until now both have been considered
as technologies which need to be integrated as climate technologies into the established fossil fuel
based markets they now become the standard for investments. This includes firstly the “energy
efficiency first” principle. The energy demand in industry, buildings and transport has to be
significantly and sustainably reduced. Then, secondly, renewable energies meet the remaining energy
demand and, thirdly, where appropriate and possible, renewable electricity is used for heating,
transport and industry (sector coupling). Renewable fuels such as biomass are used where electricity
cannot be used, especially in the aviation and shipping sectors, as well as in parts of the industry. In
the future, however, it will be necessary to clarify to what extent the sector coupling and ongoing
digitalisation influence the development of energy efficiency.
Digitalisation affects all levels of the energy value chain. The analysis of increasingly large amounts of
data is used to identify new efficiency potentials. Electricity networks, for example, can be linked
intelligently to each other and to electricity generation and consumption through the use of modern
technologies. New actors (prosumers) will be involved in it. In the area of energy and resource
savings, digitalisation will also open up great potential. This applies in particular to intelligent
buildings, transport optimisation and intelligent production systems. Digitalisation has the potential to
revolutionise our lifestyles and brings great possibilities for energy efficiency. However, acceptance
and timing are still uncertain and data security issues have to be solved.
Ultimately, the Energiewende is based on societal consensus and can only be implemented together
with all stakeholders. The Government has launched a broad-based consultation processes with the
Energiewende platforms (energy efficiency, buildings, etc.), the dialogue process on the Climate
Action Plan 2050 and the consultation on the "Green Paper on Energy Efficiency". The government
will need to continue along this path to ensure that the Energiewende is accepted and supported by
society as a whole.

EPODE17393 93
9 Sources
ACEA (2017): CO2-Based Motor Vehicle Taxes in the EU. URL:
http://www.acea.be/uploads/publications/CO2_tax_overview_2017.pdf
AGEB (2016): Auswertungstabellen zur Energiebilanz Deutschland.
Agora Energiewende (2015): Flex-Efficiency. Ein Konzept zur Integration von Effizienz und
Flexibilität bei industriellen Verbrauchern. URL: https://www.agora-
energiewende.de/fileadmin/Projekte/2015/Flex-Efficiency/Agora_Flex-Efficiency_WEB.pdf.
Allcott, H., & Mullainathan, S. (2010): Behavior and energy policy. Science, 327(5970), 1204-
1205.
Aral (2015): Aral Studie – Trends beim Autokauf 2015. URL:
http://www.aral.de/content/dam/aral/Presse%20Assets/pdfs%20Brosch%C3%BCren/trends-beim-
autokauf-2015.pdf.
BAFA (2013): Marktanalyse und Marktbewertung sowie Erstellung eines Konzeptes zur
Marktbeobachtung für ausgewählte Dienstleistungen im Bereich Energieeffizienz. URL:
http://www.bmwi.de/BMWi/Redaktion/PDF/Publikationen/Studien/marktanalyse-und-konzept-zur-
marktbeobachtung-fuer-dienstleistungen-im-bereich-
energieeffizienz,property=pdf,bereich=bmwi2012,sprache=de,rwb=true.pdf.
BAFA (2016): Förderung von Querschnitttechnologien. URL:
http://www.bafa.de/DE/Energie/Energieeffizienz/Querschnittstechnologien/querschnittstechnologien_
node.html.
BAFA (2017a): Einsparzähler (Pilotprogramm). URL:
http://www.bafa.de/DE/Energie/Energieeffizienz/Einsparzaehler/einsparzaehler_node.html.
BAFA (2017b): Elektromobilität Umweltbonus. URL:
http://www.bafa.de/DE/Energie/Energieeffizienz/Elektromobilitaet/elektromobilitaet_node.html.
Bandura, A., & Walters, R. H. (1977): Social learning theory.
BBSR (2017): Digitale Stadt. URL:
http://www.bbsr.bund.de/BBSR/DE/Stadtentwicklung/StadtentwicklungDeutschland/digitale-
stadt/digitale-stadt-node.html.
EPODE17393 94
Bdew (2016): Energiedaten. URL:
https://www.bdew.de/internet.nsf/id/DE_Energiedaten#cat/Daten%2FGrafiken%5CEnergie%20allge
mein%5CEnergiedaten%5C1.%20Energie%20allgemein/1-2-endenergieverbrauch-nach-
energietraegern-de
Berlin Partner for Business and Technology (2017): Smart City Berlin Network. URL:
http://www.berlin-partner.de/en/the-berlin-location/smart-city-berlin/smart-city-berlin-network/.
BfEE (2015): Untersuchung des Markts für Energieaudits, Energiedienstleistungen und andere
Energieeffizienzmaßnahmen. Definitionen von EDL-Produkten. Eschborn 2015.
BfEE (2017a): Vorbild Öffentlicher Sektor. URL: http://bfee-
online.de/bfee/europa_und_deutschland/vorbild_oeffentlicher_sektor/index.html.
BfEE (2017b): Untersuchung des Markts für Energieaudits, Energiedienstleistungen und andere
Energieeffizienzmaßnahmen. Presentation. Eschborn, 26.01.2017.
BMBF (2014): The new High-Tech Strategy. Innovations for Germany. URL:
https://www.bmbf.de/pub/HTS_Broschuere_eng.pdf.
BMUB (2016a): Klimaschutzplan 2050. ULR:
http://www.bmub.bund.de/fileadmin/Daten_BMU/Download_PDF/Klimaschutz/klimaschutzplan_2050
_bf.pdf.
BMUB (2016b): General information – Emissions Trading. ULR:
http://www.bmub.bund.de/en/topics/climate-energy/emissions-trading/general-information/.
BMUB (2017): Arbeit und Struktur des IMA Stadt. URL:
http://www.bmub.bund.de/themen/nachhaltigkeit-internationales/nachhaltige-entwicklung/arbeit-
und-struktur-des-ima-stadt/.
BMVBS (2013): Die Mobilitäts- und Kraftstoffstrategie der Bundesregierung (MKS). Energie auf
neuen Wegen. URL: https://www.bmvi.de/SharedDocs/DE/Anlage/UI-MKS/mks-strategie-
final.pdf?__blob=publicationFile.
BMWi (2014a): Sanierungsbedarf im Gebäudebestand. Ein Beitrag zur Energieeffizienzstrategie
Gebäude. URL: https://www.bmwi.de/Redaktion/DE/Publikationen/Energie/sanierungsbedarf-im-
gebaeudebestand.pdf?__blob=publicationFile&v=3.
BMWi (2014b): Monitoring of the energy transition. URL:
http://www.bmwi.de/EN/Topics/Energy/Energy-Transition/monitoring.html.

EPODE17393 95
BMWi (2015a): Anteil Erneuerbare Energien URL:
http://www.bmwi.de/EN/Service/search,did=695286.html.
BMWi (2015b): Ein Strommarkt für die Energiewende, URL:
http://www.bmwi.de/Redaktion/DE/Publikationen/Energie/weissbuch.pdf?__blob=publicationFile&v=2
9 .
BMWI (2015c): Die Energie der Zukunft. 5. Monitoring-Bericht zur Energiewende. URL:
https://www.bmwi.de/Redaktion/DE/Publikationen/Energie/fuenfter-monitoring-bericht-energie-der-
zukunft.pdf?__blob=publicationFile&v=38.
BMWi (2015d): CO2-Gebäudesanierung. URL:
http://www.bmwi.de/DE/Themen/Energie/Gebaeude/co2-gebaeudesanierungsprogramm.html.
BMWi (2016a): Erneuerbare Energien in Deutschland: Nationale und internationale Entwicklung im
Jahr 2015, URL: https://www.bmwi.de/Redaktion/DE/Publikationen/Energie/erneuerbare-energien-
in-zahlen-2015-09.pdf?__blob=publicationFile&v=14
BMWi (2016b): Energie- und Klimafonds.
https://www.bundesregierung.de/Webs/Breg/DE/Themen/Energiewende/EnergieErzeugen/energie_kli
mafonds/_node.html.
BMWi (2016c): Digitale Strategie 2025. URL:
https://www.bmwi.de/Redaktion/DE/Publikationen/Digitale-Welt/digitale-strategie-2025.html.
BMWi (2016d): Gesetz zur Digitalisierung der Energiewende. URL:
https://www.bmwi.de/Redaktion/DE/Downloads/Gesetz/gesetz-zur-digitalisierung-der-
energiewende.pdf?__blob=publicationFile&v=4.
BMWi (2016e): Grünbuch Energieeffizienz. URL:
https://www.bmwi.de/Redaktion/DE/Publikationen/Energie/gruenbuch-energieffizienz-august-
2016.html.
BMWi (2017a): Energieeffizienz in Zahlen. URL:
http://www.bmwi.de/Redaktion/DE/Publikationen/Energie/energieeffizienz-in-
zahlen.pdf?__blob=publicationFile&v=10.
BMWi (2017b): Energieeffizienzstrategie Gebäude. Wege zu einem nahezu klimaneutralen
Gebäudebestand. URL:
https://www.bmwi.de/Redaktion/DE/Publikationen/Energie/energieeffizienzstrategie-
gebaeude.pdf?__blob=publicationFile&v=25

EPODE17393 96
BMWi (2017c): For a future of green energy. URL:
https://www.bmwi.de/Redaktion/EN/Dossier/renewable-energy.html.
BMWi (2017d): Förderprogramm SINTEG: "Schaufenster intelligente Energie - Digitale Agenda für
die Energiewende" URL: https://www.bmwi.de/Redaktion/DE/Artikel/Energie/sinteg.html.
BMWi/BMU (2010): Energy Concept for an Environmentally Sound, Reliable and Affordable Energy
Supply.
BMWi/BMU (2014): Fortschrittsbericht Energiewende 2014.
BUND (2012): Top-Runner für Deutschland. Studie: Mit nationalen Top-Runner-Instrumenten zum
Stromsparziel der Bundesregierung.
Bundesregierung (Hg.) (2011): Regierungsprogramm Elektromobilität. URL:
http://www.bmub.bund.de/fileadmin/Daten_BMU/Download_PDF/Verkehr/regierungsprogramm_emo
b_bf.pdf.
Bürger, V. (2009): Identifikation, Quantifizierung und Systematisierung technischer und
verhaltensbedingter Stromeinsparpotenziale privater Haushalte. TRANSPOSE Working Paper No3.
Öko‐Institut e. V., Freiburg.
Darby, S. (2006). The effectiveness of feedback on energy consumption. A Review for DEFRA of the
Literature on Metering, Billing and direct Displays, 486(2006).
Deloitte (2016): Industrie 4.0 im Mittelstand. URL:
https://www2.deloitte.com/content/dam/Deloitte/de/Documents/Mittelstand/industrie-4-0-
mittelstand-komplett-safe.pdf.
Dena (2016): dena-Gebäudereport 2016.
Dena (2017): Initiative Energieeffizienz Netzwerke. URL: http://www.effizienznetzwerke.org/.
Department of Energy (2017): Demand Response URL:
https://energy.gov/oe/services/technology-development/smart-grid/demand-response.
Destatista (2013): Verteilung der Haushalte in Deutschland nach Miete und Eigentum von 1998 bis
2013. URL: https://de.statista.com/statistik/daten/studie/237719/umfrage/verteilung-der-haushalte-
in-deutschland-nach-miete-und-eigentum/.
DIN & DKE (2014): Deutsche Normungsroadmap - Smart City. URL:
http://www.din.de/blob/63114/a8ed32d4067c50e2334a505d124128a3/smart-cities-roadmap-v1-1-
data.pdf.

EPODE17393 97
DKV (2017): What you need to know about the truck toll in Germany. URL: https://www.dkv-
euroservice.com/gb/services/toll/toll-services-by-country/germany/.
Ebert, T. Essig, N. and Hauser, G. (2010): Zertifizierungssysteme für Gebäude. DETAIL Green
Books.
E-Bridge, IAEW, OFFIS (2014): Moderne Verteilernetze für Deutschland (Verteilernetzstudie).
Studie im Auftrag des Bundesministeriums für Wirtschaft und Energie.
Ecofys, ifeu, Wuppertal Institut (2017): Weiterentwicklung der Energieeffizienzpolitiken zur
Erreichung der Klimaschutzziele der Europäischen Union bis 2050. On behalf of the Germany Federal
Environment Agency.
Energy Efficiency Watch 3 (EEW 3) (2016): How to make Europe Number 1 in Energy Efficiency.
Key results from the Energy-Efficiency-Watch-Project. URL: http://www.energy-efficiency-
watch.org/fileadmin/eew_documents/EEW3/EEW3_Brochure/Brochure_final_english.pdf.
EU Energy Labels (2015): URL: http://www.euenergylabels.com/.
European Commission (2015): Commission Staff Working Document. Impact Assessment.
Proposal for a Regulation of the European Parliament and of the Council setting a framework for
energy efficiency labelling and repealing Directive 2010/30/EU. URL:
https://ec.europa.eu/energy/sites/ener/files/documents/1_EN_impact_assessment_part1_v7.pdf.
European Commission (2016a) Demand Response status in EU Member States. European
Commission. URL:
http://publications.jrc.ec.europa.eu/repository/bitstream/JRC101191/ldna27998enn.pdf.
European Commission (2016b): Smart Cities. URL: https://eu-smartcities.eu/.
European Commission (2017): European legislation on reuse of public sector information. URL:
https://ec.europa.eu/digital-single-market/en/european-legislation-reuse-public-sector-information.
European Council (2014): European Council Conclusions (23 and 24 October). 2030 Climate and
Energy Policy Framework. URL:
http://www.consilium.europa.eu/uedocs/cms_data/docs/pressdata/en/ec/145397.pdf.
Eurostat (2016): Household Composition Statistics. URL: http://ec.europa.eu/eurostat/statistics-
explained/index.php/Household_composition_statistics.
Eurostat (2017): Electricity price statistics. URL: http://ec.europa.eu/eurostat/statistics-
explained/index.php/Electricity_price_statistics.

EPODE17393 98
ETSI (2015): SSCC-CG Final report. Smart and Sustainable Cities and Communities Coordination
Group. http://www.etsi.org/images/files/SSCC-CG_Final_Report-recommendations_Jan_2015.pdf.
FAZ (2014): Kanzlerin Angela Merkel sucht Verhaltensforscher. URL:
http://www.faz.net/aktuell/wirtschaft/wirtschaftspolitik/kanzlerin-angela-merkel-sucht-
verhaltensforscher-13118345.html.
Federal Government of Germany (2014): Digital Agenda 2014-2017. URL: https://www.digitale-
agenda.de/Content/DE/_Anlagen/2014/08/2014-08-20-digitale-agenda-
engl.pdf;jsessionid=F9F646966933C98EC14BBD712C7D9229.s1t1?__blob=publicationFile&v=6.
Fleiter, T., Schlomann, B., und Wolfgang Eichhammer (2013): Energieverbrauch und CO2-
Emissionen industrieller Prozesstechnologien – Einsparpotenziale, Hemmnisse und Instrumente.
Fraunhofer-Institut für System- und Innovationsforschung.
Fraunhofer ISI (2011): Energieverbrauch des Sektors Gewerbe, Handel und Dienstleistungen
(GHD) in Deutschland für die Jahre 2007 bis 2010.
Fraunhofer ISI (2012a): Concrete Paths of the European Union to the 2°C Scenario: Achieving the
Climate Protection Targets of the EU by 2050 through Strucutral Change, Energy Savings and Energy
Efficiency Technologies. BMUB.
Fraunhofer ISI (2012b): ODYSSEE-MURE. Energy Efficiency Policies and Measures in Germany.
URL: http://www.isi.fraunhofer.de/isi-wAssets/docs/x/de/publikationen/National-
Report_Germany_November-2012.pdf.
Fraunhofer ISI, Ecofys, Öko-Institut (2012): Kosten-/Nutzen-Analyse der Einführung
marktorientierter Instrumente zur Realisierung von Endenergieeinsparungen in Deutschland.
Endbericht an das BMWi.
Fraunhofer ISI, Prognos, ISAM, Ifeu, HfWU (2014): Ausarbeitung von Instrumenten zur
Realisierung von Endenergieeinsparungen in Deutschland auf Grundlage einer Kosten-/Nutzen-
Analyse. Wissenschaftliche Unterstützung bei der Erarbeitung des Nationalen Aktionsplans
Energieeffizienz (NAPE). Projekt BfEE 01/2014. Zusammenfassung.
Fraunhofer ISI, TU Vienna, PwC (2014a): Study evaluating the current energy efficiency policy
framework in the EU and providing orientation on policy options for realising the cost-effective energy
efficiency/saving potential until 2020 and beyond. Full report. Report on behalf of DG ENER.
Fraunhofer ISI, TU Vienna, PwC (2014b): Study evaluating the current energy efficiency policy
framework in the EU and providing orientation on policy options for realising the cost-effective energy
efficiency/saving potential until 2020 and beyond. Country Annex 3: Modelling Analysis. Report on
behalf of DG ENER.

EPODE17393 99
Fraunhofer ISI, Ecofys, Öko-Institut, IRRES (2016): Entwicklung eines Konzepts für das
Erreichen der nationalen Energieeinsparziele bis 2020 und bis 2050 auch unter Berücksichtigung
relevanter EU-Vorgaben im Kontext einer ganzheitlichen Klima- und Energiepolitik („Aktionsplan
Energieeffizienz“).
Frondel, M., Ritter, N., & Vance, C. (2012): Heterogeneity in the rebound effect: Further evidence
for Germany. Energy Economics, 34(2), 461-467.
GeSI & BCG (2012): SMARTer 2020: The Role of ICT in Driving a Sustainable Future.
Gils, H.C. (2014): Assessment of the theoretical demand response potential in Europe, Energy.
Gillingham, K., Kotchen, M. J., Rapson, D. S., & Wagner, G. (2013). “Energy policy: The
rebound effect is overplayed.” Nature, 493(7433), 475-476.
Hoffmann P., Frey G., Friedrich M., Kerber-Clasen S. (2012) Energieeinsparung durch Smart
Metering mit Verbrauchs-Feedback. Energiewirtschaftliche Tagesfragen. URL: http://et-energie-
online.de/Portals/0/PDF/jahresspecial_2012.pdf.
IEA (2013): World Energy Outlook. URL:
http://www.iea.org/publications/freepublications/publication/WEO2013.pdf.
IEA (2016): Energy Efficiency and the Internet of Things. Technology and Energy Assessment
Report. Prepared for IEA 4E EDNA.
Ifeu, Fraunhofer ISI et al. (2011): Energieeffizienz: Potenziale, volkswirtschaftliche Effekte und
innovative Handlungs- und Förderfelder für die Nationale Klimaschutzinitiative.
Ifeu & GEF (2013): Wie kann in Fernwärmenetzen der Anteil erneuerbarer Energie erhöht warden?
In: Euroheat&Power, Jg. 42. URL:
http://www.gef.de/fileadmin/Dateien/Publikationen/Transformation_statt_Wende_EH_P_Heft_6_2013
Ifeu, Wuppertal Institut & Universität der Künste Berlin (2016): Energiesuffizienz -Strategien
und Instrumente für eine technische, systemische und kulturelle Transformation zur nachhaltigen
Begrenzung des Energiebedarfs im Konsumfeld Bauen / Wohnen. URL:
https://www.ifeu.de/energie/pdf/Energiesuffizienz_Endbericht_161222.pdf.
Institut für nachhaltige Energie- und Ressourcennutzung (2015): Strukturelle
Rahmenbedingungen für Energieeinsparungen und Energieeffizienzsteigerungen beim
Stromverbrauch in Haushalten. Dr. Dörte Ohlhorst. „Naturverträgliche Energiewende – Zwischen allen
Stühlen?“ Vilm, 7. Oktober 2015.

EPODE17393 100
Institut Wohnen und Umwelt, Fraunhofer IFAM (2014): Monitoring der KfW-Programme
„Energieeffizient Sanieren“ und „Energieeffizient Bauen“ 2013. Darmstadt, Bremen. URL:
https://www.kfw.de/PDF/Download-Center/Konzernthemen/Research/PDF-Dokumente-alle-
Evaluationen/Monitoringbericht_2013_05-12-2014.pdf.
JRC (2014): ESCO Market Report 2013. Ispra, Italy.
KfW (2015a): KfW-Energieeffizienzprogramm - Energieeffizient Bauen und Sanieren. URL:
https://www.kfw.de/inlandsfoerderung/Unternehmen/Energie-Umwelt/Förderprodukte/EE-Bauen-
und-Sanieren-Unternehmen-276-277-278/ .
KfW (2015b): KfW-Energieeffizienzprogramm - Produktionsanlagen/-prozesse. URL:
https://www.kfw.de/inlandsfoerderung/Unternehmen/Energie-Umwelt/Förderprodukte/EE-
Produktion-292-293/ .
KfW (2015c): KfW-Finanzierungsinitiative Energiewende. URL: https://www.kfw.de/Download-
Center/F%C3%B6rderprogramme-(Inlandsf%C3%B6rderung)/PDF-Dokumente/6000002284-
Merkblatt-KfW-Finanzierungsinitiative-Energiewende.pdf.
KfW (2015d): Profile the SME Sector in Germany. URL:
https://www.kfw.de/migration/Weiterleitung-zur-Startseite/Homepage/KfW-Group/Research/PDF-
Files/The-SME-sector-in-Germany.pdf.
Khansari, N., Mostashari, A., & Mansouri, M. (2014): Impacting sustainable behavior and
planning in smart city. International Journal of Sustainable Land Use and Urban Planning (IJSLUP),
1(2).
Kitchin, R. (2016): Getting smarter about smart cities: Improving data privacy and data security.
Manville, C. et al. (2014): Mapping smart cities in the EU.
Nadel, S. (2012). “The Rebound Effect: Large or Small?”. American Council for an Energy-Efficient
Economy.
NEEAP 2017. Nationaler Energieeffizienz-Aktionsplan (NEEAP) 2017 der Bundesrepublik Deutschland
Noppers, E. H., Keizer, K., Bolderdijk, J. W., & Steg, L. (2014): The adoption of sustainable
innovations: driven by symbolic and environmental motives. Global Environmental Change, 25, 52-
62.
Öko-Institut (2013): Mehr als nur weniger. Suffizienz: Begriff, Begründung und Potenziale.
Working Paper URL: https://www.oeko.de/oekodoc/1836/2013-505-de.pdf.

EPODE17393 101
Pichert, D., & Katsikopoulos, K. V. (2008): Green defaults: Information presentation and pro-
environmental behaviour. Journal of Environmental Psychology, 28(1), 63-73.
Prognos AG, IAEW (2014): Benefits of Energy Efficiency on the German Power Sector. URL:
https://www.agora-energiewende.de/fileadmin/Projekte/2012/positive-effekte-
energieeffizienz/Agora_ECF_RAP_System_Benefit_Study_final_report_web.pdf.
Pyc, I. (2013): VDE-Studie: Erneuerbare Energien braucht flexible Kraftwerke –Szenarien bis 2020,
URL:
https://www.vde.com/de/regionalorganisation/bezirksvereine/suedbayern/facharbeit%20regional/ake
nergietechnik/documents/vortrag%2021-11-2013%20flexible%20kraftwerke.pdf.
Rat für nachhaltige Entwicklung (2017): Motivieren statt Bestrafen. URL:
http://www.nachhaltigkeitsrat.de/index.php?id=7432.
Radecki et al. (2015): Smart Impact, URBACT study on Local Impacts from Smart City Planning, 6.
Sachverständigen Rat (2016): Jahresgutachten 2016/17. Zeit für Reformen. URL:
https://www.sachverstaendigenrat-wirtschaft.de/jahresgutachten-2016-2017.html.
Santarius, Tilman (2014): Der Rebound-Effekt: ein blinder Fleck der sozial-ökologischen
Gesellschafts-Transformation. In: GAIA - Ecological Perspectives for Science and Society.
Schipper, L. and M. Grubb (2000): On the rebound? Feedback between energy intensities and
energy uses in IEA countries. Energy Policy 28: 367-388.
Sorrel, S. (2007): The Rebound Effect: an assessment of the evidence for economy-wide energy
savings from improved energy efficiency. London: UK Energy Research Centre.
SRU (2005): Umwelt und Straßenverkehr. Hohe Mobilität – Umweltverträglicher Verkehr.
Sondergutachten. URL:
http://www.umweltrat.de/SharedDocs/Downloads/DE/02_Sondergutachten/2005_SG_Umwelt_und_S
trassenverkehr.pdf?__blob=publicationFile.
Statistisches Bundesamt (2016): Umweltökonomische Gesamtrechnung 2016 – Nachhaltige
Entwicklung in Deutschland Indikatoren zu Umwelt und Ökonomie. URL:
https://www.destatis.de/DE/Publikationen/Thematisch/UmweltoekonomischeGesamtrechnungen/Um
weltindikatoren/IndikatorenPDF_5850012.pdf?__blob=publicationFile.
Stiftung Marktwirtschaft (2013): Mit Nudging zur Energiewende? URL: http://www.stiftung-
marktwirtschaft.de/uploads/tx_ttproducts/datasheet/Tagungsbericht_Nudging_04_06_2013.pdf.

EPODE17393 102
Theron (2015): Deutschland auf dem Irrweg. URL: http://www.theron.com/2015-die-
publikationen/smart-metering-deutschland-auf-dem-irrweg/.
Thomas, S. (2012) “Energieeffizienz spart wirklich Energie: Erkenntnisse zum Thema ‚Rebound-
Effekte’“. Wuppertal Institut für Klima, Umwelt, Energie.
UBA (Hg.) (2011): Leitkonzept – Stadt und Region der kurzen Wege. Gutachten im Kontext der
Biodiversitätsstrategie. Dessau-Roßlau. URL:
https://www.umweltbundesamt.de/sites/default/files/medien/461/publikationen/4151.pdf.
UBA (Hg.) (2014a): Umweltverträglicher Verkehr 2050: Argumente für eine Mobilitätsstrategie für
Deutschland. URL:
https://www.umweltbundesamt.de/sites/default/files/medien/378/publikationen/texte_59_2014_um
weltvertraeglicher_verkehr_2050_0.pdf.
UBA (2014b): Green IT- Initiative der Bundesverwaltung erfolgreich.
http://www.umweltbundesamt.de/themen/green-it-initiative-der-bundesverwaltung.
UBA (2015): Treibhausgasemissionen. URL:
http://www.umweltbundesamt.de/daten/klimawandel/treibhausgas-emissionen-in-deutschland.
UBA (2016): Rebound-Effekte: Wie können sie effektiv begrenzt werden? URL:
http://www.umweltbundesamt.de/sites/default/files/medien/376/publikationen/rebound-
effekte_wie_koennen_sie_effektiv_begrenzt_werden_handbuch.pdf.
UBA (2017): Datenbasis zur Bewertung von Energieeffizienzmaßnahmen in der Zeitreihe 2005-
2014. URL: https://www.umweltbundesamt.de/sites/default/files/medien/1968/publikationen/2017-
01-09_cc_01-2017_endbericht-datenbasis-energieeffizienz.pdf.
Van Elburg, H. (2014): Dutch Energy Savings Monitor for the Smart Meter. Rijksdienst voor
Ondernemend Nederland Report.
VDE (2012): Demand Side Integration –Lastverschiebungspotenziale in Deutschland
WBGU (2016): Der Umzug der Menschheit: Die transformative Kraft der Städte.
Wilson, C., & Dowlatabadi, H. (2007): Models of decision making and residential energy use.
Annu. Rev. Environ. Resour., 32, 169-203.
Wuppertal Institut (2002): Von nichts zu viel. Suffizienz gehört zur Zukunftsfähigkeit. Wuppertal
Institut für Klima, Umwelt, Energie.

EPODE17393 103
Wuppertal Institut (2015): Energy Sufficiency Policy: An evolution of energy efficiency policy or
radically new approaches? Wuppertal Institut für Klima, Umwelt und Energie. URL:
https://energiesuffizienz.files.wordpress.com/2015/05/1-060-15_thomas_final_150316.pdf.

EPODE17393 104
Part II: Country Report Japan
By: Atsushi Kurosawa

EPODE17393 105
1 Introduction
1.1 About this study
This country report of Japan is the summary of Work Package 1 ‘Analysis’ in the strategic topic 4
‘Energy end-use efficiency potentials and policies and the development of energy service markets’ of
German-Japanese Energy Transition Council (GJETC).
Looking back at history, two oil shocks in the 1970s were the initial milestones that influenced energy
efficiency improvement in Japan. After the shocks, various energy saving technologies have been
widely disseminated through energy efficiency improvement in production processes and end-use
energy equipment developments by businesses and institutions for energy management and energy
efficiency. They resulted in the decrease of final energy consumption per activity as well as the
improvement of energy security on the supply side. From other perspectives, the issues raised after
the 1990s, such as the global environmental agenda and the Great East Japan Earthquake, were the
influential factors in energy efficiency improvement in Japan.
In this report, Japanese energy efficiency potential and policies are surveyed and new energy market
opportunity is discussed.
1.2 End-use energy consumption trends
It is essential to know the current status of end-use energy before discussing end-use efficiency
potentials and policies. Energy White Paper 2016 (METI 2016) reported the energy supply and
demand overview in Japan. The sectoral share of final energy consumption in Japan in 2014 was
44.8% in industry, 17.8% in commercial, 14.3% in residential and 23.1% in transportation. Following
a trend of roughly 40 years, Japan's industrial energy consumption has remained almost unchanged
since the oil crisis in the 1970s, but consumption and share of residential, commercial, transportation
are expanding (see Figure 24).

EPODE17393 106
Figure 24: End-use energy consumption in Japan
1.3 Long-term energy supply and demand outlook
Figure 25 shows the transition of final energy consumption in the Long-term Energy Supply and
Demand Outlook. Both the reference case and the aggressive conservation case are shown for 2030
figures, and the difference between the two corresponds to the energy saving potential.
The Paris Agreement of United Nations Framework of Climate Change requested mid-century target
for parties. Currently, some Japanese government ministries discuss mid-century low carbon social
system but comprehensive energy package plan with policy initiatives has not shown. Therefore, we
limit the policy related discussion up to 2030 in Japan report.

EPODE17393 107
Figure 25: End-use energy transition in Long-term energy supply and demand outlook26
1.4 Energy saving potential in 2030 and 2050
In February 2015, the Energy Conservation Division of Agency of Natural Resource and Energy
reported a provisional estimate of energy saving potential in 2030 as a material for the Energy
Conservation Subcommittee of Advisory Committee for Natural Resources and Energy (ANRE 2015a).
Through the formulation of the long-term energy supply and demand forecast for 2030, the estimate
is also the basis of the greenhouse gases reduction target of 2030, which the Japanese government
submitted to the UN Framework Climate Change Convention in July 2015 as an Intended Nationally
Determined Contributions (INDC) document.
26 Original Unit is Million kL oil equivalent. Numbers are converted using conversion factor Million kL oil equivalent = 38.2 EJ.

EPODE17393 108
Provisional energy saving potential is defined as the differences between reference case and
aggressive conservation case. Total potential is 14% of reference energy demand, and 6% for
industry, 19% for commercial, 24% for residential and 21% for transportation.
A breakdown of an estimate for provisional energy saving potential in end-use sectors is summarized
in Figure 26. Detailed breakdown is discussed in the following sections. It should be noted that the
original figures in the sectoral assessment tables are oil equivalent units. These numbers are
converted to PJ for comparison with German numbers. There was no description of methodology of
energy saving potential calculation. However, policy packages for energy efficiency improvement are
shown. In this sense, it is considered as policy-driven energy saving potential.
Figure 26 provides two kinds of energy saving potential for industry. One is end-use energy saving,
another is energy savings including primary energy efficiency improvement in conversion sector such
as recycled material thermal use, heat recovery and high efficient boiler, etc.
The Institute of Energy Economics Japan publishes a global energy outlook every year. The latest
version IEEJ Outlook 2018 (IEEJ 2017a) extends its assessment time horizon to 2050. It prepares a
reference scenario and an advanced technology scenario by global region. Japan is one of the global
regions, and the demand difference between reference and advanced technology can be regarded as
energy saving potential of Japan in 2050.
Advanced industrial demand technology examples are best practice technology global diffusion in
iron&steel, cement, and paper&pulp processes. Building energy saving technologies assumed are
home appliances (refrigerator, television, etc.), hot water supply (heat pump etc.), illumination,
thermal insulation of buildings. In addition, transportation sector energy saving technology examples
are clean energy automobile (fuel efficient cars, hybrid cars, plug-in hybrid cars, electric vehicles and
fuel cell vehicles).
The estimated potential is estimated for 42 PJ in industry, 419 PJ for buildings and agriculture, and
377 PJ for transportation. These numbers are smaller than ANRE assessment targeted in 2030, and
further saving opportunities should be elaborated.

EPODE17393 109
Figure 26: Japanese energy saving potential in 203027
27 Original Unit is 10,000 kL oil equivalent. Numbers are converted using conversion factor 10,000 kL oil equivalent = 0.382 EJ.

EPODE17393 110
2 Industry sector
2.1 End-use energy consumption
Regarding the composition of industrial energy consumption, iron and steel, chemicals, ceramics, and
pulp and paper account for about 80% of the whole industry, which is characterized by the high ratio
of primary material industry consumption. In recent years, the growth rate of primary material
production has been saturated, and energy consumption as well as energy consumption intensity per
Indices of Industrial Production (IIP) has remained almost constant. On the other hand, looking at
non-primary material industries, the energy consumption intensity per IIP and the production indices
have not increased. As a result, the energy consumption of the industrial sector as a whole has been
flat or decreasing in recent years.
2.2 Energy efficiency indicators
The efficiency indicator trend after the 1970s for the end-use sectors are reviewed in the following
sections, using the energy and related statistics data provided by the Energy Data and Modelling
Center of the Institute of Energy Economics Japan (IEEJ 2017b).
In the industrial energy consumption, manufacturing dominates the consumption, as non-
manufacturing (i.e. agriculture, forestry, fishing, mining, and construction) share was around 10% in
the 1970s and has gradually fallen to its current level of about 5%. Therefore, the manufacturing
industry trend should be discussed. The major primary material industry (i.e. iron and steel,
chemical, ceramics, and pulp and paper) is energy intensive in general in their production process,
and it is called energy intensive manufacturing in the following descriptions. Other manufacturing
industries are aggregated to non-energy intensive manufacturing.
Long term trend is summarized in Figure 27 in energy intensive manufacturing (orange), non-energy
intensive manufacturing (green) and manufacturing in total (red). The typical activity index for
manufacturing is IIP (hashed lines) and intensity is defined as energy consumption per IIP (solid
lines). This results in a relatively stable trend of energy consumption (dotted lines) with contribution
of energy efficiency improvement, especially in energy intensive manufacturing. We can find that
energy intensity has fallen to around half compared to the intensity at the beginning of the 1970s. It
is the dominant factor in manufacturing intensity improvement, because within manufacturing,
energy intensive manufacturing’s share of energy consumption is high.
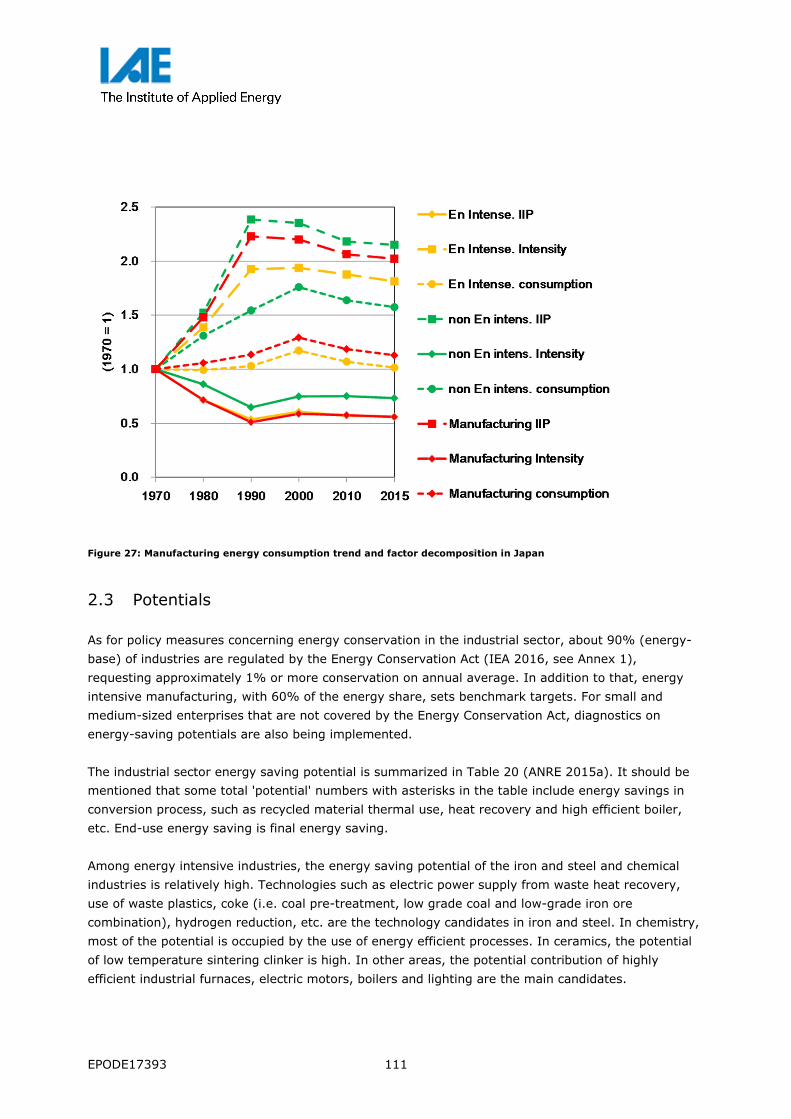
EPODE17393 111
Figure 27: Manufacturing energy consumption trend and factor decomposition in Japan
2.3 Potentials
As for policy measures concerning energy conservation in the industrial sector, about 90% (energy-
base) of industries are regulated by the Energy Conservation Act (IEA 2016, see Annex 1),
requesting approximately 1% or more conservation on annual average. In addition to that, energy
intensive manufacturing, with 60% of the energy share, sets benchmark targets. For small and
medium-sized enterprises that are not covered by the Energy Conservation Act, diagnostics on
energy-saving potentials are also being implemented.
The industrial sector energy saving potential is summarized in Table 20 (ANRE 2015a). It should be
mentioned that some total 'potential' numbers with asterisks in the table include energy savings in
conversion process, such as recycled material thermal use, heat recovery and high efficient boiler,
etc. End-use energy saving is final energy saving.
Among energy intensive industries, the energy saving potential of the iron and steel and chemical
industries is relatively high. Technologies such as electric power supply from waste heat recovery,
use of waste plastics, coke (i.e. coal pre-treatment, low grade coal and low-grade iron ore
combination), hydrogen reduction, etc. are the technology candidates in iron and steel. In chemistry,
most of the potential is occupied by the use of energy efficient processes. In ceramics, the potential
of low temperature sintering clinker is high. In other areas, the potential contribution of highly
efficient industrial furnaces, electric motors, boilers and lighting are the main candidates.

EPODE17393 112
Energy management at the factory is mentioned as an item, but its potential has not been
quantitatively shown.
Table 20: Energy efficiency potential in conversion and industry in 203028
Type Potential,
(PJ)
End-use
potential
(elec.),
(PJ)
End-use
potential
(fuel),
(PJ)
Technology options
Iron and
steel 106.9(*) 16.4 21.2
Power supply (incl. heat recovery power
generation), plastic waste recycle, advanced
coke, ferro coke (combined material of low-
grade coal and low-grade iron ore), hydrogen
reduction
Chemical 29.4(*) 5.0 15.3
New process, membrane distillation, CO2
utilisation, non-edible biomass, bio-catalyst,
vegetation factory
Cement and
glasses 8.8 0.0 8.8
Conventional energy-saving process (milling,
cooling, waste heat power generation, etc),
waste recycle, low-temperature firing clinker,
advanced glass melting process
Pulp and
paper 3.6(*) 1.4 0.0
Recycled paper pulping, advanced black-
liquor boiler
Others 287.8(*) 127.1 94.4
Efficient air conditioning, industrial heat-
pump, LED lighting, industrial furnace,
efficient motor, efficient boiler, direct use of
recycled plastic flakes, hybrid construction
machine
Energy
management -(unknown) -(unknown) -(unknown) Factory energy management system, etc.
Subtotal 436.5(*) 149.9 139.7
(*) including primary energy efficiency improvement in conversion sector
2.4 Barriers
The actual level of market penetration of cost-effective energy efficient technologies is often below
optimal level. It is recognized as the energy efficiency gap by various bottleneck factors and energy
efficiency barriers. The results of literature surveys and general findings are summarized in the
following sections.
28 Original Unit is 10,000 kL oil equivalent. Numbers are converted using conversion factor 10,000 kL oil equivalent = 0.382 EJ.

EPODE17393 113
In August 2015, the Energy Conservation Subcommittee of the Advisory Committee for Natural
Resources and Energy consolidated bottlenecks and required energy policies on energy conservation
by the energy demand sector as a reference material together with present policies (ANRE 2015b).
Several barriers in the industrial sector are noted. They include stagnation of energy efficiency
improvement as a result of energy conservation efforts so far, aging of large facilities due to the
length of investment payback period, lack of positive co-action evaluation among multiple enterprise
businesses, and lack of funds, human resources, and know-how for small and medium companies.

EPODE17393 114
3 Commercial sector
3.1 End-use energy consumption
Energy consumptions in nine commercial subsectors were estimated by business type. This includes
office buildings, department stores, lodging facilities, theatres, entertainment venues, schools,
hospitals, wholesale and retail stores, restaurants and other services. Among them, the share of
office buildings, wholesale and retail stores in 2013 is relatively large; 21.6% and 19.5%
respectively. A representative activity indicator for energy consumption of the commercial sector is
the total floor space, which has increased by 40% from 1990 to 2013. However, the energy
consumption has remained almost unchanged since 2010, and energy consumption per floor space
has been continuously decreasing. It is thought that this is due to the improvement of energy
efficiency of equipment and heat insulation improvement of buildings, but there are also factors
which are increasing, such as an increase in the number and size of equipment and an increase in
cooling demand due to equipment heat generation.
3.2 Energy efficiency indicators
Commercial sector intensity per floor space by category in the past 45 years is summarized in Figure
28 (IEEJ 2017). We can find heating, cooling, hot water, cooking, and appliances intensities in the
figure. The share of appliances increased in the long-term portfolio. Total intensity was stable till
2000, but started decreasing in 2000. Intensity changes from combined effects of equipment
efficiency, heat insulation, size and number of appliances, as well as additional cooling demand from
appliance heat source. But a 3.3 times floor space increase in 45 years, as shown in the line graph,
exceeds the decrease of intensity effect. It resulted in an increase in total commercial demand.

EPODE17393 115
Figure 28: Commercial energy consumption intensity and floor space in Japan
3.3 Potentials
Large-scale enterprises in the commercial sector are subject to the energy consumption restriction of
the Energy Conservation Act, and in terms of energy consumption, the coverage rate is about 40%.
In addition, it is said that incentives for energy conservation are unlikely to work because the energy
input per production value is lower than that of the industrial sector. New policy measures in energy
conservation for the commercial sector include mandating compliance with energy conservation
standards in the Building Energy Conservation Act, preliminary review of the benchmark system
defined by energy saving indicators for each industry, and demonstrating projects on net zero energy
building with subsidies.
Table 21 summarizes the energy-saving potentials of the commercial sector (ANRE 2015a). The
largest one is due to improvements in the building envelope performance, etc. and the energy-saving
potential is high for both electricity and fuel. The potential of power reduction of lighting and electric
equipment is also estimated to be large.
Energy management other than the Building Energy Management System (BEMS) such as lighting
standards, air conditioning load reduction by clothing adjustment, and energy utilisation management
across multiple business establishments are also mentioned as items, but the potential is not
quantitatively identified.
0
300
600
900
1200
1500
1800
2100
0
200
400
600
800
1000
1200
1400
1970 1980 1990 2000 2010 2015(m
illion
m2)
(MJ/
m2)
Appliance etc
Cooking
HotWater
Cooling
Heating
Floor space

EPODE17393 116
Table 21: Energy efficiency potential in commercial in 203029
Type Potential,
(PJ)
End-use
potential
(elec.),
(PJ)
End-use
potential
(fuel),
(PJ)
Technology options
Building
envelope
etc.
230.9 117.3 113.6 Heat insulation material, thermal insulation
windows, etc.
Hot water 17.0 5.6 11.4 Heat pump, latent heat recovery boiler, etc.
Lighting 90.9 90.9 - LEDs, organic ELs
Power
consumption
equipment
85.4 85.4 -
Copy machine, printer, router, server,
storage, refrigerator, autonomous vending
machine
Refrigerant
management 0.2 0.2 - Refrigerant management in air conditioner
Energy
management 91.3 46.5 44.8 Building energy management system, etc.
Subtotal 507.1 338.2 168.9
3.4 Barriers
The commercial sector barriers raised in the material are: lack of sharing good practice, insufficient
diffusion of energy management in small and medium enterprises due to energy cost non-
consciousness, and low energy efficiency in buildings in spite of their long life (ANRE 2015b).
29 Original Unit is 10,000 kL oil equivalent. Numbers are converted using conversion factor 10,000 kL oil equivalent = 0.382 EJ.

EPODE17393 117
4 Residential sector
4.1 End-use energy consumption
A representative activity indicator for energy consumption of the residential sector is the number of
households. The number of households has increased about 1.3 times from 1990 to 2013, while the
energy consumption per household has continued to decline in recent years. Factors related to the
decrease of energy consumption per household include decrease in household size, energy efficiency
improvement of equipment, building insulation improvement, etc. At the same time, there are also
factors related to increase in the number and size of equipment. After these activity indices and
intensity factors are comprehensively taken into consideration, it resulted in a decreasing trend.
Japan is long from north to south and has a high mountain area ratio. They create various local
climate condition, and local heating and cooling demand represented by heating degree day (HDD)
and cooling degree day (CDD) in Figure 29 and Figure 30 (IEEJ 2017b). For example, it is observed
that large HDD and small CDD for far northern city Sapporo, medium HDD for other cities, medium
CDD for Sendai and Toyama located in relatively northern latitude, large CDD for other cities. We
must pay attention to inter-annual variability and heat island effects to judge the values. This
tendency affects regional heating and cooling demand differences in Japan.
Figure 29: Heating Degree Days of representative cities in Japan
0
500
1000
1500
2000
2500
3000
3500
1970 1980 1990 2000 2010 2015
(HDD)Average
Sapporo
Sendai
Tokyo
Toyama
Nagoya
Osaka
Hiroshima
Takamatsu
Fukuoka

EPODE17393 118
Figure 30: Cooling Degree Days of representative cities in Japan
4.2 Energy efficiency indicators
Residential sector intensity per household by category and energy source is summarized in Figure 31
(IEEJ 2017b). You can find the same categories as that of the commercial sector. The share of
appliances increased in the long-term portfolio and total intensity increased till 2000 but started
decreasing in 2000. Intensity changes from combined effect of household size, equipment efficiency,
heat insulation, size and number of appliances, like the commercial sector. A 1.9-fold increase in the
number of households, shown in the line graph, cancels out intensity effects. As a result, total
residential demand has been saturated in recent years.
0
100
200
300
400
500
600
700
1970 1980 1990 2000 2010 2015
(CDD)
Average
Sapporo
Sendai
Tokyo
Toyama
Nagoya
Osaka
Hiroshima
Takamatsu
Fukuoka

EPODE17393 119
Figure 31: Residential energy consumption intensity and household number in Japan
4.3 Potentials
Regarding the energy consumption of the residential sector, the percentage of regulation covered
consumption satisfying energy performance standards, called "top runner" products, is said to be
70% of the consumption in 2009 (see Annex 2) (IEA 2016). Gas water heaters, gas cooking
appliances, electric refrigerators, lighting equipment, oil heaters, televisions, oil water heaters, air
conditioners, etc. have a high share.
Also, in recent years, as a policy measure, the net zero energy house (ZEH), which combines solar
power generation and high-performance thermal insulation construction, has technically matured. It
is considered to have entered the diffusion stage. The ZEH subsidy system was developed and the
ZEH numbers cumulatively reached a scale of tens of thousands.
The energy saving potential of the household sector is summarized in Table 22 (ANRE 2015a). The
largest one is due to improvements in building envelope performance, etc. and its energy saving
potential is high for both electricity and fuel. The potential of power reduction of lighting and electric
power equipment is also estimated to be large.
In addition to the BEMS, energy management options such as the reduction of air conditioning load
by clothing adjustment, energy diagnosis, etc. are also mentioned as items, but the potential is not
shown quantitatively.
It also should be noted that high insulated homes could reduce the excess winter mortality in Japan.
One of the Japan Revitalisation Strategy 2013 (Prime Minister Office 2013) targets is promotion of
smart wellness housing and cities. Residential building envelope heat insulation improvement will
bring multiple benefit in terms of energy savings and public health improvement.
0
10
20
30
40
50
60
0
10
20
30
40
50
60
1970 1980 1990 2000 2010 2015
(millo
n ho
useh
old)
(GJ/
hous
ehol
d) Appliance etc
Cooking
HotWater
Cooling
Heating
Household number

EPODE17393 120
Table 22: Energy efficiency potential in residential in 203030
Type Potential,
(PJ)
End-use
potential
(elec.),
(PJ)
End-use
potential
(fuel),
(PJ)
Technology options
Building
envelope
etc.
216.6 107.8 108.8 Heat insulation material, thermal insulation
windows, etc.
Hot water 68.8 -0.3 69.1 Heat pump, latent heat recovery boiler, fuel
cell, etc.
Lighting 81.0 81.0 - LEDs, organic ELs
Energy
consumption
equipment
58.2 45.8 12.4
Air conditioner, TVs, refrigerator, DVD
recorder, computers, magnetic disk, router,
microwave, rice cooker, gas cooker, hot
water toilet seat, gas stove, kerosene stove
Energy
management 68.1 68.1 - Home energy management system, etc.
Subtotal 473.0 291.0 182.0
4.4 Barriers
In the residential sector, non-achievement of a lifestyle with energy saving while maintaining
comfort, different incentive approaches which is not employed in business, low energy efficiency in
buildings in spite of their long life, and lack of energy saving consciousness are listed as major
barriers (ANRE 2015b).
A technology improvement in electric heat-pump air-conditioners saves primary energy consumption
if its technology performance index COP (coefficient of performance) exceeds the inverse of power
generation efficiency. Current COP numbers exceed its break-even numbers and can save fuel
consumption in power generation plants.
CRIEPI (2009) investigated the heating equipment unit numbers and heating technology (e.g. electric
heat-pump, gas stove, and oil stove) in 2500 households in Japan. It identified heating technology
preference by house owner/rent, heat insulation, oil price, etc. and discussed 6 barrier factors based
on categorisation by Sorrell et al. (2004). Barriers embedded in the replacement of oil/gas heating
equipment with electric heating equipment are calculated. The barrier is defined as the difference
between economic potential and market potential. Breakdown of each barrier’s contributions to CO2
reduction was assessed in the cost range of less than 3000JPY/tonCO2. Contribution factors are:
imperfect information, split incentives, bounded rationality, access to capital, hidden costs, and risk.
30 Original Unit is 10,000 kL oil equivalent. Numbers are converted using conversion factor 10,000 kL oil equivalent = 0.382 EJ.

EPODE17393 121
It concerns the reduction of CO2, but also provides suggestions for energy conservation. Total CO2
reduction barrier was 33%. The largest factor was imperfect information (21%), followed by hidden
cost (8.1%), and risk (5.2%). As for imperfect information, consumer prediction of the increase of
utility expenses is discussed. Hidden cost is noted as utility loss by changes in heating technology,
significant especially in cold regions. Risk is mentioned as investment risk in terms of initial cost and
payback time.

EPODE17393 122
5 Transportation sector
5.1 End-use energy consumption
Energy consumption in the transportation sector begins to decline around 2000. The composition in
2013 is 35% freight and 65% passenger. In the modal composition of vehicle, rail, navigation and
aviation, the vehicle share is about 80%. Consumption intensity is indicated in terms of per
passenger-kilometre for passengers, or per ton-kilometre for freight. Both indicators begin to decline
around 2000, and together with the saturation of service demand in passenger-kilometres and ton-
kilometres, it leads to a reduction trend in transport energy consumption.
5.2 Energy efficiency indicators
Passenger transport energy intensity by mode (solid lines), transport volume in passenger-km
(hashed line), and energy consumption (dotted line) are summarized in Figure 32 (IEEJ 2017b). It
seems that average intensity has gotten worse because of the complex background behind it. The
most influential point is the shift in modal share. Private passenger vehicle and rail are two dominant
modes in Japanese passenger transportation. At the beginning of the 1970s, the share of both modes
is around 40%, but recent share in 2015 is 56% for private passenger vehicle and 30% for rail,
respectively. Because the energy efficiency of rail is better than private passenger vehicle by a factor
of 10, relative shift in modal share has affected aggregated transport efficiency. Another point is the
size of passenger cars. It is obvious that its exhaust volume and dimension has affected fuel
efficiency.
However, there are good indicators in passenger vehicles. The fuel efficiency of the new passenger
vehicle has roughly doubled in 45 years and the share of the hybrid in new car sales is around 35%
in the recent statistics.
Freight transport energy intensity by mode (solid lines), transport volume in ton-km (hashed line),
and energy consumption (dotted line) are summarized in Figure 33 (IEEJ 2017b). It seems that
average freight energy intensity is relatively stable from 1970 to 2015, in spite of efficiency
improvement in all freight transportation modes. The influential factor is a shift of modal share as
seen in passenger transport. Vehicle (30%), rail (20%) and navigation (49%) are the dominant
modes in 1970. Absolute intensity of rail and navigation is 7 to 10 times better than that of vehicle at
that time. In 2015, ton-km based modal share has shifted to 50% for vehicle, 5% for rail, and 44%
for navigation, and absolute intensity of rail and navigation is 10 to 20 times better than that of
vehicle. Because of the above reasons, aggregated average intensity of freight transport followed a
flat trend.

EPODE17393 123
Figure 32: Passenger transportation: energy intensity by mode, transport volume, and energy consumption in Japan
Figure 33: Freight transportation: energy intensity by mode, transport volume, and energy consumption in Japan

EPODE17393 124
The fuel efficiency of new freight transport vehicles has been continuously regulated and total
average freight transport energy should decline after a model shift to vehicles completed in the
future, with implementation of other non-vehicle countermeasures such as traffic control and
reduction of the number of trucks running with empty loads through joint operations, etc.
5.3 Potentials
The energy saving potential of the transportation sector is summarized in Table 23. Both passenger
vehicles and freight vehicles are the above-mentioned top runner target products, and fuel efficiency
standards have gradually been strengthened. Furthermore, along with the diffusion of next-
generation vehicles such as hybrid cars, electric cars, plug-in hybrid cars, and fuel cell cars, fuel
consumption is estimated to be greatly reduced. It is also estimated that the reductions in energy
consumption are due to traffic flow control, modal shifts, and the improved energy efficiency of
railways, ships and aircraft, but the breakdown of them is not clearly stated.
Table 23: Energy efficiency potential in transportation in 203031
Type Potential,
(PJ)
End-use
potential
(elec.),
(PJ)
End-use
potential
(fuel),
(PJ)
Technology options
Automobile 377.6 -45.1 422.7
Next generation vehicle (hybrid, electric,
plug-in hybrid, fuel cell, clean diesel), fuel
efficiency Traffic management,
etc. 124.4 0.1 124.3
Traffic management, model shift, efficiency
(rail, ship, airplane)
Subtotal 502.0 -45.0 547.0
5.4 Barriers
In the transportation sector, continuation of fuel economy improvements including next-generation
vehicle diffusion and traffic flow control are the main barriers, because the share of automobiles in
the consumption of transport energy is about 80% (ANRE 2015b).
31 Original Unit is 10,000 kL oil equivalent. Numbers are converted using conversion factor 10,000 kL oil equivalent = 0.382 EJ.

EPODE17393 125
6 Cross-sectoral approach
There are many assessments of energy efficiency related literatures. Recent examples in Japan are
picked up to understand the situation of energy efficiency in Japan.
6.1 Information and communication
Information and communication technology in the past decades changed the daily life and business
drastically in Japan. We can find energy conservation related application examples in individual
equipment and independent buildings with limited space. Digitalisation of the energy business in
recent years will change the energy conservation business model through direct interaction between
end-use energy customers and various stakeholders. Energy saving information delivery via smart
phones with economic incentives is under demonstration by Kansai Electric Power Company and other
business partners (KEPCO 2017). The system delivers local area information and power saving
opportunities with incentives. It is regarded as one of results of demand response project in 7.2.
6.2 Demand response in smart community
The main interest of demand response (DR) in Japan is the peak-cut or peak-shift of the electric
power system. It should be mentioned that peak-shift does not provide end-use energy savings
because it only shifts the demand to a different time.
There are many energy management system (EMS) demonstration projects in Japan. Some of them
are dedicated to buildings, factories or homes. This integrated system is called community EMS. A
smart community concept is summarized in Figure 34 (NEDO 2015). It is a community with an
Information and communication technology (ICT) infrastructure to exchange energy and other
information, with the involvement of the energy demand side and distributed energy sources.
Four large scale demonstration projects were started in fiscal year 2010 and completed in fiscal year
2014 through the initiatives of government ministries. Demonstration sites are located in Yokohama
city, Toyota city, Kansai Science city, and Kitakyushu city.
DR experiments in these projects provided valuable information to judge the feasibility and economic
benefit of future grid-scale smart-grid operation. There are two categories in the demonstrations.
One is tariff based DR, another is negawatt trading. Tariff based DR changes the power retail price by
time of use (TOU) contract or critical peak pricing (CPP) noticed in advance.

EPODE17393 126
Figure 34: Smart community concept
DR experiments in two areas are categorized in tariff-based type (METI 2016). They changed the
critical peak price during summer and winter peak hours. In the Kitakyushu CPP experiments, TOU
effect is included, because of the existing TOU contracts between customers and power suppliers.
TOU plus CPP reduction ratio is around 20% in Kitakyushu (Table 24). Keihanna had both TOU and
variable price CPP experiments, and around 20% reduction was found in the experiments (Table 25).
In the summer, a day-ahead CPP announcement is delivered to households if the maximum
temperature of the next day is forecasted to be above 30 degree Celsius. It should be noted that the
average temperature in 2013 is higher than that of 2012, and adjustment should be made.
Table 24: Kitakyushu DR experiment
(notes)
Samples: 180 in FY2012, 178 in FY2013
Summer peak hours: 13:00-15:00, Winter peak hours: 08:00-10:00, 18:00-20:00
TOU effects cannot be evaluated because TOU tariff was applied before CPP experiments.
(#)Significance level 5%, (##)Significance level 1%

EPODE17393 127
Table 25: Keihanna DR experiment
(notes)
Samples: 681 in FY2012, 635 in FY2013
Summer peak hours: 13:00-16:00, Winter peak hours: 18:00-21:00
(##)Significance level 1%
Asano and Yamaguchi (2014) compared the price sensitivity of three experiments in 2013, with the
Kyushu electric power DR experiments shown in Figure 35. It should be mentioned that in the
Kitakyushu experiment numbers are showing CPP effect and exclude the TOU effect. Estimated TOU
effect is around 10% based on the Tokyo-Yokohama area experiment in the summer of 2010 and
2011. CPP demand reduction effects were concluded in the range of 10 to 15 percent in manual DR.
Figure 35: CPP pricing effects in DR demonstration projects

EPODE17393 128
There are remaining discussion points in the tariff based DR such as price sensitivity, announcement
effect, and weakening effects due to habituation. In the future, automated DR (ADR) could be
employed in the power system and DR-embedded consumer electrical appliances. Original intention
of DR is peak-shift or peak-cut. It could change energy consumption behaviour, but influences on
energy efficiency improvement is still unclear.
Energy management systems play important roles through information exchange. Systems can be
managed smartly through system learning (e.g. demand forecasting, virtual aggregation of storage
devices, weather information based renewable power output forecasting and other operation
experiences). We need more evidence to know the realistic impacts of these technologies.
6.3 Building energy management system
BEMS aims to appropriate energy management by combining information infrastructure such as
demand information visualisation, control, data collection and storage, and communication. The
estimated amount of energy saved by office buildings and stores by introducing BEMS was shown in
the report of Japan Electronics and Information Technology Industries Association (JEITA) (JEITA
2015). In the report, through the case study of BEMS introduction, Japanese energy conservation
potential through BEMS function was estimated. It also assumes BEMS penetration rate and number
of buildings by scale. The assumed conservation rate through BEMS function is 10% in energy use
diagnosis, 2% in visualisation of usage information, 10% in air conditioning, 10% in lighting and 15%
in equipment installed after completion of buildings (Table 26).
Table 26: Energy saving assumptions by BEMS
Functions Objects Reduction rate in cases
Reduction rate assumed
Notes
Diagnosis Energy saving service / diagnosis
All 7-15% 10% Additional opportunities
Monitoring
Visualisation All 2-10% 2% For all buildings
Central A/C Heat source and heat transport
5-20% 10% Large buildings
Individual A/C A/C control 10% 10% Small buildings
Lighting Illuminance control etc.
10% 10% For all buildings
Power outlet
IT devices consumption data display control
15% 15% Rate in best practice
Demand response / peak cut
Peak cut All 5-28% - (N.E) - (N.E)
Time shift All 60% or more - (N.E) - (N.E)

EPODE17393 129
For office buildings, the energy saving potential of both large-scale buildings (floor space: 10,000 m²
or more) and small-scale buildings (floor space: less than 10,000 m²) is estimated at 10%.
Regarding the penetration rate, it is assumed that the BEMS adoption rate in small-scale buildings is
quite low currently, but that the penetration rate in 2030 will reach 80%, except for small-scale
buildings with less than 500 m² floor space (Table 27).
Table 27: BEMS diffusion assumption for office buildings
Scale BEMS diffusion rate
Floor space Current Share in number
Energy consumption
share
Present
2030
Large 30,000 m2-
2% 31% 50% 80%
10,000-30,000 m2
20% 27% 80%
Small and Medium
2,500-10,000 m2
3% 19% 4% 80%
500-2,500 m2
11% 13% 4% 80%
-500 m2 85% 17% 4% 4%
The power reduction potential through BEMS is shown in Figure 36 for office buildings and stores. As
BEMS for office buildings has already been adopted, the energy saving effect in 2012 is estimated to
be 2.3TWh. However, it will increase to 4.1TWh in 2020 and 5.4TWh in 2030. Similarly, the energy
saving effect of BEMS for stores is estimated to be 0.5TWh in 2012, 2.2TWh in 2020, and 3.5TWh in
2030 respectively.
Figure 36: Energy saving potential of BEMS

EPODE17393 130
6.4 Big data
There have been many business model proposals of big data in Japan. One example is Denki Kakeibo
of Tokyo Electric Power Company (TEPCO). Denki Kakeibo is a visualisation tool of billing and demand
information (Figure 37) (TEPCO 2017). This system depends on the framework of Opower (currently
Oracle), the global leading cloud-based software developer for the utility industry. For example, we
can compare monthly power consumption data embedded in big data management systems with
those of averaged similar residential customers (i.e. same contract of power tariff). It aims at energy
consumption behaviour change through visualisation of energy consumption data. These kinds of
business proposals are quite active in Japan especially after power market liberalisation in 2016,
coupled with replacement of conventional power measurement meters with smart-meters.
In general, digitalisation through smart meters, sensing technology, Internet of Things (IoT)
connected appliances and autonomous driving cars, etc. will change daily life and energy
consumption behaviours. However, the aggregated impact on energy efficiency is still uncertain at
this point, because it allows optimal use of energy, but it will also increase convenience of life as
discussed in the autonomous vehicle rebound effect.
Figure 37: Sample screen image of Denki Kakeibo
(note)
dark blue bar: monthly power consumption in this year
light blue bar: monthly power consumption in previous year
red line: average monthly power consumption of same tariff customers

EPODE17393 131
6.5 Energy service provider and energy service companies
Since the 2000s, services to undertake energy conservation measures at buildings, business
establishments, etc. are expanding. The service has been called energy service company (ESCO), a
business that proposes an energy conservation plan, provides technology, facilities, human
resources, funds, etc. It recovers its investment from the reduced cost after ESCO system
implementation. The contract method is divided into two types. If the customer provides funds, it is
called a guaranteed-savings contract, and if ESCO operators procure funds, it is called a shared-
savings contract.
Meanwhile, in recent years, there is also a business in the market for the comprehensive engagement
of energy related business called an energy service provider (ESP). ESP utilizes energy management
methods based on continuous monitoring and analysis of energy usage status to provide diverse
services and policies that contribute to energy cost reduction and business management, etc.
In Japan, an industry organisation named Japan Association of Energy Service Companies (JAESCO)
has been organized. JAESCO has 33 regular members and 44 supporting members. JAESCO
estimates that the annual market scale of the of member companies on a new order basis has been
in the range of 20 to 30 billion JPY per year (Figure 38) (JAESCO 2016).
Figure 38: ESCO market size in Japan (by JAESCO members)
Jyuukankyo Research Institute estimated energy saving potential of the ESCO business in the
commercial sector in Japan (Figure 39) (Jyuukankyo Research Institute 2014). Nine types of
businesses (office, hospital, hotel, meeting facility, sports facility, welfare facility and store) are
evaluated in terms of heating source retrofit, combined heat and power, and others. Total potential is

EPODE17393 132
174PJ/yr, with a large contribution from offices (62.5 PJ/yr), hospitals (24.0 PJ/yr), hotels (41.9
PJ/yr) and stores (41.4 PJ/yr).
Figure 39: Energy saving potential of ESCO business
6.6 Rebound effects
The energy rebound effect is defined as a phenomenon in which the energy service increases through
energy service price reduction due to energy efficiency improvement. Three types of definitions in the
rebound effect are introduced in Greening et al. (2000). The first is "direct rebound effect", the
second is "indirect rebound effect", and the third is "embodied energy". In addition, the combined
effect of the three types is called the economy-wide rebound effect.
The potential energy savings expected by replacement are reduced by the rebound effect. A
reduction in energy costs due to replacement results in a reduction in the associated energy service
price. This decline in energy service prices generates new energy service demand. This effect is called
the self-price effect or direct rebound effect. Indirect rebound effect is generated by directing money
saved by replacement to the consumption of other goods. This household expenditure change is
called the secondary effect or indirect rebound effect. This indirect effect bounces off the economy as
a whole. By turning the money that households no longer use for energy to consumption of other
goods, the sector supplying that good will be influenced (by the change in the final demand), further
spreading to other sectors. Therefore, this mechanism affects energy consumption of all sectors.
Embodied energy refers to energy consumption required for energy saving investment, and refers to
the amount of energy required for the production process and installation stage. Products using new
technology would consume more energy to produce than conventional products. However, there are
also cases in which they consume less energy than conventional products.

EPODE17393 133
Mizobuchi and Takeuchi (2016) examined the direct effect. They measured the changes in monthly
household electricity consumption, which might be caused by the replacement of air-conditioners,
thorough 733 household surveys. The result suggests that the replacement by energy-efficient air-
conditioners might decrease power consumption, especially in spring and summer. They also
calculated the size of the rebound effect monthly, and found positive rebound in summer (8% to 22%
in August) and winter (134% to 192% in December and January). On the contrary, negative
rebound, implying that the actual power saving effect is greater than expected saving effect, was
found in mild-climate seasons (-3% to -129%). On the average, the size of the rebound effect is
positive and ranges between 45% and 58%.
6.7 Setsuden initiative
Immediately after the Great East Japan Earthquake, the supply capacity of power sources temporarily
dropped drastically, and the consciousness of energy saving increased, especially the energy
conservation campaign that was held mainly in the summer, which is the annual power peak period.
In general, it is said that the decline in electricity demand for commercial and residential use is
particularly significant. In the following, examples of electricity demand analysis using time series
data are described, and the energy saving effect through consciousness of electricity saving
(Setsuden) is discussed.
CRIEPI (2015) reported the household electricity saving situation in Tokyo Electric Power Company
and Kansai Electric Power Company during the summer of 2014. As a result, the electricity
consumption after removal of the temperature effect is about 10% lower than the 2010 level before
the earthquake disaster, but the conservation of electricity consumption and the action rate of energy
saving measures are gradually decreasing. It is shown that the cumulative impact on savings of
purchasing or replacing equipment is up to 4% in the summer of 2014, patience and ingenuity at the
time of use (behaviour factor) is keeping tendency, and there is a power saving effect through the
price rise in electricity tariffs.
CRIEPI (2016) also reported a time series analysis of power demand changes. For example, with
regard to electricity demand for small-scale customers, data from 2000 to 2014 is analysed and
classified to factors of price, income, habit, household size, climate factor of cooling, climate factor of
heating, and others. The result suggested that the contribution of habit factor was recognized. It was
reported that national average power consumption decline by habit factor compared to 2010 is 2.4%
in the year 2014. The possibility of habitualisation of electricity saving was pointed out.
To summarize the above, it can be said that there is a trend toward a decline in electricity demand,
especially in the commercial and residential sectors after the Great East Japan Earthquake. The
background of this trend may be due to the increase in consciousness of power saving. However, for
example, in light-emitting diode (LED) light bulbs, diffusion could be the result of home appliance
eco-point institution between 2009 and 2011. Eco-point system is the institution to stimulate sales of
energy saving products such as televisions, air conditioners, and refrigerators. With a rewards point

EPODE17393 134
system, the consumer could purchase LED light bulbs at half price if he/she used points awarded.
Such special factors cannot be neglected in equipment purchase or replacement behaviour. Although
the consciousness of electricity saving itself has gradually declined, it is recognized that there was a
certain positive effect of the energy saving campaign. In that sense, energy conservation behaviour
has been established to some degree.

EPODE17393 135
7 Policy analysis
ANRE (2015b) consolidated information on energy efficiency policy packages both in regulation and
supporting measures as summarized in the sections below.
7.1 Regulation measures
The Act on the Rational Use of Energy (known as the “Energy Conservation Act”) was enacted in
1979 (enforced in October 1979). The Act is the foundation of Japanese energy efficiency and
conservation policy. There were a series of major revisions in 1993, 1998, 2002, 2005, 2008, and
2013 (IEA 2016). The Act on the Improvement of Energy Consumption Performance of Buildings
(Building Energy Efficiency Act) was newly established in 2015 and enforced in 2016 (MLIT 2016).
Energy efficiency requirements for buildings are now regulated under the new act. The target sectors
are all major sectors in Japan, such as industrial, residential, commercial, and transportation. The
coverage of the Energy Conservation Act is estimated to be about 90% for industry and 40% for
commercial.
Current regulation measures are summarized in Table 28 by the end-use sector (ANRE 2015b).
Rational use of energy is requested for all sectors. Other multi-sectoral requests are intensity target
and reporting (industry and commercial), and building energy efficiency (commercial and residential).
There are several regulations for industries. For the energy intensive industry, a benchmark index
and its level setting are mandated. For products, buildings, vehicles, appliances, and construction
materials, they are obligated to comply with performance standards. There is a labelling mandate for
wholesalers and retailers.
For the transportation sector, there are intensity targets and reporting for transport operators.
Shippers should also make efforts for energy savings as well as reports, such as energy reporting for
large scale shippers.
Tokyo metropolitan government introduced emission trading scheme to reduce greenhouse gas
emissions. Energy saving is expected as one of co-benefits.

EPODE17393 136
Table 28: Overview of regulation measures in energy conservation policy
Act Target Industry Commercial Residential Transportation
Energy
Conservation
Act
Business
Activities, etc.
Rational use of Energy (efforts)
Intensity target setting and annual
consumption reporting
Transport
operators:
Intensity target
and its reporting
Benchmark target
and its reporting
Shippers: Intensity
target setting and
annual reporting
Products
Top runner program
Performance
labelling
Building
Energy
Conservation
Act
Building Energy performance target for new buildings
7.2 Supporting measures
Current supporting measures are categorized into economic incentive (e.g. subsidy for equipment
cost, and interest or loan), demonstration, energy saving diagnosis, research and development
(R&D), and tax system (Table 29). Both loan subsidy and interest subsidy is attractive institution
when high cost energy saving facilities or equipment is planned. Loan subsidy reduces initial cost
itself, while interest subsidy reduces interest payment of residual loan.
Economic incentives are found in all sectors for energy systems or individual equipment. Equipment
examples include the home energy management system and residential fuel cell (residential), lithium
batteries and high-performance building material (commercial and residential), and clean energy
vehicles (transport). Demonstration is underway with subsidies in net Zero Energy Building/Home
(ZEB/ZEH, commercial and residential). Energy efficiency improvements for trucks, taxis and ships
are another area of demonstration. Energy saving diagnosis for small and medium enterprise (SME)
is also one of the energy conservation policy portfolios, because of the lack of capacity in finance,
human resources, and know-how in SME as described in the previous section. Industrial production
process is a strategic area of R&D, while a broad range of energy efficiency R&D has been conducted
covering all sectors.
Tax reduction or credit are other tools to accelerate energy efficiency in building retrofit, as well as
tax credit for eco-friendly cars.

EPODE17393 137
Table 29: Overview of supporting measures in energy conservation policy
Scheme Industry Commercial Residential Transportation
Subsidy
Subsidy for equipment or system
Subsidy for equipment or
system
Interest for equipment Interest for equipment
Loan for equipment Loan for equipment
Lithium Batteries Clean energy vehicle
High performance building material
HEMS
Fuel cell
Demonstration Net zero energy building (ZEB/ZEH) Truck & taxi, ship
Monitoring Energy conservation diagnosis for small
and medium enterprise
R&D Industrial process
Energy conservation related R&D
Tax
Tax reduction or
credit of building
retrofit
Tax reduction for eco-cars
(notes)
green: subsidy for specific product, blue: other schemes
7.3 Best practices
We have identified the best practices in energy efficiency policy in Japan through the review above.
The selected five best practices in energy efficiency policy in Japan are: Top runner program (Annex
2), Energy reporting for large scale energy consumers (Annex 3), ZEB/ZEH program and labelling
system for buildings (Annex 4), Tax breaks for eco-cars (Annex 5), and Voluntary actions in industrial
associations (Annex 6). Top-runner program is selected because it affected same name German
government policy.
7.4 Cross-sectoral governance framework
Japanese national level cross-sectoral governance structure is summarized in Table 30 for
comparison with German system. About the targets and concepts, energy supply and demand
outlook 2030 and Nationally Determined Contribution of UNFCCC are the major government
initiatives. Energy Conservation Act and Building Energy Conservation Act are legal basis.
National level infrastructure and funding for energy efficiency improvement is mainly conducted by
Agency for Natural Resource and Energy, while Ministry and Ministry of Land, Infrastructure,
Transport and Tourism covers transport and building issues.
There is distortion eliminating measures. Energy taxes are applied to fossil fuels and electricity. From
2012, tax proportional to carbon contents is added to coal, oil and natural gas. However, there is no

EPODE17393 138
national level emission trading scheme. Local government such as Tokyo metropolitan government
has own emission trading market, but it is not common in Japan.
Table 30: Major cross-sectoral governance framework for energy efficiency
Targets and concepts Infrastructure and funding Eliminating distortions
* Energy supply and demand outlook 2030 * Nationally Determined Contributions of UNFCCC in 2030 * Energy Conservation Act * Building Energy Conservation Act * Japan Revitalisation Strategy
* Agency for Natural Resource and Energy * Ministry of Land, Infrastructure, Transport and Tourism (especially for transport and building) * Energy Conservation Center Japan (Promotion of energy conservation in the industry, households, local communities, international cooperation, human capacity building, public outreach, conservation qualification examination, etc.) * Sustainable open Innovation Initiative (Distribution of subsidy)
* Energy taxes (tax proportional to carbon content is added from 2012) * No national level emission trading scheme.

EPODE17393 139
8 Sources
ANRE (2015a) Provisional quantitative assessment of Japanese energy conservation potential,
material for Energy conservation subcommittee, Advisory Committee for Natural Resources and
Energy, Energy Conservation Division of Agency of Natural Resource and Energy, February 17, 2015
(in Japanese)
ANRE (2015b), Reference material of Energy conservation subcommittee, Advisory Committee for
Natural Resources and Energy, August 26, 2015 (in Japanese)
Asano and Yamaguchi (2014), Demand response - demonstration in Japan and overseas, its
utilization trend, Denki-hyouron, October 2014 (in Japanese)
CRIEPI (2009), Measures to Promote CO2 Emission Reduction by Heat Pump Air-conditioners –
Questionnaire Survey and Analysis on Energy Efficiency Barriers’, Y08026, Central Research Institute
for Electric Power Industry, April 2009 (in Japanese).
CRIEPI (2015), Ex-post analysis of electricity saving measures in residential sector in the summer of
2011-2014 - Continuous observation after the Great East Japan Earthquake -, Rep. no. Y14014,
Central Research Institute of Electric Power Industry, April 2015, (in Japanese)
CRIEPI (2016) Special Issue, Electric power demand reduction after the Great East Japan Earthquake,
Denryoku Keizai Kenkyuu, Rep. no. 63, Socio-economic Research Center, Central Research Institute
of Electric Power Industry, ISSN 2189-3284, March 2016 (in Japanese)
IEA (2016), Overview of Act on the rational use of energy (Energy Conservation Act), International
Energy Agency web page (accessed May 15, 2017),
https://www.iea.org/policiesandmeasures/pams/japan/name-24362-en.php
IEEJ (2017a): IEEJ Outlook 2018, Institute of Energy Economics Japan, October 2017 (in Japanese).
IEEJ (2017b), EDMC Handbook of Japan's & World Energy & Economic Statistics 2017, Energy Data
and Modelling Center, Institute of Energy Economics Japan, February 2017 (in Japanese).
JAESCO (2016) Trend of Market size of ESCO in Japan, JAESCO web page (accessed May 15, 2017),
http://www.jaesco.or.jp/pdf/JAESCO_brochure20161017.pdf
JEITA (2015), Research report on Energy saving effects by IT utilization - energy saving effects of
BEMS in buildings and stores, IS-15-GR-1, Green IT committee, Japan Electronics and Information
Technology Industries Association (JEITA), March 2015, JEITA web page (accessed May 15, 2017),
http://home.jeita.or.jp/greenit-pc/bems/pdf/bems2.pdf (in Japanese).
EPODE17393 140
Juukankyo Research Institute (2014) Energy saving potential of ESCO business in commercial sector,
February 2014, Ministry of Economy, Trade and Industry web page (accessed May 15, 2017),
http://www.meti.go.jp/meti_lib/report/2014fy/E004386.pdf (in Japanese)
KEPCO (2017), Information delivery service demonstration in Kizugawa City, Kyoto Prefecture,
KEPCO news release, June 5 2017, http://www.kepco.co.jp/corporate/pr/2017/0605_4j.html (in
Japanese)
METI (2016), Energy White Paper 2016, Ministry of Economy, Trade and Industry, May 2016
METI (2016), Next generation energy and social system demonstration project -summary and future
work-, material for council on next energy and social system, Energy Conservation and Renewable
Energy Department, Advisory Committee for Natural Resources and Energy, June 7 2016, (original
information from evaluation of Yoda, Tanaka, and Ito) (in Japanese)
http://www.meti.go.jp/committee/summary/0004633/pdf/018_04_00.pdf (accessed May 15, 2017)
MLIT (2016) Overview of the Act on the Improvement of Energy Consumption Performance of
Buildings (Building Energy Efficiency Act), https://www.mlit.go.jp/common/001134876.pdf (accessed
May 15, 2017) (in Japanese)
Mizobuchi and Takeuchi (2016), The Rebound Effect in Residential Electricity Use: Evidence from a
Propensity Score Matching Estimator, Discussion Paper No. 1639, Graduate school of Economics,
Kobe University, October 2016, http://www.econ.kobe-u.ac.jp/RePEc/koe/wpaper/2016/1639.pdf
(accessed May 15, 2017)
NEDO (2015), NEDO Smart Community Projects, New Energy and Industrial Technology Development
Organization (NEDO), Japan-India Energy Forum 2015 Conference in New Delhi, India, April 29 2015,
http://www.nedo.go.jp/content/100644802.pdf (accessed May 15, 2017)
Prime Minister Office (2013), Japan Revitalization Strategy 2013, Prime Minister Office
Sorrell,S. et al (2004), The Economics of Energy Efficiency: Barriers to Cost Effective Investment,
Edward Elgar, Chltenham.
TEPCO (2017), Denki Kakeibo, TEPCO website
https://www.kurashi.tepco.co.jp/pf/ja/pc/pub/hub/charge-amount-confirm.page (accessed May 15,
2017)(in Japanese)

EPODE17393 141
Annex 1 Revision history of the Energy
Conservation Act
After initial establishment about 40 years ago, there have been frequent revisions in the Energy
Conservation Act. Revision overview is summarized as following (IEA (2016), MLIT (2017)).
[1] Energy Conservation Act (in 1979)
The Act introduced energy conservation and management regulation targeting factories with a large
amount of energy consumption, with requirements of appointment of energy manager and annual
energy consumption reporting. The Act also introduced energy efficiency standards for vehicles,
refrigerators, and air conditioners.
[2] Revisions in 1993, 1998, 2002, 2005, 2008
(1) Revision in 1993
The revision of the Act in 1993 adopts a mandatory periodic report to be made by the designated
energy management factories.
(2) Revision in 1998
The revision of the Act concerns the four key new energy efficiency policy and measures as follows:
a. Creation of “Type 2 Designated Energy-Management Factories”
The revision of the Act introduced a new designation of factories and business establishments. These
factories are those annual fuel consumption is less than quantities stipulated in initial act of 1979,
with same requirements on energy managers and reporting.
b. New Obligation for “Type 1 Designated Energy-Management Factories”
For the "Type 1 Designated Energy Management Factory", a new obligation was introduced by the
revision. As a new obligation, the submission of a medium- to long-term report on energy
conservation measures was introduced. Also, “an average of 1% reduction of energy intensity in
annual base during the mid and long term plan” was introduced as a regulatory energy management
and efficiency target.
c. Creation of Top Runner Program

EPODE17393 142
The revision of the Act also introduced the “Top-Runner Program”. This is a regulatory standard
program targeting the improvement of energy efficiency of electrical appliances. The concept of the
program is that the target standard is set at the weighted-average energy efficiency of each
manufacturer’s and importer’s shipment to achieve the level of the most energy-efficient model in
each category of the current market.
d. Stricter Penalty for Noncompliance
The level of the penalties was increased for noncompliance. New penalties were: a publication of the
name of the manufacturers and importers and an issuance of the administrative order for not
meeting the standards.
(3) Revision in 2002
The revision of the Act in 2002 concerns the key new energy efficiency policy and measures as
follows:
a. The category of the type 1 Designated Energy Management Factory that had targeted five
manufacturing industries was expanded to all industries.
b. The revision obliges the type 2 designated energy management factories to make periodic reports.
c. The revision obliges the designated buildings to report energy conservation measures.
(4) Revision in 2005
The revision of the Act in 2005 concerns the four key new energy efficiency policy and measures as
follows:
a. Creation of Regulation for Transportation
The revision of the Act concerns the promotion of energy efficiency in the transportation sector,
targeting consigners and carriers (transportation enterprises, for both goods and passengers, and
goods owners) for the transportation sector. Regulated consigners and carriers are called “Designated
Consigners and Carriers” and the set of obligations is to submit a periodic report, to promote eco-
driving and to appoint an energy manager
b. New Concept of Total Management of Heat and Electricity
By this revision of the Act, a new concept of management of energy source was introduced. Before,
the amount of used energy of electricity and heat used was counted respectively, but after the
revision total amount of the energy consumption of heat and electricity was counted.

EPODE17393 143
c. New Obligation for Energy Supplier and Retailer
By this revision of the Act, a new obligation was introduced targeting equipment retailer. By this
obligation, retailers became imposed on an information provision for consumers.
d. Unified Energy Conservation Label
A new labelling was introduced of which label shows a star-rating. This is a comparative performance
rating labelling of a product with the cost information such as expected electricity cost during the use
of the product.
e. Creation of Regulation for Housing and Building
The revised act strengthened energy conservation measures for residential buildings and the
construction sector. Owners of buildings larger than 2,000 m2 floor space must prepare efficiency
plans when applying for renovation permits, as must contractors planning to build entirely new
structures. The reporting on maintenance and preservation of energy conservation measures to
prefectures or other building authorization officials became mandatory.
f. Expansion of Top Runner Program
Newly, microwave oven, electric rice cooker, and DVD recorder became the Top Runner target
products.
(5) Revision in 2008
The revision of the Act in 2008 concerns the key new energy efficiency policy and measures as
follows:
a. Industry and Commercial Sectors
- The revision introduces a system for energy management obligation per whole enterprise.
- The revision treats a franchise chain such as convenience stores and restaurants also as a single
enterprise, and applies the same regulation on the enterprise. (This revision imposed not only on in
manufacturing factories but also on business sectors such as offices, convenience stores, etc.)
b. Building, Houses
- This review strengthens measures for large residences and buildings
(Introduction of orders in addition to instructions and notices)

EPODE17393 144
- This revision adopts a report on energy-saving methods by owners of small-medium-sized
residences and buildings above a certain size.
- This revision adopts energy-saving measures by businesses engaged in the construction and sales
of residences (recommendations and orders for those who are engaged in the construction and sales
of a large number of residences).
- This revision promotes of indication of the energy saving performance of residences and buildings.
(6) Revision in 2013
The revision of the Act in 2013 was conducted for the purpose of enhancing energy conservation
measures in the housing and building sectors. The key measures are as follows:
a. Top Runner Program for Building Materials, etc.
The Top Runner Program has so far been applied to machinery and equipment that consume energy.
This revision newly adds building materials, such as windows and heat insulating materials as Top
Runner Program target products. Also, three phase induction motor and LED lamp were included for
the revision.
b. Positive Evaluation of Action to Reduce Peak Demand Electricity
The current evaluation and rating system of the report submitted by designated energy management
factories, etc., required by the Energy Conservation Act was amended. Under this new evaluation and
ratings system, the procedure was revised to positively evaluate and rate the electricity consumer’
efforts to reduce the use of power from utility grids during peak demand hours by using storage
batteries, energy management systems (BEMS or HEMS), or private power generation, in addition to
their conventional measures to save energy.
c. Abolition of the Rational Use of Energy and the Utilization of Recycled Resources
By this revision of the Act, the "Energy Conservation and Recycling Assistance Act" was abolished.
Because this part was established as temporary legislation.
[3] Current development
In 2016 and 2017, Japanese government has decided to introduce new energy efficiency measures.
The key components of new measures are as follows:
a. Thermal power generation facilities
EPODE17393 145
In order to improve efficiency of thermal power generation facilities, Japanese government set new
Judgment of Standard for new power generation facilities and new energy efficiency benchmarks for
electric power generation business.
b. SABC evaluation system (ranking evaluation system)
The government established new evaluation system for all Specified Business Operators, which
categorizes business operators in accordance with the progress of energy efficiency. Under this
evaluation system, the names of the excellent companies are publicized by the government.
c. Expansion of benchmark objects
Commercial sector is included in benchmark objects in order to promote energy efficiency.
Benchmark objects used to be limited in industry sector.
d. Exploitation of unused heat sources
Calculation method for evaluation of energy efficiency has changed so as to promote effective
utilization of heat. In the case of using waste heat, business operators get special consideration in
evaluating energy efficiency.
e. Act on the Improvement of Energy Consumption Performance of Buildings
Act on the Improvement of Energy Consumption Performance of Buildings (Building Energy
Conservation Act) was newly established in 2015 and enacted from 2016. Energy efficiency
requirement for buildings is now regulated under new act. This Act provides 1) regulatory measures
for mandatory compliance with energy efficiency standards for large-scale non-residential buildings
(new building with floor space 2,000m2 or more), and 2) incentive measures such as a labelling
system displaying compliance with energy efficiency standards and exception of floor-area ratio
regulation for certified building.
Regulatory measures include mandatory compliance/evaluation of compliance, notification system,
minister-approval system for special structures/equipment and housing top-runner program.
Incentive measures are performance improvement plans (exception of floor-area ratio regulation)
and labelling system.
EPODE17393 146
Annex 2 Top runner program
Top runner program is mandatory program in the Energy Conservation Act from 1999, for new
products. It encourages competition among companies by setting the efficiency targets for next 3 to
10 years. It also affected German top-runner program. Program has contributed to the significant
energy efficiency improvement. List of target products is as follows.
1. Passenger cars
2. Trucks
3. Air conditioners
4. Television receivers
5. Video tape recorders
6. Lighting apparatuses
7. Copying machines
8. Computers
9. Magnetic disk devices
10. Electrical refrigerators
11. Electrical freezers
12. Heaters
13. Gas cooking appliances
14. Gas water heating appliances
15. Oil water heaters
16. Electric toilet seats
17. Vending machines
18. Power transformers
19. Jar rice cookers
20. Microwave ovens
21. DVD recorders
22. Routing equipment
23. Switching equipment
24. Multifunction office machines
25. Printers
26. Heat pump water heaters
27. AC motors
28. LED lamps
29. Heat insulating materials
30. Sashes
31. Multi-Paned glazing

EPODE17393 147
Annex 3 Energy efficiency institution for large
scale energy consumers
The Act on the Rational Use of Energy (Energy Conservation Act) sets the foundation for industrial
energy efficiency and energy management regulations.
Designated energy management companies are regulated to develop and submit mid-and long-term
energy management plans which include the company’s energy conservation goal of reducing energy
intensity by an annual average of 1% or more, and to submit annual report to government on energy
consumption and investment plans (Table 31).
In addition, the Act was revised to establish new national energy efficiency benchmarks for selected
sectors. Sectors covered include iron and steel, cement, and thermal power plants, pulp-papers,
petroleum refinery, petrochemicals and soda chemicals. The benchmarks are set and used as the
target standard of the best performing companies (top 10%–20%) in each subsector. Companies in
these subsectors are subject to annual mandatory reporting on the status of their performance on the
benchmarks. This has to be included in the mid-term reporting to the government required by the
Act. In 2016, the benchmark system was expanded to the commercial sector,
As for evaluation, survey forms sent in advance to factories are completed by them, and on-site
survey is carried out at each factory and cross-check the evaluations. If the evaluation shows results
are below a certain level, an on-the-spot inspection is carried out, and if the situation is not
satisfactory, the factory will be instructed to draw up a rationalization plan.

EPODE17393 148
Table 31: Examples of company obligation under the Energy Conservation Act
Source: METI web page (http://www.meti.go.jp/english/policy/energy_environment/energy_efficiency/pdf/121003.pdf

EPODE17393 149
Annex 4 ZEB/ZEH program and labelling system
for buildings
ZEB or ZEH is acronym of net zero energy building or house, assuming annual net energy
consumption is nearly zero. It will be achieved by energy conservation and renewable energy
integration, but criteria of certain degree of energy conservation should be satisfied.
There exists strong policy initiative in Japan Revitalization Strategy (Cabinet decision on June 14,
2013) as phased obligation to comply with energy-saving standards for housing and buildings. The
government introduced phased obligation to comply with energy-saving standards for newly
constructed housing and buildings with the regulation. As a result, total number of subsidize ZEH
could reach around 10,000 for only in FY2016. In addition, ZEB demonstration program is in
operation for with reduction requirement target new or retrofit buildings as shown in Figure 40.
Figure 40: Numbers of FY2016 ZEB Demonstration Project
Building-housing Energy-efficiency Labelling System (BELS) is new energy efficiency labelling system
in Japan. BELS display for building is the obligation, notification or efforts, depending on category.
Cumulative numbers of BELS acquisition are shown in Figure 41.

EPODE17393 150
Figure 41: Numbers of cumulative BELS acquisition

EPODE17393 151
Annex 5 Tax breaks for eco-cars
Tax exemptions are available for three automobile taxes: tonnage, acquisition, and ownership.
Hybrids, plug-in hybrid electric, electric, fuel cell, clean diesel, and natural gas vehicles qualify for tax
breaks. In addition, tax reductions are available for gasoline (including hybrid) and LPG fuelled
vehicles, depending on the energy efficiency requirement achievement levels (Table 32). Current fuel
efficiency standard base year is 2015, but 2020 efficiency level has been determined already to
prepare the automobile production. So both 2015 and 2020 level is considered in the tax rate.
Passenger cars, buses and trucks are the target products and this institution works for one of the
economic incentives to replace the automobiles.
Table 32: Summary of national tax reduction for passenger cars in fiscal year 2017
Target vehicle type Tax items Contents
Electric vehicle
Fuel cell vehicle
Natural gas vehicle
Plug-in hybrid vehicle
Clean diesel vehicle
Acquisition Exemption
Weight New car Exemption
First
inspection
Exemption
Fuel efficiency
Exhaust
performance
Achievement level
compared to FY2015
efficiency standard
Achievement level compared to FY2020 efficiency
standard
Less
than
+ 5%
+5% +10
%
Less
than
+ 5%
+10% +20% +3
0%
+40%
Gasoline
vehicle or
LPG
vehicle
(incl.
hybrid)
75% or less
compared to
2005 regulation
OR
50% or less
compared to
2018 regulation
Acquisition 20% reduction 40%
reduction
60%
reduction
Exemption
Weight New car 25% reduction 50%
reduction
75%
reduction
Exemption
First
inspection
Exemption

EPODE17393 152
Part III: Mutual Review and recommendations: Germany and Japan
By: Moritz Schäfer, Sonja Kotin-Förster, Katja Dinges, Korinna Jörling, Kristen Brand,
Atsushi Kurosawa

EPODE17393 153
1 Introduction
This section presents the third part of the study on Energy end-use efficiency potentials and policies
and the development of energy service markets for the German-Japanese Energy Transition Council.
The first section of this part undertakes a mutual review of the two individual country reports with a
focus on similarities and differences in potentials as well as the regulatory frameworks. It also aims
to explain the historical, political and cultural background of differences where relevant. The second
section formulates policy and business recommendations for both countries, highlights opportunities
for mutual learning, and identifies areas for further research.
In accordance with the respective national sector divisions for monitoring energy demand, the two
country reports follow a different structure. In order to allow for better comparability, the structures
were harmonised for the purpose of the mutual review. The Japanese distinction between commercial
and residential buildings was discontinued. Similarly, the German distinction between buildings and
appliances was not perpetuated in this study. As a consequence, the present section on buildings
refers to the sections “Commercial” and “Residential” of the Japanese country report, which also
includes appliances policies, and the sections “Buildings” and “Appliances” of the German report. In
addition, information and communication technologies are treated together with the section on
demand response as well as smart cities and communities. Similarly, rebound effects and the
behavioural approach are addressed together.
It should be noted that a full comparability of potentials was not possible due to the difference in
underlying assumptions and definitions. Although both country reports refer to policy-induced
potentials rather than techno-economic potentials, conclusions based on such comparisons can
therefore only be understood as tendencies and indications.
1.1 Indicators
The final energy demand per capita is almost exactly the same in both countries (see Table 33).
However, there are differences in levels per sector. In Japan, especially the energy use for
transportation is more energy efficient while the energy intensity of the German industry is
significantly lower by about 40%. Table 34 shows the energy demand structure in both countries. The
reasons for such differences would deserve future analysis, which was however beyond the scope of
this report.

EPODE17393 154
Table 33: Key indicators
Sector Germany Japan
Population (2016) 82.7 million 127.1 million
GDP in billion $US 3,364 4,383
Final energy demand per capita in GJ 107 107
Energy intensity in industry (per 1,000 $US added
value) 4.05 (MJ/$US)32 6.99 (MJ/US$)
Motor vehicles (cars, trucks, buses, motorcycles) 55.6 million 88.9 million
Sources: BMWi 2017a, Statistics Bureau 2016a, World Bank 2017a, World Bank 2017b, ANRE 2017, METI 2016, Destatis 2017,
statista 2017, JAMA 2016
Table 34: Final energy demand by sector in PJ
Sector
Germany
(2015)
Total by sector
in PJ
Germany
(2015)
Per capita
in GJ
Japan (2015)
Total by
sector in PJ
Japan
(2015)
Per capita in
GJ
Industry33 2548 30.8 6139 48.3
Buildings 373034 45.1 4333 34.1
Transport 2621 31.7 3077 24.2
Total 8899 107.6 13,549 106.7
Sources: ANRE 2017, AGEB 2016a, AGEB 2016b
1.2 Energy efficiency potentials
For the depiction of energy efficiency potentials in both countries, policy-driven scenarios were used.
However, while the assumptions of the efficiency potential scenario for Germany have been discussed
in WP 1, no description of the assumptions and the methodology of the calculation of the energy
savings potentials is available for Japan.
The following two figures show the energy efficiency potentials in Japan (Figure 42) and Germany
(Figure 43) respectively. Both figures show the baseline year of the respective scenario (2010 in
Japan and 2008 in Germany) as well as the reference scenario and the aggressive conservation
32 Calculated with the exchange rate from 31 December 2015 33 Excluding trades and services 34 Excluding buildings in industry but including trades and services

EPODE17393 155
scenario35. Additionally, the absolute savings potentials, which are the difference between the
aggressive conservation scenario and the reference scenario, and the relative saving potentials,
which are equivalent to division of the conservation and reference scenario, are depicted below.
Even though an exact comparison is not possible, it can be noted that the relative share of the
savings potential in the buildings sector is the highest, with more than 20%. This is followed by the
industry and finally the transport sector in both countries.
35 It should be noted that these scenarios are based on the assumption that even strong (‚aggressive’) policies will not fully implement the
economic potential for energy efficiency, let alone the technical potential (cf. Figure 7 in the part on Germany).
Furthermore, it was beyond the scope of this study to analyse why the reference scenario for Germany already has much higher absolute
energy savings compared to the reference scenario for Japan (and the reference scenario for Germany from another study shown in Figure
7). We kindly refer the reader to the GJETC study ST1, which compares a number of scenarios in more detail.

EPODE17393 156
Figure 42: Energy efficiency potentials per sector in Japan
Figure 43: Energy efficiency potentials per sector in Germany

EPODE17393 157
1.3 Cross-sectoral governance framework
In Japan as well as in Germany, multiple ministries have relevant jurisdiction influencing the
regulation of energy efficiency. In Germany, the Federal Ministry of Economic and Energy (BMWi),
the Federal Ministry for the Environment, Nature Conservation, Building and Nuclear Safety (BMUB)
and the Federal Ministry of Transport and Digital Infrastructure (BMVI) are the most relevant actors
while for Japan, quite similarly, these are the Ministry of Economy, Trade and Industry (METI),
Ministry of Land, Infrastructure, Transport and Tourism (MLIT) and the Ministry of Environment
(MOE).
In Germany, federalism on the one hand and the membership in the EU on the other create two
additional governance layers. While the sixteen states (Länder) have regulatory competences for e.g.
land-use planning, the EU releases comprehensive policy packages (e.g. directives, guidelines,
targets) that mostly have to be implemented on the national level. The Ecodesign and energy
labelling requirements are directly valid in all Member States. In Japan, significantly more regulatory
competences lie with the central government. One exception to this are construction permits,
which are issued by local authorities, as is the case in Germany.
In Germany, targets and concepts for a transition to a more sustainable energy future are
subsumed in the overarching political strategy Energiewende. Within the Energiewende, long-term
and binding targets are mainly derived from the Energy Concept which sets targets for climate
protection, renewable energies and energy efficiency for 2050. The Energy Concept is supported by
the Climate Action Plan 2050, the National Action Plan for Energy Efficiency as well as the 2020 and
2030 targets and 2050 objectives of the EU. For Japan, the energy supply and demand outlook 2030
and the Nationally Determined Contribution (UNFCCC) contain the most important targets.
In Germany, the Federal Office of Economics and Export Control (BAFA) and the German Energy
Agency (dena) are important institutions making up the overall regulatory infrastructure. The state-
owned KfW bank provides major funding for the implementation of the Energiewende. Besides this,
often regional energy agencies and consumer advice centres offer energy efficiency advice. In Japan,
energy conservation centres fulfil similar functions.
To eliminate market distortions, Germany is part of the European emission trading system (ETS)
and charges energy taxes, but does not have a CO2 tax in place. In Japan, a CO2 tax charging carbon
content for coal, oil and natural gas and energy taxes applying to fossil fuels and electricity are in
place as well. Furthermore, some local governments have own emission trading markets. However,
both countries continue to provide environmentally harmful subsidies. In Germany, this for example

EPODE17393 158
includes tax reductions for certain energy-intensive processes and techniques, a free allocation of CO2
emission trading allowances and a flat-rate taxation of privately used company cars to name a few.36
Table 35 compares the cross-sectoral governance frameworks in detail of policies that are existing.
However, a more detailed analysis of e.g. energy tax levels was beyond the scope of this study.
36 A detailed analysis of environmentally harmful subsidies in Germany is provided by UBA (2014)
https://www.umweltbundesamt.de/sites/default/files/medien/376/publikationen/environmentally_harmful_subsidies_in_germany_2014.pdf.

EPODE17393 159
Table 35: Cross-sectoral governance frameworks
Targets and Concepts Infrastructure and funding Eliminating distortions
DEU
• Energy Concept: By 2050 Germany wants to cut CO2 emissions by 80-95%, boost renewables to a share of 80% in electricity and reduce primary energy consumption by 50% until 2050 (compared to 2008) (cf. BMWi/BMU 2010).
• Climate Action Plan 2050: 55-56% GHG emission reduction by 2030 (baseline 1990)
• National Action Plan on energy efficiency (NAPE): 20% reduction in primary energy consumption until 2020, 50% reduction by 2050 and increase in energy productivity by 2.1% per year; building stock should be virtually climate-neutral by 2050 (NAPE is part of the Climate Action Program 2020)
• Green paper on energy efficiency: “energy efficiency first” principle
• “Energy of the future”: monitoring process for the energy transition
• All targets embedded in EU 2020 and 2030 targets
• Energy Agencies: dena (federal agency) and local energy agencies support the energy transition with expertise
• KfW (German development bank) and BAFA (federal office for export control): issue grants and loans to investors of energy efficiency projects
• Energy Efficiency Funds: Energy and Climate Funds are financed by the ETS allowances and state taxes
• Energy services: energy service law, advice, loan guarantees
• Energy taxation: Energy Taxes, Fuel taxes
• Emission Trading: EU Emissions Trading Scheme (ETS)
JPN
• Official energy supply and demand outlook: published by the Agency for Natural Resource and Energy since 1967, revised approx. every three years
• Nationally Determined Contributions (UNFCCC): 26% reduction of GHG emissions by 2030 (baseline 2013)
• Energy Conservation Act: Basic legal framework of energy conservation in Japan which has been modified several times to increase its coverage of industry, commercial, residential and transport sectors
• Building Energy Conservation Act: established to accelerate improvements energy efficiency in buildings
• Agency for Natural Resource and Energy: national government agency covering most of the energy and national resources related issues)
• Ministry of Land, Infrastructure, Transport and Tourism: national government, especially for transport and building efficiency
• Energy Conservation Center: promotes energy conservation measures in industry, households, international cooperation, fosters capacity building and public outreach, conducts the conservation management qualification examination, etc.
• Sustainable Open Innovation Initiative: Distribution of energy efficiency related subsidies
• Energy / CO2 taxation: tax proportional to carbon content introduced in 2012
• No national level emission trading scheme in place

EPODE17393 160
2 Buildings
About 35% of the Japanese residential building stock was built in or before 1980 according to the
Statistics Bureau (Statistics Bureau 2016b). In Germany, even 65% of residential buildings were built
before 1980 (Landesamt für Statistik Niedersachsen 2014). Hence, in addition to standards for newly
constructed buildings, incentives for energy-efficient renovation measures are of great importance in
order to tap the efficiency potential of the entire building stock. In particular, the building envelope
has a high potential for improvements in both countries. In Germany, it is estimated that in the next
20 years, 50% of residential houses will have to be renovated (BMWi 2017a).
The amount of living space in Germany has increased steadily since 1990. Between 2000 and 2014,
the living space per capita has increased from 39.5 to 46.5 m2, due to an increase in one-person
households and the tendency to remain in larger homes at old age (Eurostat 2016). In Japan, a
similar development took place. Between 1968 and 2013, the living space per house has increased
from 73.68 to 94.42 m2 (Statistics Bureau 2016b). The average household size has decreased from
about 3.5 to about 2.5 persons while floor space per capita has increased from 36 (2003) to 39.4 m2
(2013) (Statistics Bureau 2016b). In addition, the Nationally Determined Contribution of Japan has a
challenging target of 40% GHG reduction for buildings relative to 2013.
Regulatory instruments
In Germany, there are push and pull measures for energy efficiency in buildings, i.e. regulations
(push) and support programs and informational measures (pull). The programs support building
efficiency levels and renewable energy technology applications going beyond the regulations.
Germany has a long history of building regulations, dating back to the seventies, which have
continuously been updated.
For new buildings in Germany, the Energy Saving Ordinance (Energieeinsparverordnung - EnEV)
requires a maximum primary energy demand of the building in question to not surpass the primary
energy demand of the reference building. Since 2016 this requirement has been tightened by 25% in
order to follow a stepwise approach to nearly zero energy buildings by 2021 (public buildings: 2019).
The primary energy demand calculation comprises requirements for heat transition coefficients of the
building shell and for technical building systems (HVAC). The building shell requirements for
residential and non-residential buildings are in the same range for residential and non-residential
buildings whereas the requirements technical building systems differ significantly. Mandatory energy
certificates indicate the building's energy performance.
As for new buildings, renovation measures in existing buildings in Germany- applied to a share of
more than 10% of a building component - have to meet certain heat transition coefficients that are in
the same range for residential and non-residential buildings. Alternatively, building owners are also

EPODE17393 161
allowed to prove the conformity with component requirements with a whole building requirement,
which is 140% of the energy performance level for new buildings. Energy performance certificates
declare the energy efficiency standard of any given building or apartment and is a prerequisite for
selling, buying or renting a property.
For non-residential buildings in Germany, the standard to evaluate envelope performance is
calculated according to the annual thermal load coefficient of perimeter zone37. For standards to
evaluate the primary energy consumption of equipment and office automation devices (i.e. air-
conditioning, ventilation, lighting, hot water, elevators, etc.), energy produced in the building is
subtracted from total energy consumption.
In Japan, in contrast to the large number of specific instruments in Germany, one comprehensive
regulatory instrument, namely the Building Energy Conservation Act was introduced. Incentive
measures defined by the act became effective from April 2016 and regulatory measures from April
2017. Regulatory measures target new construction, extensions and renovation measures of
buildings at or over a certain size. This means that certification is mandatory for 2,000 m2 or larger
non-residential buildings and for 300 m2 or larger residential buildings. After the implementation of
the regulatory measures in 2017, large-scale non-residential building that are not compliant with
energy efficiency standards will become ineligible for certification.
Incentive measures in Japan are in place for all newly constructed buildings, extensions,
renovations, improvements, remodelling and pre-installation or repairs of cooling system equipment
that contribute to the improvement of overall energy performance. If plans for such measures are
compliant with certification standards, they may receive certification from the administrative agency
with jurisdiction in the construction area. By acquiring certification for the performance improvement
plan, construction clients are eligible to receive benefits. Additionally, pre-existing buildings can
receive certification of conformity with energy efficiency standards.
In Japan, there are two types of labelling systems in place. (1) For new buildings, labelling for
the energy efficiency performance of buildings works as an incentive for building owners and
emphasizes the energy efficiency performance as being at or higher than standards during new
construction of residential and non-residential buildings. (2) For existing buildings, the labelling
system to display compliance with energy efficiency standards lets owners emphasize the compliance
of an existing residential or non-residential building with energy efficiency standards during
renovations. Floor space energy intensity is implicitly evaluated when calculating primary equivalent
net energy consumption of the buildings. Standard software is open to the public for standard
building energy consumption estimates. Builders should comply with the energy performance at their
design stage to obtain approval. Small residential building with less than 300m2 are exempted from
37 The perimeter zone is defined by the interior space that is within 5 horizontal meters of all walls that are in contact with the outside air,
the interior space of the floor directly below the roof, and the interior space that is directly above the floor in contact with the outside air.

EPODE17393 162
the regulation. In contrast to the German energy performance certificate, labelling for new and
existing buildings is encouraged, but in most cases not mandatory in Japan.
In Germany, there are long-distance heating and cogeneration units/systems, whereas in
Japan this is not widely spread because it is not economical in most regions. Further, in accordance
with the German heating pump replacement scheme, since August 2016, 30% of investment costs for
heating system circulators, hydraulic balancing and other low-expenditure measures are covered by
subsidies.
The implementation of building regulation in Germany is relatively successful as the absolute
energy consumption of commercial and residential buildings is decreasing. However, the current
renovation rate - and especially that of deep renovations - is too low to meet the energy efficiency
targets. Remaining barriers include the landlord/tenant barrier which refers to the share of 60% of
the population renting rather than owning houses. As the legal rights of tenants are quite strong in
Germany, renovation measures have to be coordinated carefully. Further barriers are of financial and
informational nature.
In the case of Japan, mandatory building performance standard regulation has just recently come
into effect so that it remains to be seen to what extent implementation will be successful.
Appliances
Both countries regulate appliances with regards to their energy efficiency. In Germany, appliances
are regulated by the EU directives on Ecodesign and Energy Labelling. The Ecodesign directive
sets standards for individual appliances, a process that can be challenging especially for products
undergoing a fast development, such as ICT appliances. The directive was transferred into national
law with the Energy Consumption-Relevant Products Act, making energy labelling mandatory.
Another policy measure are financial incentives for poor households to replace old products for more
efficient ones. Germany has lobbied the top runner approach on the European level for about 5 years,
but there is no mandatory regulation with the top runner approach in place. Instead, Germany has
implemented a National Top Runner Initiative (NTRI) on the national level, which bundles measures
to speed up the market penetration of high-quality services and products (top runners) that
contribute to reducing energy consumption. For example, it is facilitating stakeholder dialogues and
promoting the EU Energy Star. In general, there is a tendency that national approaches are becoming
harder to implement in the face of detailed European legislation.
The Top Runner program in Japan is the country’s primary instrument for energy efficiency and
appliances. It bundles energy performance standards and labelling programs that set efficiency
targets for the next 3-10 years. It applies to 31 target products including passenger cars, trucks, air
conditioners, heaters, computers, LED lamps and multi-paned glazing. It promotes competition in the
area of energy efficiency as the most efficient products set the standard for the respective product.
The program covers ca. 70% of residential end-use energy consumption (2009).

EPODE17393 163
The key difference is that the current regulatory system in Japan operates with mandatory
benchmarks on a competitive basis, while in Germany, this tool is not employed as effectively.
Nevertheless, a study commissioned by the Federal Environment Agency found that appliances are
similarly efficient as in Japan, indicating that the effects of both systems are similar.
The following table provides a qualitative comparison of national-level instruments in the buildings
sectors in Germany and Japan. A more detailed analysis of e.g. energy performance levels required
by building regulation or supported by financial incentives was not possible in this study.

EPODE17393 164
Table 36: Overview of energy efficiency-related policy instruments in buildings sector in Germany and Japan
Regulation Planning Information & Advice Incentives & Financing Capacity Building & Networking
Research and Development & BAT promotion
DEU
• Energy Conservation Act (EnEG) / Energy Conservation Ordinance (EnEV)
• Renewable Energies Heat Act (EEWärmeG)
• Heating Cost Ordinance • Tenancy law (rent
increases allowed following modernisation)
• Energy Consumption-Relevant Products Act (EPPG), Energy efficiency Labelling Act
• Renovation Roadmaps
• Energy Performance Certificates
• National heating label • “energy-saving meters”
pilot programme • Information campaigns:
e.g. “Deutschland macht’s effizient” (Germany makes it efficient)
• Top-Runner Initiative • Subsidies for
Informational measures: On-site consulting, energy check
• Energy efficient buildings: CO2-Building Renovation and New Build Programme – KfW support programmes and “Renewable energy” Market Incentive Programme
• “Energy Efficiency” Market Incentive Programme
• Tax deductibility of craftsmen’s bills
• Heating circulator replacement scheme
• ZEB guidelines and harmonized database for good practices by REHVA (Federation of European Heating, Ventilation and Air Conditioning Associations)
• The “Energy in buildings and neighbourhoods” research network
• The Energy-Optimised Building (EnOB) research initiative
• The EnEff:Stadt/Wärme (energy-efficient city/heat) research initiative
JPN
• Building Energy Conservation Act
• Energy Conservation Act
• Energy efficiency labelling system for buildings
• Information on the rational use of energy (best efforts)
• Appliance labelling
• Subsidy system for ZEH (net zero energy houses) demonstration or ZEB (net zero energy buildings) construction
• Subsidies for home energy management systems
• Subsidies for high performance building related products during renovation
• Tax reduction or credit for retrofitting residential buildings
• ZEH builder registration program.
• ZEB/ZEH guidelines
• Demonstration program in operation for energy efficient new and retrofitted buildings (ZEB/ZEH)

EPODE17393 165
3 Industry
Similar developments can be observed in both countries: Some of the most energy intensive
industries in both, Germany and Japan, include chemicals, iron and steel, and pulp and paper. The
savings potentials are highest for the iron, steel and chemical industries. The improvements for
energy intensity are stagnating and energy intensity improvements are currently not sufficient in
both countries.
Regulation
The policy approaches follow very different paradigms with a focus on regulatory instruments in
Japan and financial support measures and voluntary commitments in Germany. In Germany, it is
mandatory for non-SMEs to carry out energy audits for monitoring their energy management
systems, however, energy efficiency measures recommended by the audits do not have to be
implemented. Companies that have an energy management system in place can claim very
substantial energy tax exemptions. The tax exemption was introduced after a voluntary agreement
between the association of the manufacturing industry and the German government indicating that
the manufacturing industry must increase its energy efficiency by 1.3% in the years 2013 to 2015
and by 1.35% in 2016 compared with the yearly average energy intensity of the 2007 to 2012 base
years. For SMEs, there are energy tax exemptions in place as well, but they can implement different
energy management systems that are not certified under the same standards as those for large
industrial actors. In addition, the energy intensive industry is subject to the European Emission
trading system (ETS).
In Japan, the Energy Conservation Act includes mandatory targets and benchmarks for industry. In
addition to an absolute target of an annual 1% reduction in energy intensity per company for all large
businesses, a relative benchmark exists: In each of the covered subsectors, the top 10-20% best
performing companies set the benchmark. This applies to iron and steel, cement, thermal power
plants, pulp-papers, petroleum refinery, petrochemicals and soda chemicals. About 90% of industry
is covered by the relative benchmark. Small and medium-sized enterprises are not covered by the
regulation. Site inspections by authority do not occur often, but are executed for enterprises with bad
performance. It has been mandatory to report energy consumption annually since the oil shocks in
the 1970s. Fines for missing or false information in the energy consumption and medium-term
planning reports exist as well as for the failure to appoint an energy manager. Further, fines for non-
compliance with energy intensity improvements or rational energy use reductions exist.

EPODE17393 166
It can be noted, that Japan uses more regulatory measures in the industry sector, compared to
Germany where historically (especially since the 1990s) policies were built as voluntary
agreements.38
Barriers
A common barrier in both countries are long investment payback periods. In Japan, barriers to
energy efficiency in the industry sector include stagnation as a result of past improvements, lack of
proactive engagement of multiple enterprise businesses, and a lack of funds, human resources and
know-how for small and medium enterprises. In Germany on the other hand, some of the barriers
with particularly high relevance include the low price for carbon certificates, payback times on
investments in energy efficiency exceeding industry’s expectations of usually around two to three
years payback times, competition between energy efficiency investments and more strategic
investments with higher rates of return, low energy tariffs for industrial companies, and high
transactional costs for the application of subsidy programs. In larger enterprises, organisational
aspects are inhibitive while in SMEs, information deficits are more relevant.
The following table provides a qualitative comparison of national-level instruments in the industry
sectors in Germany and Japan.
38 For an overview of existing and previous voluntary agreements with the industry see: http://www.bmub.bund.de/themen/wirtschaft-
produkte-ressourcen-tourismus/wirtschaft-und-umwelt/selbstverpflichtungen/

EPODE17393 167
Table 37: Overview of energy efficiency-related policies in the industry sectors of Germany and Japan
Regulation Planning Information & Advice Incentives & Financing Capacity Building & Networking
Research and Development & BAT promotion
DEU
• Greenhouse Gas Emissions Trading Law: mandatory emission trading for energy-intensive industry
• Tax law: Special compensation regulation for electricity intensive companies & railways (according to §§ 63 ff. EEG 2014, electricity and energy tax law)
• Energy Services Law: Mandatory energy audits and energy management systems for non-SMEs, implementation of Art. 8 of the EED (EDL-G)
• Energy advice for SMEs: free of charge
• Consulting for performance contracting
• Top-Runner Initiative • Campaign Germany
makes it efficient (Deutschland macht’s effizient)
• KfW Energy Efficiency Program: Production facilities/processes; construction and renovation and heat recovery
• KfW financing for energy efficient and climate-friendly production processes
• BAFA funding for highly efficient cross sectorial technologies
• Funding for energy management systems for SMEs
• Tendering model (“STEP-UP”)
• Energy Efficiency Networks (LEEN): voluntary approach
• 6th Energy research framework program
• Research for an Energy Efficient Industry
• BMUB’s Environmental Innovation Programme
JPN
• Energy Conservation Act: (1) annual energy intensity and benchmark targets, mandatory reporting, mandatory appointment of energy managers, (2) top-runner program for domestic sales
• Medium term energy saving planning
• Free energy diagnosis assistance by Energy Conservation Center Japan (for small and medium enterprises)
• Performance labelling with energy and cost saving estimates for products
• Subsidies for equipment or systems
• Interests replenishment system for equipment purchase
• Loans for equipment
• Keidanren (Japan Business Federation) represents 1340 companies, 109 industrial associations, 47 regional economic organisations own declaration for annual energy performance, reports (monitored by industrial association)
• New Energy and Industrial Technology Development Organisation (NEDO): R&D subsidy for industrial processes etc.

EPODE17393 168
4 Transport
In Germany and in Japan the transport sector accounts for around one fourth of total energy
consumption. While in Germany absolute traffic volumes continue to increase, efficiency gains via
technical improvements are offset and overall energy consumption has increased by 16% since 1990.
Since 2000 in Japan absolute final energy consumption of the transport sector is decreasing which is
due to the large share of hybrid cars and decreasing size of cars. Absolute energy demand for
passenger transport is stagnant and freight demand is decreasing. Costly maintenance requirements
especially for older cars result in shorter exchange rates of cars and, hence, in a more modern fleet
in Japan. The share of hybrid cars in sales is around 35% according to recent statistics (IEEJ 2017).
This development is not mirrored in Germany, where cars tend to become heavier and larger (VCD
2015).
In both countries, fossil fuels are dominant. In Germany, as 90% of all transport fuels used are fossil
fuels, biofuels and electricity play a minor role. In Japan, 97% of all transport fuels used are oil-
based and other fuels play only minor roles: The most important fuels are gasoline (54.9%) and
diesel (32.4%), while electricity makes up for only 2.4% (IEEJ 2017).
Both countries have regulations for fuel efficiency of cars. While for Germany, this is implemented
directly by the EU’s CO2 fleet limit values and Energy Labelling, it is included in the Top-Runner
Scheme in Japan. Both countries also have tax exemptions for electric vehicles. While in Germany tax
breaks for electric vehicles are available for ten years and taxes are staggered by CO2-content, in
Japan tax exemptions or tax breaks are available for electric vehicles, fuel cell vehicles and very fuel-
efficient cars. For initial registration, eligible vehicles are exempted from taxes completely. For the
annual payment, there are staggered tax breaks that are in effect for the first year only.
In terms of barriers, both Germany and Japan having difficulties to achieve an energy efficient modal
composition as motorised individual transport plays a prominent role in both countries. Major
efficiency gains have not been made in the transport sectors. In Japan, slow diffusion of next-
generation vehicles and traffic flow control are cited as the main barriers to increased energy
efficiency in the transport sector but such issues are not notable barriers in the German transport
sector. In Germany, barriers with ‘very high’ relevance include incentives for manufacturers to
produce large and heavy cars, high investment requirements for a high-quality public transport
system, cars as status symbols, and lack of holistic concept for an integrated (energy efficiency)
transport policy, to name a few. Culturally, automobiles are an important status symbol in Germany.
This is complemented by scepticism towards electromobility.
For a qualitative comparison of national-level instruments in the transport sectors in Germany and
Japan, see the table below:

EPODE17393 169
Table 38: Overview of energy efficiency-related policy instruments in the transport sectors of Germany and Japan
Regulation Planning Information & Advice
Incentives & Financing Capacity Building & Networking
Research and Development & BAT promotion
DEU
• European CO2 fleet limit values for passenger cars and light commercial vehicles
• Adaptation of European Renewable Energy Sources Act (EAG EE)
• Biofuel Sustainability Regulation
• Ordinance on Energy Consumption Labelling
• Energy labelling of car tyres
• Federal road planning
• National bicycle traffic plan
• Government program electromobility
• Commitment to build up a tanker and charging infrastructure for alternative fuels
• Initiatives and pilot projects in the field of company / municipal mobility management
Vehicle-related taxes: • CO2-based vehicle tax • Ten-year car tax exemption for
cars with only electric motors • Energy tax • Reduced taxation of natural gas
and liquefied natural gas beyond 2018
Other: • Funding program for electric
vehicles and charging infrastructure
• Mode-independent distance (tax) refund
• Air traffic tax • Truck toll (and further
development)
• National platform electromobility
• Innovation programme for hydrogen and fuel cell technology
• Field trials of electric motors in heavy commercial vehicles
JPN
• Top runner program includes passenger and freight vehicles
• Fuel efficiency standards are gradually being strengthened; current fuel efficiency standard base year is 2015, but 2020 efficiency level has been determined to prepare automobile industry
• Intensity targets and its reporting for transport operators
• Shippers: intensity target setting and annual reporting
• Efficiency improvement of logistics
• Road planning for urban area
• Next generation Electric Toll Collection (ETC 2.0) provides more intelligent driving with car navigation system for avoiding road congestion (operating)
• Tax exemptions available for tonnage, acquisition and ownership taxes which apply to hybrids, plug-in hybrid electric, electric, fuel cell, clean diesel, and natural gas vehicles. In addition, there are 5-40% tax reductions for gasoline (including hybrid) and LPG fuelled vehicles, depending on the energy efficiency achievements
• Subsidies for EVs and FCVs • NEV (next-generation vehicle
promotion center): subsidies for EV charging stations and FCV refuelling stations
• Eco-driving campaign (e.g. idling stop)
• Demonstration projects with trucks, taxis and ships testing modal shift (rail, ship) and logistic efficiency improvement
• New Energy and Industrial Technology Development Organisation (NEDO): R&D for automobiles
• Hydrogen energy related R&D

EPODE17393 170
5 Cross-sector
5.1 Information and communication technologies, smart cities and smart communities
Japan (rank 10) is ranked slightly better than Germany (rank 15) on the network readiness index of
the World Economic forum, which indicates the degree to which digital infrastructures are ready to
support the digital transformation (World Economic Forum 2016). Clearly, both countries will have to
invest into the digital infrastructure in order to keep up with the pace of digitisation. Technologies
such as system learning, demand forecasting and virtual aggregation of storage devices are currently
in development and could contribute significantly to energy efficiency gains. However, the realistic
impact of these technologies for energy savings will have to be determined.
In the present phase, both countries have demonstration projects underway. In Germany, the
SINTEG project ("Smart Energy Showcases - Digital Agenda for the Energy Transition") is a
prominent example while Japan has implemented demand response projects and demonstration
projects for smart communities and cities as well as energy management systems in buildings,
factories and homes. Both countries envisage the development of business models especially for big
data, visualisation of energy use, etc.
In the case of smart meters, Germany’s law on the digitalisation of the energy transition prescribes
smart meter roll-out in several stages. In contrast, in Japan no legal obligation is in place. Instead,
the smart-meter program is operated by power retailers. According to the Electricity and Gas Market
Surveillance Commission (EGC, 2017), about 30% of low voltage meters are smart meters as of
November 2016 in Japan. It is expected that all residences will have smart meters by 2025, as the
official lifetime of power meters is 10 years. Germany obliges large consumers with over 10,000
kWh/year and producers between 7-100 kW installed capacity to install smart meters until 2024 while
for smaller consumers and producers, the smart meter roll-out period commences in 2020 and will
last until 2027. In conclusion, roll-out in Japan seems to have progressed slightly further. Yet, in
neither of the countries is roll-out matched with energy efficiency targets.
For the purpose of promoting the dialogue on smart cities and communities, both countries are
engaged in international evaluation groups such as IEC SEG1. Four large scale demonstration
projects were selected and conducted in Yokohama, Toyota, Kansai Science city and Kitakyushu from
2010-2014. In Germany, the responsibility for the promotion of smart elements in cities and
communities lies with the local authorities. On the federal level, a national strategy group on smart
cities is working on smart city guidelines and strategies.

EPODE17393 171
5.2 Demand Response
For the widespread application of demand response (DR) measures, Japan and Germany will both
have to take into consideration open questions concerning price sensitivity, announcement effects
and weakening effects due to habituation.
In Japan, demonstration projects for tariff based DR and negawatt trading, time of use pricing (TOU)
and critical peak pricing (CPP) were tested for price sensitivity. Demand reduction for CPP was found
to be at 10-15% and for TOU at around 10%. Currently, virtual power plant demonstration projects
are underway with the aim to use aggregation for flexible energy management in order to meet
variable renewable energy production. Germany is testing different aspects of demand response in
the different SINTEG projects, e.g. “NEW 4.0”, “WindNODE” and “Designnetz”. The outcomes of these
projects are yet to be expected.
Flexible electricity tariffs are legal in Germany, but are not yet on the market, except for traditional
time-of-day tariffs. Large consumers, however, can buy directly at the electricity exchange. There is
no wide-spread application of DR mechanisms although some large industrial consumers are already
capable of employing them such as the aluminium producer Trimet. In Japan, flexible electricity
tariffs require permission from the government, but tariffs will be deregulated after 2020. Currently,
consumers can choose for example TOU tariffs (time intervals are pre-defined) but uptake has not
been significant so far.
For a comparison of national-level instruments in the ICT, demand response, and smart cities and
communities in Germany and Japan, see the table below:

EPODE17393 172
Table 39: Overview of energy efficiency-related policy instruments in the ICT, Demand Response, and smart cities and communities
Regulation Planning Information & Advice
Incentives & Financing
Capacity Building & Networking
Research and Development & BAT promotion
DEU • Law on the digitalisation of the energy transition: regulation of smart meter rollout
• Digital Agenda 2014-2017
• High-tech Strategy “Innovation for Germany”
• Digital Strategy 2025
• Platform Industry 4.0
• Energy transition platform: research and innovation
• Pilot programme Savings Meter (“Einsparzähler”)
• Digital networking in the framework of the digital agenda
• Green IT Initiative
• Large-scale demonstrators (‘Showcases’): Digital agenda for the energy transition (SINTEG)
• 6th energy research framework: Support initiatives “Energy storage” and “Future-proof Power Grids”
• Technology programmes: “Smart data”, “Smart service world”, “ICT for electric mobility II”, “E-energy – ICT based energy systems of the future”, „material science research for the energy transition “
JPN • ICT as a core energy technology in National Energy and Environment Strategy for Technological Innovation towards 2050 (NESTI 2050)
• Traffic information provision to avoid congestion
• Study group on energy digitalisation in Agency of Natural Resource and Energy
• Favourable treatment of smart meter examination commission fee
• Communication protocol between smart meter and Home Energy Management System (HEMS)
• Ministry of Economy, Trade and Industry funds virtual power plant projects
• Standards of Home Energy Management System (HEMS)
• Demand management through negawatt trading demonstration

EPODE17393 173
5.3 Rebound effects and the behavioural approach
The rebound effect is a widely-recognized phenomenon and negatively impacts energy savings
targeted by policy measures. Rebound effects can be counteracted by behavioural approaches. This
means that policy measures aim to induce pro-environmental behaviour.
In Germany, information campaigns such as “Germany makes it efficient” and subsidized energy
advice aim to increase awareness and thereby lead to energy savings because of more sustainable
consumer decisions or use patterns.
In Japan, a trend towards a decline in electricity demand, especially in the commercial and residential
sectors is attributed to increased consciousness of energy saving and became known as the Setsuden
initiative. In Japan, the Great East Japan Earthquake in 2011 lead to a temporary 10% reduction in
electricity consumption. Currently, there is a government campaign of ‘Cool Choice’ during summer
and winter. It aims at replacement to energy efficient and low carbon products and services, and
lifestyle changes to reduce greenhouse gas emissions.
The Japanese “Eco-point system” incentivizes the purchase of energy-efficient products such as air-
conditioners by allowing consumers to purchase LED light bulbs with points awarded. In the case of
residential heating, consumption behaviour is different in Japan, as only those rooms that are used
for the moment are heated up. In residential buildings, central heating or cooling is very rare while
non-residential buildings frequently use central heating or cooling. The residential heating demand is
quite low, even after Heating Degree Day (HDD) adjustment, compared to Germany (Juukankyo
Research Institute 2013). However, the residential energy consumption portfolio is quite different in
two countries. For example, Japanese hot water consumption is relatively large because of bathing
habits. Also, electric appliances power consumption is relatively large in Japan, including more space
cooling needed than in Germany. In total, German residential energy consumption per household
may relatively be larger because of high heating demand and larger dwellings.
Energy service market
There is considerable growth of the energy service markets in both countries. Energy services can be
divided into information, consulting, energy management and ESCO models.
The supply side of Germany’s energy service market is characterized by high competition and well
developed. It remains however a challenge to create corresponding demand. Japan’s Energy
Conservation Act requires companies to appoint energy managers, which preform various energy
efficiency management services. Hence, what is offered by energy service markets tends to be rather
performed with in-house personnel in Japan. While Table 40 aims to compare different energy
services in both countries, it can be seen that a classification of energy service products (see table
below) such as in Germany does not exist in Japan.

EPODE17393 174
The Japanese market scale of energy service companies is estimated at 20-30 billion JPY (~EUR 230
million) per year (Japan Association of Energy Service Companies) and it is reported that there is a
potential to save 174 PJ/yr in the commercial sector (Jyuukankyo Research Institute 2014). The
German market had a total turnover of about EUR 135 billion to date, with a market size of 8 to 9
billion per year.
Table 40: Energy service markets in Germany and Japan
Germany Japan
Energy consulting
Energy consulting is the most offered and demanded energy service product. Around 14,000 companies are estimated to provide a variety of energy consulting services. The market has increased from a volume of EUR 270 to 460 million in 2012 to EUR 480 to 520 million in 2015. Energy consulting is often an entry point for further energy efficiency services and investments. A high potential on demand side is estimated, while currently only around 1% of objects have been subject to energy consulting. Positive expectations dominate the market as around 73% of energy service providers expect a market growth in terms of turnover in the coming three years.
See ESCO models
Energy Management
In the European Union, it is a prerequisite for non-SME companies to have a certified Energy Management System in place or carry out energy audits every four years. Since 2016, in Germany, all companies – which are not SMEs – need to have a certified Energy Management System in place or an energy audit. For SMEs, this can alternatively be an energy audit or alternative systems to improve energy efficiency. The market volume for energy management services is estimated around EUR 250-500 million per year with a growth tendency.
In Japan, large companies must appoint qualified in-house energy managers to comply with the Energy Conservation Act obligations such as energy consumption reporting, medium term planning, etc. For small and medium-size enterprises, energy conservation diagnosis is free of charge.

EPODE17393 175
Germany Japan
ESCO Models
Energy Performance Contracting (EPC) and Energy Supply Contracting have the highest market volume of around EUR 7.2-8.4 billion with a steady annual increase (BfEE 2017). The market volume has increased from EUR 3.5-5 billion (2012) and EUR 1.7-2.4 billion (2010) (JRC, 2014). More than 60% of energy service suppliers expect growth or even strong growth of the ESCO market until 2020 (BfEE 2017). The market research conducted by BfEE finds around 500 specialised ESCOs and utilities providing ESCO models while only around 10-15 ESCOs provide EPC in their portfolio. And while utilities only generate 17%, ESCOs generate almost two thirds of their turnover from energy services (BfEE 2017). ESCOs mainly originate from utilities, energy companies and independent energy service companies (e.g. provider of building automation). Other market participants are energy consultants, engineering firms, crafts businesses and planners.
Companies that implement energy conservation measures and provide further services such as a comprehensive engagement of energy related business have business opportunities in Japan. A market survey by the Japan Association of Energy Service Companies (JAESCO) estimated that the annual market scale of the member companies on a new order basis has been in the range of 20 to 30 billion JPY per year (150 to 230 million EUR per year).

EPODE17393 176
6 Conclusion on the mutual review
The mutual review of the individual country reports has revealed a number of parallel developments
as well as clear differences in the regulation of energy efficiency in both countries.
While energy efficiency is regulated by two comprehensive Acts in Japan including the Energy
Conservation Act and Buildings Energy Conservation Act, the regulatory landscape in Germany has
more complexity, also due to the EU which has created an additional governance layer.
In contrast to Germany, which has a comprehensive energy transition strategy in place known under
the term “Energiewende”, a similar, but less comprehensive strategy called "Long-term Energy
Outlook" exists in Japan. However, while Germany has formulated targets for 2050, there are no
such long-term quantitative energy targets in Japan.
Especially for the regulation of buildings and in the industry as well as appliances covering both
sectors, mandatory competitive benchmarks play an important role in Japan. This instrument is not
commonly used in Germany, where standards for appliances are agreed for each individual appliance
on a EU-level. In Germany, the building envelope performance regulation is advanced. The Japanese
regulation however, was rather weak in the past, but the recent establishment of the Building Energy
Conservation Act will accelerate energy efficiency especially in large buildings. In contrast to the
German energy performance certificate, labelling for new and existing buildings is encouraged, but
not mandatory in Japan.
Energy efficiency developments and regulation in the industry are difficult to compare in detail
because the production style of each industry differs. However, the monitoring and compliance
systems are different. While in Germany, mostly third party audits are contracted for energy
consumption reports, Japan requires in-house reporting from each company. In some cases, energy
diagnosis for small and medium enterprises are done by third parties as well in Japan.
Efficiency improvement of vehicle and next generation vehicle diffusion are a common agenda for
Germany and Japan, as the automobile (i.e. passenger cars, buses, freight trucks) share is dominant
in both countries’ transportation energy demand.
With regard to information and communication technologies, demand management and response
measures and smart cities and communities, both countries seem to be in a similar position.
Research and development is being undertaken and supported by the government. Yet, there are no
wide-scale applications employed for improved energy efficiency and the energy savings potential
remains largely unclear.
Energy consulting services as well as energy providing services exist in both countries. Yet, the
energy efficiency service market seems to be more defined in Germany compared to Japan. One

EPODE17393 177
explanation is that most energy services are done by in-house management as energy managers are
required by Japanese law. Nevertheless, both countries expect a growth in energy services especially
with regard to digitisation.

EPODE17393 178
7 Recommendations
The following section outlines the policy recommendations and business opportunities for each
country as well as mutual learning opportunities and identifies further research. The section draws on
the results of the analysis for both countries including the previously discussed similarities and
differences.
7.1 Policy recommendations and business opportunities
Germany
Germany has a large range of policy instruments to improve energy efficiency. Most policies are set
up to act mutually reinforcing. This includes for example several subsidies such as the possibility to
finance measures identified in the energy efficiency networks for industry, or via energy advice,
through public funds. Other instruments, such as information measures, are complementary to other
instruments. This includes for example energy audits or energy consultations which act as precursors
to the implementation of energy efficiency measures. However, there are also instruments that are
contradictory or cancel each other out. For instance, the exemption from the Renewable Energy Act
levy (“EEG-Umlage”) for large industrial energy consumers acts as disincentive to save electricity as
these actors want to avoid falling below the minimum energy consumption threshold defined for the
exemption. Generally, further or improved measures are needed to close the gap for reaching the
2020 targets in all sectors. In the following, recommendations are provided per sector to follow the
same set-up of the report, starting with the overall governance framework. No priority is assigned
to the instruments, all are considered important. It was not possible to quantify an expected impact
in the scope of this study.
In addition to the further development of existing policies and new policies, it will be necessary to
integrate elements regulating energy prices and subsidies. Energy prices are a strong driver for
energy efficiency, e.g. through increased fuel prices. Additional revenues could be re-invested in
energy efficiency measures. Another crucial point is to embed new policy instruments more strongly
into the overarching energy transition. In an energy system with a high share of variable renewable
energies, sector coupling and flexibilisation of demand have to be taken into account in the future
policy package for energy efficiency. Therefore, Research and Development projects will play an
important role in successfully realizing the Energiewende and will need to be adequately reflected in
the further development of policies.
Additionally, Germany has committed to the Energy Efficiency First Principle, which will need to
be reflected in the development of policies and needs to be incorporated in all policy and investment
decisions. Within the policy mix, a focus is set on financial incentives rather than regulatory
instruments. Therefore, more balanced and comprehensive policy packages that use regulatory,

EPODE17393 179
financial, informational and all other instrument types will need to be considered for the development
of new policies.
For the buildings sector, ensuring a high-quality qualification of building experts is key. In order to
overcome the barrier of lacking trust in energy efficiency auditors and energy consultants, stricter
qualification requirements should be set. Additionally, stricter laws are necessary to assist with the
verification of the correct presentation of energy certificates and, if necessary, implement sanctions
consistently. Additionally, policies to incentivise the energy efficient refurbishment of the existing
building stock are primarily of financial and informational nature, regulation to refurbish old and
inefficient building stock should be considered. Further incentives for deep renovations is crucial,
especially with respect to the long-term targets. Yet, barriers such as split incentive or lacking trust
in energy efficiency auditors still exist. The KfW provides a considerable amount of funding for
building renovations and has been very effective in doing so. Transaction costs for funding programs
for non-residential buildings should be further reduced. KfW programmes will also need to be
expanded to consider sector coupling opportunities when refurbishing buildings. Additionally, a
revision of the building codes for new built with very energy efficient nearly zero energy building
requirements is still pending.
In the industry sector, most policies have a voluntary nature. The implementation of article 8 EED
to perform mandatory energy audits for non-SMEs has been a first step to increase the number of
regulatory instruments, however the implementation of recommended measures by the audit is not
mandatory. For the further development of policies, recommended efficiency measures will have to
be implemented. To facilitate this, thresholds (e.g. of financial nature) can be set to determine the
order of implementing measures. Moreover, the obligation to perform energy audits should also apply
to SMEs. Also, the examination of useable waste heat potentials should be included as mandatory
requirements in energy audits and energy management systems. Additionally, energy taxes are a
strong instrument in the industry sector. The public consultation of the Green Book Energy Efficiency
has highlighted the interest and support by the public to implement a CO2-tax. Furthermore, for
industrial processes the development of standards, norms and benchmarks for efficiency technologies
is crucial. Financial instruments should be designed in a transparent and permanent manner with low
transaction costs. For the further development of subsidies, the successive rising of minimum
standards is necessary.
In the transport sector, obstacles to reaching the full efficiency potential exist on all levels (system
efficiency, transport efficiency, vehicle efficiency). On the systemic level, the lack of a comprehensive
strategy for an integrated transport regulation is the main issue. It also remains difficult to achieve a
modal shift towards energy efficient and climate friendly modes of transport. In order to reach the
targets of a 10% reduction until 2020 and a 40% reduction until 2050 (baseline 2005) in final energy
consumption, further energy efficiency measures are necessary. Existing instruments focus on
increased vehicle efficiency. Against the background of the current emission scandal in the German
automobile industry, severe issues of implementation have become obvious. Furthermore, system
and transport efficiency are hardly addressed at all in the current state, so that a mere strengthening
of current standards will remain insufficient. Therefore, a fundamental transport transition is needed

EPODE17393 180
that entails a national strategy for an integrated, climate friendly transport policy mix. Financial
incentives as well as investments in public transport to secure a higher quality of service in the public
transport system are important. Existing policies on the EU level such as fleet targets for automobile
manufacturers in combination with restrictive policies for individualised motorised transport, e.g.
speed limits are necessary. Further goals should include the complete internalisation of external costs
in the fuel tax (greenhouse gas and CO2-content) as well as the kerosene tax for domestic flights.
Taxes for individual motorised transport should be based on greenhouse gas emissions as an
indicator. Setting off prices for purchase and operation of privately used vehicles from tax liability
should only be allowed to a limited extent. Repayments from commuter allowances could be linked to
sustainable transport, favouring public over private transport. Finally, information measures that
target mobility behaviour and choice of transportation mode in favour of climate friendly alternatives
are recommended as a complementary measure.
Appliances are primarily regulated by the Ecodesign and Energy Labelling Directives. National
regulations are not allowed to have more ambitious standards than required by the EU Directives.
Therefore, efficiency policies focus on information and financial measures. On EU level, it is
recommended that efficiency requirements should be increased progressively and not linearly and
where applicable should include limits. Market surveillance should be strengthened. According to
MarketWatch (2015); every fifth product consumes more energy than indicated. Default values of
appliances should mandatorily be set to energy-efficient modes by the producers.
Digitisation can provide an opportunity for new consulting tools to save energy in equipment by
enabling cost-effective consulting services, which at the same time are more responsive to individual,
real-world use. This also includes building automation. For the industry sector, business opportunities
lie in demand response. Third-party aggregators and utilities could recruit customers for demand
response programs to relieve the grid during periods of high energy demand, which will facilitate the
development of demand response automation. In this context, utilities could also implement pilot
programs for flexible electricity structures. For this, Germany could look at the virtual power plant
demonstration projects which are currently underway in Japan.
EPODE17393 181
Japan
Long term policy goal and deregulation of power market
Japanese energy efficiency policy has a broad coverage in industry, buildings (i.e. commercial and
residential) and transport. After the initial establishment about 40 years ago, there have been
frequent revisions in the Energy Conservation Act. The Building Energy Conservation Act was added
in 2015 to cover the building envelope performance. Japan tries to avoid a complex legal structure
which is burdensome for energy consumers.
However, social and political needs are always changing. For instance, Japan must submit mid-
century long-term climate change strategy to UNFCCC by 2020. Discussions are in progress in the
Ministry of Environment and Ministry of Economy Trade and Industry. Energy efficiency improvement
is one of important energy policy package in the long-run. In addition, deregulation of the power
market is underway. Power retailers can propose a new tariff design to small scale customers from
2020. New tariffs would eventually accelerate energy efficiency improvements. Under this
competitive situation, universal service assurance and tariff design to accelerate energy savings are
major public issues and should be discussed.
Energy conservation of small scale businesses
Small scale business energy users are exempt from annual energy consumption reporting and energy
intensity compliance mandates in the current regulation institutions. We find that the increase in the
coverage is due to the energy conservation act revision in 2008, which treats a franchise chain like
convenience stores and restaurants also as single enterprises. Other incentive schemes such as
energy consumption diagnosis and advice with monitoring systems which are using information
databases would be an attractive policy package. It should be designed as a simple system to avoid
policy transaction cost.
Buildings: energy monitoring during utilisation phase
The building energy performance requirements, under the Building Energy Conservation Act, are
applied to new construction/extensions/renovations of buildings with a floor space area over certain
thresholds. Additional supporting measures should be provided for buildings with small floor space
and old vintage housing stocks. However, it is based on the design phase evaluation before the
completion of the building. Policies on energy monitoring with advice during the utilisation phase are
recommended because the building performance would be degraded compared to the initial condition
in the long-run.
Transport: autonomous driving with assistance of traffic and geographic information
Vehicle efficiency improvement and traffic management are the major current policy tools as stated
in the previous sections. In addition, autonomous driving may improve energy efficiency. We need
guidelines for autonomous driving especially in terms of safety concern. The establishment of

EPODE17393 182
guidelines and other institutions is necessary to expect an energy conservation effect accompanying
autonomous operation.
Business opportunities: Big data and market for energy saving values
Energy related data is being produced every day. Some data has been captured by monitoring
equipment such as smart meters and energy management systems. Autonomous driving in the future
would combine driving data and traffic data to assure driving function as a service. Future building
appliances can be controlled automatically via the automatic demand response request. We need to
establish the market system to exchange energy saving values. The system can be combined with an
energy trading system to ensure flexibility such as ancillary services of power supply.
7.2 Mutual learning opportunities
After highlighting the similarities and differences in WP2, it became apparent that mutual learning
opportunities exist. While Germany and Japan have a similar set-up of the industry sector with a
large share of energy intensive industry, it is interesting to note that the policy approaches diverge.
Germany has traditionally focused on voluntary approaches as well as tax exemptions and financial
support for industry. Commonly it is perceived that the Emissions Trading Scheme is the largest
energy and climate policy tool in the industry sector. The effects on energy efficiency are however
only of secondary nature and due to the low CO2 prices, the overall effect is limited. Japan on the
other side focuses on regulatory approaches and 90% of industries are regulated by the Energy
Conservation Act. The energy intensive industry even sets benchmark targets where the benchmark
is used as the target standard of the best performing companies (top 10%-20%) in each subsector.
Companies in these subsectors are subject to annual mandatory reporting on the status of their
performance. It should be analysed, whether benchmarks for the rational and efficient use of energy
in Germany could be for example integrated into the Bundesimissionsschutzgesetz (BImSchG).
Furthermore, a nationwide energy data base, which provides industry-specific and process-specific
data and information on energy consumption and mitigation techniques, should be established for
monitoring.
Another learning opportunity for Germany is the Japanese Top-Runner approach. Japan’s Top Runner
Programme, introduced in 1999, is a set of energy efficiency standards for energy intensive products,
such as home appliances and motor vehicles. As of 2017, the programme involves 31 product
categories. Products are included due to either their high energy or widespread use or their
substantial scope for improving energy efficiency. Energy efficiency targets are set to be achieved
within a given number of years on the basis of the most efficient model on the market (the ‘Top
Runner’). Over the years, the number of products covered has been continuously increasing.
Additionally, non-compliance with the standard is penalised with a ‘name and shame’ approach (peer
pressure), putting the brand image of companies at risk as opposed to their profit. Germany‘s
National Top Runner Initiative currently focuses more on sensitizing consumers and increasing
awareness about energy efficient appliances. Additionally, the initiative provides a platform for

EPODE17393 183
manufacturers exchange ideas for continuous improvement of energy efficiency. It could be beneficial
for Germany to implement energy efficiency targets that need to be achieved with the Top Runner
Initiative and to penalise non-compliance. This however, can only be done for types of products not
regulated by the EU’s Ecodesign requirements.
One of the learning points for Japan is related to building energy policy, although the Japanese
residential energy consumption per household may be smaller than that of Germany. Some sources
say that heating demand is about one-fifth compared to German household (Jyuukankyo Research
Institute 2013). On the other hand, Table 34 above seems to indicate that per capita energy demand
for buildings is even higher in Japan than in Germany. Heating equipment are operated partial and
intermitted operated for in Japan, while German system employs central heating system in most
cases; Germany could save energy by adopting the intermittent heating practices as in Japan, which
were also traditional in Germany in the past. Japan can learn from Germany in terms of long-history
large scale building envelope insulation policy and its mandated characteristics and high energy
performance levels. The same may be true for policies to stimulate energy-efficient refurbishment of
existing buildings.
On the other hand, it seems that Germany could learn from Japan in the transport sector, where
according to Table 34 per capita energy consumption is considerably lower in Japan.
Another learning point for Japan is the long-term view. The target year for the Japanese long-term
energy outlook is 2030, just after 13 years from now. On the contrary, Germany has a 2050 target
and intermediate targets of the ‘Energiewende’ and submitted 2050 national long-term strategies to
the UNFCCC. A long-term energy efficiency national strategy with quantitative targets is essential
because energy related infrastructure, such as urban planning with adequate building performance is
essential to achieve long-term energy efficiency goal.
7.3 Further need for research
Given the limited scope of this study, the present section identifies further need for research that
would help to deepen the mutual comparison.
The information on energy efficiency potentials varies between Germany and Japan and also within
sectors. More detailed studies about energy efficiency potentials in Japan will be beneficial and would
allow for a more detailed comparison between the two countries. Additionally, for Germany energy
efficiency potential studies for the timeframe 2050 are needed. This also includes studies analysing
the cost-effective saving potentials containing information on economic efficiency (e.g. Net
benefit/Cost curves of negawatts). Such cost curve data was last revised in 2011 in Germany. It
should be expanded to the multiple impacts of energy efficiency.
Further analysis is also needed to understand the differences in per capita energy consumption in
buildings between the two countries (cf. Table 34 and chapter 7.2). How much of the consumption

EPODE17393 184
and the differences is due to climate, energy performance levels of insulation and equipment,
operation and energy management, and to daily routines of building use? In order to be able to
distinguish, e.g., between the German Nearly-Zero- or Plus-energy-Standard and the Japanese Zero-
Energy house or building, more data is needed. The Japanese standards rely on a roof-mounted PV
powered by solar radiation, yet they fell short of prescribing sufficient insulation of the envelope,
because it was not a mandatory. The Japanese country report shows the high impact of the building
envelope either in the commercial sector or in the residential (about 50%). It would be helpful to
obtain more detailed information about the regional differences in climate and the specific data of
energy saving potentials in different house types after the completion of buildings. This is especially
true for the obligations that apply in Hokkaido, the northern island of Japan, which has similar
climatic conditions to Germany. Houses in Hokkaido have high insulation including double glazing and
other options. However, Japan is a very wide county from north to south. Building envelope efficiency
is defined by 8 zones. It is difficult to achieve ZEH conditions in Hokkaido, but examples exist. Most
climate zones require countermeasures for humidity, cold and heat simultaneously in the building
design. In Germany, high insulation with radiative heating is the simple answer for buildings and it is
relatively easy to achieve.
Similar in-depth analysis is needed to understand why Japan’s per capita energy consumption is
lower than Germany’s in the transport sector: How much is due to differences in travel/transport
distances, modal shares, and fuel efficiency of vehicles?
For a better understanding of the differences in energy service markets, a dedicated line-up by type
of services would provide insights why and in what services the German market has a higher
turnover. Current studies only look at the market size, while the total turnover of the Japanese
energy efficiency technology service market would be of interest.
Additionally, a more detailed assessment on the impact of existing and potential new or improved
energy policies is needed. This includes their impact on energy prices in both countries as well as the
role of energy prices as drivers for energy efficiency. While Germany exempts their energy intensive
industry from renewable energy levies, Japan does not have exemption for a feed-in tariff surcharge
in its power tariff. However, electricity prices remain competitive.
Furthermore, the impact of exchange rates on energy productivity will need to be studied. Final
energy consumption per capita in total and in industry similar in both countries. Energy productivity
in industry in Germany is higher than in Japan, though, which might be partly explained due to the
exchange rate.
In addition to an assessment of final energy efficiency, other potential future assessment methods
are currently being debated. In order to shift the perspective to the overarching target of
decarbonisation, valuation methods based on CO2 (t/(m2a)) based on energy consumption may be a
promising option. The Japanese buildings target is based on the primary energy consumption in
reference to a standard building. In the long-run, energy intensity will have to be reduced while the
net building energy consumption and CO2 emissions from buildings could be zero in both countries. In

EPODE17393 185
this respect, the German Federal Government is reviewing the creation of incentives for taking into
account the emissions generated during the production, construction and disposal of building
materials. This supports efforts to consider the entire lifecycle in assessing the effects of i.e.
appliances on climate change, rather than just taking into account the final or primary energy
consumption of the operation phase. In the German context, this is recognized in the assessment
systems for sustainable construction, including the BNB (Sustainable Building Assessment System),
the DGNB (Certificate of the German Sustainable Building Council), the BNK (Rating System for
sustainable small residential buildings) and the NaWoh (Sustainable housing for multi-family houses).
Life cycle assessments show that for very energy-efficient buildings, the energy used for the building
construction during the lifecycle is the greater share of the total energy consumption, especially in
the case of the “Nearly-Zero-Energy-Building” standard. The German Sustainable Building Council
(DGNB) calls for the introduction of a new assessment strategy of the environmental impact. The
introduction of a limitation on CO2 emissions is planned for the approval of new buildings in the
planned amendment of the EnEV / EEWärmeG. Such assessment methods should coexist with energy
parameters in order to reduce heating and cooling energy demand.

EPODE17393 186
8 Conclusion
This report has analysed the energy efficiency policies, potentials and barriers in Germany and Japan.
It has furthermore compared similarities and differences and outlined policy developments as well as
future research questions.
Energy efficiency is a strong pillar of the energy transition. In Germany, buildings (esp. heating) and
transport are addressed by national sectoral targets, yet an efficiency target is not in place for the
industrial sector. Energy efficiency measures in all sectors are derived from a whole array of
regulation and supporting measures. Different ministries including the Federal Ministry of Economic
Affairs and Energy, the Ministry for the Environment and the Ministry for Transport are involved in
the compilation of the policy mix. The regulation on the EU level adds another layer to the
governance framework and formulates efficiency targets as well as directives that have to be
implemented into national law. Additionally, national law must not introduce higher standards, for
example for the efficiency of appliances than EU law.
In Japan, there are two comprehensive main regulatory acts, namely the Energy Conservation Act
and the Buildings Energy Conservation Act. Similar to the German context, multiple ministries such
as the Ministry of Economy, Trade and Industry (METI), Ministry of Land, Infrastructure and
Transport (MLIT) are involved in the energy efficiency regulation. The industrial sector is subject to
mandatory efficiency requirements, which is not the case in Germany.
Germany still has considerable saving potentials in all end use sectors. Nevertheless, further policy
developments are needed to lever these potentials, reduce barriers and achieve the energy efficiency
targets.
Japan improved its energy efficiency in the past and further saving are expected, especially in
building sector. Economic incentives, manufacturing and selling of end-use energy equipment,
efficiency improvement of the building stock, the energy system infrastructure innovation and other
policy measures are an important policy portfolio to realize short to long-term energy efficiency
improvements in Japan.
This report has shown that Japan and Germany share similarities in energy efficiency potentials and
barriers while using different approaches to lever the potentials. Due to this, opportunities for mutual
learning were identified. However, these opportunities are somewhat limited by external
circumstances that are difficult to alter. This includes especially the governance level of the European
Union which steers German energy efficiency policy and cultural differences. Especially in the building
and transportation sector, energy saving opportunities largely depend on the urban area design.
Local governments also play important roles as well as the coordination between national
government, businesses and public. Stakeholder involvement is therefore essential in both countries
to accelerate an ‘energy-efficiency transformation’.
EPODE17393 187
9 Sources
ANRE (2017): Energy White Paper 2017, Agency of Natural Resources and Energy (in Japanese).
AGEB (2016a): Anwendungsbilanzen für die Endenergiesektoren in Deutschland in den Jahren 2013
bis 2015.
AGEB (2016b): Ausgewählte Effizienzindikatoren zur Energiebilanz Deutschland.
BMWi (2017): Energieeffizienz in Zahlen. URL:
http://www.bmwi.de/Redaktion/DE/Publikationen/Energie/energieeffizienz-in-
zahlen.pdf?__blob=publicationFile&v=10
Destatis (2015): Federal Statistical Office Database. URL:
https://www.destatis.de/EN/FactsFigures/SocietyState/Population/CurrentPopulation/Tables/Census_
SexAndCitizenship.html;jsessionid=99F93FBE2BDAF8B1E198458881C25F7D.cae1.
Ecofys, ifeu, Wuppertal Institut (2017): Weiterentwicklung der Energieeffizienzpolitiken zur
Erreichung der Klimaschutzziele der Europäischen Union bis 2050. On behalf of the Germany Federal
Environment Agency.
EGC (2017): Status of power market competition, Electricity and Gas Market Surveillance
Commission, Ministry of Economy, Trade and Industry, April 5 2017,
http://www.emsc.meti.go.jp/activity/emsc/pdf/077_03_02.pdf (in Japanese)
Eurostat (2016): Household Composition Statistics. URL: http://ec.europa.eu/eurostat/statistics-
explained/index.php/Household_composition_statistics.
IEEJ (2017): EDMC Handbook of Japan's & World Energy & Economic Statistics 2017, Energy Data
and Modelling Center, Institute of Energy Economics Japan, February 2017 (in Japanese).
JAMA (2016): Japan Automobile Manufactures Association. Motor vehicle statistics of Japan 2016.
URL: http://www.jama.org/wp-content/uploads/2016/11/mvs2016.pdf
Juukankyo Research Institute (2013): Home Energy Handbook (in Japanese)
Jyuukankyo Research Institute (2014): Energy saving potential of ESCO business in commercial
ssector, February 2014, Ministry of Economy, Trade and Industry web page,
http://www.meti.go.jp/meti_lib/report/2014fy/E004386.pdf (in Japanese)
EPODE17393 188
Landesamt für Statistik Niedersachsen (2014): Gebäude- und Wohnungsbestand in
Deutschland.
Market Watch (2015): Energy Efficiency. http://international.legambiente.it/news/market-watch-
issues-the-report-on-energy-efficiency.
METI (2016): Census of Manufactures 2016, Ministry of Economy, Trade and Industry (in Japanese)
Statista (2017): Kraftfahrzeug-Bestand in Deutschland von 2005 bis 2017 (in Millionen) URL:
https://de.statista.com/statistik/daten/studie/1837/umfrage/kfz-bestand-in-deutschland/
Statistics Bureau (2016a): 2015 Population Census, Statistics Bureau, Ministry of Internal Affairs
and Communications (in Japanese)
Statistics Bureau (2016b): 2015 Housing, Statistics Bureau, Ministry of Internal Affairs and
Communications (in Japanese)
VCD (2015): Die Modellentwicklung in der deutschen Autoindustrie: Gewicht contra Effizienz. URL:
https://www.vcd.org/fileadmin/user_upload/Redaktion/Publikationsdatenbank/Auto_Umwelt/Gutacht
en_Modellentwicklung_deutsche_Autoindustrie_2015.pdf.
World Bank (2017a): World Bank Database, http://data.worldbank.org/country/Japan
World Bank (2017b): World Bank Database, http://data.worldbank.org/country/Germany
World Economic Forum (2016): The Global Information Technology Report 2016. URL:
http://www3.weforum.org/docs/GITR2016/GITR_2016_full%20report_final.pdf.

ECOFYS Germany GmbH | Albrechtstraße 10 c | 10117 Berlin | T +49 (0)30 29773579-0 | F +49 (0)30 29773579-99 | E [email protected] | I www.ecofys.com

ECOFYS Germany GmbH
Albrechtstraße 10 c
10117 Berlin
T: +49 (0) 30 29773579-0
F: +49 (0) 30 29773579-99
I: www.ecofys.com