give a summer for school b_20150507
TRANSCRIPT
GIVE A SUMMER FOR SCHOOL BAnalysis of the summer participation, future summer plans, and barriers to summer programs for a Boston area middle school’s students (grades 6 – 8) and areas for action.
Prepared by Give a [email protected]
May 2015
2
Background on report
• This is the public version of a report prepared by Give a Summer for a Boston area middle school analyzing the summer participation, future plans, and barriers facing their middle school students. The school is referenced throughout the report as “school B.”
• Give a Summer worked with three peer schools, and when relevant, noted differences between the schools. The other two schools are noted as “school A” and “school C.”
• With all three schools’ approval, Give a Summer is releasing public versions of the three school reports as further examples of how communities can better understand and support youth participation in summer opportunities.
• Give a Summer believes that getting communities to collect and analyze data about where and why kids miss out on summer programs will:
• improve youth access to summer programs by broadly identifying high-need areas and barriers to summer program participation
• empower youth-serving organizations, such as schools and mentoring organizations, to more effectively target and support individual students to make great summer plans
• strengthen advocacy efforts by clarifying the need for opportunities• increase public accountability for improvement

3
Outline of presentation
• Executive Summary• Findings: Previous summer participation• Findings: Previous summer enjoyment• Findings: Upcoming summer plans• Findings: Interest by type of program• Findings: Barriers to summer participation• Areas for action• Areas for investigation• Appendix
Slide #
4
7
8
8
11
14
19
21
22

4
Executive summary: key facts
Past attendance: 50% of students attended a program last summer, with participation consistent across grades and in-line with the three schools as a whole.
Satisfaction: Students enjoy their programs: about 70% of students rated their program a 4 or 5 (out of 5), with about 40% giving it a 5. 6 th graders had lower satisfaction compared to other grades and the two other schools.
Future plans: Students have strong interest in attending a program, with 50% interested and another 30% not sure. 6th graders only have 40% interested, trialing other grades and the three schools as a whole
Types of summer programs: Students are well matched with programs: the types of programs students attend are similar to the types of programs they want to go to, though far fewer students attend overnight camps compared with the number that want to.
Barriers: The two biggest barriers to summer participation are i) family vacation conflicts and ii) lack of interest in summer program options. Additionally, being needed at home stood out as a large relative barriers between students who did and did not attend a program last year. Program expense and transportation challenges were particularly big deals for 6 th graders, but otherwise barriers were the same across the grades and similar to the three schools overall.
5
Executive summary: key actions
Highlight programs that have flexible schedules to accommodate family vacation plans: This was a big deal to more than 40% of students and by a good margin, the biggest barrier to participation, both for students who want to attend a program this summer and for students who are not sure.
Lack of interest in program options matters, but can be solved. This was the 2nd largest barrier and a differentiator between students who did and did not attend a program last year. Yet students who reported a lack of programs that interest them have nearly the same program interests as students who went to programs last year or who want to go to a program this summer. One approach is to recommend to students unexcited by their options some of the great programs students have previously enjoyed.
Personalize support to students interested in attending but who didn’t last year or who are unsure about attending but only have one or two ‘big deal’ barriers. 18 students fall into the first category and 19 more students are in the second group. Personal outreach to these students could be particularly effective to help them access summer opportunities.
Use student-level data on barriers to effectively connect students with programs that match their interests and needs. The accompanying Excel file has student-level data on past and upcoming attendance, interest in different types of programs, as well as student ratings of summer program barriers to help effectively and efficiently connect students with summer programs that match their needs.
Note: Excel file not included with this public report
6
Executive summary: key questionsWhat are parent perspectives on barriers to summer program participation?• Impact: improve efforts to expand summer access by incorporating influential parent perspective
When and for how long do families take vacations?• Depending on when and for how long families take vacations, there are different ways to best
support summer opportunities for students: highlighting programs in July for families that take August vacations or recommending week by week programs for families that travel in July.
• Impact: better target communication and suggestions to students’ and families’ needs.
How do students’ plans for summer participation compare to their actual summer participation?• Knowing how well students’ plans for the summer match their outcomes would inform how much do
you want to concentrate on students who are not sure of their plans vs. working more broadly with all students.
• Impact: more effectively help students access summer opportunities
Why are students needed at home over the summer?• This was a major relative barrier between students who did and did not attend. Understanding the
reasons why students are needed at home is crucial to effectively helping students find programs that work around this barrier for students.
Why did 6th graders not enjoy their programs as much?

7
Findings: summer program participation• Overall participation of 50% is consistent across grades and in line with the three
schools as a whole.
Did you attend a summer program last summer?

8
Findings: summer program enjoyment• Students enjoy their programs, with 70% rating it a 5 or 4 (out of 5) and an average score of
3.9. • Lower 6th grade satisfaction: Only 24% of 6th graders rated their program a 5, well below other
grades at school B. The 6th grade average score of 3.6 was below the three-school 6 th grade average of 4.0, though much closer to school A’s satisfaction score of 3.8.
Did you enjoy the program? (5 is yes, 1 is no)

9
Findings: upcoming summer plans• Students have a strong interest in attending a summer program, with 50% interested and another
30% on the fence. Interest is a little below the three school average. • 6th graders have slightly less interest in participating in programs, consistent with their lower
satisfaction with programs last summer.• Student interest was similar to school A though somewhat behind school C.
Do you want to attend a summer program this coming summer?

10
Findings: upcoming summer plans vs. previous participation
• Student interest in attending a program this summer outpaces their attendance at programs last summer.
• This suggests that very few students who are unsure about attending a program eventually make it to one and is behind Give a Summer’s recommendation to focus efforts on these students.

11
Findings: types of programs students attend and want to attend
• Overall, students are well matched with the programs they attend: The types of programs that students went to last year and that students are interested in for this summer are similar.
• The major exception is ‘Overnight camps’ -> Action: highlight more overnight programs to students• Notably, for students who are unsure about attending a program this summer, they are interested in
similar programs to the types of programs that students have previously attended• Action: recommending those programs can help unsure students find programs that interest them.• Action: Hook students not interested in attending programs with sports programs. This was the only
type of program these students were interested in.
What do students do over the summer and what do they want to do?(students grouped by interest in attending a program this summer)
12
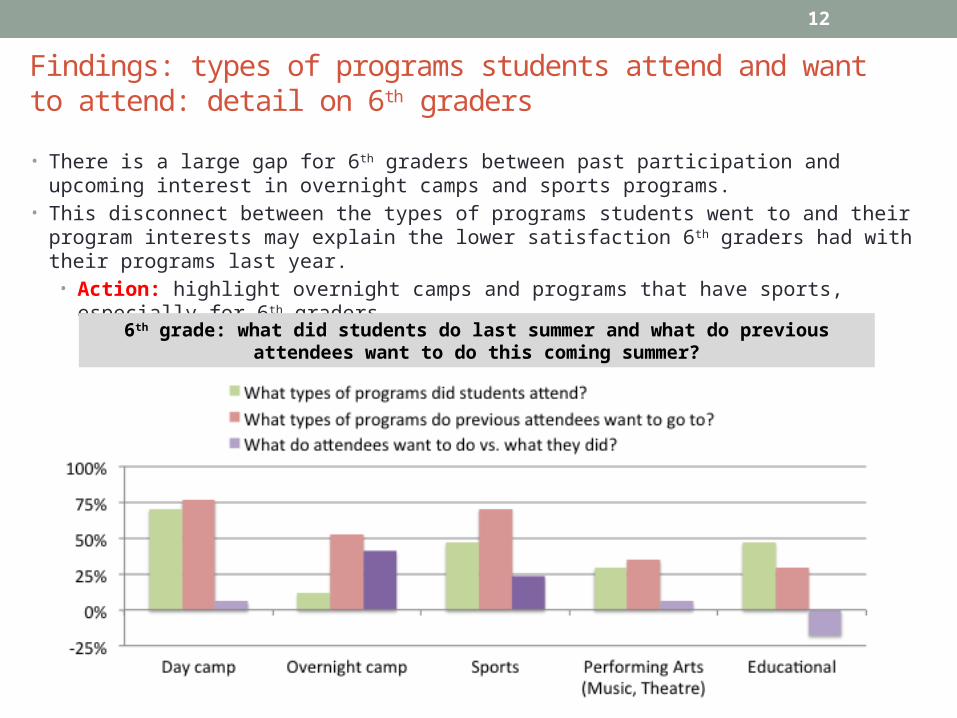
Findings: types of programs students attend and want to attend: detail on 6th graders
• There is a large gap for 6th graders between past participation and upcoming interest in overnight camps and sports programs.
• This disconnect between the types of programs students went to and their program interests may explain the lower satisfaction 6th graders had with their programs last year.
• Action: highlight overnight camps and programs that have sports, especially for 6 th graders
6th grade: what did students do last summer and what do previous attendees want to do this coming summer?

13
Findings: types of programs students attended for whom program-related barriers were a big deal• There is not that much of a difference between the types of programs all students attend and the
types of programs students who reported large program-related barriers attend. This suggests that the types of programs (day camp, overnight camp, etc. ) you recommend do not need to be tailored to students who reported large program-related barriers. • Still need to highlight the particular programs that avoid students’ barriers by being low cost or
offering free transportation, etc.
Did students with program-related barriers encounter them at particular types of programs last year?

14
Findings: description of different barriers
• Students were asked to rate how important various potential barriers were to participating in summer programs.
• Below, the text of those barriers is presented and barriers are grouped into categories.
• Students rated barriers as a “Big deal”, “Small deal”, or “Does not apply”• Those descriptions were converted to scores: “Big deal” is a 2, “Small deal” is
1, “Does not apply” is 0

15
Findings: barriers to summer participation
• “Conflict with family vacation” was the largest barrier to summer program participation, with lack of interest and lack of excitement about summer options close behind.
• Expense of programs, transportation, and childcare responsibilities at home were also sizable barriers.
• The impact of each barrier is lowest on 8 th graders, highest on 6th graders (see appendix). • Ratings were very similar to the three school average.
16
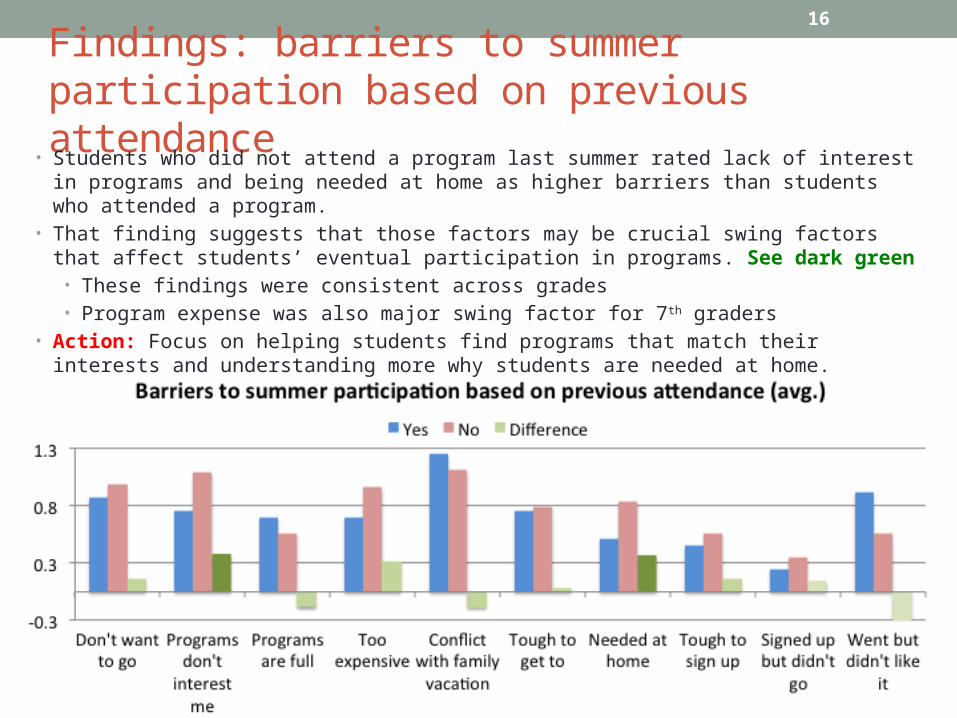
Findings: barriers to summer participation based on previous attendance
• Students who did not attend a program last summer rated lack of interest in programs and being needed at home as higher barriers than students who attended a program.
• That finding suggests that those factors may be crucial swing factors that affect students’ eventual participation in programs. See dark green
• These findings were consistent across grades• Program expense was also major swing factor for 7 th graders
• Action: Focus on helping students find programs that match their interests and understanding more why students are needed at home.

17
Findings: barriers to summer participation based on upcoming interest
• Students who are unsure about attending programs rated lack of interest in options and conflicts with family vacations as larger barriers than students did who are interested in attending programs, suggesting that these barriers – and not just other external factors such as parent support – are shaping student decision-making.
• Action: To help students who are unsure about attending a programs, this data suggests especially working with them to find programs that match their interests and that have schedules that do not conflict with family vacations.
18
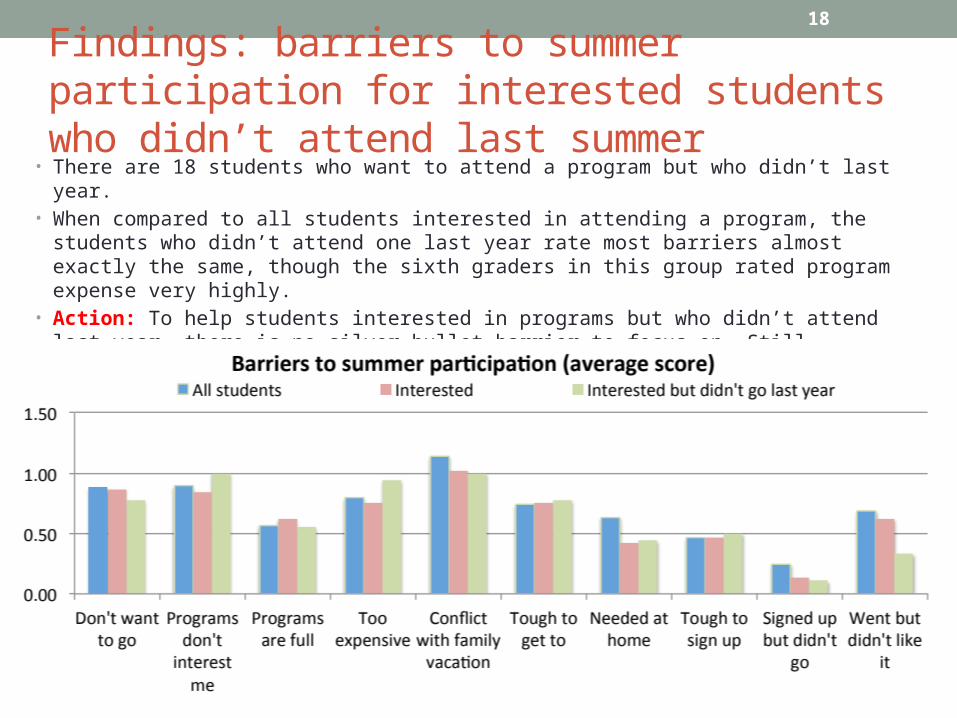
Findings: barriers to summer participation for interested students who didn’t attend last summer
• There are 18 students who want to attend a program but who didn’t last year. • When compared to all students interested in attending a program, the students who didn’t attend
one last year rate most barriers almost exactly the same, though the sixth graders in this group rated program expense very highly.
• Action: To help students interested in programs but who didn’t attend last year, there is no silver bullet barrier to focus on. Still, personalized support for these students might be particularly effective given students’ interest in attending a program but non-attendance last summer.

19
Areas for action: general
Highlight programs that have flexible schedules to accommodate family vacation plans: In addition to lack of interest in program options, this was the biggest barriers to participation, both for students who want to attend a program this summer and for students who are not sure. • Action: Find and highlight programs that have week-by-week schedules• Action: Find and highlight programs that are daily, such as these run by BCYF
Lack of interest in program options matters, but can be solved. This was the 2nd largest barrier and a differentiator between students who did and did not attend a program last year. Yet students who reported a lack of programs that interest them have nearly the same program interests as students who went to programs last year or who want to go to a program this summer.• Action: recommend to students unexcited by their options some of the great programs students
have previously enjoyed. • Action: highlight—especially to 6th graders—overnight programs which students are interested in
but rarely get to attend.• Action: for students uninterested in programs, recommend sports programs, the one type of
program these students they are strongly interested in.

20
Areas for action: student specific
Two groups of students seem like promising ones to focus personalized support on:• 1) Want to attend but didn’t last year: 18 students across school B fall into this
category which seems a promising area to focus individual attention on. No barriers stand out for these students compared to their peers.
• 2) Not sure of attending but only have one or two big deal obstacles: this applies to 19 students and is another promising group of students to support with individualized help. See the accompanying Excel for more information on these students.
Use student-level data on barriers to effectively connect students (and families) with programs that match their needs. The attached Excel file has student-level data on attendance and summer program barriers to help effectively and efficiently connect students with summer programs that match their needs. • Action: Use data to best match students with programs visiting school.• Action: Share “top students to focus on” with each homeroom teacher.
Note: Excel file not included with this public report

21
Areas for investigation
What are parent perspectives on barriers to summer program participation?• For example, students don’t rate difficulty signing up for programs as that big a deal, though teachers often
describe this as a big challenge. What do parents think? • Impact: improve efforts to expand summer access by incorporating influential parent perspective
When and for how long do families take vacations?• Depending on when and for how long families take vacations, there are different ways to best support
summer opportunities for students: highlighting programs in July for families that take August vacations or recommending week by week programs for families that travel in July.
• Impact: better target communication and suggestions to students’ and families’ needs.
How do students’ plans for summer participation compare to their actual summer participation?• Knowing how well students’ plans for the summer match their outcomes would inform how much do you
want to concentrate on students who are not sure of their plans vs. working more equally with all students. • Impact: more effectively help students access summer opportunities
Why are students needed at home over the summer?• This was a major relative barrier between students who did and did not attend. • Impact: crucial to effectively problem-solving for this barrier.
Why did 6th graders not enjoy their programs as much? • Impact: help 6th graders enjoy their programs more
22
Appendix
• Methodology and response rates• Length of program attendance• Distribution of barrier ratings• Barrier ratings by grade• Findings from student comments
Slide #
23
24
25
26
27
23
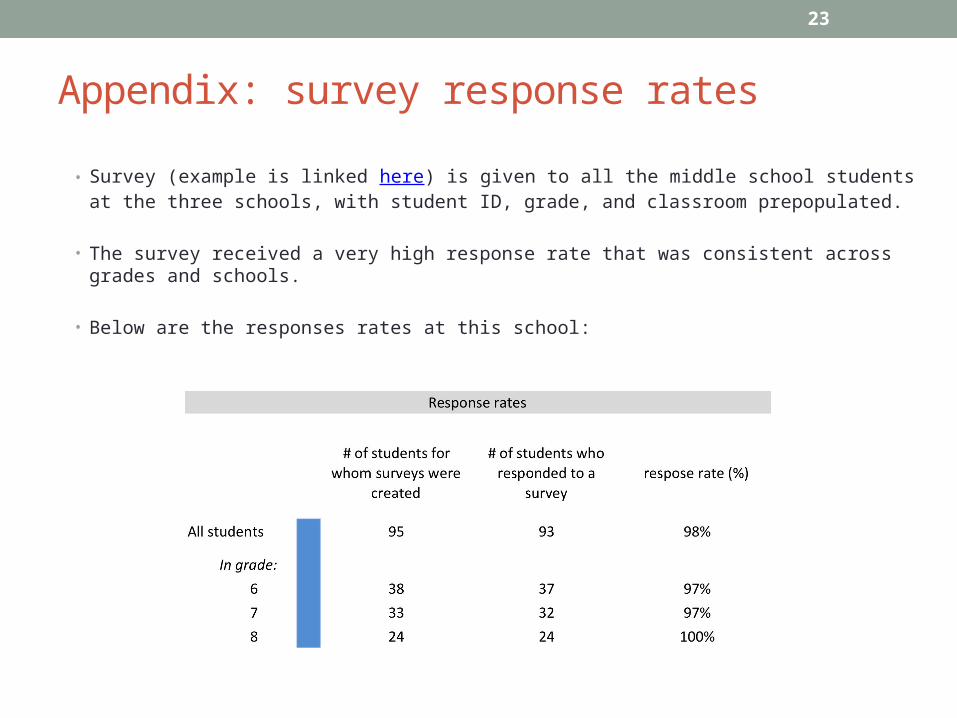
Appendix: survey response rates
• Survey (example is linked here) is given to all the middle school students at the three schools, with student ID, grade, and classroom prepopulated.
• The survey received a very high response rate that was consistent across grades and schools.
• Below are the responses rates at this school:
24
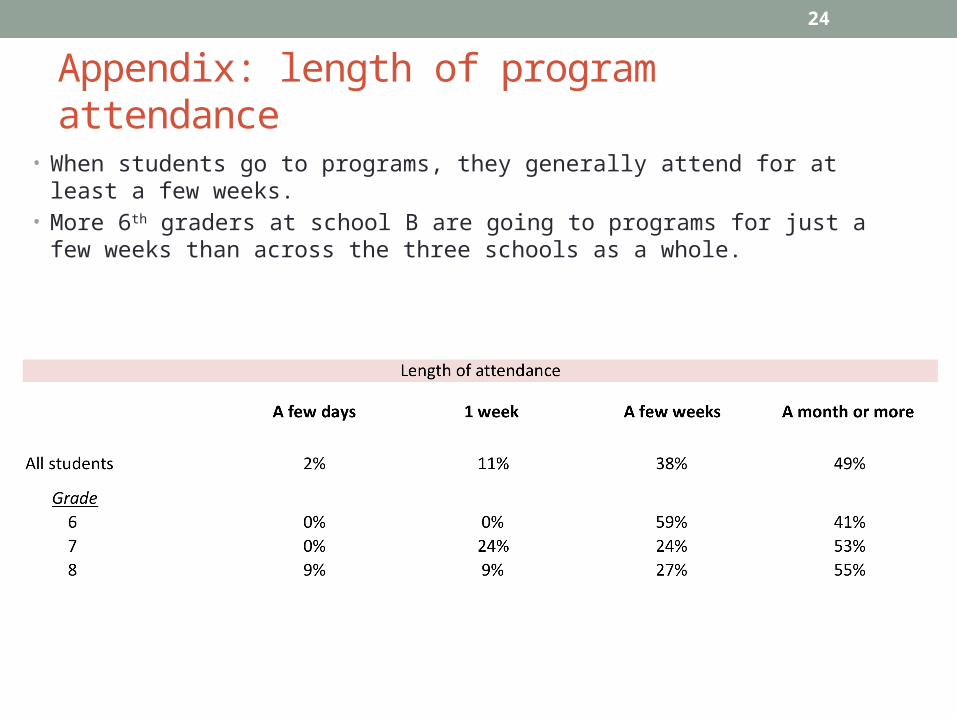
Appendix: length of program attendance
• When students go to programs, they generally attend for at least a few weeks. • More 6th graders at school B are going to programs for just a few weeks than across
the three schools as a whole.
25
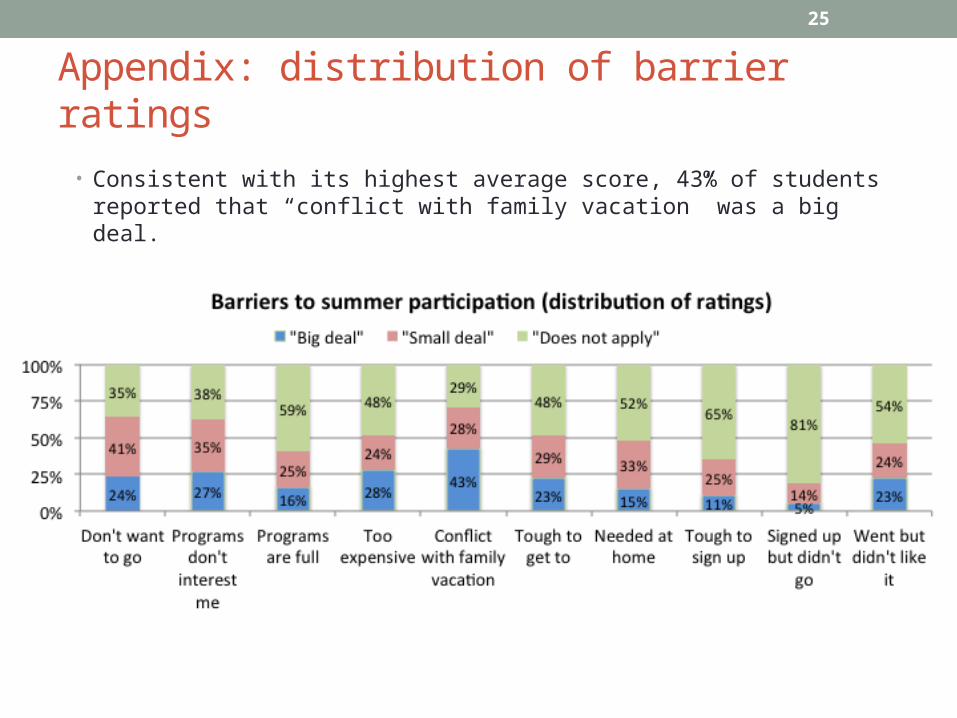
Appendix: distribution of barrier ratings
• Consistent with its highest average score, 43% of students reported that “conflict with family vacation” was a big deal.
26
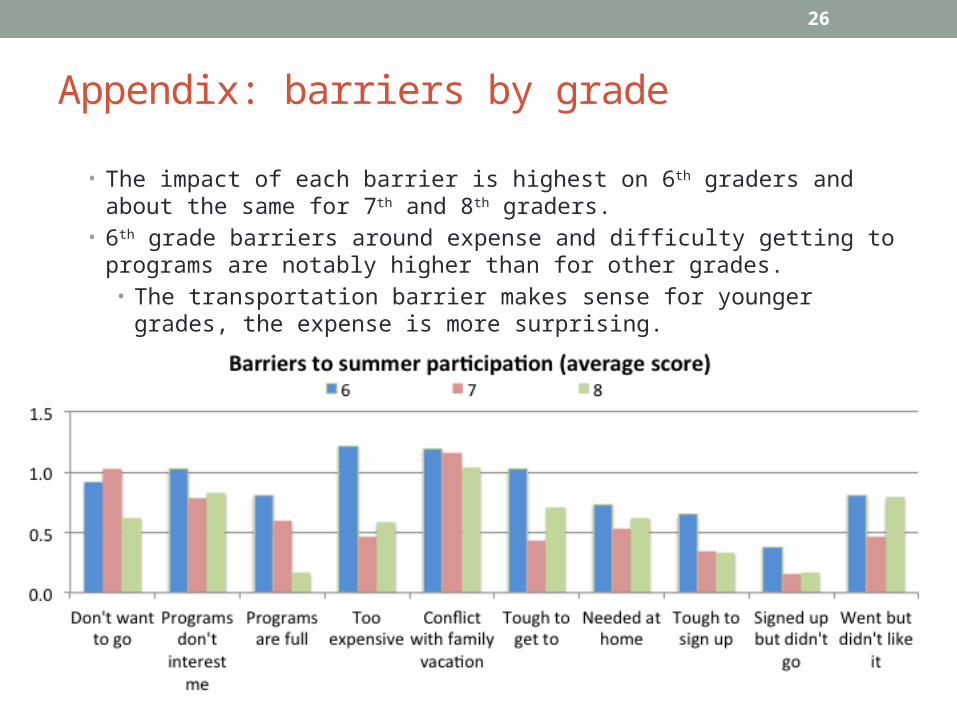
Appendix: barriers by grade
• The impact of each barrier is highest on 6th graders and about the same for 7th and 8th graders.
• 6th grade barriers around expense and difficulty getting to programs are notably higher than for other grades. • The transportation barrier makes sense for younger grades, the expense is
more surprising.

27
Appendix: breakdown of additional student comments
• Student comments reveal diversity of student concerns and preferences
• Family vacation conflicts was the most frequent comment by far