gis site suitability analysis for developing a vineyard in sonoma county, ca...
TRANSCRIPT
GIS Site Suitability Analysis for developing a
vineyard in Sonoma County, CA
____________________________
David JaquetRaster GIS & Modeling (32-
630-01)Fall 2005
Motivation
• Sonoma County is one of the two best producing wine regions of the north central coast of California.
• I am interested in visualizing the criteria matrix needed for correctly choosing a potential land development for a vineyard, I may want to develop a vineyard in the future.

Study Area
Sonoma County, CA wine regions (Appellations)

Research Objectives
• This GIS suitability model analyzes potential suitable land for creating a vineyard in Sonoma County, CA.
• The model has both descriptive and prescriptive components as it describes various suitability criteria themes within Sonoma County and uses these criteria themes in a matrix to prescribe where a vineyard should be developed to be successful.

Methodology The physiographic criteria were chosen from a variety of web sources. These
criteria can determine optimal land parcel characteristics for developing a successful vineyard.
Dataset Primary Derived Criteria Primary Raster Analysis Parameters
Regional 30m 7.5' x 7.5' DEM 1:24,000 dataset
Sonoma County Slope 5% ≤ Slope ≤ 35%; reclass 1 category
Sonoma County Aspect 112° ≤ Aspect ≤ 337°; reclass 1 category
Sonoma County Elevation 0 m ≤ Elevation ≤ 800 m; reclass 1 category
California Counties dataset Sonoma county Select Sonoma Co., make new layer
California Land use dataset Sonoma County agriculture land Select all agriculture land in Sonoma County
California Hydrography dataset Sonoma County hydro features Select hydro features in Sonoma County; reclass 1 category
Distance buffer from hydro source Raster Dist. buffer 0-100 m bad fit, 100+ m good fit; reclass with 2 categories
Sonoma County soils dataset Soil constituents suitable for vineyards in Sonoma County
Chemicals/organic constituents suitable for vineyards in Sonoma County
Existing vineyards survey (1997) Vineyards surveyed in 1997 in Sonoma County
Feature to raster; reclass to 1 category.
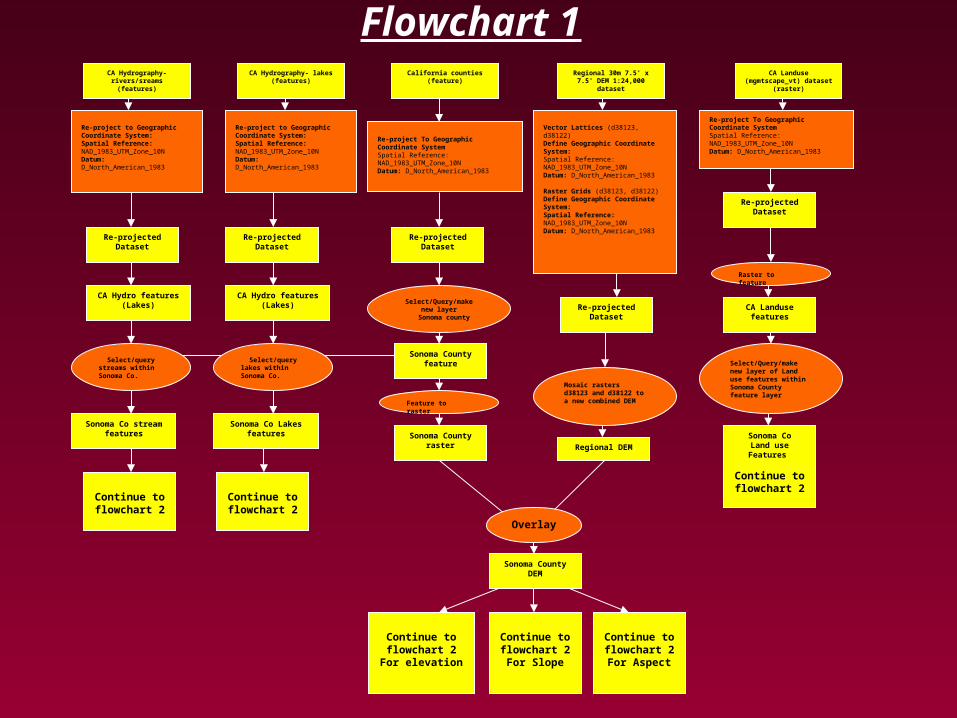
Flowchart 1
Re-project To Geographic Coordinate SystemSpatial Reference: NAD_1983_UTM_Zone_10NDatum: D_North_American_1983
Re-project to Geographic Coordinate System:Spatial Reference: NAD_1983_UTM_Zone_10NDatum: D_North_American_1983
Vector Lattices (d38123, d38122)Define Geographic Coordinate System:Spatial Reference: NAD_1983_UTM_Zone_10NDatum: D_North_American_1983
Raster Grids (d38123, d38122)Define Geographic Coordinate System:Spatial Reference: NAD_1983_UTM_Zone_10NDatum: D_North_American_1983
Re-project To Geographic Coordinate SystemSpatial Reference: NAD_1983_UTM_Zone_10NDatum: D_North_American_1983
Select/Query/make new layer
Sonoma county
Raster to feature
CA Landusefeatures
Select/Query/make new layer of Land use features within Sonoma County feature layer
Sonoma CoLand use Features
Continue to flowchart 2
Mosaic rasters d38123 and d38122 to a new combined DEM
Overlay
Regional DEM
Sonoma County DEM
Continue to flowchart 2
For elevation
Continue to flowchart 2For Slope
Continue to flowchart 2For Aspect
CA Hydro features(Lakes)
Sonoma Countyfeature
Sonoma Countyraster
Sonoma Co stream features
Continue to flowchart 2
Feature to raster
CA Landuse (mgmtscape_vt) dataset (raster)
Regional 30m 7.5' x 7.5' DEM 1:24,000
dataset
California counties (feature)
CA Hydrography-rivers/sreams
(features)
Re-projectedDataset
Re-projectedDataset
Re-projectedDataset
Re-projectedDataset
Select/querystreams within Sonoma Co.
CA Hydrography- lakes (features)
Re-project to Geographic Coordinate System:Spatial Reference: NAD_1983_UTM_Zone_10NDatum: D_North_American_1983
Re-projectedDataset
CA Hydro features(Lakes)
Select/querylakes within Sonoma Co.
Sonoma Co Lakes features
Continue to flowchart 2

Flowchart 2
0-100 m
Calculate Slope Grid (Raster)
Slope Grid
Calculate 5≤[slope]≤35
Sonoma Co DEM Sonoma Co DEM
Calculate Aspect Grid
DEM
Aspect Grid
Aspect Grid“Good Aspect”
“Good Topo”Grid
Land suitable for developing a successful vineyard !
(Raster)
Feature to raster
StreamGrid
Reclass grid 1 cat
Sonoma Co stream
features
StreamGrid
Create Buffer: Max distance 1000m
Reclass Buffer distance 2 categories
100-1000m
Hydro bufferedGrid
Slope Grid“Good Slope”
Sonoma Co DEM
Calculate elevatin
0≤[DEM]≤800
Elevation Grid“Good Elevation”
Sonoma Co Landuse features
Select/Query Agriculture
landuse
Sonoma CoAgriculture land
features
Feature to raster
Hydro bufferedGrid – 2 categories0-100m ‘bad fit’ and 100m+
‘good fit’
Sonoma Co lakes
features
Feature to raster
StreamGrid
Reclass grid 1 cat
Overlay
HydroGrid
Overlay
Select/Query vineyard
suitable soils
“Good Soil” Feature
Feature to raster
“Good Soil” raster
Lake Grid
Sonoma Co Soils features
Overlay
“Aggie land” raster
“Aggie land” raster
Overlay
“Good surface” raster
OverlayLand suitability for vineyard development within 100m+ buffer zone ‘good fit’
Calculate112≤[Aspect]≤337

Flowchart 3 - Test
Existing Vineyards (1997) features
Existing Vineyards (1997) raster
Overlay
Result: 23854 of Land suitability for vineyard development patches out of 80612 or 29.5% overlapped with Existingnvineyards (1997) – raster
Feature to raster
Raster to feature
Select by location all Potential land for
vineyard development – features that are
crossed by the outline of Existing vineyards
(1997) – features
Existing Vineyards (1997) features
Potential land suitable for developing a
successful vineyard !feature
Potential land suitable for developing a
successful vineyard ! (Raster)
Potential land suitable for developing a
successful vineyard !(Raster)
Select by attribute Suitable values
Value 1
New layer of suitable features
Result: 771 Potential land for vineyarddevelopment – features out of 2640 or
29.2% were crossed by the outline of Existing vineyards (1997) – features
Select by location all Existing vineyards
(1997) – features that are crossed by the outline of Potential land for vineyard
development – features
Result: 1078 Existing vineyards (1997) – features out of 3036 or 35.5% were crossed by the outline of Potential land for vineyard development – features.
Vector Final Analysis Raster Final Analysis
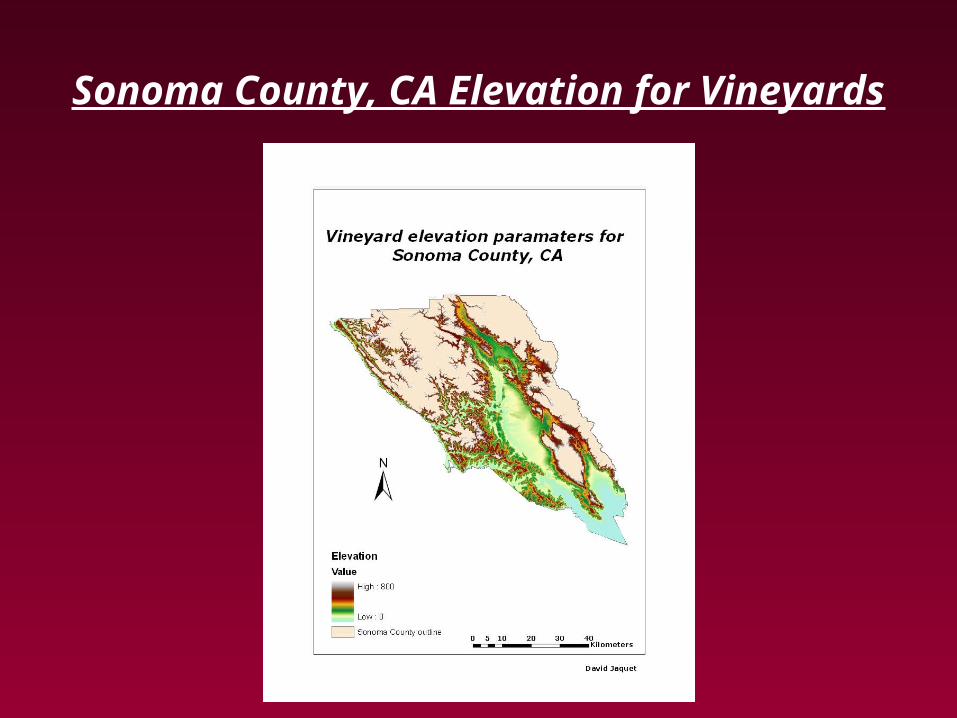
Sonoma County, CA Elevation for Vineyards
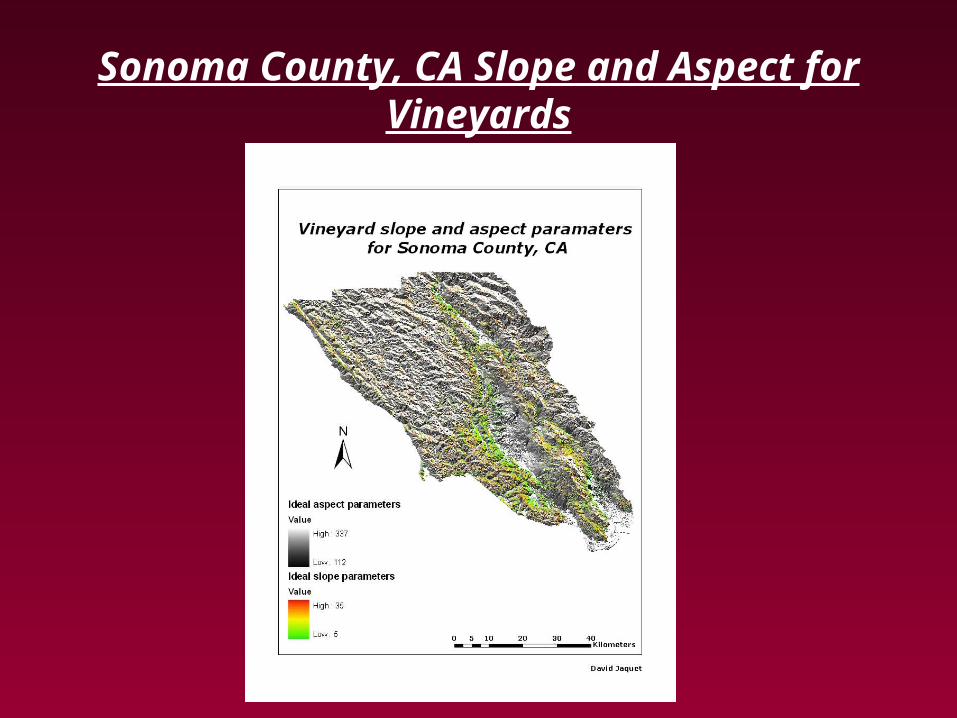
Sonoma County, CA Slope and Aspect for Vineyards

Buffer zones from water source and surface to identify potential land

Potential suitable land for Vineyard development
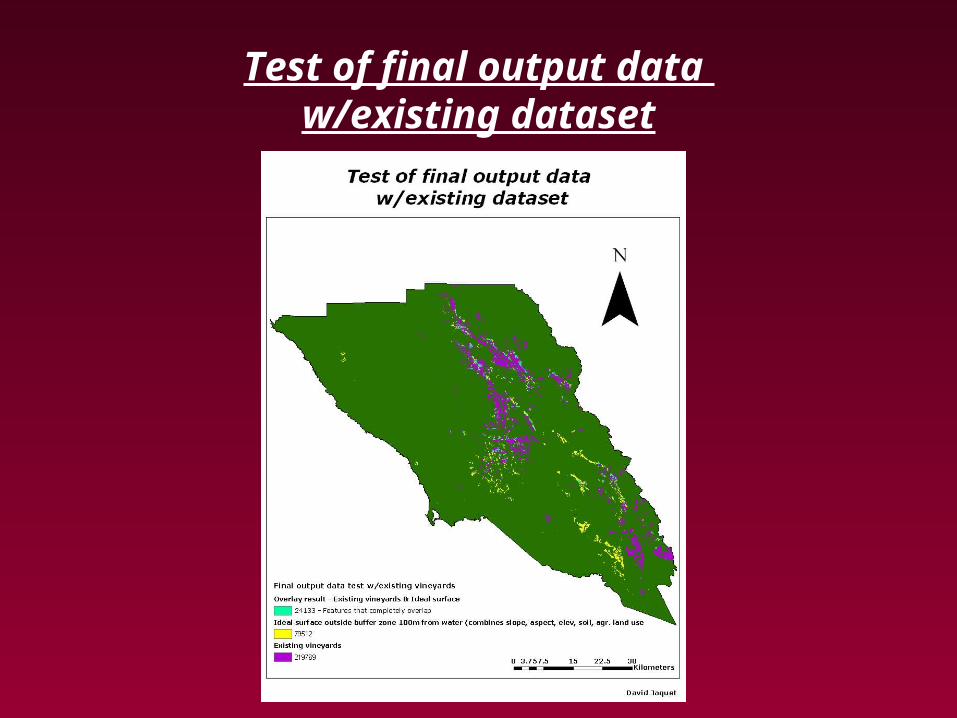
Test of final output data w/existing dataset
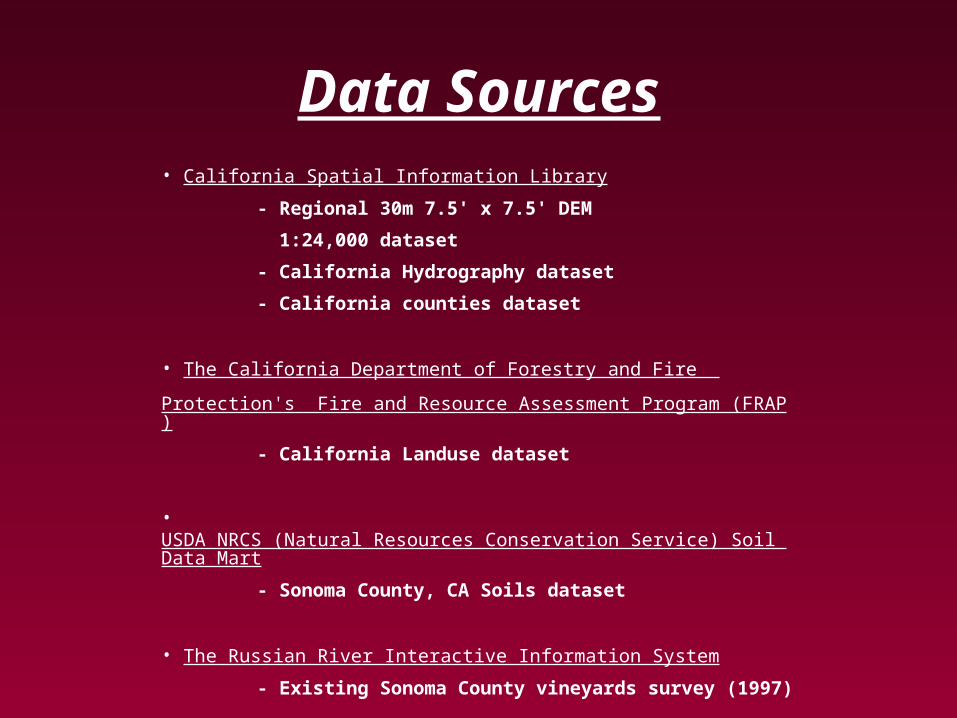
Data Sources• California Spatial Information Library
- Regional 30m 7.5' x 7.5' DEM
1:24,000 dataset
- California Hydrography dataset
- California counties dataset
• The California Department of Forestry and Fire
Protection's Fire and Resource Assessment Program (FRAP)
- California Landuse dataset
• USDA NRCS (Natural Resources Conservation Service) Soil Data Mart
- Sonoma County, CA Soils dataset
• The Russian River Interactive Information System
- Existing Sonoma County vineyards survey (1997)

Analysis Results• Feature to raster Convert Existing vineyards (1997) -features dataset to a raster: Existing vineyards (1997) - raster
• Overlay Land suitability for vineyard development with Existing vineyards (1997) – raster [Land suitability for vineyard development] & [Existing vineyards (1997) – raster] Result: 23854 of Land suitability for vineyard development patches out of 80612 or 29.5% overlapped with Existing vineyards (1997) – raster.
• I also did a vector analysis out of curiosity: Raster to features Convert Land suitability for vineyard development to polygon features: Land suitability for vineyard development – feature yielded (1 - suitable, 0 -unsuitable)
• Select by attributes all Land suitability for vineyard development – feature that are suitable (have a value of one)
• Make new layer of selected features: Potential land for vineyard development – feature
• Select by location all Potential land for vineyard development – features that are crossed by the outline of Existing vineyards (1997) – features
Result: 771 Potential land for vineyard development – features out of 2640 or 29.2% were crossed by the outline of Existing vineyards (1997) – features
• Select by location all Existing vineyards (1997) – features that are crossed by the outline of Potential land for vineyard development – features
Result: 1078 Existing vineyards (1997) – features out of 3036 or 35.5% were crossed by the outline of Potential land for vineyard development – features.

Challenges
Difficulties I encountered during the modeling process (and glad I learned!) were how to define and re-project geographic coordinate systems for consistent map analysis between datasets, having to figure out how to combine two DEMs by performing a mosaic. Also a challenge at times was carefully implementing map algebra statements in the raster calculator. An extra space or layer name dash in a conditional statement would yield errors, and outputs with no values. Though I conclude that my model did not pass the validation test when compared to the existing vineyards dataset with the resulting percentages above, this was a great learning experience, from searching for datasets to using map algebra.

Limitation of model
• I do not have expert knowledge in the viticulture field. Upon searching for data I came across companies whose professional services are focused on using GIS for developing vineyards with soil scientists on staff for conducting private soil surveys, and also viticulture scientists for cutting edge wine growing techniques and technologies. It is a well developed industry.
• Coming across current data is difficult, for example land use data, and I can also imagine that more vineyards have been developed since 1997.
• Certain datasets are not available or are for purchase, such as climatic data for regional wind data and regional temperatures.
Future Improvements
• Conduct interviews with vineyard developers for more criteria parameters and maybe more current datasets.
• Research on using geostatistical techniques to obtain more precise results and
maybe obtain more relevant results.