gis mapping in the geodemographic studies (case study …€¦ · 220 the characteristic feature of...
TRANSCRIPT

219
Hungarian Geographical Bulletin 61 (3) (2012) 219–236.
GIS mapping in the geodemographic studies (Case study of the Republic of Belarus)
Ekaterina ANTIPOVA1, Liudmila FAKEYEVA1 and Aliaksandr KAROBKIN2
Abstract
The work deals with the options of using geoinformational technologies in the population geography as exemplifi ed by the GIS-models of the rural population of the Republic of Belarus (RB). The methods to create GIS-model with a brief characteristic of the stages are presented. The comparative analysis of two methods of mapping of the relative de-mographic values (colour scales and map-image transformation) is conducted. Technical and practical aspects of the map-image transfor mation method in geodemography are considered in the fi rst part of the article.
Trends of dynamics of rural population size for the period of 1959–2009 years are detected and characterized in the second part of the article. Spatial patt erns were identifi ed in accordance with these trends of the rural population of the RB. The area of RB is typifi ed on the basis of the character of demographic dynamics and natural movement processes of rural population. There have been identifi ed three types of districts by the nature of the dynamics of rural population for the period of 1970–2009 years: stable, growing and shrinking; and three types of natural population movement dynamics for the same period in accordance with spatial and temporal heterogeneity of rural depopulation.
Keywords: population geography, GIS-modelling, demographic dynamics, rural population of the RB, spatio-temporal shift s.
Introduction
The recent trends in the development of geodemographic studies show the signifi cant growth in their number and the use of increasingly sophisticated tools. The considerable amount of demographic statistical information calls for their systematization using the mathematical methods and the application of computer soft ware.1 Faculty of Geography, Belarusian State University, 220050, Minsk, Belarus. E-mail: [email protected] Research Republic Unitary Enterprise of Land Management, Geodesy and Cartography.
BelNITSzem, 220108, Minsk, Belarus.

220
The characteristic feature of the modern cartographic tools is the wide use of the computer and GIS technologies. For processing spatial data, the Environmental Systems Research Institute (ESRI) has created the ArcGIS pack-age, which allows visualising data, performing mathematical calculations, spa-tial and geostatistical analysis in 2- and 3-dimensions. This soft ware package has been customized in the economic and geographical studies on the popu-lation of RB in the Scientifi c Research Laboratory of Regional Demographic Problems on the Faculty of Geography of BSU since 2002 with the participation of the authors.
The fi rst GIS developed was the Demographic Atlas of Belarus (2002), followed by the Rural Areas of Belarus GIS featuring the rural population places in 1959–1999 and the GIS-Gallery of the demographic poten tial of the rural areas of the country using the grid-model and the method of pseudo-isolines (2003). In 2004 the Rural Population of Belarus GIS was created, show-ing the dynamics and the spatial patt erns of the development of demographic processes in 1989–1999, which was updated with the results of the 2009 census of the RB (Antipova, E. 2008).
Methods and information basis of the “Rural Population of Belarus” GIS
The current demographic record materials from the National Statistical Com-mitt ee of the Republic of Belarus, the 1989 (USSR), 1999 and 2009 (RB) popula-tion censuses formed the information basis of the research. The works of the Russian scientists in the fi eld of geoinformatics and geoinformational thematic mapping served as the theoretical and methodological background of the re-search (Tikunov, V.S. and Tsapuk, D.A. 1999; Kapralov, E.G., Koshkarev, A.V. and Tikunov, V.S. 2004).
The research resulted in the development of the new methodological ap-proach to the geographic systematization through the solution of the following theoretical and practical tasks:
1. Creation of the electronic database of the rural areas of Belarus in the re gional level – according to the administrative divisions since 1989;
2. Creation of the demographic GIS “Rural population of Belarus” of the regional level (based on the data of the 1989, 1999 and 2009 population censuses);
3. Elaboration of the dynamic comparative geographic GIS-model of the rural population of Belarus on the basis of the GIS-technologies and the ArcGIS soft ware package.
The structure of the general DemoGIS “Rural population of Belarus” comprises several projects that are grouped into thematic blocks with a system of special indices (Table 1).

221
Tabl
e 1. S
truc
ture
of t
he “
Rura
l pop
ulat
ion
of B
elaru
s” D
emoG
IS
GIS
pro
ject
na
me
GIS
level
Dem
oGIS
them
atic
gr
oups
Dem
ogra
phic
indi
ces
of th
e them
atic
gr
oups
Num
ber o
f them
es in
the
project
Dem
ogra
phic
da
tatim
elines
Data
depe
nden
ce
stru
cture
Map
them
es
in th
e pr
oject
GIS
pro
ject
1’Rural
pop
ula-
tion
of Belarus
’re
gion
al
1. Natural
pop
ula-
tion m
ovem
ent
birt
h rate
, mortalit
y rate
, na
tural
popu
lati
on in-
crease
/decrease
64
retr
ospe
ctive
(198
9,
1999
), present (
2004
)plex
Analy
tica
l map
s of
th e
de
mog
raph
ic
indi
ces
2. P
opula
tion
stru
ctur
e by
sex
an
d age
popu
latio
n si
ze and
the
share
of t
he m
ain ag
e gr
oups
retr
ospe
ctive
(198
9,
1999
), present (
2004
)plex
3. M
igratio
nnu
mber
of immigrants,
nu
mber
of emigrants
retr
ospe
ctive
(199
9)plex
4. P
opulation set-
tlement
popu
lati
on size
of t
he
rural sett
lements
retr
ospe
ctive
(195
9,
1979
, 19
89,
1999
),
present (
2004
)hierar
chical
GIS
pro
ject
2
’Rural
pop
ula
-tio
n of
Belarus
’lo
cal
Dem
ogra
phic
po-
tential
rural s
ett le
ments
pop
u-latio
n si
ze35
4retr
ospe
ctive
(195
9,
1979
, 19
99),
presen
t (1
999)
, perspectiv
e
relatio
nal,
hi-
erar
chical
Analy
tica
l map
s of
the
de
mog
raph
ic
potential
GIS
pro
ject
3
’Com
plex
dem
o-grap
hic
zoning
of
the
rural
area
of Belarus
’
regi
onal
1.Dem
ogra
phic
situation
Dem
ogra
phic
typ
es
iden
tifyin
g: d
ynam
-ics
of t
he p
opulation
increase
/decrease,
dy-
namics
of th
e birt
h- and
m
ortalit
y rate
, de
gree
an
d speed
of dep
opula-
tion,
dem
ogra
phic
load
, po
pulatio
n ageing
, ag ri-
cultu
ral l
oad,
sett lem
ent
distri
butio
n
4retr
ospe
ctive
(198
9,
1999
), present (
2004
)hierar
chical
Inte
gral
map
s of
the
dem
o-grap
hic c
ondi
-tio
ns2.
Set
tlem
ent
system

222
The study indicated that the work on the creation of a demographic GIS using the ArcGIS 9.3, regardless of the GIS level chosen, has a consistent methodol-ogy and can be theoretically performed in three steps (Antipova, E. 2007a).
The fi rst step consists of the analysis of the demographic data that is processed to choose the raster map basis and to create the necessary layers of the spatial data. As the second step, att ribute table of the vector polygonal theme are created. The third step involves mapping on the basis of the values of a certain fi eld in the att ribute table. A major part of the derived demographic indices was calculated using the tools for the att ribute information processing in the GIS.
The most widespread method of illustrating the area population rate is creating population density maps (Figure 1) using the method of isolines in conjunction with the method of colour scales (isolines with layer colouring). It consists of the interpolation of the population density values on the surface, each point of which is defi ned by the pair of the х and у coordinates.
The method of the scaled map symbols (dot method) is best suited for the mapping of the average rural sett lement size.
Fig. 1. Methods of the population density mapping. – a = method of isolines with a layer colouring; b = method of grid networks; c = cartogram method. (Hereinaft er inscriptions are developed according to Resolution of the State Committ ee of Land Resources, Geodesy and Cartography of the Republic of Belarus, 23.11.2000, No. 15 "Transliteration Instruction of
the Republic of Belarus geographical names by Latin alphabet")

223
It implies building a population density marker in a semi-centre point of each region, the sizes of the markers depending on the selected classifi ca-tion key.
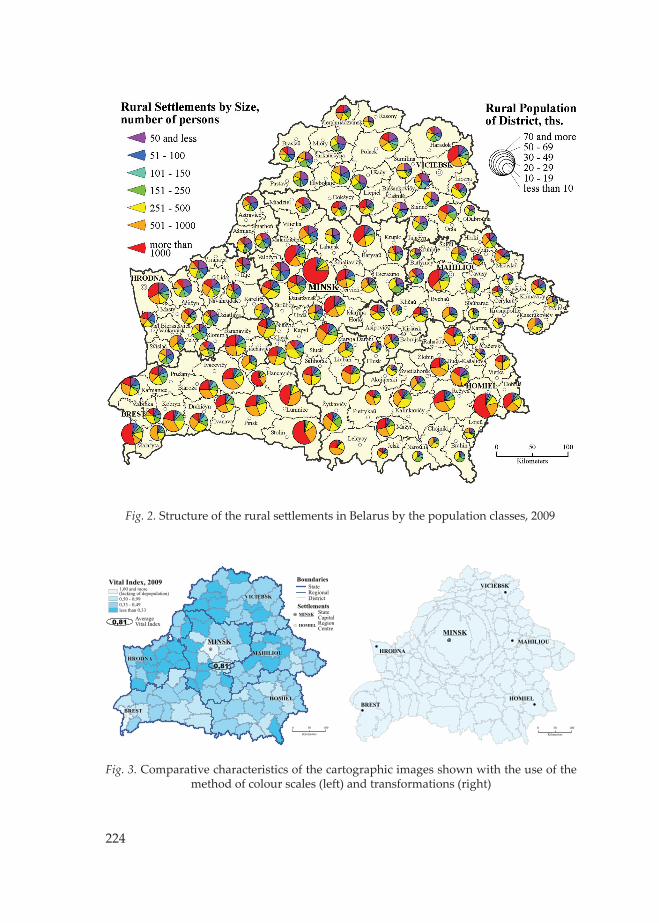
The best suited methods of mapping the relative demographic values are the methods of the diagrammatic maps and colour scales (cartograms), which give an illustrative view of the cartographic image transformation method, that involves scaling dispersion of the total data for every region, as well as the an-amorphosis method or the area of the administrative-territorial unit according to the value of the index (Gusein-Zade, S. 2008). For instance, the map “Structure of the rural sett lements in Belarus according to the population classes” was cre-ated with the use of the method of localised pie-charts (Figure 2).
The colour scales method is widely used in geodemographic studies and it was developed in the previous works of the authors (Myshlyakov, S. and Fakeyeva, L. 2005).
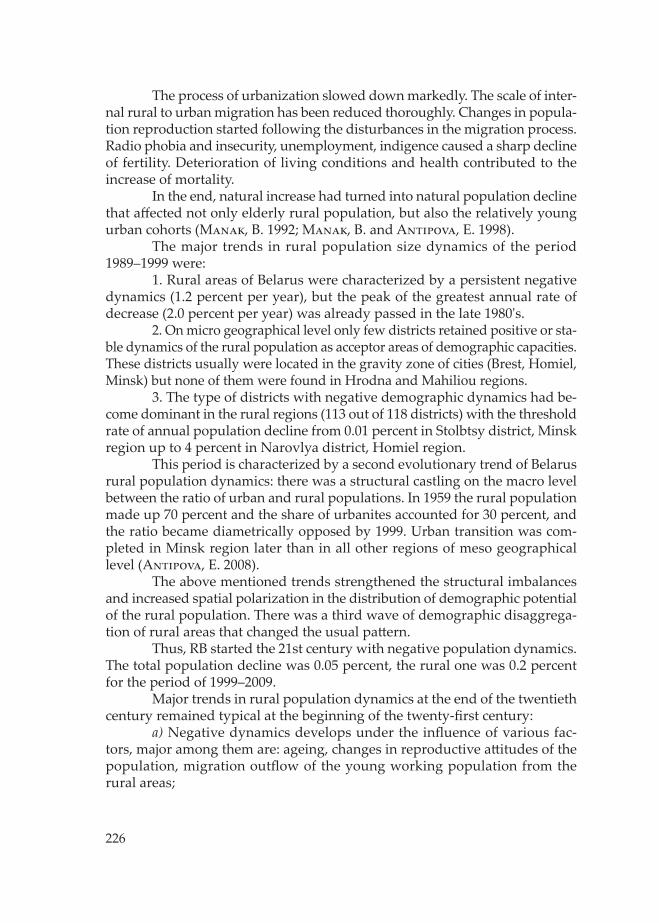
For mapping the characteristic with substantial regional diff erences, the transformed image – anamorphosis – is the most informative form of visualising the spatial diff erentiation of the index (Figure 3).
Let’s have a closer look at the map-image transformation method. The creation of such transformed maps (density-equalized maps or cartograms) is me-thodically based on the work of American researchers Gastner and Newman “Diff usion-Based Method for Producing Density-Equalizing Maps” (Gastner, M. and Newman, M. 2004).
The use of the method that is physical by its nature that was proposed by these scientists was organised in the ArcGIS 9.3 soft ware package with the help of the tool for the cartogram creation (created by T. Gross, ESRI) that is distributed for free (www.esri.com/arcscripts). The source data should be the polygons (object class and layers can be used too) with the necessary att ribute parameters for the calculations.
The data is output exclusively to the created object class (in the existing personal database). The additional key parameters are the density smoothing factor and the number of cells in the analytical grid. The fi rst parameter, having the default value of 1, can have values from 0 to 100. The second parameter is the number of cells in the analytical grid and it varies from 128 to 4,096 with the default value of 512.
The lower is the cell size, and the bigger is the number of cells, respec-tively, the more precise is the cartogram in showing the diff erentiation of the phenomenon.
Therefore, the use of the new methods of dynamic mapping in the pop-ulation geography allows to use the special advantages of the GIS technology (functionality, scalability, use of visual aids, easy way of updating, effi ciency, compatibility, modelling) and develop the interactive reference informational GIS projects for practising the regional management.
224
Fig. 2. Structure of the rural sett lements in Belarus by the population classes, 2009
Fig. 3. Comparative characteristics of the cartographic images shown with the use of the method of colour scales (left ) and transformations (right)
!·
!·
!G
!·
!·
!·
MINSK
BREST
HOMIEL
HRODNA
VICIEBSK
MAHILIOU
0 10050
Kilometers
0,81
Settlements
BoundariesState
DistrictRegional
AverageVital Index0,81
Vital Index, 2009
less than 0,330,33 - 0,490,50 - 0,99
1,00 and more(lacking of depopulation)
!· HOMIEL RegionCentre
!G MINSK StateCapital
MINSK
BRESTHOMIEL
HRODNA
VICIEBSK
MAHILIOU
0 10050
Kilometers

225
Trends of rural population size dynamics in Belarus
Natural increase or decrease, migratory movement, losses caused by warfare and by other political cataclysms (deportation, repression), the harmful eff ects of the Chernobyl disaster, population loss caused by the waves of emigration determined population dynamics in Belarus over the 20th century.
The distinctive features of the periods between censuses and the main types of population trends have been identifi ed. It was based on the analysis of factors controlling rural population dynamics: the rate of increase or de-crease in population size and of the ratio of the rural segment within the total population of Belarus (Antipova, E. 2008).
The period between 1959 and 1970 was characterized by the domi-nance of economic factors and it proceeded up to 1986. Urbanization played the role of the key factor at that time. It was the fi rst period of the negative rural population dynamics on macro geographical level. Micro geographical level of research indicated the fi rst wave of rural demographic disaggrega-tion and the territorial diff erentiation of demographic dynamics. Thus, some districts with a positive dynamics of population size were elicited against the general background of rural population decline (0.1 percent per year for Belarus) as a result of migratory outfl ow. 69.2 percent was rural within the overall population of Belarus in 1959. Thus, the rural population prevailed in the demographic space during this period.
The period of 1970–1979 years was characterized by an accelerated rate of rural population decline (1.5 percent per year), the second wave of ru-ral demographic disaggregation, the demographic space frame of sett lement violation and the overall restructuring. The urban transition was completed on macro geographical level in the fi rst place and a natural decrease of the rural population started.
The period between 1979 and 1989 is distinguished by the infl uence of ecological factor. Rural population experienced further decline and spatial redistribution of demographic potential during this period. Ecological decline under the infl uence of the Chernobyl accident and the socio-economic devel-opment of the country did not change trends in the dynamics of rural popula-tion essentially at this stage. Negative dynamics had not strengthened.
The transformation between 1989 and 1999 changed the demographic course in the country due to the impact of several factors. There had been political and socio-economic changes during these years: the disintegration of the Soviet Union, the switch of the former member republics of the USSR to the independent development, restructuring and the economical and social reforms. The emerging socio-economic crisis had deteriorated the living condi-tions of people. This caused a breach in the dynamics and spatial distribution of the population, the nature of demographic reproduction.
226
The process of urbanization slowed down markedly. The scale of inter-nal rural to urban migration has been reduced thoroughly. Changes in popula-tion reproduction started following the disturbances in the migration process. Radio phobia and insecurity, unemployment, indigence caused a sharp decline of fertility. Deterioration of living conditions and health contributed to the increase of mortality.
In the end, natural increase had turned into natural population decline that aff ected not only elderly rural population, but also the relatively young urban cohorts (Manak, B. 1992; Manak, B. and Antipova, E. 1998).
The major trends in rural population size dynamics of the period 1989–1999 were:
1. Rural areas of Belarus were characterized by a persistent negative dynamics (1.2 percent per year), but the peak of the greatest annual rate of decrease (2.0 percent per year) was already passed in the late 1980's.
2. On micro geographical level only few districts retained positive or sta-ble dynamics of the rural population as acceptor areas of demographic capacities. These districts usually were located in the gravity zone of cities (Brest, Homiel, Minsk) but none of them were found in Hrodna and Mahiliou regions.
3. The type of districts with negative demographic dynamics had be-come dominant in the rural regions (113 out of 118 districts) with the threshold rate of annual population decline from 0.01 percent in Stolbtsy district, Minsk region up to 4 percent in Narovlya district, Homiel region.
This period is characterized by a second evolutionary trend of Belarus rural population dynamics: there was a structural castling on the macro level between the ratio of urban and rural populations. In 1959 the rural population made up 70 percent and the share of urbanites accounted for 30 percent, and the ratio became diametrically opposed by 1999. Urban transition was com-pleted in Minsk region later than in all other regions of meso geographical level (Antipova, E. 2008).
The above mentioned trends strengthened the structural imbalances and increased spatial polarization in the distribution of demographic potential of the rural population. There was a third wave of demographic disaggrega-tion of rural areas that changed the usual patt ern.
Thus, RB started the 21st century with negative population dynamics. The total population decline was 0.05 percent, the rural one was 0.2 percent for the period of 1999–2009.
Major trends in rural population dynamics at the end of the twentieth century remained typical at the beginning of the twenty-fi rst century:
a) Negative dynamics develops under the infl uence of various fac-tors, major among them are: ageing, changes in reproductive att itudes of the population, migration outfl ow of the young working population from the rural areas;

227
b) The annual decline of the rural population tends to increase com-pared to 1999: in Brest region – 1.3 percent, in Viciebsk – 2.4 percent, in Homiel – 1.9 percent, in Hrodna – 2.2 percent, in Minsk – 1.9 percent, in Mahiliou region – 2.5 percent as a result of combined impact of the above mentioned factors.
The study of the demographic development of Belarus since the fi rst popu-lation census in the year 1897 until present allowed to conclude that the general dynamics of the demographic processes is the function of social and demographic evolution, while the spatial diff erentiation is infl uenced by a complex of features in the development of agroeconomics, sett lements, transport, communications and ecology, as testifi ed by the fi ndings of the correlation and regression and factor analyses (Fakeyeva, L. 2008a).
Socio-demographic factor has the evolutionary dependency and has been determinant in the genesis of the depopulation process of the rural areas in Belarus that could already be observed back to the year 1975.
Over the 1970–1979 period, the territorial disparities were caused (similar to the fi rst half of the 20th century) by the agroeconomic factor, that was studied with the involvement of indices such as the gross revenue in agriculture, land quality, and the power available in farming. Between 1989 and 2008 the sett lement factor (the population change of rural sett lements, the degree of urbanization) and the transport and communication factor (e.g. the density of paved roads) had been the dominant (Figure 4). The ecological factor have not had a substantial impact on the dynamics of the natural population movement in Belarus since the year 1986 in general.
In accordance with the trend of the rural population dynamics of Belarus characterized by the gradual downsizing for the period of 1970–2009 years, the following spatial regularities were identifi ed:
persistent long-term negative rural population dynamics is distinctive for peripheral districts with low agricultural potential or with extensive natural systems;
the reduction of the rural population had set in later in areas of transition type with high agricultural or recreation potential, as well as in the zone of the "special Chernobyl region";
large (support) cities are att racting rural migrants during the whole period studied;
the capital region is an active and potential area of demographic growth due to immigration as well as to the natural factors of fertility which is more im-portant for improving the demographic situation in the country.
The change of this share of districts within the total rural population is calculated to study the spatial dynamics. The vector of the spatial shift s of de-mographic potential for the period 1970–2009 was identifi ed with the qualitative characteristics of the dynamics (growth, stability, or decline). As a result, three types of districts have been identifi ed by the nature of the dynamics of rural population: growing, stable, and shrinking (Table 2).
–
–
–
–

228
Fig. 4. Meso regional distribution of the factors of the geodemographic dynamics in the rural areas of Belarus
Table 2. Characteristics of districts types of Belarus by the nature of the dynamics of rural population
Type Number of districts
Share within the total population, %
Share within the territory,
%
Urbanization rate, %
1970 2009 1970 2009Type 1Type 2Type 3
226036
18.8549.6231.53
36.5942.4420.97
19.9748.7231.31
47.1247.9533.22
84.0162.261.25
Source: Own compilation based on Population of Belarus: statistical digests 1970–2009.
Type 1. Growing. Southern agricultural districts of Polessye have an increasing share within the country’s population. This region has a tradition-ally favourable demographic situation (Stolin, Gantsevichy, Luninets). These are districts with typically high agricultural potential, characterized by an increasing share within the population of the republic over the whole study period. Another large group of the growing districts does not have a compact area of distribution. This subtype is a mosaic of scatt ered districts located in the suburban zone of major cities and transport corridors. The share of this

229
subtype is steadily increasing. Mahiliou region is the only exception where the periods of growth have alternated with those of loss.
Type 2. Stable. This type is represented by agrarian districts with cen-tres in medium and small urban sett lements. Districts with conditional sta-bility have not changed its share of the total rural population signifi cantly. Geographical areas of this type relate to the zones of the average level of intensity dynamics of the basic demographic processes.
Type 3. Shrinking. This type is represented by peripheral districts of the country that are located in administrative regions of environmental and recreational profi le, and the regions aff ected by man-made disaster. Homiel and Mahiliou regions have suff ered the most sharp decrease in population over the study period. This territory was aff ected by the Chernobyl accident which had halved the share of this type within the total population.
These districts reduced the share of its population over the study pe-riod. The process has got the reverse vector at the present stage only, but the intensity and duration is still very low to cover the massive and prolonged thirty-year losses.
The peripheral districts of Mahiliou region and districts along the line of Mahiliou–Babruisk experienced the second largest decline in the share within the total population over the study period. Peripheral districts located north-west of Minsk region, west of Viciebsk and east of Hrodna belong to the shrinking type of dynamics, too.
The absolute decrease values are minor among the districts of this type. Thus, centre of gravity of the rural population has shift ed in two directions: zonal – from north-east to south-west and azonal – to the suburbs of large cities. The second vector becomes increasingly signifi cant with each passing year and the share of the population of suburban areas is growing faster and more intensive than that of the homogeneous agricultural areas.
Spatiotemporal patt erns of demographic development of rural areas in Republic of Belarus
The mapping of the main demographic processes in the rural areas of Be-larus in terms of their dynamics indices during the years 1989–2009 high-lighted a substantial diff erentiation, resulting from the multi-directional evolutionary and transformational infl uence of socio-economic and spatial factors.
Rural population of Belarus has been reducing due to natural popula-tion decline mainly, which has exceeded migration outfl ow from the villages since 1992. Regressive demographic trends in Belarus appeared at the outset of the fi rst "demographic transition" in rural areas by the mid-1960s.

230
These regressive demographic trends have taken place all over the republic, but the process of their expansion and development has been uneven in time and space. The diff erences in duration and indices of the increase in mortality and of decline in fertility are manifested on the meso level (i.e. of regions) and intensify on the micro level (of districts).
Natural rural population decline had grown to 3.8‰ both by reducing the birth rate to 12.3‰, and increasing mortality up to 16.1‰ by the end of 1980. Natural decrease had reached 13.8‰ in ten years by 1999. In 2009, births exceeded deaths by 13.0‰.
The natural decrease in rural population of Belarus began in the late 1970's as a whole. It was recorded in 1975 in Viciebsk, Hrodna and Mahiliou regions, in Minsk – in 1980, in Brest and Homiel regions – in 1985. Meso level diff erences in the completion of the fi rst "demographic transition" are clearly seen from north-east to south-west i.e. from the agro-extensive areas to agro-intensive ones (Pirozhnik, I. 1986). Minsk region is an exception. It is the region with the highest social-economic potential, concentrating various functions of a large urban centre and demonstrating a relatively more stable demographic development (Fakeyeva, L. 2008b).
The direction of the population distribution axis is explained by the territorial diff erentiation of population losses in the Great Patriotic War. In the pre-war period the population on the territory of Belarus was located fairly evenly and signifi cant meso level diff erences were not observed. Demographic potential shift ed to the Minsk and Brest regions during the second half of the twentieth century (Antipova, E. 2007b).
The diff erentiation in development of demographic processes is greatly enhanced on the micro level. Spatial spread of the process of rural depopula-tion in the direction from north-east to south-west from the agro-extensive districts to agro-intensive districts is closely related to the sett lement patt ern which changes in the same direction from the prevalence of small-sized to that of large-sized sett lements.
The fi rst "demographic transition" has been completed in all rural ar-eas of Belarus by the end of 1980. Five Polessye districts and typical suburban Minsk, Homiel and Brest had small natural growth only. The stimulating role of cities in the Homiel and Brest regions enhanced zonal features, which are ex-pressed in a high fertility and low mortality in the southern part of Belarus.
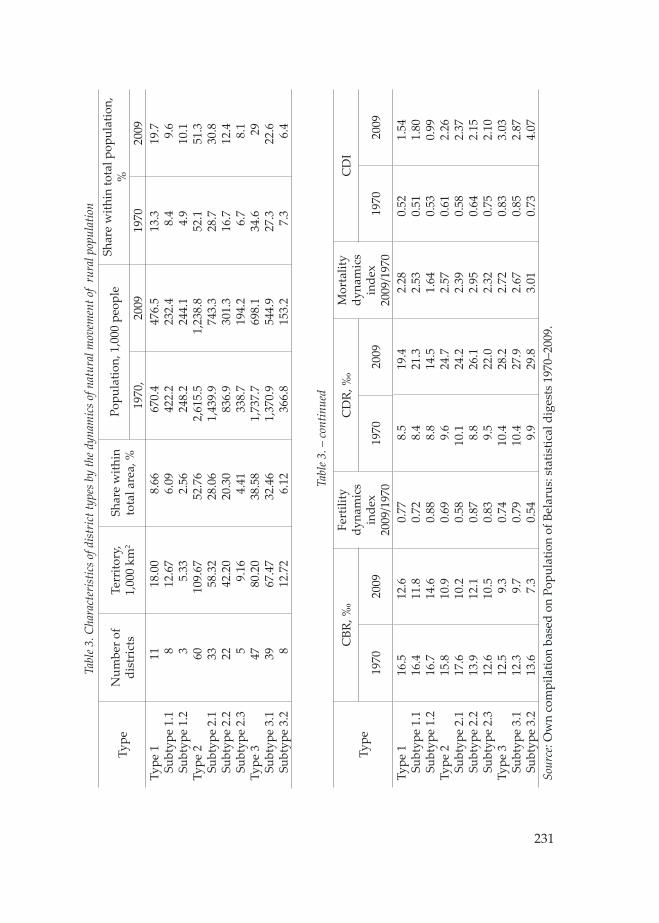
Currently, all Belarus districts, except for those of Minsk and Brest, are characterized by a natural decrease of rural population. 3 types of dynamics of natural population movement were identifi ed in accordance with spatial and temporal heterogeneity of the rural depopulation (Table 3).
Type 1. Developing. It includes suburban and urban, agrarian Polessye districts with a relatively favourable demographic dynamics (for the period of 1970–2009 CBR from 16.5 to 12.6‰, CDR from 8.5 to 19.4‰).
231
Tabl
e 3. C
hara
cter
istic
s of d
istric
t typ
es b
y th
e dyn
amic
s of n
atur
al m
ovem
ent o
f ru
ral p
opul
atio
n
Type
Num
ber o
f distri
cts
Territo
ry,
1,00
0 km
2Sh
are
with
in
total area,
%Po
pulatio
n, 1
,000
peo
ple
Share
with
in to
tal p
opulation,
%
1970
,20
0919
7020
09
Type
1Su
btyp
e 1.
1Su
btyp
e 1.
2Ty
pe 2
Subt
ype
2.1
Subt
ype
2.2
Subt
ype
2.3
Type
3Su
btyp
e 3.
1Su
btyp
e 3.
2
11 8 3 60 33 22 5 47 39 8
18.0
012
.67
5.33
109.
6758
.32
42.2
09.
1680
.20
67.4
712
.72
8.66
6.09
2.56
52.7
628
.06
20.3
04.
4138
.58
32.4
66.
12
670.
442
2.2
248.
22,
615.
51,
439.
983
6.9
338.
71,
737.
71,
370.
936
6.8
476.
523
2.4
244.
11,
238.
874
3.3
301.
319
4.2
698.
154
4.9
153.
2
13.3 8.4
4.9
52.1
28.7
16.7 6.7
34.6
27.3 7.3
19.7 9.6
10.1
51.3
30.8
12.4 8.1 29
22.6 6.4
Tabl
e 3. –
cont
inue
d
Type
CBR
, ‰Fertility
dy
namics
inde
x20
09/1
970
CD
R, ‰
Mortalit
ydy
namics
inde
x20
09/1
970
CD
I
1970
2009
1970
2009
1970
2009
Type
1Su
btyp
e 1.
1Su
btyp
e 1.
2Ty
pe 2
Subt
ype
2.1
Subt
ype
2.2
Subt
ype
2.3
Type
3Su
btyp
e 3.
1Su
btyp
e 3.
2
16.5
16.4
16.7
15.8
17.6
13.9
12.6
12.5
12.3
13.6
12.6
11.8
14.6
10.9
10.2
12.1
10.5 9.3
9.7
7.3
0.77
0.72
0.88
0.69
0.58
0.87
0.83
0.74
0.79
0.54
8.5
8.4
8.8
9.6
10.1 8.8
9.5
10.4
10.4 9.9
19.4
21.3
14.5
24.7
24.2
26.1
22.0
28.2
27.9
29.8
2.28
2.53
1.64
2.57
2.39
2.95
2.32
2.72
2.67
3.01
0.52
0.51
0.53
0.61
0.58
0.64
0.75
0.83
0.85
0.73
1.54
1.80
0.99
2.26
2.37
2.15
2.10
3.03
2.87
4.07
Sour
ce: O
wn
com
pilatio
n based
on P
opulation
of Belarus
: statistical
digests
197
0–20
09.

232
Type 2. Stable. It comprises transitional districts, the demographic develop-ment is close to the average (CBR from 15.8 to 10.9‰, CDR from 9.6 to 24.7‰).
Type 3. Depressive. It combines adverse peripheral districts (CBR from 12.5 to 9.3 ‰, CDR from 10.4 to 28.2‰), with low demographic and agricul-tural potential located in Poozerye, on the Neman lowland and Lida plain, with districts of high agricultural or tourist recreational potential in accordance with Figure 2 (Fakeyeva, L. 2009).
Type 1. Developing type includes 11 districts, characterized by stable high fertility and low mortality, positive dynamics of natural movement. Currently, only these areas of Belarus are capable of self-development and demographic reproduction. Developing type includes two subtypes: southern and dispersed.
Subtype 1.1. Developing southern subtype comprises 8 Polessye agrarian districts that traditionally have an advantageous demographic situation. The combination of the confessional and ethnic structure, economic activities and sett lement patt ern in these extensive agrarian regions forms a stable area with the lowest level of rural depopulation in Belarus.
Subtype 1.2. Developing dispersed subtype includes three suburban, in-dustrial districts Minsk, Homiel and Brest, where 10 percent of rural popu-lation live and the share of these areas within the rural population is on a constant increase.
Type 2. Stable type unites 60 districts, where 51 percent of the rural population of Belarus is concentrated residing in 53 percent of the area. The stability of these districts with regard to the average Belarus indicators deter-mines the stagnation of the demographic development. Currently, most stable areas are not able to the natural population increase without migration infl ow, except for the areas of suburban subtype:
Subtype 2.1. Stable central-western region embraces 33 districts of the Belarusian ridge and large-sized sett lement districts of lowland areas of Pripyat river, the majority of which belongs to industrial and industrial-agrar-ian sections, 8 – to agro-extensive section and 7 – to agro-intensive section (Pirozhnik, I. 1986).
Subtype 2.2. Stable south-eastern region consists of 22 large- and middle-sized sett lement districts of the Polessye within Homiel region, where ca 12,5 percent of the rural demographic potential is concentrated. In this subtype there are mainly agro-extensive districts, fi ve of them relate to industrial and agricultural, Mozyr, Babruisk and Svetlogorsk belong to industrial ones.
Subtype 2.3. Stable suburban areas include 5 urban industrial districts, with more than 8 percent of resident rural population in the country and with a constantly increasing proportion of the demographic potential in these areas.
Type 3. Depressive type unites 47 districts, representing 39 percent of the territory, and concentrates about 28,9 percent of the rural demographic potential.
233
These districts could be characterized by low fertility and high mortality dur-ing the whole research period. In 1970 already Conditional Depopulation Index (CDI) was less than one in the regions of this type, indicating narrowed type of the population reproduction. Depopulation Index had risen up to 3.03 in 2009.
Subtype 3.1. Depressive north-eastern subtype unites 39 districts, which are home to 22,6 percent of the population and the proportion of the demographic potential is declining. Most of them are represented by northern part of Belarus – Poozerie, with a low demographic and agricultural potential. Districts of this subtype had reduced demographic potential throughout the study period. This process cannot be stopped in a natural way due to the abruptly disturbed age structure.
Subtype 3.2. Depressive western subtype includes 8 districts, which con-centrate around 6.4 percent of the demographic potential, occupy 6 percent of rural areas in RB, and are located on the Neman lowland and Lida plain. They are districts with high agricultural, tourist and recreational potential, and are characterized by a delayed onset of depopulation, but fertility decline has occurred rapidly and more intensely, coupled with the average national growth rate of mortality.
The complex typology according to the type of demographic repro-duction processes in rural areas of Belarus that was developed in this study was based on the preliminary, private typologies implemented on the base of the consistent spatial patt erns of the main demographic processes. The latt er were found by the type of the natural movement dynamics; features of the age structure; intensity of the decrease of the population number with provision for the eff ect of the economic and geographic factors that were identifi ed using the multidimensional methods of mathematical analysis. The typologies thus developed provided the evidence of the geodemographic spatial polarisation of the central-peripheral quality.
As a result, 3 region types have been demarcated with clear geographi-cal borders.
1. Comparatively stable type has the most favourable demographic charac-teristics and a potential for demographic self-development. The type comprises two subtypes:
1.1. Subtype of homogeneous comparatively stable regions with lower-than-the-average natural loss of population, the shortest duration of depopulation, the smallest disproportion in the age structure, the average or high rate of working population, a growing or stable overall rate of the rural population, and decreasing intensity of migration outfl ow.
1.2. Subtype of comparatively stable nodal regions with variably decreasing natural population, and regressive age structure; average, high or rising rate of working population, increasing population size, migration infl ow or migration outfl ow with a trend of decreasing intensity.
234
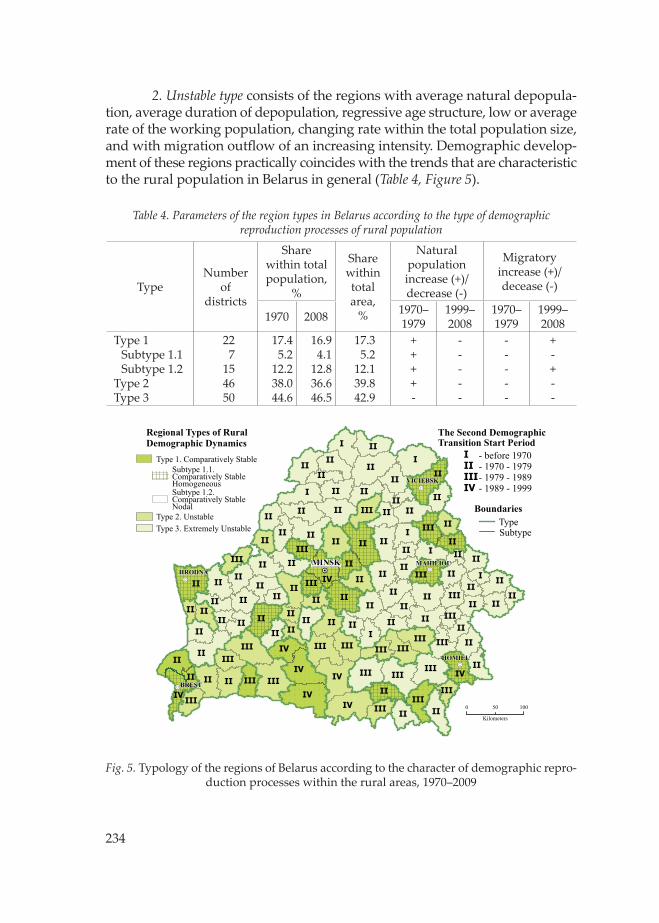
2. Unstable type consists of the regions with average natural depopula-tion, average duration of depopulation, regressive age structure, low or average rate of the working population, changing rate within the total population size, and with migration outfl ow of an increasing intensity. Demographic develop-ment of these regions practically coincides with the trends that are characteristic to the rural population in Belarus in general (Table 4, Figure 5).
Table 4. Parameters of the region types in Belarus according to the type of demographic reproduction processes of rural population
TypeNumber
of districts
Share within total population,
%
Share within total area,
%
Natural population increase (+)/decrease (-)
Migratoryincrease (+)/decease (-)
1970 2008 1970–1979
1999–2008
1970–1979
1999–2008
Type 1Subtype 1.1Subtype 1.2
Type 2Type 3
227
154650
17.45.2
12.238.044.6
16.94.1
12.836.646.5
17.35.2
12.139.842.9
++++-
-----
-----
+-+--
Fig. 5. Typology of the regions of Belarus according to the character of demographic repro-duction processes within the rural areas, 1970–2009
!·
!·
!G
!·
!·
!·
I
I
I
II
I
III
II
II
II
I
II
IIII
II
II
II
II
III
II
II
II
III
II
II
II
II
II
IV
II
II
IIII
IV
IIIII
IIIIII
II
II
II
II
II
IV
II
II
II
III
IIII
II
IV
II
I
II
IIII
II
II
II II
II
II
II
II
II
II
II
II
II
III
II
II
II
II
III
II
III
IV
II
II
II
IIIIII
II
IIIII
II
IV
IIII
II
III
IIII
III
III
II
IV
IV
II
III
IIIIII
III
IIIIII
II
II
III
II
IIIII
II
III
II
III
IIMINSK
BREST
HOMIEL
HRODNA
VICIEBSK
MAHILIOU
0 10050
Kilometers
BoundariesTypeSubtype
The Second DemographicTransition Start Period
- before 1970- 1970 - 1979- 1979 - 1989- 1989 - 1999
IIIIIIIV
Regional Types of RuralDemographic Dynamics
Type 3. Extremely Unstable
Type 1. Comparatively StableSubtype 1.1. Comparatively Stable HomogeneousSubtype 1.2.Comparatively StableNodal
Type 2. Unstable

235
3. Extremely unstable type includes areas with the natural decrease above the average, the longest duration of the depopulation process, sharply broken age structure, the low rate of able-bodied population, decreasing or stagnating population rate, migratory outfl ow. This type is the demographic periphery of rural Belarus.
Conclusions
Consequently, the research conducted shows that the geoinformational approach can be used not only to create the maps that follow the requirements of the socio-eco-nomical cartography, but also to construct GIS models that have massive opportuni-ties for performing analytical operations. The “Rural population of Belarus” GIS de veloped can be used in government administration on the state, regional and local levels as a geographic and demographic interactive reference informational resource.
The spatial and temporal analysis of the rural population dynamics con-ducted for the period of 1970–2009 years allowed to formulate main conclusions:
The dynamics of rural population of Belarus has an evolutionary charac-ter. The increasing reduction in the population size is the essential contemporary trend that leads to the decreasing role of the rural population in the formation of geodemographic space.
Macro geographic trends illustrate the end of «urban transition», which is characterized by structural shift in rural areas from the dominant rural type of districts to suburban, and the "castling" of the urban and rural populations in the formation of geodemographic space.
Spatial and temporal combination of factors shows the cyclic character of population dynamics on the one hand, and the centre-periphery polarization properties on micro geographic level on the other hand.
Economic-geographical characteristics of the rural Belarus population dy-namics testify to the geographically diff erentiated roles of districts in the formation of demographic space in Belarus, which is determined by a strong presence of suburban and suburban-ring districts, and by a weak presence of the peripheral districts.
The main spatial and temporal trends in the natural movement of rural population in the period of 1970–2009 are:
an area of demographic depression is trending in the direction from north-east to south-west; south Polessye districts are characterized by the highest stability of the zonal demographic parameters;
the demographic space has been fragmented under the infl uence of the development of urban sett lement network and of the improvement of demographic parameters in suburban districts.
–
–
–
–
–
–

236
The spatiotemporal analysis of the main demographic parameters has shown that the rural areas of Belarus vary across the country signifi cantly. These diff erences are intensifi ed under the infl uence of the large urban sett le-ments, and the region types identifi ed have diff erent potential of reaching the demographic optimum. This situation calls for an increasingly diff erentiated demographic policy to ensure the national demographic security.
REFERENCES
Antipova, E.A. 2007a. The experience of using of GIS-technologies in population geography. Vestnik BGU 2. (2): 87–93. (in Russian)
Antipova, E.A. 2007b. Regions of Belarus: demographic development peculiarities and labour potential of rural area. Minsk, BGPU, 232 p. (in Russian)
Antipova, E.A., 2008. The geodemographical problems and territorial structure of rural sett lement of Belarus. Minsk, BGU, 327 p. (in Russian)
Fakeyeva, L.V. 2008a. Regional types of Belarus rural population natural movement. Vestsi BDPU 3. (2): 71–76. (in Russian)
Fakeyeva, L.V. 2008b. Role of mechanical movement in dynamics of rural population of Belarus: existential aspect. Vestsi BDPU 3. (3): 61–66. (in Russian)
Fakeyeva, L.V. 2009: Economic-geographical factors and regional tendencies of rural Belarus de-population. PhD Doctoral Thesis, Minsk, BGU 21 p. (in Russian)
Gastner, M. T., Newman, M. E. J. and Goodchild, M. F. 2004. Diff usion-Based Method for Producing Density-Equalizing Maps. Proceedings of the National Academy of Sciences of the United States of America, Vol. 101. (20): 7499–7504.
Gusejn-Zade, S.M. 2008. Anamorfozy: what is it? Minsk, МLKI, 168 p. (in Russian)Kapralov, E.G., Koshkarev, A.V. and Tikunov, V.S. 2004. Bases of Geoinformatics. Minsk
Univ., 352 p. (in Russian)Manak, B.A. 1992. Population of Belarus: regional peculiarities of development and sett lement
system. Minsk Univ., 176 p. (in Russian)Manak, B.A. and Antipova, E.A. 1998. Economic-geographical analysis of Belarus population
demographic situation and spatial distribution. Minsk, BGU, 292 p. (in Russian)Myshljakov, S.G. and Fakeyeva, L.V. 2005. Technological aspects of performance of complex
rural demographic zoning of Belarus. Proceedings of 4th international Youth Scientifi c Conference, Moscow, ECON-INFORM, 530–533. (in Russian)
Pirozhnik, I.I. 1986. Economic-geographical typology of Belarus SSR districts. Vestnik BGU 2. (2): 63–67. (in Russian)
Resolution of the State Committ ee of Land Resources, Geodesy and Cartography of the Republic of Belarus. 23.11.2000. No15. Transliteration Instruction of the Republic of Belarus geographical names by Latin alphabet. Electronic resource. htt p://www.pravoby.info/docum09/part26/akt26364.htm Date of access: 21.02.2011.
Tikunov, V.S. and Tsapuk, D.A. 1999. Sustainable development of territories: cartographo-geo-information support. Moscow, MGU, 175 p. (in Russian)