data presentation in gis cartographic basics - barry waitepresentation+2010.pdf · data...
TRANSCRIPT

Data Presentation in GISCartographic Basics

Why This Workshop?
• Learn a few key cartographic principles
– Many professionals using GIS don’t have background
in cartography, color or design
• Learn how to share those principles
– Help others create clear maps
WHY cartography is important…Help others to see/understand the results of your efforts

Your audience is
going to expect
more & know less
GOAL
Present Information in a Clear & Useful Map
Manipulating Graphic Properties
of Map Elements– Carefully & accurately
represent information
– Create visual hierarchy
– Maintain clarity and
legibility
Projects
GIS Dept.
Enterprise
Societal

The Communication Channel
REALITY
Data collection
& compilation Selection
Recognition
Classification
Simplification
Symbolization
and
Map Creation
CARTOGRAPHER
MENTAL IMAGE OF
“REALITY”
Read
Analyze
InterpretMAP USER
?

Investigation/Preparation
• Identify Map User
– Display medium (paper or digital)?
– Available time & proximity to map?
– Users expected understanding of map data?
– In or out of peer group?
• Determine Map Focus/Extent
– What information is being presented?
– Layers needed to present a complete picture?
– Extent of important layers?

• Hardcopy?
• Data Scale vs. Output Size
How big can you print?
CAN you show what you want?
• Paper Types
• Plotter restrictions
• Digital / On-line
• Resolution/size of screen
• How much data can be seen
Think of end result before you begin

Considerations
• Determine Data:
– Selection
– Classification
– Simplification
– Symbolization
• Determine Map Type:
– General or “Reference” Map
– Thematic Map
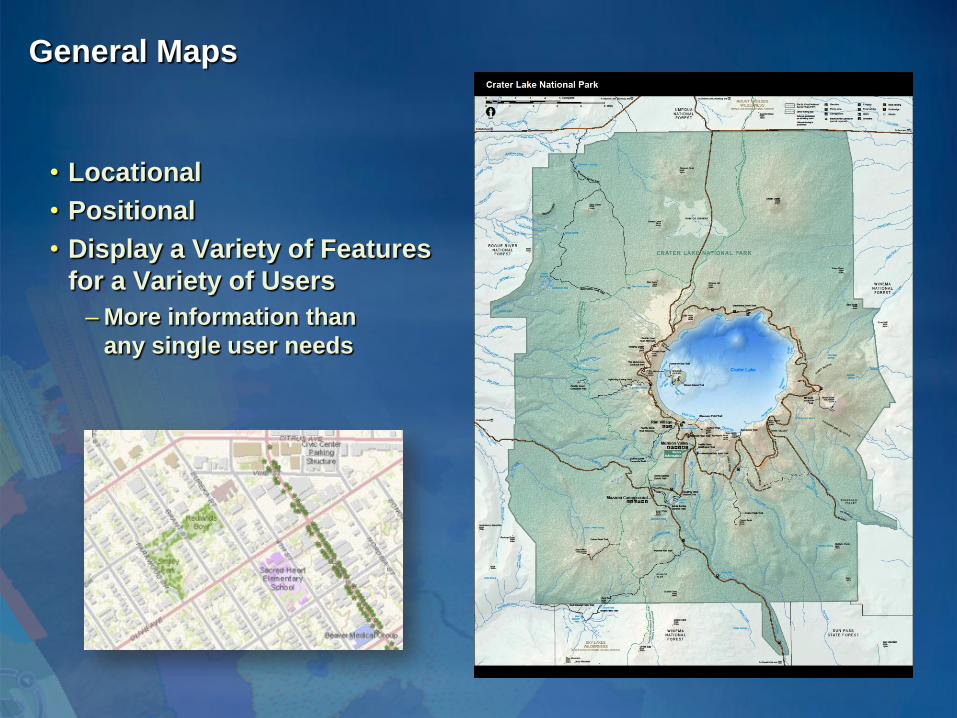
General Maps
• Locational
• Positional
• Display a Variety of Features
for a Variety of Users
– More information than
any single user needs

Thematic Maps
• Display the Structure of
Distribution
– Qualitative - Soil type
• Display Specific Attributes or
Relationships
– Quantitative - Soil Depth
Type A
Type KType C2
Type C
Type E
Over 8”
Under 1” 3-5”
1-3”
5-8”

Do you have all of these????
•Scale Bar/Ratio
•Data Sources
•Classification
Methodology
•North Arrow
•Map View
•Print Date
•Data Date
•Neatline
•Legend
•Logo
•Location of “Plot file”

Cartographic Components
Clarity & Legibility
• Visual Contrast
• Visual Balance
Manipulate graphic elements
• Color
• Text Selection
• Symbol Selection
text
Text
?
TEXT

Visual Contrast
• Basis for Seeing
– Aids differentiation
– Creates hierarchy
• Creating Contrast
– Color
– Value
– Size
– Shape
– Texture
Bridgerton
Riverdale
Gotham
Holbein
Bridgerton
Riverdale
GOTHAM Holbein

Visual Contrast: Examples
• Size
• Value

Creating Visual Hierarchy
Use line weight,
shading, & text
to create depth.

Color
• Hue (H) - What We Mean by “Color”
–Qualitative Symbols
Polychromatic
–Quantitative Symbols
Monochromatic/Dichromatic
• Value (V) - “Light and Dark”
–Quantitative Symbols
• Saturation (S) - Intensity of a Hue
–Least controllable
–Larger areas appear more intense

Color
• Clarify and Delineate Features
• More Details & Design Possibilities
• More Visual Interest
• Clarify Facts
Type A
Type KType C2
Type C
Type EOver 8”
Under 1” 3-5”
1-3”
5-8”
Qualitative
(Polychromatic)Quantitative
(Monochromatic / Dichromatic)

Color models
•Different models for different uses
•RGB (Red-Blue-Green)
–CRT display LIGHT
•CMYK (Cyan-Magenta-Yellow-Black)
–Printing/Plotting PIGMENT
•HSV (Hue-Saturation-Value)
–Primary Colors INTUITIVE
–ArcView‟s color model

HSV: ArcView‟s Color Model
Hue - What we mean by „color‟
Saturation - How much „color‟
Value - Light & dark of „color‟
All the colors of the rainbow
0 . . . . . . . . . . . . . . . . . . . . . . . . . . . . . . . . . . . . . . . . . . . . . . . . . . . . . . . . . . . 255
Adding color/pigment . . . . .
. . . . . Adding black

Manipulating HSV

Using HSV for effect
• Manipulate HSV to create colors that go well together
–Select the same color for polygon fill & outline
–Open ArcView‟s “Custom” color editor and drop the “Value” of
the outline, or turn it off together
–Create more contrast between line & polygon features

Perception of Graphics
• Eye Limitation
– 12 colors
– 7 Shades of the same color
• Texture vibration
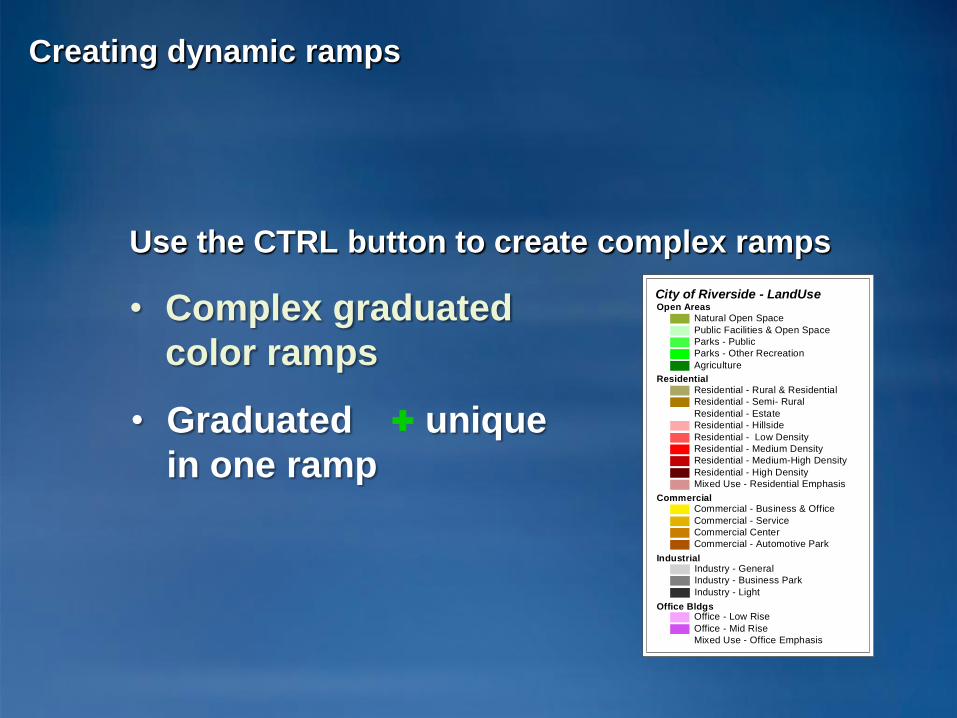
Creating dynamic ramps
Use the CTRL button to create complex ramps
• Complex graduated
color rampsDigital Elevation Model
94.738 - 243.516243.516 - 392.294392.294 - 541.071541.071 - 689.849689.849 - 838.626838.626 - 987.404987.404 - 1136.1821136.182 - 1284.9591284.959 - 1433.7371433.737 - 1582.5151582.515 - 1731.2921731.292 - 1880.071880.07 - 2028.8472028.847 - 2177.6252177.625 - 2326.4032326.403 - 2475.182475.18 - 2623.9582623.958 - 2772.7362772.736 - 2921.5132921.513 - 3070.291
+• Graduated unique
in one ramp
Open Areas
Natural Open Space
Public Facilities & Open Space
Parks - Public
Parks - Other Recreation
Agriculture
Residential - Rural & Residential
Residential - Semi- Rural
Residential - Estate
Residential - Hillside
Residential - Low Density
Residential - Medium Density
Residential - Medium-High Density
Residential - High Density
Mixed Use - Residential Emphasis
Commercial - Business & Office
Commercial - Service
Commercial Center
Commercial - Automotive Park
Industry - General
Industry - Business Park
Industry - Light
Office - Low Rise
Office - Mid Rise
Mixed Use - Office Emphasis
Residential
Commercial
Industrial
Office Bldgs
City of Riverside - LandUse

Labels
• Presence or absence of a label
assigns importance
– “Riverdale” is unimportant,
therefore it bares no label
Bridgerton
Riverdale
Gotham
Holbein
Bridgerton
Holbein
GOTHAM

Text Selection
• Qualitative
– Vary: color-H > style > font
• Quantitative
– Vary: CASE > size > font > color-H > color-H
• Be Aware of Text Color vs Background Color
• Limit Text to Three Fonts
– Use style, CASE, color-H and color-H

Label Placement
• Help User Read Faster and Easier
– Consistent Placement
– Resolve Ambiguity
Combine with symbol
selection to complete
differentiation

Point Symbol
• Geometric symbols
– Quantitative
– Qualitative
• Icons
– Quantitative
– Qualitative
• Symbols
– “Picture” images
– Qualitative

Line Symbols
Value
Size
Value
w/Direction
Size
w/Direction
Hue
Shape
Hue
w/Direction
Quantitative Qualitative

• Display Qualitative Classes
–TEXT Color-H Style Font
–POINT Color-H Marker Size Label
–LINE Color-H Marker Size Label
–AREA Color-H Fill/Outline Label
• Display Quantitative Classes
–TEXT Case Size Font Color-V
–POINT Size Color-V Label Marker
–LINE Size Color-V Label Marker
–AREA Color-V Fill/Outline Label
Note: Limit # of Text Fonts to ThreeText Color vs. Background Color
Symbol & Text Selection

Simplify, align & group
Open Areas
Natural Open Space
Public Facilities & Open Space
Parks - Public
Parks - Other Recreation
Agriculture
Residential - Rural & Residential
Residential - Semi- Rural
Residential - Estate
Residential - Hillside
Residential - Low Density
Residential - Medium Density
Residential - Medium-High Density
Residential - High Density
Mixed Use - Residential Emphasis
Commercial - Business & Office
Commercial - Service
Commercial Center
Commercial - Automotive Park
Industry - General
Industry - Business Park
Industry - Light
Office - Low Rise
Office - Mid Rise
Mixed Use - Office Emphasis
Residential
Commercial
Industrial
Office Bldgs
City of Riverside - LandUse
• Example: creating a complex
legend
– “Grouping” graphic elements
– “Align” individual & grouped
elements

Direction
Speed / Volume
Legend ideas
• Study maps for Legend ideas– Be creative
be careful!
– Simplify - Edit Predefined Legends
– Create adjacent color bar with dropped values
Hillshade legends
12 Million
20 Million
8 Million
6 Million
POPULATION
Hills
had
e S
cale

FINALLY . . .
• Does the end product actually fit the need?
• Enduser understand scale bar or ratio scale?
• Map date and data date clearly stated?
• Data source, projection, quality & quality issues
stated clearly?
• Sacrifice clarity for beauty?
• Include classification methods?
• Disclaimer?

Jonathon [email protected]
Online Resources @ ESRI• Resources.esri.com
• Mappingcenter.esri.com
• Store.esri.com

Jonathon [email protected]
BOOKS!
ESRI:Designing Better Maps: A Guide for GIS Users
Designed Maps: A Sourcebook for GIS Users
AMAZON:How to Lie with Maps
Colour Basics for GIS Users
BUY A
COLOR WHEEL!