gis-based environmental modeling with tangible interaction ... · abstract: we present a new,...
TRANSCRIPT

International Environmental Modelling and Software Society (iEMSs)7th Intl. Congress on Env. Modelling and Software, San Diego, CA, USA,
Daniel P. Ames, Nigel W.T. Quinn and Andrea E. Rizzoli (Eds.)http://www.iemss.org/society/index.php/iemss-2014-proceedings
GIS-based environmental modeling with tangibleinteraction and dynamic visualization
Anna Petrasova a, Brendan Harmonb, Vaclav Petrasa and Helena Mitasovaa
aDepartment of Marine, Earth, and Atmospheric Sciences, North Carolina State University, CampusBox 8208, Raleigh, North Carolina, USA ([email protected], [email protected], [email protected])
bCollege of Design, North Carolina State University, Raleigh, North Carolina, USA([email protected])
Abstract: We present a new, affordable version of TanGeoMS, a tangible geospatial modeling andvisualization system designed for collaboratively exploring how terrain change impacts landscape pro-cesses. It couples a physical, three-dimensional model of a landscape with geospatial modeling andanalysis through a cycle of scanning and projection. Multiple users can modify the physical model byhand while it is being scanned; by sculpting the model they generate input for modeling of geophysicalprocesses. The modeling results are then visualized by projecting images or animations back on thephysical model. This feedback loop is an intuitive way to evaluate the impacts of different scenariosincluding anthropogenic and natural landscape change. Integration with GRASS GIS, a free and opensource geographic information system, provides TanGeoMS with a variety of easily accessible geospa-tial analysis and modeling tools. To demonstrate the environmental modeling applications of TanGeoMS,we will demonstrate how development can be planned based on feedback from landscape processessuch as hydrologic simulation and wildfire modeling with variable fuel distribution.
Keywords: tangible user interface; landscape process modeling; visualization; GRASS GIS; Kinect
1 INTRODUCTION
Landscape has a major influence on physical processes such as water flow and sediment transport. Itaffects, both directly and indirectly, how we make decisions about development, transportation infras-tructure and agriculture. It is, therefore, crucial – not only for scientists, but also for decision-makers whomay not have a strong background in the natural sciences – to understand the often unexpected impactsof changes to the landscape. Complex computational models are used to study the impact of landscapechange; it can be relatively unintuitive to work with these models because we are separated from ourdata by multiple layers of abstraction when using a mouse, keyboard and digital display. With tangibleuser interfaces (TUIs), however, we can directly, haptically interact with a physical representation of dig-ital data. By coupling representation and input, we can more directly, more intuitively interact with ourdata [Ishii and Ullmer, 1997]. By linking physical models with digital models, TUIs can make environ-mental modeling more intuitive and scientific representations more engaging. A TUI can be used, forexample, to couple a physical model of terrain with its digital elevation model (DEM) [Piper et al., 2002;Kreylos, 2013].
The Tangible Geospatial Modeling System [Mitasova et al., 2006; Tateosian et al., 2010] extends theidea of a TUI that links a physical, malleable terrain model with its digital elevation model by integratinga GIS to broaden the capabilities of the system [Ratti et al., 2004]. GIS offers a set of ready-to-usetools for different types of geospatial analyses and simulations, as well as an interface for visualization.Editing a digital elevation model in a GIS or CAD (computer-aided design) program requires specializedskills and can be tedious even for experts. However, by modifying a physical model instead of its digitalrepresentation, users can experiment with different scenarios more intuitively and with much greater

A. Petrasova et al. / GIS-based environmental modeling with tangible interaction and dynamic visualization
ease. Once the modified model is scanned and imported into GIS, and the analysis is performed, theresult is projected back on the model to be evaluated. Users are encouraged to iteratively explore avariety of scenarios to reveal the impacts of modifying terrain and then decide upon the most suitabledesign. While data for real-world locations and the desired analyses must prepared beforehand by a GISexpert, the end users do not need to have any prior experience with GIS thanks to the simplicity of thetangible interface.
In this article, we present a new, improved version of TanGeoMS. Drawbacks of the first TanGeoMSprototype include the cost and weight of the equipment, the difficulties in setting up the system, and thelengthy response time. The substantial lag time between interaction and visualization detracted from theintuitive nature of the process and impacted the number of scenarios users would test. Our goal is toenhance intuition and learning, encourage and stimulate creativity and make the system more accessi-ble. Therefore, we developed a new, more flexible, affordable version of TanGeoMS capable of real-timeresponse and dynamic visualization. Since the feedback loop of modifying, scanning, computing andprojecting is the most important feature of TanGeoMS, we focused on automating the whole processso that it could run in real-time. With an automated workflow, users would be able to change the physi-cal model and get feedback quickly without having to manually run any processing. We hoped this fastfeedback loop would encourage people to experiment more as it would be very simple to test numerousscenarios.
2 METHODS
In this section we first describe the physical setup for TanGeoMS, including different types of physi-cal models. Then we discuss the software components and the workflow for modeling with real-timeresponse.
2.1 Physical setup
Figure 1. Physical setup: a) physical model; b) 3Dscanner; c) ceiling mounted projector; d) computerwith GIS software.
The new setup consists of 4 primary compo-nents: (a) a physical model that can be modifiedby a user, (b) a 3D scanning device, (c) a pro-jector and (d) a computer with GIS software andadditional software that connects all the compo-nents together. The physical model, laid on a ta-ble, is scanned by the scanning device mountedabove. When the scan is imported into the GISsoftware and processed, the projector projectsthe resulting image or animation directly onto themodified physical model so that the results areput into the context of the modifications to themodel.
We use the Microsoft Kinect for Windows scanner to acquire a 3D scan of the physical model. Our new,updated TanGeoMS is now affordable since the Kinect scanner is much less expensive than the 3D laserscanner that we had previously used. Furthermore, this small, lightweight scanner is highly portable andcan be easily mounted on a stand. Given the scanner’s limited angular field of view – 43° vertical by57° horizontal – the height of the scanner above the physical model depends upon the size of themodel. For smaller models (∼40 cm diagonally), the scanner should be mounted ∼0.5 m above themodel to get a reasonable resolution. We scan with 2 mm horizontal and vertical resolution, however theactual precision is lower due to the noise caused by the scanner. Scanning resolution deteriorates withincreasing distance from the model. Therefore, the size of the physical model is limited. We have foundthat a model size of ∼70 cm diagonally is ideal for larger models. The Kinect scanner is connected tothe computer as well as the projector. While we use a ceiling-mounted projector, the projector could alsobe mounted on a stand.

A. Petrasova et al. / GIS-based environmental modeling with tangible interaction and dynamic visualization
Initially, we built models by stacking layers of foam board cut along projected contours and then coveredthem with a layer of modeling clay [Mitasova et al., 2006; Tateosian et al., 2010]. Since this methodrequired a lot of manual work, we experimented with different approaches and materials. When buildingmodels manually, we now use a sand enriched with a polymer since it is easy to sculpt, sticks togetherand holds its form and is unaffected by humidity. We can also build models using automated processessuch as computer numerical control (CNC) routing (Fig. 2a), laser cutting, and 3D printing. Since amodel created from a solid material (such as a CNC routed model made of medium density fiberboard)is not malleable, we build a second model that is an inverse of the first and then mold a layer of sandbetween the two models, casting a precise yet malleable surface (Fig. 2b). This way we benefit from theprecision of computer-aided manufacturing and the flexibility of sand.
We typically work with models that represent real, geographic places. When manually building a modelof a real place from polymeric sand, we overlay and project various raster and vector layers of the place –such as the DEM, slope, and contours – as a guide. In addition to projecting the contours and elevationof the real area, we can continuously scan the model and then compute and project the differencebetween the DEM and the scanned elevation, thus highlighting places where we need to add or removesand in order to match the DEM (Fig. 2c). This way we can always rebuild or reset the model aftermodifying it. When building a model, we usually apply vertical exaggeration greater than 1 depending onthe horizontal scale of the model and local topography. Since the scanned DEM is scaled to real-worlddimensions, the GIS analyses are not affected by the vertical exaggeration.
(a) (b) (c)
Figure 2. Different methods of creating models: (a) a model carved with a CNC router; (b) a carvedmodel combined with a layer of molded sand; (c) a sand model sculpted manually using projectedcontours and a color map representing the difference between the current and desired states. Blueshows that sand should be added; whereas, red indicates that sand should be removed.
2.2 Software tools
There are several different software components that we use with TanGeoMS: the Kinect for WindowsSDK for scanning, GRASS GIS for processing scans, and our custom library that automates the entireprocess.
We wrote a simple application in C++ with the Kinect SDK to continuously scan the model and output afile with the point cloud. To connect TanGeoMS’s components, we developed a small library and a set ofscripts in Python which are able to process the scan and interface with GRASS GIS. The library containsmethods for handling different types of input data (e.g. georeferenced versus ungeoreferenced inputsand models with different shapes).
GIS is a crucial component of TanGeoMS as it is used to create a DEM from scanned data, to runanalyses or simulations, and to visualize data. GRASS GIS [Neteler et al., 2012], a free and opensource GIS, offers a variety of tools for topographic analysis, hydrologic and erosion modeling, or wildfiresimulation. Moreover, many highly specialized algorithms are implemented and accessible through theadd-on repository. It is very simple to combine different tools in a script using its Python API. While theprevious version of TanGeoMS used GRASS GIS, we have now fully integrated this GIS with TanGeoMSin order to easily automate the process and connect all of TanGeoMS’s components, thus enabling amore effective workflow.

A. Petrasova et al. / GIS-based environmental modeling with tangible interaction and dynamic visualization
2.3 Workflow
The TanGeoMS workflow is an interactive process in which users modify a physical model that is thenscanned, the scan is imported into GIS software, analysis is performed on the modified input, and thenthe result is projected back on the model, allowing the users to revise their modifications.
Before we start scanning, we first calibrate TanGeoMS to geometrically correct for any inaccuracy in theangle or direction of the scanner. This is needed because the scanner is very difficult to align preciselyperpendicularly to the model and uncorrected misalignments would result in a tilted scan. Next, wegeoreference the point cloud. Since we know the geographic extent of the area represented by themodel and the model orientation is aligned with the scanner, we only need to translate and scale thepoint cloud. Then, we import the scan as 3D points into the GIS and create a DEM, either by binning orby interpolation. Once we have the DEM, we can run the desired GIS analyses and project the resultsas color maps back onto the physical model. Then we can evaluate the impact of the changes from theprevious run, modify the physical model and repeat the entire process again, except for the calibrationprocess.
We automated this feedback loop so that the impact of changes to the physical model can be projectedback onto the model in real-time. Immediate feedback facilitates the testing of different scenarios, poten-tially resulting in better designs. The time between the updates is usually a few seconds, depending onthe size of the model and, most importantly, the analyses run on the scanned DEM. Since interpolatingthe DEM would slow down each run significantly, we use binning (the per cell point average of z-values)combined with smoothing to create the DEM. This way we can compute standard topographic analysesincluding slope, aspect, and flow accumulation relatively quickly. Approximate solutions can be used formore complex analyses and computationally intensive models to produce results that are less accurate,but still reasonable and relevant.
(a) (b) (c) (d)
Figure 3. Real-time water flow modeling: (a) initial state; (b) adding a check dam; (c) water flow whenhand was captured by scanner; (d) check dam filling with water.
To demonstrate a design process with real-time response we modeled overland water flow [Mitasovaet al., 2005] using a sand model based on a DEM of an existing study site. We have tried to capture stormwater and reduce runoff by building a small check dam on the model. Fig. 3 shows several snapshotswhich include Fig. 3a, the initial state, Fig. 3b, a user adding sand and shaping the check dam andFig. 3d, the change in the water flow filling the dam. In Fig. 3c we see water flow computed on ascan captured when the user’s hand was still modifying the model. This happens because we scancontinuously; therefore we always have to wait a few seconds after a change has been made to get aclean scan before we can evaluate the modifications.
3 APPLICATIONS
The value of TanGeoMS is that it enables a dynamic, experimentation-based learning process that com-bines creative exploration with geospatial analysis. This may lead to highly creative yet scientificallygrounded solutions. TanGeoMS can encourage interdisciplinary collaboration and exchange since usersfrom different disciplines such as land managers, landscape architects, engineers, and scientists can
A. Petrasova et al. / GIS-based environmental modeling with tangible interaction and dynamic visualization
simulatenously interact with the model. TanGeoMS has been used for a broad range of applicationssupported by the extensive set of geospatial analysis and modeling tools available in GRASS GIS. Tan-GeoMS can be used at a wide range of spatial scales depending upon the application and the scale ofthe intended real-world terrain modifications. It can be used for example at a fine scale to plan buildingmassings, at a coarser scale to study watersheds, and at an even coarser, regional scale to study amountain range. We have explored how dune breaches affect the extent of coastal flooding, the impactof different building configurations on viewsheds, cast shadows and solar energy potential, and the ef-fectiveness of various landscape designs for controlling runoff and erosion [Tateosian et al., 2010]. Herewe present two new applications. We evaluated the environmental impact of a development scenarioand then designed and tested alternatives. We also modeled the spread of a fire and then designed andtested fire-control measures.
3.1 Scenario planning with hydrology and sediment transport modeling
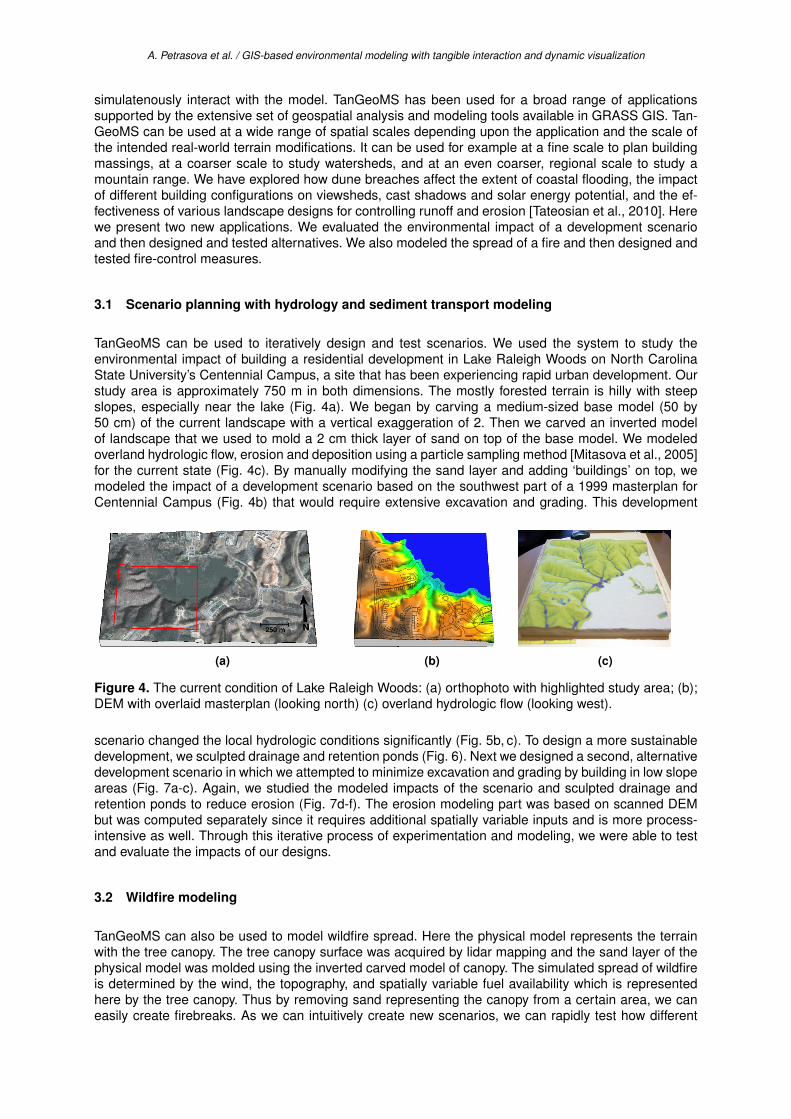
TanGeoMS can be used to iteratively design and test scenarios. We used the system to study theenvironmental impact of building a residential development in Lake Raleigh Woods on North CarolinaState University’s Centennial Campus, a site that has been experiencing rapid urban development. Ourstudy area is approximately 750 m in both dimensions. The mostly forested terrain is hilly with steepslopes, especially near the lake (Fig. 4a). We began by carving a medium-sized base model (50 by50 cm) of the current landscape with a vertical exaggeration of 2. Then we carved an inverted modelof landscape that we used to mold a 2 cm thick layer of sand on top of the base model. We modeledoverland hydrologic flow, erosion and deposition using a particle sampling method [Mitasova et al., 2005]for the current state (Fig. 4c). By manually modifying the sand layer and adding ‘buildings’ on top, wemodeled the impact of a development scenario based on the southwest part of a 1999 masterplan forCentennial Campus (Fig. 4b) that would require extensive excavation and grading. This development
(a) (b) (c)
Figure 4. The current condition of Lake Raleigh Woods: (a) orthophoto with highlighted study area; (b);DEM with overlaid masterplan (looking north) (c) overland hydrologic flow (looking west).
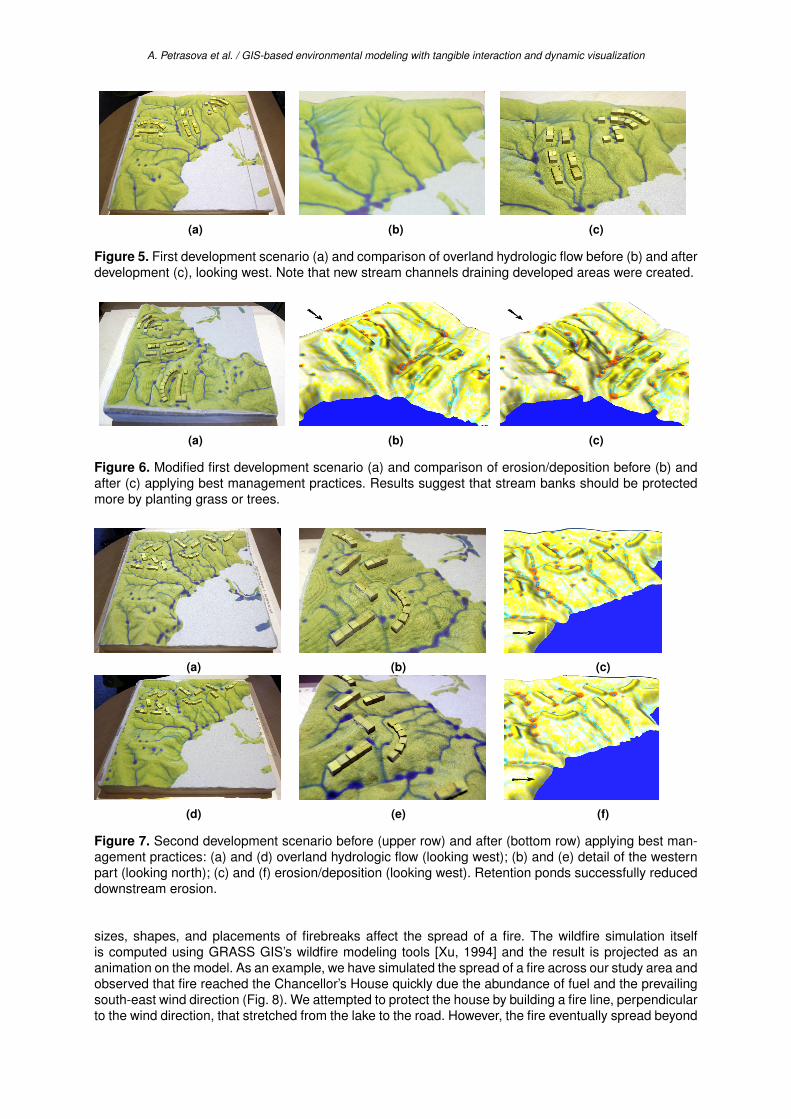
scenario changed the local hydrologic conditions significantly (Fig. 5b, c). To design a more sustainabledevelopment, we sculpted drainage and retention ponds (Fig. 6). Next we designed a second, alternativedevelopment scenario in which we attempted to minimize excavation and grading by building in low slopeareas (Fig. 7a-c). Again, we studied the modeled impacts of the scenario and sculpted drainage andretention ponds to reduce erosion (Fig. 7d-f). The erosion modeling part was based on scanned DEMbut was computed separately since it requires additional spatially variable inputs and is more process-intensive as well. Through this iterative process of experimentation and modeling, we were able to testand evaluate the impacts of our designs.
3.2 Wildfire modeling
TanGeoMS can also be used to model wildfire spread. Here the physical model represents the terrainwith the tree canopy. The tree canopy surface was acquired by lidar mapping and the sand layer of thephysical model was molded using the inverted carved model of canopy. The simulated spread of wildfireis determined by the wind, the topography, and spatially variable fuel availability which is representedhere by the tree canopy. Thus by removing sand representing the canopy from a certain area, we caneasily create firebreaks. As we can intuitively create new scenarios, we can rapidly test how different
A. Petrasova et al. / GIS-based environmental modeling with tangible interaction and dynamic visualization
(a) (b) (c)
Figure 5. First development scenario (a) and comparison of overland hydrologic flow before (b) and afterdevelopment (c), looking west. Note that new stream channels draining developed areas were created.
(a) (b) (c)
Figure 6. Modified first development scenario (a) and comparison of erosion/deposition before (b) andafter (c) applying best management practices. Results suggest that stream banks should be protectedmore by planting grass or trees.
(a) (b) (c)
(d) (e) (f)
Figure 7. Second development scenario before (upper row) and after (bottom row) applying best man-agement practices: (a) and (d) overland hydrologic flow (looking west); (b) and (e) detail of the westernpart (looking north); (c) and (f) erosion/deposition (looking west). Retention ponds successfully reduceddownstream erosion.
sizes, shapes, and placements of firebreaks affect the spread of a fire. The wildfire simulation itselfis computed using GRASS GIS’s wildfire modeling tools [Xu, 1994] and the result is projected as ananimation on the model. As an example, we have simulated the spread of a fire across our study area andobserved that fire reached the Chancellor’s House quickly due the abundance of fuel and the prevailingsouth-east wind direction (Fig. 8). We attempted to protect the house by building a fire line, perpendicularto the wind direction, that stretched from the lake to the road. However, the fire eventually spread beyond

A. Petrasova et al. / GIS-based environmental modeling with tangible interaction and dynamic visualization
our fire line due to the presence of low lying vegetation beside the road. Nevertheless the firebreakslowed the spread of the fire significantly, potentially giving firefighters more time to act.
(a) (b) (c)
Figure 8. (a) Tree canopy in detail; (b) and (c) wildfire simulation before and after adding a firebreak.
4 DISCUSSION
There were two major challenges in developing TanGeoMS: the accuracy of representation and thespeed of real-time response. The inaccuracy arises as the physical model is a simplification of realitywhich is further modified manually and then scanned. We are trying to address these issues by usingcomputer aided manufacturing to generate more precise physical models. However, we consider Tan-GeoMS to be primarily a 3D sketching tool, which enables users to rapidly explore different scenarios.To save time and effort, we only need to compute precise models for the most promising of scenarios.Modeling with real-time response is limited by the current scanning technology, modeling algorithms andprocess automation. While the Kinect scanner enables fast scanning, certain TanGeoMS applicationswould benefit from higher precision scanning. It is necessary therefore to continue exploring the potentialof other scanning technologies. The speed of real-time response is obviously limited by the processingtime of the analyses selected. The automation of the process is complicated by usage of different typesand shapes of models and variations in physical setup. However, due to the benefits of the fast feedbackloop, we think it is worth trying to overcome these obstacles. Being able to see the impact of a changeimmediately highlights the cause and effect relationship. Moreover, users are able to test more scenariosin a shorter time.
5 CONCLUSION
We have presented an enhanced, affordable version of the Tangible Geospatial Modeling System ca-pable of modeling and visualization with both real-time and near real-time response. The updated Tan-GeoMS has an automated real-time feedback loop that transforms changes to a physical model into adigital form, computes analyses, and projects the results back onto the model. This automated real-timefeedback loop is a powerful method for testing multiple landscape-altering scenarios without having tointeract directly with a GIS. By using the inexpensive Kinect scanner and GRASS GIS, a free, opensource GIS, we made TanGeoMS financially affordable. Furthermore, we have made TanGeoMS evenmore intuitive to use by creating easily malleable models built with innovative technologies and mate-rials. By linking intuitive phyiscal modeling with geospatial analysis, TanGeoMS enables collaborative,interdisciplinary, and creative problem solving that is grounded in science. The design process becomesa cycle of physical experimental, computational analysis, critical reflection, and creative re-imaginationor refinement. We have demonstrated how TanGeoMS can be used for urban planning and fire crisismanagement. These examples represent just a few of TanGeoMS’s many potential applications.
REFERENCES
Ishii, H. and Ullmer, B. (1997). Tangible bits: towards seamless interfaces between people, bits andatoms. In Proceedings of the SIGCHI conference on Human factors in computing systems - CHI ’97,

A. Petrasova et al. / GIS-based environmental modeling with tangible interaction and dynamic visualization
pages 234–241, New York, New York, USA. ACM Press.
Kreylos, O. (2013). Augmented Reality Sandbox.
Mitasova, H., Mitas, L., Ratti, C., Ishii, H., Alonso, J., and Harmon, R. (2006). Real-time landscapemodel interaction using a tangible geospatial modeling environment. IEEE Computer Graphics andApplications, 26(4):55–63.
Mitasova, H., Thaxton, C., Hofierka, J., McLaughlin, R., Moore, A., and Mitas, L. (2005). Path samplingmethod for modeling overland water flow, sediment transport, and short term terrain evolution in OpenSource GIS. In Miller, C., Farthing, M., Gray, V., and Pinder, G., editors, Proc., XVth International Conf.on Computational Methods in Water Resources (CMWR XV), pages 1479–1490. Elsevier.
Neteler, M., Bowman, M., Landa, M., and Metz, M. (2012). GRASS GIS: a multi-purpose Open SourceGIS. Environmental Modelling & Software, 31:124130.
Piper, B., Ratti, C., and Ishii, H. (2002). Illuminating clay: a 3-D tangible interface for landscape analysis.In Proceedings of the SIGCHI conference on Human factors in computing systems Changing ourworld, changing ourselves - CHI ’02, page 355, New York, New York, USA. ACM Press.
Ratti, C., Wang, Y., Ishii, H., Piper, B., and Frenchman, D. (2004). Tangible user interfaces (tuis): a novelparadigm for gis. Transactions in GIS, 8(4):407–421.
Tateosian, L., Mitasova, H., Harmon, B. A., Fogleman, B., Weaver, K., and Harmon, R. S. (2010). TanGe-oMS: tangible geospatial modeling system. IEEE transactions on visualization and computer graphics,16(6):1605–12.
Xu, J. (1994). Simulating the Spread of Wildfires Using a Geographic Information System and RemoteSensing. PhD thesis, New Brunswick, NJ, USA.