gis and hydrographic surveying for port - cadcorp · pdf filegis and hydrographic surveying...
TRANSCRIPT


GIS and Hydrographic surveying for Port
AuthoritiesRussell Bird
Group Hydrographic and Dredging Manager
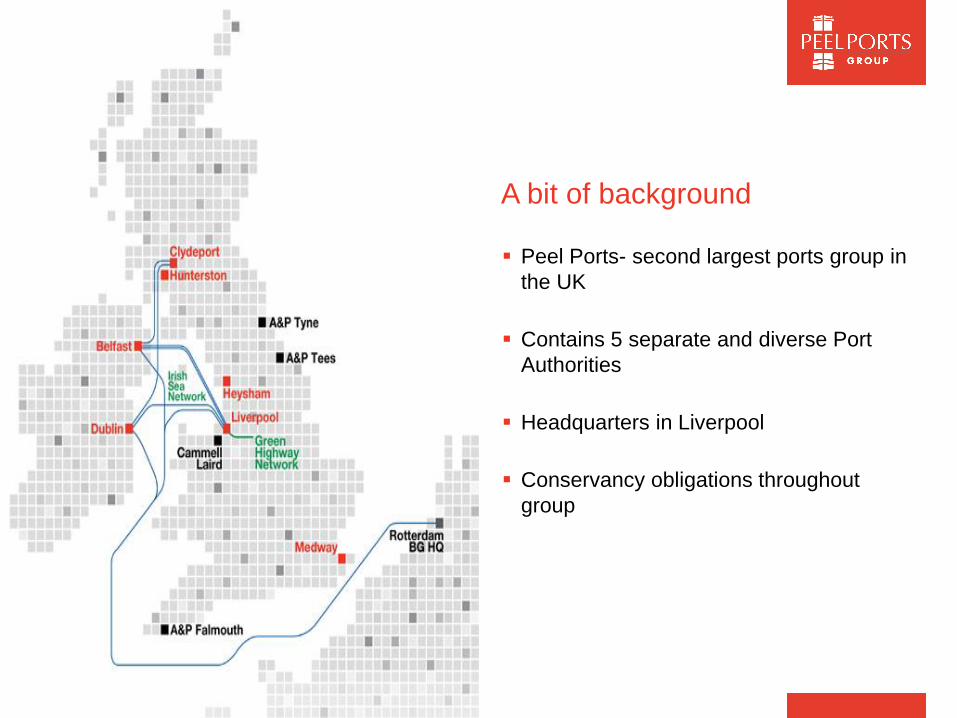
A bit of background
Peel Ports- second largest ports group in
the UK
Contains 5 separate and diverse Port
Authorities
Headquarters in Liverpool
Conservancy obligations throughout
group

Group Marine Department
Appointment of Group Harbour Master October 2013
Centralised Hydrographic and dredging function completed August 2014
Combination of in house data production and 3rd party operations
Larger emphasis on data management
Group Standardisation

The role of GIS in centralised function
Issue of disparate practises and presentation across group from previous 3
hydrographic departments
Requirement to standardise into instantly recognisable Peel Ports survey chart
Requirement for improved data management practises for group hydrographic
data
Oppurtunity for development as practises and structure matures and develops
Combination of effort from Oceanwise and permanent GIS technician to
deliver requirement, training and ongoing development

The Process- Sorted soundings input
Data processed in house or by 3rd party company and signed of for QA/QC
Uploaded into data server
Data sorted according to charting scale and saved in standard data
structure
Separate .swd for each charting area, opened in Cadcorp, containing
Soundings bds, contours bds, mapping and installations dbs. Sorted Data
input using Oceanwise Maritime Toolbar- added to soundings bds
Contours uploaded from dxf source file and replicated into bds

The Output
Separate Print swd for each survey area- uploaded into Map Modeller after
all final check made in data swd
Information is simply changed such as date of survey, surveyor and survey
number
Published!


Further development- Presentation
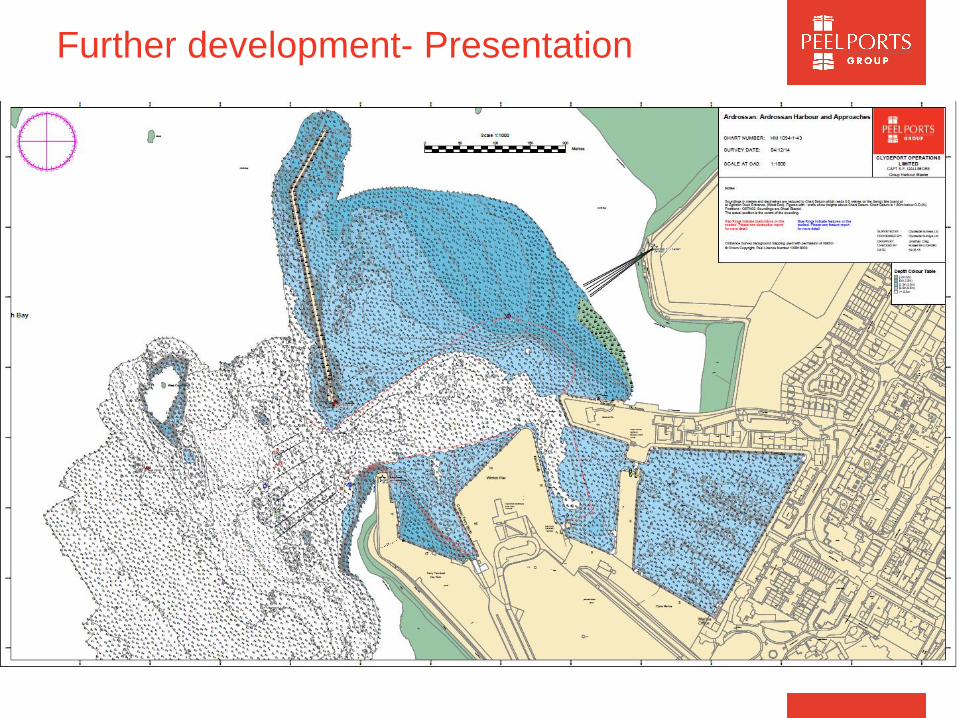
Further development- Presentation

In summary
Charting through GIS has enabled and ensured good practise in terms of
approach to data management and group marine strategy
Single changes requested by GHM can be swiftly put into practise
Streamlining of process- surveyors can now produce charts within minutes if
required for critical operations
Centralised database of AtoNs, installations and obstructions

Any Questions?
Thanks