getting research statistics for the … · web viewthe employment figures for the biggest...
TRANSCRIPT
Proceedings of the tenth seminar
Education and Training Statistics and the functioning of
Labour Markets
Thessaloniki, Greece, 11–12 May 2000
10th CEIES Seminar – Education and Training Statistics 1

2 10th CEIES Seminar – Education and Training Statistics

CONTENTS
Page
1st day: Part 1 : Current uses of education and training statistics
The Eurostat data sources combining education/training and labour market statistics
L. Freysson..........................................................7
Training of adult workers in OECD countries: measurement and analysis
P. Swaim & E. Stancanelli.................................23
Graduation and transition to the labour market according to the register based statistical system
P. Myrskylä........................................................27
Transition from education to the labour market R. Andersson......................................................40
Educational expansion and skill creation: the generation-based approach
C. Béduwé & B. Fourcade.................................53
The users view M. Carvalho.......................................................71
Current uses of education and training statistics: the Portuguese situation
F. Marques.........................................................88
The structure of education systems - an international comparison Results and problems from an Austrian perspective
A. Schneeberger.................................................92
Statistics on labour market problems in the public sector in the Netherlands: experiences of a user
L. Herweijer.....................................................106
Analysis of Labour Market Outcomes from Education and Training in England
C. Littler...........................................................116
Part 2 : The future and future developments
Surveys on education and training in Italy A. Micali..........................................................133
Statistics on adult training - conceptual problems
H. Naesheim.....................................................147
Statistics on in-service training and further education in Norway
K. J. Einarsen...................................................152
Changes in labour markets and their impact on educaiton and training statistics
R. Fox..............................................................158
Education/employment interfaces - Skills and statistical coverage
J. Planas & G. Sala..........................................163
The users view D. Paparella.....................................................172
10th CEIES Seminar – Education and Training Statistics 3
2nd day Part 3 : Conclusions and recommendations
Usable Education and Training Statistics – is it possible?
E. Graversen....................................................191
Summing up M. van Herpen.................................................193
List of participants..................................................................................................................... 201
4 10th CEIES Seminar – Education and Training Statistics

1st day:PART 1:
CURRENT USES OF EDUCATION AND TRAINING STATISTICS
10th CEIES Seminar – Education and Training Statistics 5

6 10th CEIES Seminar – Education and Training Statistics

THE EUROSTAT DATA SOURCES COMBINING EDUCATION/TRAINING AND LABOUR MARKET STATISTICS
Laurent Freysson1
EurostatUnit E-3: Education, health and other social fieldsBâtiment Jean MonnetRue Alcide de GasperiL-2920 [email protected]
1- Introduction : the challenge of adapting education and employment statistics to new and changing social policy concerns :
Due notably to the ongoing evolution towards a knowledge-based society, social policy concerns have changed a lot during the last ten years. For instance, some new concepts such as lifelong learning or employability have appeared and have become new keywords. In the field of education and training, Eurostat has managed to adapt to this evolution by seeking a larger diversification in the different statistical sources it is responsible for, and particularly in the context of the Labour Market's most recent requirements.
For that purpose, new and targeted data collections have been initiated during the last few years, for instance on training provided by enterprises or on ‘Vocational education and training’ programmes. At the same time, efforts have been made in order to optimise the potentialities of already existing harmonised surveys which are not focused on education and training issues but which include related items.
The purpose of this paper is first to provide briefly an overview of Eurostat data sources, which combine both education and labour market information. The second part presents Eurostat's contribution to the improvement of data comparability in general. Finally, a number of medium-term projects that are already being carried on or are about to start are examined.
2- The potential of existing data sources
Among the key issues relating to the links between education/training and the labour market, there is a whole set of areas which can be covered (even if only partially for some of them) by using data from various Eurostat data collections; these areas include for instance: the raising of educational levels, the role and recognition of vocational qualifications, school drop-outs and social exclusion, unemployment risks according to the level of education attained, the correlation between qualification and type of occupation, the transition from school to the labour market, foreign-language learning, participation in education and the socio-economic environment, participation in continuing education by socio-professional category or by level of education, etc.
The potential usefulness of these surveys also lies in the flexibility some of them have in allowing cross-tabulations of different variables. Indeed, most of the definable indicators can be broken down by gender, age group or region. At present, we can identify seven Eurostat harmonised data collections which tackle education/training and employment issues :
1 With the assistance of several Eurostat colleagues : Anne Clémenceau, Katja Nestler, Africa Melis, Ana Nobre, Peter Whitten, Spyridon Pilos and Michail Skaliotis.
10th CEIES Seminar – Education and Training Statistics 7

- The European Labour Force Survey (LFS)- The European Community Household Panel (ECHP)- The Structure of Earnings Survey (SES)- The Labour Cost Survey (LCS)- The Continuing Vocational Training Survey (CVTS)- Vocational Education and Training (VET) data collection- The Labour Market Policies (LMP) data collection
A major concern in these surveys is data quality control. There is a potential for keeping quality high, but as long as there is any uncertainty about the quality of the information, any attempt at analysis would be of no or very little value . This is why we attach so much importance to close collaboration between people in charge of the respective surveys with education and training specialists in the Member States and/or at Eurostat.
Another important point is that the above list of surveys has not to be regarded as exhaustive; any new survey will be taken into account where appropriate.
Fig.1: Overview of the Eurostat sources combining Education/Training and Labour Market statistics
8 10th CEIES Seminar – Education and Training Statistics

2.1 The Eurostat Labour Force Survey (LFS) :
Objectives and main features :
The LFS is the most important comparable instrument for all kinds of labour market related analyses in the EU. It is designed to monitor the main changes taking place in the labour market and the trends in employment and unemployment. It consists of a sample survey of households and is carried out annually since 1983 in all EU Member states, EFTA countries and also now by most of the candidate countries from Eastern Europe. An important development is that the LFS is moving to a continuous survey, meaning that data will be more and more collected on a quarterly basis.
The Eurostat list of questions is defined by the Employment Statistics Working Party and represents some kind of a sub-sample of variables, which are included in the national labour force surveys.The main areas covered are :
- the employment characteristics of individuals : occupational status, sector of employment, working hours, working conditions, fixed-term employment, atypical forms of work etc...; income is an optional variable since 1998.
- search for employment : ways of searching, since how long, discouraged workers ...- education and training : current participation, highest level of education completed- each person's situation one year before the survey (longitudinal aspect)
Regarding education and training, the Community LFS was rather marginally concerned with this topic until 1988. A second experimental period (from 1988 until 1991) saw the introduction of questions on attainment level. Then, the 1992 revision of the LFS allowed the implementation of a real module of questions on education and training. Due to new policy concerns and the revision of the International Classification of Education (ISCED), the module was revised again and slightly enlarged in 1998.
The major advantages of the LFS are :- the freshness and the regularity of the data collected (latest data refer to 1999)- a certain degree of data comparability given the inclusion of common concepts, definitions and
methods,- a large sample size of more than 700 000 households (1.5 million individuals) at Union level
making possible numerous cross-tabulations since 1983 (in respect of the threshold values due to sampling errors)
- availability of the data in a centralised micro data base in Eurostat
But in order to be correctly used, the limits of the survey have to borne in mind as well.First of all, as a household survey, the responses depend largely on the way the respondent interprets the content of each question. Furthermore, the questions may be phrased quite differently in the national questionnaires.Secondly, in most cases, the survey only covers private households, and thus excludes people living in homes, boarding schools, hospitals, religious institutions ...Finally, time-series comparison may be affected by changes in the questionnaire, which occurred in 1992 and 1998.
Potential outcomes :
In the context of the analyses of the links between Education/Training and the Labour Market, the LFS already provides quantitative information on two main sets of indicators :
10th CEIES Seminar – Education and Training Statistics 9

a) indicators on current or recent participation in Education and Training activities :
The list of questions on participation in education or training includes the following heading:- participation or not in education or training during the past four weeks- type of instruction- level of this education or training- purpose- total length- usual number of hours of training per week
By combining different LFS variables, it is (at least theoretically) possible to distinguish different types of training :
1. “full-time” education in the sense that the person neither works, nor is unemployed
2. people who combine education and work as an apprenticeship-type programme3. people in continuing training4. people not in education, nor in training
Most popular indicators on participation in education or training that can be derived from LFS variables tackle topics such as :
- The increasing participation of young people in education (by age, gender, region and also by social origin)
- Adult training : who benefits ? who does not ? more women, more educated people, recent recruits.
- Status of young people regarding both participation or not in education/training and in the labour market (for different ages) : the distribution of these statuses can be used to have a first broad picture of school-to-work transitions
b) indicators based on attainment levels
Three questions relate to educational attainment level (from the LFS 1998 round) :- The highest level of education mainly opens up the possibility of relating educational
attainment to labour market characteristics such as unemployment or type of jobs. - The year when this level has been completed can be used as a proxy for the age when
people entered the labour market; assuming that after a certain age (depending on the level attained), this date would not correspond to the entry on labour market but, instead, would provide information on lifelong learning.
- Finally, information is collected on whether or not people have received any vocational training in order to see if people have benefited (and how) from such training in relation to others who have only a general education background.
The most popular indicators using attainment levels from LFS are :
a broad measure of human capital (the LFS is almost the unique source on attainment levels of the population) :- Population by level of education, by age groups, by gender - Percentage of the population aged 18 to 24 years, not in education, with low educational
attainment level (primary – lower - secondary) – used as a proxy for dropouts.
10 10th CEIES Seminar – Education and Training Statistics

Outcomes on the labour market :
About unemployment, key questions are : Is the risk of unemployment greater for school-leavers ? What is the role of training with regards to unemployment ?
Relevant indicators that can be calculated by educational levels from the LFS are for instance :- Unemployment rates (or ratios), - Risks of long-term unemployment, - Mobility of unemployed from year t-1 towards the various states of the labour market:
About employment : do young people have special working conditions ? What relationships exist between the education and training people have received and employment ?
Relevant indicators that can be calculated by educational levels from the LFS are for instance :- Employment rate (or population ratio)- Employment mobility - The various professional statuses - The nature of the work contract- Full/Part-time working hours, Involuntarily part-time jobs - Occupations - Type of enterprises according to the size of the local unit and sectors of activity
A new perspective : the Ad hoc module on Transition from school to working life in the LFS 2000
In order to enrich the current potential of the Eurostat LFS for analysing the transition from school to work, an ad-hoc module of questions is being organised in the context of the 2000 spring survey. Additional data will be then collected from persons who have left education in the last ten years on the following items :- Education experience: fields of initial education/training, date when people left education, - First job experience: time spent to get a first significant job since leaving education, duration
and occupation of this job - Existence of any unemployment spells since leaving education, duration of the longest one- Socio-economic origin: Educational level of parents
All Member States are participating in the module with the exception of Germany. The Netherlands and the UK will use a slightly shorter version of the module.
In terms of indicators, the ad hoc module on transition should allow:- A more comparable information on the group of ‘school-leavers’ which can be defined from the
LFS- A better measure of school drop-outs and also one possibility for assessing who may benefit
from a “second chance” education experience- To analyse the correspondence between field of training and occupation- Providing new elements aimed at measuring what a successful transition can be (time spent to
get a first job after end of studies, analysis of current labour market situation by education received : when ?, level ? field of education/training ? where?)
First comparative results should be available early in the year 2001. Within the European Commission Leonardo da Vinci II programme, the opportunity to reproduce the module in 2004
10th CEIES Seminar – Education and Training Statistics 11

will be evaluated as well as the feasibility of a specific survey on school leavers or on a youth cohort at an international level.
2.2 The European Community Household Panel:
Objectives and main features :
The ECHP survey presents comparable micro-level (persons/households) data on income, living conditions, housing, health and work in the EU Member states. The survey follows the same private households and persons over consecutive years from 1994. In 1995 over 60,000 households were surveyed.
This database is only available in its entirety on CD-ROM. It is possible for researchers to buy the data. Some aggregated data are available for consultation in New Cronos, Eurostat's reference database.
Potential outcomes :
Indicators include: income from work, private income, income distribution, social exclusion, poverty, housing, health, medical care, retirement, unemployment and education.
In relation with education and training, there are two different types of information that can be drawn from ECHP data :
a) Relatively unique potential of cross-sectional information on different topics :- Participation in education/training (by age and type of education) during a whole reference
year - Participation in language courses during a whole reference year- Career destination of leavers from initial education/training (full-time job, unemployment,
compulsory military/community service, other), 1, 3 and 5 years after leaving - Employment characteristics (occupation, industry, earnings, duration of current
employment) 1, 3 and 5 years after leaving initial education/training- The career destination of those with higher education qualifications (taking into account the
year in which the qualifications were gained), etc.- Percentage of adult population (aged 25 to 64) participating in a given year in training
under a scheme related to employment
b) As a longitudinal survey, dynamic analyses are possible on: - The quality of the school-to work transition- The duration and number of unemployment spells- The stability of job enrolment- The evolution of earnings by educational level
Future perspective of the ECHP :
A decision by the SPC was taken last year to continue the existing ECHP until 2002 with essentially the same structure and content.For the longer term, that is from 2003 onwards, the survey will probably move towards an EU-harmonised social survey centred mainly on income and living conditions. The content of the future survey will be defined in terms of the new possibilities it can bring to the European system of social statistics.
12 10th CEIES Seminar – Education and Training Statistics

As to the structure and technical arrangements of the survey, the choice between a panel and a cross-sectional survey would need to be re-debated. A key issue is to determine whether the needs for dynamic data linked at micro level (income with labour, health, education…), required e.g. for the longitudinal analysis of social exclusion, justify the complexity and cost of a multi-purpose panel survey.
Possible options go therefore from “continuing the existing ECHP“ to “launching a new, fully revised panel survey” or “launching a multi-purpose EU-harmonised cross-sectional survey centered essentially on income and labour (involving, where possible, adaptation of existing national cross-sectional social surveys)”… Combinations of both the cross-sectional and panel approaches are also options that will be carefully considered. In particular, areas such as Foreign Languages or Information and Communication Technologies are likely to be tackled in this new survey.
2.3 The Structure of Earnings Survey (SES)
Objectives and main features :
The purpose of the Statistics on the Structure and distribution of Earnings (SSE) is to analyse the statistical relationship between the level of remuneration, individual characteristics of employees (sex, age, occupation, length of service, educational attainment levels etc.), and their employer (economic activity of the local unit, existence of collective agreement on pay, total number of persons employed etc.).
On four occasions between 1966 and 1978, a Community survey of the structure and distribution of earnings in industry, trade, banking and insurance took place on the basis of Council Regulations. Following a break of almost twenty years, a new set of Statistics on the Structure of Earnings (SSE) for the EU is available. These data, relating to the 1995 financial year (with the exception of France (1994) and Austria (1996)) were collected in accordance with Council Regulation (EC) No. 2744/95.
In some ways the 1995 data collection reflects some traditional limitations of these statistics. Self-employed persons and those working for businesses with less than ten employees were excluded from the statistics due to the greater difficulty of collecting from such sources. Furthermore, the statistics do not cover the entire economy. Agriculture and fisheries are omitted and only a part of services is included (NACE Rev. 1 G-K). Public administration, education and health are not covered in the SES.
The common form was as micro-data (that is, individual records corresponding to a single individual in the sample). National confidentiality restrictions made this impossible in the case of some Member States, which therefore sent their data in the form of tables.
The data are available for consultation in New Cronos, the main database available at Eurostat in the social and economic area.
10th CEIES Seminar – Education and Training Statistics 13

Potential outcomes :
The collection covers earnings for EU countries, both in national currency and ECU. Hourly, monthly and annual data is available, as are breakdowns according to :- employers characteristics : main economic activity, geographical location, form of economic
and financial control (fully state-owned, mainly state-owned, private, other), existence of collective agreement on pay, minimum number of paid annual holidays per employee, total number of persons employed (employees and “others”)
- employees characteristics : age, sex, occupation (according to the ISCO-88), highest completed level of education, length of service within the enterprise, type of contract of employment (full/part-time, fixed-term, trainee), working-time
In relation with education and training, the main interest of SES data is that it allows analysis of the dependency of salary on level of education.
Future perspective :
According to Council Regulation n° 530/99, the next such survey is planned for 2002. Afterwards, the survey will be conducted every four years and it is planned to cover all sectors of economy (at NACE 2-digit level). Pilot studies on feasibility will be carried out in order to look at the possible extension of the survey in terms of sector of economy. Such studies are also planned for small enterprises with less than 10 employees.
2.4 The Labour Cost survey (LCS)
Objectives and main features :
The Community surveys of labour costs are the only statistical instruments providing detailed comparable data on wages and related employer contributions in the Member States. The surveys on labour costs are at present carried out every four years, the latest refer to 1996 and cover the fifteen Member States of the European Union plus Iceland and Norway. Data for Italy and Sweden relate to 1997. The legal basis was the Council Regulation (EC) N° 23/97.
Potential outcomes :Data relate to the different components of the labour costs of local units:- compensation of employees: wages and salaries and employers' social contributions - vocational training costs- other expenditure- taxes- subsidiesData can be broken down by main activity of local unit (NACE Rev.1 – at a 3-digit level), regions (NUTS 1), size classes of local units.These statistics also include information on the staff employed (full-time and part-time) and on working time.
In relation to education and training, there are two potential areas of interest :
1. vocational training costs paid by the employer which include :- Remuneration of apprentices (minus any subsidies).- Social security contributions for apprentices payable by the employer, minus any reductions
granted.
14 10th CEIES Seminar – Education and Training Statistics

- all other vocational training costs not mentioned elsewhere: expenditure on vocational training services and facilities, depreciation, small repairs and maintenance of buildings and installations, excluding staff costs; expenditure on participation in courses; the fees of instructors from outside the enterprise ; expenditure on teaching aids and tools used for training; sums paid by the enterprise to vocational training organisations, etc. Subsidies linked to vocational training should be deducted.
2. another interesting fact is that apprentices are covered. In the context of the LCS, apprentices refer to ‘all employees who do not yet fully participate in the production process and work either under an apprenticeship contract or in a situation in which vocational training predominates over productivity’. The statistics may cover the total number of hours worked by apprentices.
2.5 The Continuing Vocational Training Survey (CVTS) :
Objectives and main features:
The objective of the survey on continuing vocational training is to get extensive information on management’s attitude towards training, participants, providers, modes of delivery, costs and subjects of training offered by the enterprises to their employees.
Skill development by continuing vocational training in enterprises is seen as a critical factor in increasing economic performance and competitiveness as well as employment. The investment in human resources by enterprises reflects therefore also their contribution to the resolution of labour market and employment problems. Measures of investment in human resources are becoming important indicators of the present and future achievement of enterprises and the economic and social conditions in general. Understanding the extent, the efficiency and the limits of training offered by enterprises is a prerequisite for focussing supplementary training and support actions.
After a first survey on continuing vocational training in enterprises (CVTS1) has been conducted in 1994 (covering the then 12 Member states), the growing policy interest in data together with the demand for CVT data to cover the 15 Member States led the Commission to decide to carry out a second Continuing Vocational Training Survey (CVTS2) in 2000. The survey is now being carried out in the EU Member States, in Norway and also in nine pre-accession countries.
From 1995 the results of CVTS1 have been published on a national basis and from 1997 at European level. Results are also available in NewCronos, the main database at Eurostat.
On the basis of the experience with CVTS1, the methodology for CVTS2 is being reviewed. The guidelines being developed to carry out CVTS2 propose a basic common approach for the purpose of international comparability. In addition, flexibility is needed for countries to use their national experience and methods in order to attain high response rates and to get reliable data.
Enterprises are the population of interest for CVTS2 with 10 or more employees belonging to the NACE Rev. 1 sections C to K and O (which mainly excludes Agriculture and Fishing but also Education and Health sectors).
10th CEIES Seminar – Education and Training Statistics 15

Potential outcomes:
Data will be available on enterprises that provided training (trainer) and that did not provide training (non-trainers). Non-trainers will be asked for the reasons why they did not provide training. For trainers, data will be available with respect to CVT courses and CVT in the work situation and other forms. For the latter measures, qualitative data on participation broken down by occupational groups will be available.
Data on courses are structured as follows:Participants: Occupation (%); gender; target groupsHours: Internal/external courses; gender; fields of training; providersCosts: Fees/payments to providers; participants; trainers; premises etc; contributions to
funds; receipts from funds and other sourcesEvaluation: Procedures; reasons not to evaluate
Potential indicators derived from the data on CVT courses might be, among others, the proportion of enterprises providing training, the access rate, the average duration of courses and the ‘chance on participation’, also used as an ‘inequality measure’ with respect to a breakdown according to gender.
2.6 The Vocational Education and Training data collection (VET) :
Objectives and main features :
Based on administrative sources from EU and EFTA countries, the Vocational Education and Training Data Collection aims at describing the programmes for initial Vocational education and training (initial meaning in this context, ‘aiming at integration on the labour market’) in the 15 Member States (plus Iceland, Norway and Switzerland).
The VET project has been launched by the European Commission Directorate General in charge of Education (Task Force Human Resources at the time) and Eurostat, in collaboration with Cedefop.A feasibility study was carried out under the PETRA programme in 1994 and a pilot data collection of VET programmes offered to young people was carried out in 1995.
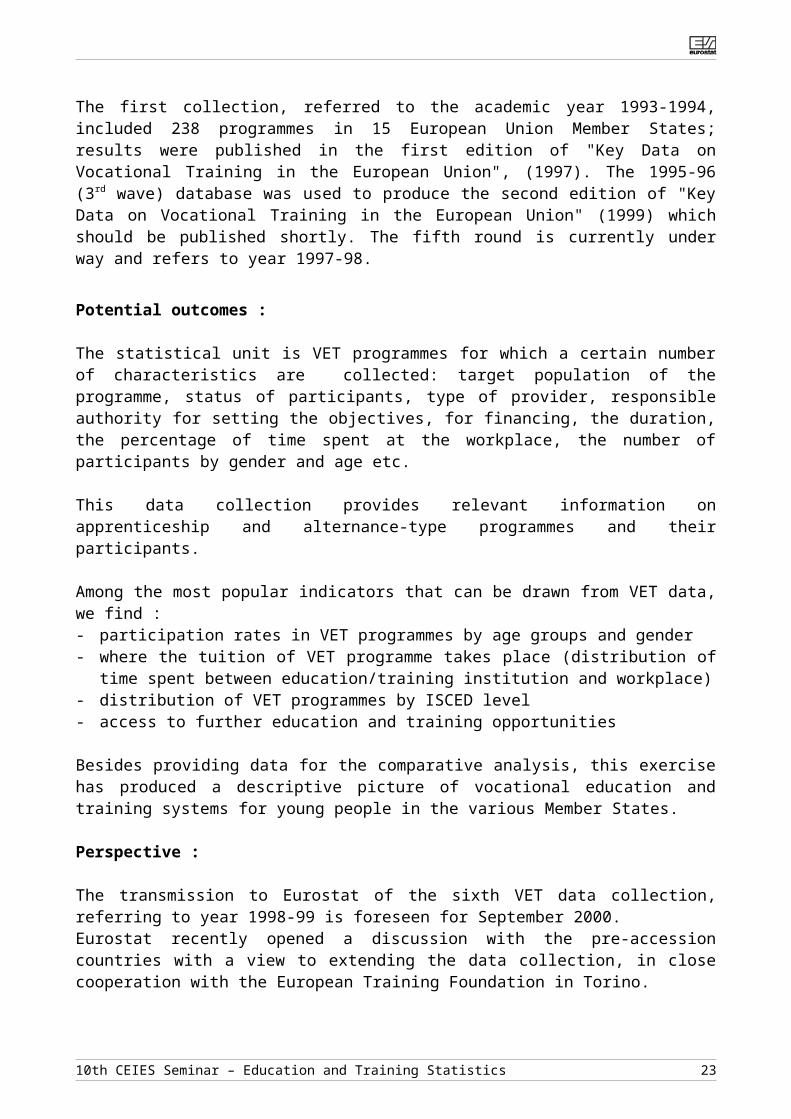
The first collection, referred to the academic year 1993-1994, included 238 programmes in 15 European Union Member States; results were published in the first edition of "Key Data on Vocational Training in the European Union", (1997). The 1995-96 (3rd wave) database was used to produce the second edition of "Key Data on Vocational Training in the European Union" (1999) which should be published shortly. The fifth round is currently under way and refers to year 1997-98.
Potential outcomes :
The statistical unit is VET programmes for which a certain number of characteristics are collected: target population of the programme, status of participants, type of provider, responsible authority for setting the objectives, for financing, the duration, the percentage of time spent at the workplace, the number of participants by gender and age etc.
This data collection provides relevant information on apprenticeship and alternance-type programmes and their participants.
16 10th CEIES Seminar – Education and Training Statistics

Among the most popular indicators that can be drawn from VET data, we find :- participation rates in VET programmes by age groups and gender- where the tuition of VET programme takes place (distribution of time spent between
education/training institution and workplace) - distribution of VET programmes by ISCED level- access to further education and training opportunities
Besides providing data for the comparative analysis, this exercise has produced a descriptive picture of vocational education and training systems for young people in the various Member States.
Perspective :
The transmission to Eurostat of the sixth VET data collection, referring to year 1998-99 is foreseen for September 2000.Eurostat recently opened a discussion with the pre-accession countries with a view to extending the data collection, in close cooperation with the European Training Foundation in Torino.
2.7 The Labour Market Policies data base :
Objectives and main features :
The Labour Market Policy (LMP) database aims to collect detailed information on labour market policy actions undertaken by the Member States of the European Union in a way that is consistent and comparable between different types of measure and between countries. It is intended that the database be used as a key tool in monitoring of the guidelines and objectives established as part of the Employment Strategy and endorsed by all Member States.The database focuses on the collection, from administrative sources, of information on public expenditure and on participants, both as stocks and flows. It also includes much qualitative information to describe the actions undertaken and to facilitate analysis.
A Pilot data collection has been carried out in 1999. First comparable results are expected by December-2000, with reference year 1998.
The scope of the LMP database is defined as including all labour market measures which can be described as:Public interventions in the labour market aimed at reaching its efficient functioning and to correct disequilibria and which can be distinguished from other general employment policy measures in that they act selectively to favour particular groups in the labour market.- Public interventions refer to measures taken by general government in this respect which
involve expenditure, either in the form of actual disbursements or of foregone revenue (reductions in taxes, social contributions or other charges normally payable).
- The scope of the database is also limited to labour market measures which are explicitly targeted in some way at groups of people with difficulties in the labour market – (target groups) : people who are unemployed, people in employment but in risk of involuntary job-loss, and inactive persons who are currently not part of the labour force but who would like to enter the labour market and are disadvantaged in some way.
Potential outcomes :
10th CEIES Seminar – Education and Training Statistics 17

The statistical unit in this module is the labour market measure, as defined above. The database then aims to collect data for a number of variables, both quantitative and qualitative, which apply to and describe the statistical unit so defined.
In relation to Education and Training, programmes which aim to improve the employability of the unemployed and other target groups through training, and which are financed by public bodies are covered in the LMP. Specific support to apprenticeship programmes is collected separately - programmes providing special support for apprenticeship schemes (using VET definition) through:- incentives to employers to recruit apprentices, or- training allowances for particular disadvantaged groups. Conventions- Courses that develop a person's ability to get a job - e.g. counseling in job application methods or interview techniques - should be considered as a form of job-search assistance - Apprenticeship schemes are considered part of the general education system and are therefore excluded from this data collection. Only programmes specifically developed to support the take-up of apprenticeship schemes should be considered here.- Continuous training measures generally available to all workers are outside the scope of this data collection.
The database classifies each LMP measure according to two criteria: classification by type of action, and classification by type of expenditure. One of the 9 categories which describe the type of action, is "Training" mentioned above. However, the database classifies LMP measures by type of expenditure as well, whereby three different recipients are distinguished: individuals, employers and service providers. The most important group of "service providers" will refer to training institutions.
18 10th CEIES Seminar – Education and Training Statistics

Fig.2: Education/Training and Labour Market joint issues : potential of Eurostat data
10th CEIES Seminar – Education and Training Statistics 19
Human CapitalCharacteristics
School to work Transition
Education/TrainingOutcome
Educational Characteristics- educational attainment level- date when highest level was obtained- vocational background- field of study (LFS ad hoc module on transition)- time since leaving school (LFS ad hoc module on transition)
Continuing Education and Training-participation in job-related education/training (CVTS,LFS)-employer supported and non-supported education and training (ECHP,CVTS)-further training through government programs (LMP)
Unemployment (LFS,ECHP)-duration-unemployment rates/ratio-unemployment by previous occupation-pre-unemployment activity- origin/destination of unemployed- discouraged workers
First significant job (LFS ad hoc module on transition)- time to get first job- duration- occupation
Labour Force Participation(LFS)-participation rates-proportion of youth in the labour force
Employment (LFS)- employment rates/ratios- origin/destination of employment (vis à vis situation one year before)
Current occupation (LFS)-relationship of job to education (occupation)-professional status- full-time/part-time- permanency - job-related training- branch of industry
Income (SES, LFS, ECHP)-earnings differences-total income-wages
Employment schemes (LMP, LFS)- specific employment measure
Apprenticeship-participation (LCS, VET, LFS)- costs (LCS)

3- The issue of data comparability : the EUROSTAT investment
a) The standard module on education and training for harmonised surveys :
A standard module of questions on education and training to be used in different harmonised surveys was developed in 1995-97; the main aim of this module was to make the ‘Education and training’ questions included in these surveys more comparable across countries and across surveys as well. The module makes the information collected from participants and potential participants to education and training more comparable and objective. It improves, in particular, available indicators to monitor the employment guidelines implementation, the evolution of the practice of life-long training, the transition from school to active life.This module has been implemented for the first time in the 1998 Labour Force Survey.The question on attainment levels in the Structure of Earnings Survey 2002 has also been redesigned according to the standard scheme.UNESCO presented this standard module as a model to follow at an international meeting in Canada in April 1999. Due to recent developments, the standard module is likely to be re-discussed in the very near future.
b) Work on harmonisation ex-post :
The existence of a common methodological framework in Eurostat surveys is not a definitive guarantee for good cross-country comparability. Hence, considerable work is done within Eurostat in order to harmonise data.
For instance, this concerns :- identification and possible imputation of non-answers- bilateral contacts with countries in order to take into account some national particularities which
are not obviously visible from the data- possible recodification of data at Eurostat - comparison between successive surveys- comparison with other sources (e.g. : data on attainment levels from OECD and Eurostat)
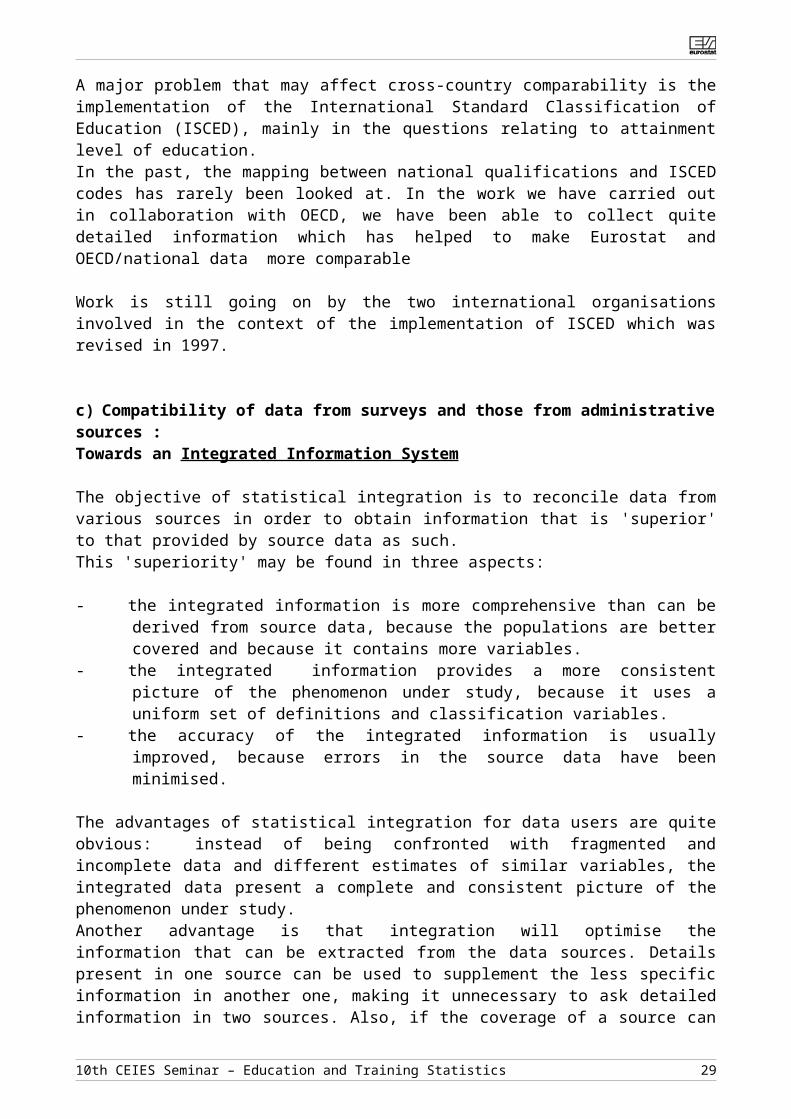
A major problem that may affect cross-country comparability is the implementation of the International Standard Classification of Education (ISCED), mainly in the questions relating to attainment level of education.In the past, the mapping between national qualifications and ISCED codes has rarely been looked at. In the work we have carried out in collaboration with OECD, we have been able to collect quite detailed information which has helped to make Eurostat and OECD/national data more comparable
Work is still going on by the two international organisations involved in the context of the implementation of ISCED which was revised in 1997.
c) Compatibility of data from surveys and those from administrative sources : Towards an Integrated Information System
The objective of statistical integration is to reconcile data from various sources in order to obtain information that is 'superior' to that provided by source data as such.This 'superiority' may be found in three aspects:
20 10th CEIES Seminar – Education and Training Statistics

- the integrated information is more comprehensive than can be derived from source data, because the populations are better covered and because it contains more variables.
- the integrated information provides a more consistent picture of the phenomenon under study, because it uses a uniform set of definitions and classification variables.
- the accuracy of the integrated information is usually improved, because errors in the source data have been minimised.
The advantages of statistical integration for data users are quite obvious: instead of being confronted with fragmented and incomplete data and different estimates of similar variables, the integrated data present a complete and consistent picture of the phenomenon under study. Another advantage is that integration will optimise the information that can be extracted from the data sources. Details present in one source can be used to supplement the less specific information in another one, making it unnecessary to ask detailed information in two sources. Also, if the coverage of a source can be supplemented with other information, there will be no need to extend the coverage of this source.Furthermore, statisticians may benefit from integration, because it generally leads to a better understanding of the strengths and weaknesses of data sources and because it generates information on how to improve them. An overall effect of integration may be that it stresses the need for co-ordinated definitions and classifications, which in the end will lead to better cohesion of the statistical system and improved efficiency in the production of statistics.
A first study led in collaboration with the Dutch statistical institute (CBS) has concentrated on an attempt to formulate a comprehensive and consistent system on participation in education and training (System of Education and Training Account – SETA project).
4- Conclusion – some major medium term perspectives:
A Task Force on measuring lifelong learning have just been created. It consists of representatives of Eurostat and other European Commission (DG Employment and Social Affairs, DG Education and Culture, DG Research and development), of European agencies (CEDEFOP, Eurydice), UNESCO and OECD as well as of experts from a limited number of EU countries that have experience in lifelong learning or adult education.The objective is to propose ways to measure lifelong learning, covering its multiple aspects, including its labour market relevant outcomes. This has to be done in a way that will cover the policy requirements of the European Commission in the international context and will provide an overview of the current situation at European, international and national level; a major concern shall be to avoid duplication in the development of ways to measure lifelong learning at international and European level.
Besides, there is no lack of subjects for potential new developments. Among the top-priority domains, work has still to be done in the following areas :
- Mobility of students- Income and living conditions/Level of education (analysis from the ECHP longitudinal
data)- Transition from school to the labour market (exploitation of the LFS ad hoc module)- Foreign Language Learning- Information and Communication and Technology : learning and skills acquired
This said, at the same level, we are absolutely aware that we still have to improve freshness and timeliness of the data we collect. For this purpose, there are not so many new solutions to be proposed given our current (but also future) resources. That is why we should give some thought as soon as possible to alternative ways of collecting data through shorter and less heavy processes.
10th CEIES Seminar – Education and Training Statistics 21

Along the same line, work has also to be done in order to better anticipate tomorrow’s needs. For instance, what kind of occupations will need to be filled in our economies, so that training provision may be adapted ? Most of our potential resides in historical-based analysis. We need to develop projections, not only in demography statistics but also on both education/training and labour market participation.
As a conclusion, it should be said that despite the difficulties and limits addressed above, Eurostat’s contribution to international statistics on education/training and labour market statistics is mainly twofold :- involvement in various projects to improve comparability and harmonisation of social statistics in general, and on this topic in particular- building databases from different data collections so that indicators and reports are made available to policy makers, journalists and the research community.
Finally, this paper would like to propose the following set of questions for the seminar to address, :- What is the general perception of Eurostat's products in connection with education/training
and labour market statistics ?- To what extent does Eurostat’s supply meet the demand from its clients ?- What can be suggested in terms of new directions for Eurostat to take ? (new fields to
cover, promote freshness, time-series potential, extension to new countries, developing the regional dimension etc …)
Bibliography :
‘Labour Force Survey – Methods and definitions – 1998 Edition’, Eurostat
“Potential use of the Community Labour Force Survey in the analysis of the Young”, in Youth Transitions in Europe : Theory and Evidence - Cereq, Document n°120 (1996)
“Labour Market Exclusion of Young People : Some Illustrations of the Situation in the European Union”, in Transitions in Youth: Combating Exclusion – ESRI, Dublin, 18-21 September 1997
‘Statistics on the structure and distribution of earnings , 1995, methods and definitions’, Eurostat
‘Community statistics on the level and structure of labour costs, 1996, list, definition and breakdown of the variables’, Eurostat
‘Proposals for the development of a System of Education and Training Accounts’, final report from the CBS for an Eurostat-DG EAC study, November 1999
“Key data on vocational training in the European Union”, First edition, joint publication Eurostat-DGEAC-Cedefop, 1997
“Key data on vocational training in the European Union – Training for young people”, Second edition, joint publication Eurostat-DG EAC-Cedefop, to be issued
“Education across the European Union – Statistics and Indicators 1998”, Chapter G, Eurostat, 1999
22 10th CEIES Seminar – Education and Training Statistics
TRAINING OF ADULT WORKERS IN OECD COUNTRIES:MEASUREMENT AND ANALYSIS *
Paul Swaim & Elena StancanelliOECD2, rue André PascalF - 75775 PARIS CEDEX [email protected]
Introduction
The critical importance of a highly skilled workforce in an increasingly “globalised” and “computerised” economy has become a commonplace. At the individual level, a good education is increasingly decisive for employment prospects and earnings levels [Blau and Kahn (1996); OECD (1997b,c)]. Human capital formation also appears to be an important precondition for the economic success of firms and national economies, although these links are more difficult to verify [Griliches (1996); OECD (1998a)]. This evidence suggests that policies encouraging wide participation in education and training are an important component of an overall strategy to achieve broadly-based prosperity.
The skills and competences of the workforce are the product of a large variety of learning activities that take place in diverse institutional contexts. While good initial education provides an essential foundation, learning continues through the working years. This suggests that national skill development systems should be assessed in terms of how effectively they support the goal of life-long learning. Consistent with this perspective, researchers assessing the potential economic contribution of human capital investments have increasingly emphasised the importance of continuing vocational training, including informal on-the-job learning [Lynch (1994); Booth and Snower (1996)].
Very little is known concerning international differences in continuing training or their causes and consequences [OECD (1991, 1993)]. Such information would be useful for assessing policy choices related to training, such as whether to encourage an overall increase in training levels or to attempt to redirect training investments toward groups in the workforce currently receiving little training. Prior research suggests that differences across national labour markets, such as those documented for labour turnover rates and the degree of wage compression, could have important effects on the incentives of businesses and workers to invest in training [Acemoglu and Pischke (1999); Lynch (1994)]. If these or other factors result in significant differences in training patterns, there could be important consequences for workforce skills and labour market performance. This chapter conducts an exploratory analysis of these issues.
Several limitations of the analysis require emphasis. This chapter analyses only one type of job training, namely, continuing and more or less formal training received by incumbent workers. Most of the analysis is limited to workers between the ages of 25 and 54 years, since this restriction avoids complications related to international differences in initial education [OECD (1994, 1998b)] and retirement patterns [OECD (1998c)]. Because most continuing training of employees is sponsored -- at least in part -- by employers, employer-provided training is emphasised. However, worker-financed training and public training programmes receive some attention, as does training received by adults not currently employed. Finally, training is measured in terms of the resources invested, not in terms of the learning achieved.
Main findings
* This document is an extract from Chapter 3 of the 1999 edition of the OECD's Employment Outlook.
10th CEIES Seminar – Education and Training Statistics 23

The main findings of the chapter are:
The level of training differs significantly across OECD countries. Although it is not possible to make precise comparisons, the evidence is quite robust that formal, continuing training is relatively low in southern European countries such as Greece, Italy, Portugal and Spain, and relatively high in the United Kingdom, France and most Nordic countries. There also appears to be some trade-off between the extensive and intensive margins of training, with the average duration of training being higher in countries with lower participation rates.
Overall, men and women appear to participate in job-related training at fairly equal rates, although men may receive more financial support from their employers. When expected hours of training are calculated over the 40-year period between the ages of 25 and 64, women have significantly lower training expectancies than men, due to less continuous employment. Lower training rates for part-time and temporary workers may also lower relative training access for women.
The extent to which training falls off with age varies strongly across countries, suggesting that progress in reaching the goal of life-long learning has been uneven. Workers aged 50-54 years receive almost as much training as those aged 25-29 in the United States and the Nordic countries (except Finland), while the older group receives much less training than the younger in France, Greece, Portugal and Spain.
Training tends to reinforce skill differences resulting from unequal participation in schooling in all countries, although the strength of this relationship varies significantly between countries. Training appears to be most evenly distributed across educational levels in Ireland, Japan, New Zealand, the Netherlands and several Nordic countries, and least equally in Belgium, Hungary and southern Europe. The positive association between more schooling and training remains strong even after controlling for other characteristics affecting the probability of training.
Workers tend to receive more training in countries with higher overall average levels of educational attainment and achievement, as well as in countries devoting a larger share of GDP to research and development and achieving a strong trade performance in “high tech” industries. A higher overall training rate is also associated with more equal age and educational distributions of training. These patterns suggest that education and greater training are mutually reinforcing due, at least in part, to an associated tendency for firms to specialise in economic activities requiring a highly skilled workforce.
The strong link between national levels of educational attainment and achievement, on the one hand, and the level of workforce training, on the other, suggests that an indirect strategy of strengthening schooling is a potent -- if slow -- means of encouraging continuing training. Since a key distinguishing feature of high-training economies is that participation in training is more evenly distributed, policies enhancing the incentives and resources for investing in the continuing training of workers typically receiving little training are of particular importance. However, the theoretical and empirical analysis of the determinants and consequences of continuing training are not yet sufficiently developed to provide policy makers with reliable estimates of the economic returns that would accrue to specific policy approaches. Further harmonisation of training statistics could make a useful contribution to filling that gap.
Conclusions
Should public policy attempt to expand or redirect the training received by incumbent workers after
24 10th CEIES Seminar – Education and Training Statistics

the period of initial vocational training? While there is no consensus on this question, Member country governments pursue a number of policies directed toward these ends. That the level and distribution of training differs significantly among OECD countries is supportive of the belief that appropriate policies can create an environment that encourages employers and workers to invest in continuing training. That the typical worker devotes more than 1 000 hours to formal training, between the ages of 25 and 64, is also supportive of the importance of continuing training for achieving the goal of life-long learning. Unfortunately, the analysis of the determinants and consequences of training is not yet sufficiently developed to provide policy makers with reliable estimates of the economic returns that accrue to any specific policy approaches. Further harmonisation of training statistics could make an important contribution to filling that gap. Nonetheless, it is possible to draw several tentative conclusions with the limited data currently available.
The strong link between national levels of educational attainment and achievement, on the one hand, and the level of workforce training, on the other, suggests that an indirect strategy of strengthening schooling is a potent -- if slow -- means of encouraging continuing training. These links also confirm that education and training policies should be assessed as an integrated system affecting learning over the life course [OECD (1996a)]. It is particularly striking that training rates are relatively low in countries where the literacy scores of the adult population are lower and more unequal. A key step in encouraging worker training is to ensure that all individuals enter the world of work with the basic knowledge and learning skills needed to insure their subsequent trainability.
Another finding of potential importance for policy making is that a key distinguishing feature of high-training economies is that participation in training is more evenly distributed across age and educational groups. Policies enhancing the incentives and resources for investing in the continuing training of those workers who typically receive little training may, thus, be of particular importance. Programmes to minimise school failure and early school drop-outs have received increased attention recently, as a part of efforts to protect at-risk youths from a future of economic marginality and social exclusion [OECD (1995)]. Success in bringing all individuals up to a minimum threshold of general education and literacy might also make an important contribution toward a broadening and deepening of enterprise-centred training and higher overall prosperity. However, such an approach will only gradually raise the skill level of the workforce and policies to expand the training received by the current adult workforce may also be desirable.
Internationally comparative research on worker training is not yet sufficiently advanced to assess the desirability of policies designed to affect training patterns more directly. Options here include minimally interventionist measures, which are intended to create a more supportive environment for employers and employees to invest in continuing training. For example, the limited evidence available suggests that policies encouraging the diffusion of flexible working practices [Chapter 4] or providing certification services that facilitate the recognition of skills acquired through training [OECD (1997c)], may indirectly encourage greater training. More interventionist measures, such as mandatory training levies and direct provision of training have also been tried in a number of Member countries. The now extensive evaluation literature on active labour market policies suggests that the effectiveness of any such measures will be dependent on good programme design and administration [OECD (1996b)]. Evaluations of a similar rigour would be highly desirable for the broader range of policies that have been used -- or proposed -- to enhance the training received by the employed workforce.
10th CEIES Seminar – Education and Training Statistics 25

BIBLIOGRAPHY
ACEMOGLOU, D. and PISCHKE, J.S. (1999), “Beyond Becker: Training in Imperfect Labor Markets”, The Economic Journal, February, pp. 112-142.
BLAU, F. and KAHN, L. (1996), “International Differences in Male Wage Inequality: Institutions versus Market Forces”, Journal of Political Economy, August, pp. 791-837.
BOOTH, A.L. and SNOWER, D.J. (1996),Acquiring Skills. Market Failures, Their Symptoms and Policy Responses, Cambridge University Press, United Kingdom.
GRILICHES, Z. (1996), “Education, Human Capital and Growth: A Personal Perspective”, National Bureau of Economic Research, Working Paper No. 5426.
LYNCH, L.M. (ed.)(1994), Training and the Private Sector: International Comparisons, The University of Chicago Press, Chicago.
OECD (1991), Employment Outlook, Paris, July.
OECD (1993), Employment Outlook, Paris, July.
OECD (1994), Apprenticeships: Which Way Forward?, Paris.
OECD (1995), Our Children at Risk, Paris.
OECD (1996a), Lifelong Learning for All, Paris.
OECD (1996b), The OECD Jobs Strategy: Enhancing the Effectiveness of Active Labour Market Policies, Paris.
OECD (1997a), Manual for Better Training Statistics, Paris.
OECD (1997b), “Policies for Low-Paid Workers and Unskilled Job Seekers,” General Distribution, Paris.
OECD (1997c), “Lifelong Learning to Maintain Employability,” General Distribution, Paris.
OECD (1998a), Human Capital Investment: An International Comparison, Paris.
OECD (1998b), “The Retirement Decision in OECD countries”, Working Papers on the Economics of Ageing, AWP 1-4, Paris.
OECD (1998c), Pathways and Participation in Vocational and Technical Education and Training, Paris.
26 10th CEIES Seminar – Education and Training Statistics

GRADUATION AND TRANSITION TO THE LABOUR MARKET ACCORDING TO THE REGISTER BASED STATISTICAL SYSTEM
Pekka MyrskyläStatistics [email protected]
In all Nordic countries employment statistics are compiled on the dual basis of population registers and other administrative records. Some countries in Central Europe are now also turning more and more to administrative records for purposes of data production. Among the main advantages of register based statistics production are its lower costs, the elimination of any additional response burden, and the extra uses of existing register data. The most important feature is the annual availability of total data for the nation and smaller geographical areas and small population subgroups. For example, the register captures short spells of activities or conditions and multiple activities or side activities such as employment among students, double or triple working relationships, etc. Data quality is also improved for items that would otherwise involve long-term memory or detailed records. The coverage of data is usually higher. There is much supportive information for instance for the coding of occupations, educational data, and data describing employers (size and industry of employer). The ability to link various types of data sets such as demographic and health characteristics or real demographic and business information is also essential for research purposes.
The register based system
Data are linked among persons, incomes, working, unemployment, and pension periods, buildings, dwellings, and enterprises, workplaces (establishments), education and place of graduation. Geography is determined on the basis of building co-ordinates so that sub-area data can be produced. In the population registers, each child’s record carries the identification numbers of both mother and father; and likewise, the identification number of each child is included in both their mother’s and father’s records. This cross-recording of identification numbers means that family members can be matched even if they are not living in the same household. Children’s educational level can be linked to their parents’ educational level even if they live in different households
10th CEIES Seminar – Education and Training Statistics 27

New Research Opportunities
All register units as well as addresses are updated continuously or at least once a year. Registers can also be used to select samples for specific populations such as age or income groups or specific geographical areas. Another use for registers is to reduce the number of questions that respondents are asked in sample surveys, such as on demographic data, educational data as well as family data (family and household combination). A third use is to determine the characteristics of survey non-respondents (for example, age, gender, and employment status, place of residence). Since 1987, Statistics Finland has produced an annual and even monthly database for the entire population. Information is produced for the nation and also for smaller areas such as municipalities and parts of cities.
Census data are used to compile longitudinal data files in which each resident of the country is linked with his or her data in different Censuses (1970, 1975, 1980, 1985, 1990 and 1995). The other data file combines the annul data for 1987–1997 as a “short longitudinal data file”, but with a much more comprehensive data content. This allows us to follow the life course of each person and the changes in that life course over a period of thirty or years. It also allows us to study how graduated cohorts are entering the labour force and to monitor changes in occupation and industry, in place of residence and work, and related characteristics such as unemployment, receipt of pensions, and disability. With this database, Statistics Finland can determine how various age and educational groups fare in the labour market and how their work compares with their educational attainment. It is also possible to determine whether school leavers are working in the same city where they have studied or near that city after their graduation; and accordingly how many of them have gone to work farther away.
28 10th CEIES Seminar – Education and Training Statistics
Longitudinal Census data file Longitudinal
Employment data file
Longitudinal Data Files
Longitudinal data files provide a useful tool for monitoring the entry into the labour market of all graduates as well as their other movements in the labour market. The discussion below gives some examples of these new research opportunities.
Some examples of new opportunities
Changes in the Labour Force have been compiled by monitoring population and labour force flows from one status to another in sequential years. Usually, annual statistics only provide cross-section data from different points of time on population numbers, numbers employed, etc.; on the basis of these figures we can then compare how much they have changed during a year or between Censuses. With the register system, we can explain how these changes have occurred and whose labour market situation has changed.
Components of labour force change. In the late 1980s, more than 200,000 new workers entered the labour market each year. Initially the number of exits from the labour market was slightly lower, but with the onset of recession in late 1989 the number of exits started to rise, increasingly as a result of redundancies. The number of people entering employment dropped by one-third from 1988 to 1992. It was increasingly difficult for school leavers and homemakers to enter the labour market. The number of students entering employment also fell by one-third.
Each year an average of 30,000 to 50,000 persons retire from working life. The escalation of unemployment may decrease the number of persons retiring because of invalidity. A large proportion of those shifting from employment to homemaking and vice versa are women beginning or ending their maternity leave.
10th CEIES Seminar – Education and Training Statistics 29

The numbers entering the labour market began to increase in 1994. Initially the new entries came primarily from the large reserve of unemployed people, but the demand for students and graduates soon started to increase as well. By 1998, students and the unemployed were equally represented among the new recruits in the labour market. In 1998 a total of 280,000 new people were recruited into the labour market. At the same time the number of exits was only 190,000, which meant that the total number of people in employment increased by almost 90,000. Students accounted for 70,000 of all new recruits in one year. The number of people in the labour market in Finland is quickly rising, but this is having no major effect on the numbers out of work, which in 1998 was still very high at 374,000.
Exits from the labour force and entries into the labour force in 1989-1996 by reason of exit or entryYear Number of exits % Number of entries %
1989 Total 212 480 100.0 228 982 100.0Students 55 174 26.0 92 833 40.5Household work 43 387 20.4 48 114 21.0Unemployment 45 389 21.4 58 362 25.5Pensioners 49 497 23.3 8 323 3.6Conscripts 11 735 5.5 16 721 7.3Deaths/Migrated 7 298 3.4 4 629 2.0
1991 Total 331 104 100.0 167 969 100.0Students 59 436 18.0 66 071 39.6Household work 41 536 12.5 31 375 18.7Unemployment 168 269 50.8 46 483 27.7Pensioners 45 138 13.6 4 812 2.9Conscripts 10 196 3.1 12 197 7.3Deaths/Migrated 6 529 2.0 4 700 2.8
1992 Total 326 924 100.0 172 207 100.0Students 41 404 12.7 51 143 29.7Household work 39 506 12.1 24 401 14.2Unemployment 191 467 58.7 83 714 48.6Pensioners 41 910 12.8 3 812 2.2Conscripts 7 246 2.2 6 997 3.9Migration/Deaths 5 717 1.7 2 140 1.2
1993 Total 313 609 100.0 176 900 100.0Students 41 375 13.1 42 832 24.2Household work 38 090 12.1 26 249 14.8Unemployment 172 721 55.1 93 407 52.8Pensioners 51 522 16.4 6 550 3.7Conscripts 4 713 1.5 5 216 2.9Migration/Deaths 5 188 1.7 1 355 0.8
1994 Total 213 138 100.0 252 468 100.0Students 31 485 14.8 61 293 24.2Household work 28 508 13.4 27 757 11.0Unemployment 106 308 49.9 148 460 58.8Pensioners 38 441 17.6 5 111 2.0Conscripts 3 422 1.6 7 217 2.8Migration/Deaths 4 974 2.3 1 403 0.6
1995 Total 226 672 100.0 242 373 100.0Students 37 949 16.7 71 113 24.2Household/Conscripts 32 569 14.4 36 047 17.2Unemployment 113 034 49.9 126 951 53.9Pensioners 37 964 16.7 5 163 4.0Migration/Deaths 5 152 2.2 1 879 0.7
30 10th CEIES Seminar – Education and Training Statistics

Year Number of exits % Number of entries %
1996 Total 214 520 100.0 238 912 100.0Students 34 190 15.9 79 011 33.1Household/Conscripts 28 652 13.3 36 699 15.3Unemployment 112 220 52.3 114 268 47.8Pensioners 34 456 16.1 5 502 2.3Migration/Deaths 5 002 2.3 2 228 0.9
1997 Total 179 879 100.0 260 732 100.0Students 35 172 19.6 82 525 31.7Household/Conscripts 27 225 15.1 41 809 16.1Unemployment 83 696 46.6 128 254 49.1Pensioners 28 492 15.8 5 507 2.1Migration/Deaths 5 294 2.9 2 637 1.0
1998* Total 190 023 100.0 277 561 100.0Students 37 315 19.7 108 987 39.3Household/Conscripts 32 764 17.2 44 836 16.2Unemployment 88 110 46.4 111 249 40.1Pensioners 25 934 13.6 9 513 3.4Migration/Deaths 5 900 3.1 2 976 1.1
The number of exits from the labour market has dropped from the peak figure of around 330,000 in 1991-1992 to 180,000 in 1997. Redundancy remains the main reason for exit (46.4 %), although the probability of being made redundant is clearly lower now than it was when the situation was at its worst. The second most common reason for exiting the labour market is to begin studies (19.7 %).The figures for those moving into homework and retirement have remained more or less unchanged
Out-flow from employment to other activities during years 1988-1998
1988
1989
1990
1991
1992
1993
1994
1995
1996
1997
1998
0 25 50 75 100 125 150 175 200 225 250 275 300 325 350
Thousands
UnemployedStudetsPensionersOthers
1988
1989
1990
1991
1992
1993
1994
1995
1996
1997
1998
0 25 50 75 100 125 150 175 200 225 250 275
Thousands
In-flow from other activities to employment during years 1988-1998
The numbers entering the labour market was at its lowest in 1991-1993 at no more than 170,000 per annum. After the onset of mass unemployment the majority or 53 % of those starting in wage employment were unemployed in 1993; in 1994 the figure climbed further to 59 %. Since then the number of students as a proportion of new recruits has increased and in 1998 stood at 40 %.
Job information is produced for school leavers with a view to helping them to decide whether they can find a job that corresponds to their qualifications. The efficiency of different vocational
10th CEIES Seminar – Education and Training Statistics 31

institutions and universities can be measured by studying how well and how fast graduates can find jobs. Comparisons of data from consecutive years will provide information on people’s movement between different activity groups. The Figure below aims to illustrate what kind of flows and how many flows can be specified during one year.
Employed2 125 535
Unemployed374 117
Pensioners1 105 053
Students443 104(97)413 801(98*)
Housework
0 - 14years951 145
Industry 1Industry 2
Industry n
Level of ed.Field of ed.
Flows between different activity groups: STUDENTS 1997-1998*
DeathsEmigr.60 079
& others189 995
Immigr.14 192
Incomedata
30 279
21 050
264 054
At year-end 1997 there were in Finland a total of 443,104 people in post-comprehensive schooling. During 1997, 108,987 of them entered the labour market, at the same time as 37,315 exited the labour market in order to begin their studies. In addition, a total of 61,778 people came from comprehensive schools to continue their studies. The number moving into households was 30,279, the number entering post-comprehensive schooling from households was 21,050. In addition, 37,019 students were made redundant, and 25,416 unemployed people started post-comprehensive schooling. Finnish educational institutions received 1,588 students from abroad, the same number of students moved out of Finland. The number of students retiring because of disability or other reasons was 1,267. Out of those who were students in 1997, 264,054 continued their studies. If this formula is used to calculate so-called gross changes, the total number of new students was 147,147, the number of those ending their studies was 179,068, while 264,054 showed no change in their student status.
One of the methods used in Finland to try and measure the efficiency of the educational system has been to monitor the recruitment into and the exclusion from the labour markets of people graduating from different types of institutions in different regions. There are marked differences in employment between different lines of education and different levels of education.
32 10th CEIES Seminar – Education and Training Statistics

The rate of employment of studets graduated in 1991 on engineering, manufacturing and construction by the level of education
Higher university level
Lower university level
Upper secondary level
Secodary level
The rate of employment improves quite markedly even within the field of engineering by level of education: the figure for engineers graduating from technical universities is up to 30 percentage points higher than for engineers graduating from vocational schools. Likewise, those with a higher education were hit by the recession far less severely than those graduating from vocational schools.
Year of graduation has a major impact on employment. In the late 1980s the Finnish economy was booming and the demand for engineering professionals was high. This demand was all but wiped out with the recession in 1991-1994: large numbers of those who were working lost their jobs, while those graduating during the recession were unable to find work at all. In 1991-1993, the proportion of engineers employed during the same year they graduated dropped below 40 %.
The employment rate of civil engineers graduated in 1987-1994
1994
1990
19911992 1993
1989
19881987
10th CEIES Seminar – Education and Training Statistics 33

At the same time, the proportion of those out of work in these graduating cohorts increased to over 40 % – and these were engineers with a university education. The situation among those with a vocational training was even worse.
1987 1988 1989 1990 1991 1992 1993 1994 19950
5
10
15
20
25
30
35
40Unemployment rate
The unemployment rate of civil engineers graduated in 1987-1994
1994
1990
1991
1992 1993
19891988
1987
The example below looks at what kind of labour was recruited by different industries: the focus is on the proportion of students, the unemployed and other groups in the flow of new recruits. The analysis was done for 1995 and 1998. Overall it can be concluded that the fastest growing industries recruited a larger proportion of its labour force from educational institutions that it did from amongst the unemployed and other population groups.
In manufacturing and construction, the demand for labour force started to fall off in 1989; in trade and finance and in transport and communications, the turn came one year later. Hiring within the public services sector continued up to 1991, in large part from educational institutions. The public services sector now employs almost half of all school leavers who manage to get a job. Now that the recession has abated, the hiring of students in the processing industries, the service sector as a whole accounts for over 80 % of the jobs given to students. Before the recession, construction and manufacturing hired the largest proportion of jobless people. Only 40 % of all new jobs now go to the unemployed.
In Finland today there is a demand for new labour in manufacturing industries, trade and commerce, business services, and in health and welfare services. The proportion of students in the new workforce recruited is high and has increased since 1995. The hotel and catering sector is the most active in recruiting young students. In this business students often take on jobs while they are still studying, which means that staff cannot always be recruited on a permanent basis. The situation is very similar in trade and commerce as well as in cleaning jobs.
Recruitment from the ranks of the unemployed is in contrast more common in transport and communication, building and construction as well as in public administration. Transport as well as building and construction are sectors that are liable to seasonal fluctuations, so that during the winter part of the labour force is more or less ”regularly” unemployed, returning to work in the spring. The public sector seems to recruit large numbers from the ranks of the unemployed, but this is partly explained by government relief work programmes.
34 10th CEIES Seminar – Education and Training Statistics

New entries into the labour force according the former activity by industies in 1995
Restor.&hotels
Trade
Education
Business services
Other public serv.
Banking
Manufacturing
Health&soc.services
Agriculture
Transport
Public administr.
Construction
Restor.&hotels
Trade
Manufacturing
Banking
Transport
Education
Business services
Other public serv.
Health&soc.services
Public administr.
Agriculture
Construction
0% 20% 40% 60% 80% 100%
Student Other industry Unemployed Other
New entries into the labour force according the former activity by industies in 1998
The fastest-growing sectors are found in the information industry. A distinctive feature in these sectors is that graduates take precedence in recruitment over the unemployed and skilled workers from other industries. Apparently the thinking is that the educational and skills qualifications of the long-term unemployed are not up the standards required in hi-tech companies.
10th CEIES Seminar – Education and Training Statistics 35

New entries into the labour according the former activity in iInformation sector in 1997, compeared to some other industries
Impact of place of study on entry into the labour market
There are clear differences between university cities in terms of the employment of graduates as well as in terms of where they are employed. The Table below illustrates the labour market status of people graduating from different university cities in 1988-1995 two years after graduation. At the same time, it provides details on whether the graduates are working in their home town, in neighbouring municipalities or elsewhere.Somewhat surprisingly, the highest employment figures are recorded for the smallest universities, i.e. those in Rovaniemi and Lappeenranta. The employment figures for the biggest university cities of Helsinki, Turku and Tampere are up to 7-8 percentage points lower. However, those outside the active labour force are not unemployed but they have either moved out of the country, continued their studies or they have stayed at home to work as housewives or fathers. Bigger cities apparently have the best opportunities for further studies as well, so that the proportions in post-graduate studies are highest here. Unemployment ranges from 4.0 % (Helsinki University of Technology) to 7.7 % (the universities in Tampere). The numbers moving abroad are highest in Espoo, Turku and Vaasa. Turku and Vaasa also provide university education in the Swedish language, improving prospects of employment on the Nordic labour market.
Labour market status of people graduating from university cities in 1988-1995 two years after graduation
36 10th CEIES Seminar – Education and Training Statistics

OuluDistrict of OuluOther MunicipalitiesUnemployedNot in LFMigrated
HelsinkiDistrict of HelsinkiOther MunicipalitiesUnemployedNot in LFMigrated
The labour market status two years after completing a university qualification in 1988-95, OuluHelsinki
In the Helsinki region the labour markets for graduates are very good: up to 60 % of all those graduating get a job in or around the city. The labour markets in the Oulu region are also showing strong growth, but even so 50 % of those graduating have to move to find a job. Rovaniemi is the northernmost and one of the smallest university towns in the country, and not surprisingly the majority or 70 % are employed elsewhere.
There is clearly less mobility among vocational school graduates than among university graduates: they are often employed in their home town or its immediate vicinity, or then they remain outside
10th CEIES Seminar – Education and Training Statistics 37

the labour market. They travel farther away in search of a job less often in all three cities in this example, i.e. in Helsinki, Oulu and Rovaniemi.
1988 1989 1990 1991 1992 1993 1994 19950%
20%
40%
60%
80%
100%
OuluDistrict of OuluOther MunicipalitiesUnemployedNot in LFMigrated
The labour market status two years after completing a university or secondary qualification in 1988-95,
1988 1989 1990 1991 1992 1993 1994 19950%
20%
40%
60%
80%
100%Rovaniemi, university level Rovaniemi, secondary level
Summary
The number of jobs in the Finnish labour market dropped by half a million in the early 1990s, resulting in mass unemployment and in increasing difficulties for young people to enter the labour market. The numbers employed in different branches of industry fell dramatically. The age groups finishing school no longer filled the gaps resulting from employees retiring or becoming homemakers, but became unemployed instead. Ever fewer of those who remained unemployed managed to find a job, in spite of efforts by the government to step up its job-creating schemes and to intensify labour market training. Youths were offered more study places, both in institutions and in labour market training.
The decline in labour demand extended to all sectors: in central and local government 5 % of the personnel had to go, in the private sector 30 %. In manufacturing, trade and commerce, financial intermediation and agriculture, output is now achieved with a considerably smaller labour force than during the peak years. Growth in labour force demand is focussed on the metal and electronics industries and services supporting there industries, and in geographical terms is restricted to only a few regions. The rapid decline in agricultural work will keep the growth in the total number of jobs very low, and the decline in the number of jobs will be followed by declining population numbers, further cutting the number of jobs in public services. Western and southern Finland were least affected by the recession, while Lapland and eastern Finland suffered most. The transition into the labour force occurs through studies, from unemployment or the household. Only 40 % of all new jobs go to the unemployed.
Sequential annual data on employment statistics at the individual level are used in this study to obtain information on the changes occurring in each individual’s activities. The system generates data on transitions between the classes of main activity and branches of industry, and on the integration into working life among those with a degree.
38 10th CEIES Seminar – Education and Training Statistics

Traditional statistical analysis only provides cross-sectional data on the numbers employed, out of work, etc. A system that is based on individual follow-up provides more information on how the changes in the labour market take place:- entries into the labour force and the structure of new labour - exits from the labour force, structure and reasons for exit- what kind of labour is recruited in different industries- how people move from studies into work in different branches and at different levels of education- impacts of business cycles on recruitment- impacts of the area in which education is provided
Flow analysis indicated that the pace of change is very rapid: out of the two million wage earners in Finland, almost 300,000 enter the labour market during the same year, in a difficult year as many as 330,000 lost their jobs for various reasons. The fastest-growing industries prefer to recruit directly from educational institutions rather than from amongst the ranks of the unemployed. Hi-tech industries in particular are reluctant to take on unemployed people. The public sector has a greater responsibility than others when it comes to providing relief work to the unemployed.
The higher the individual’s level of education, the less that individual will ever have to suffer from unemployment. The differences between different branches and levels of education are quite substantial. When the economy is slow up to half of those with a high level of education may find themselves out of work. The longer the period of unemployment, the harder it is to find work. Employment among those graduating during the recession may remain at a permanently lower level than among those graduating during a booming economy.
In Finland educational opportunities are evenly spread out across the whole country: the purpose of this policy is to ensure the availability of a qualified labour force in all regions. The employment of those graduating depends on the size of the local labour markets and of course on the field of education. Only the metropolitan Helsinki region can provide job opportunities to the majority of those who have studied in the same region. In the fast-growing region of Oulu, for instance, over half of those graduating have to move to find work. In the smallest universities, the majority of students are eventually employed elsewhere. The line of study also has an impact on where the graduate is employed: the labour markets for doctors, teachers, priests, nurses, police and civil servants extend across all 452 local municipalities in the country, so large numbers graduating in a university city will have to move to find work.
10th CEIES Seminar – Education and Training Statistics 39

TRANSITION FROM EDUCATION TO THE LABOUR MARKET
Ronnie AnderssonStatistics SwedenSE-701 89 Ö[email protected]
1. Introduction
In an interview in connection with his retirement a Swedish professor of medicine stated that the personal identification numbers, used in all kinds of official registers, are ”Sweden’s most important contribution to the world”. They make it possible to trace and locate all patients and check, for example, the results for different treatments. Even if this is an facetious overstatement, a statistician using registers and longitudinal data could easily agree.
The statistical system for studying transition from school to work described in this paper stands and falls with the existence of an identification system, which makes it possible to combine data from different registers and to follow large nation-wide representative samples/cohorts through the educational system into adult age and into the labour market.
The Swedish identification system is based on the birth dates: year, month and date give the first six digits. A three-digit code - digits seven to nine - differentiates between all born the same day and a tenth digit (a function of the first nine) checks that the combination is correct. My own personal identification number is 460120-5432, which means that I am born on January 20, 1946. The three-digit code 543 is the number that differentiate me from all other born on that day (if the last digit is uneven, in my case a 3, it shows you are a male, females have an even figure in the ninth position) and 2 is the check digit. Almost all Swedes know their personal identification number by heart.
We will not give a description of the Swedish education system in this paper. The interested reader is referred to Abrahamsson (1999) and/or Ministry of Education and Science (1997).
Statistics Sweden publishes two kind of statistics - statistics based on surveys and statistics based on registers. The register statistics published is based on a system of statistical registers which has been developed by Statistics Sweden on the basis of data from different nation-wide administrative systems. Surveys and registers based on administrative data can be made to interact - surveys can be improved by access to registers and register statistics can be evaluated and improved by surveys. Auxiliary information from registers can reduce sampling errors in surveys and survey data can be used to improve the measurement quality of register statistics.
We will not give a description in this paper of the total register based statistical system in Sweden (see the references e.g. Carling (1996)). We will concentrate on the statistical system for education and training statistics.
2. The Swedish system of education statistics
2.1 Three different sources
Transition from education to the labour market can be measured in at least three different ways, namely through:
40 10th CEIES Seminar – Education and Training Statistics

Registers Student follow-up surveys (sample surveys) Panels of pupils (sample panels)
In Sweden all of these methods are used. We believe they complement each other and all three are needed to get a comprehensive picture of the transition process. Statistics Sweden has for a long time been carrying out student follow-up surveys of young peoples’ transition from education to the labour market. For the past 5 - 10 years Statistics Sweden has also been producing register-based statistics about the relationship between education and labour market. The demand is great for statistics that describes the transition from education to work and the demand has been growing during the nineties due to the high unemployment of young people and especially among young immigrants (Olsson and Arvemo-Notstrand (1997)).
Our statistical system for studying flows through the educational system and into the labour market can be illustrated by the picture on the next page. These flows are not easy to describe today if they ever have been. On the contrary, they are complicated, with persons going to and from different types of education and to and from the labour market.
As a producer of education statistics we want to give basic data for each educational programme on:
Applicants (as a measure of demand for the education) Beginners Registered Graduates Teachers/ Personnel Costs
We want background data on the students like gender, age, regional-, social- and educational background and also some results like marks and test results. Do the pupils learn anything at school?
10th CEIES Seminar – Education and Training Statistics 41

In Sweden this statistical system started with higher education in 1937 and has since been developed for other types of education and the system is still developing. What is rather new is statistics describing the flows. Some of these flows are very well statistically developed like from Upper secondary school to Higher education or from Higher education to the Labour market. Some are less well developed as from Adult education to the Labour market. Ideally, we should follow a cohort from the end of primary school and through the education system and into the labour market.
This system of education statistics is a gold-mine of information, which we just have started to explore. Statistics Sweden needs co-operation with researchers - sometimes even researchers from abroad visit Sweden to work with our statistical data on education and training - and also with experts in other national agencies to dig out this gold-mine. Statistics Sweden has neither the aim nor the possibilities to do all this work alone.
42 10th CEIES Seminar – Education and Training Statistics

There are information gaps in the system: We are lacking an Occupation register. We are building one, but it will take a couple of years
before it is ready. When studying the transition from education to work occupation is much more interesting than industry, which we have in our registers.
Better categorisation for ‘activity after education’ in the register-based statistics. Now we use four categories: Gainfully employed, gainfully employed and students, students, other. We need a finer categorisation of both gainfully employed and -especially- the other category.
We need to improve the Adult education part of the statistical system. If we are going to make statistics over life long learning in the future, a better co-ordination of the Swedish Adult education statistics are needed. Among other things we will do a special Adult Education Survey every third year.
Students leaving the education system without graduating, what happens with them? We need to pay more attention to ”drop-out” students.
2.2 The pros and cons of administrative data and surveys
If we use administrative data instead of executing a sample survey we will reduce costs as well as response burden. But we should not regard administrative data as a cheap alternative to sample surveys. Administrative data and sample surveys should be regarded as two different methodologies where administrative data is the best choice in some situations and sample surveys in other. Thus, the access to administrative data open new possibilities for a National Statistical Institute to build an efficient statistical system. An effective use of administrative data means that a system of statistical registers should be designed and that this register system and the sample surveys should interact.If we use administrative data we are dependent on the administrative system generating the data. There is a risk that the units and variables defined by the administrative authorities are unsuitable for statistical purposes. But this disadvantage of administrative data can be counteracted by the statistical agency in three ways: On the basis of the administrative units, statistically meaningful units should be defined (as we
do in the Swedish Business Register where we define economic units of different kinds). On the basis of the administrative variables, statistically meaningful variables should be defined. By combining many sources we get better possibilities to obtain a statistically relevant data set.
In short we call this transforming administrative registers into statistical registers. The quality in the administrative registers is mostly good, even very good, concerning items of interest to the agency administering the register. Items added to the register solely for statistical purposes and of no interest to the ‘administrator’ are often of less good quality. In these cases we have to put in a lot of effort improving the administrative registers when transforming them to statistical registers. Another disadvantage with register statistics is that it often takes quite a long time to produce the statistics. For example, now in May 2000 we have data from the Employment Register for November 1998.
If we use sample surveys we can define our own variables but we are dependent on the respondents’ capacity and willingness to give answers to our questions. Instead of asking delicate and difficult questions about for instance income and education, it is better to use administrative/statistical registers.
Again we want to stress the fact that register statistics and survey statistics are not methodological rivals - they should instead be regarded as complementary methods. The register statistics give the basic facts about differences between various categories and about changes over time. It is then possible to design a survey which can give a deeper understanding of the causes behind these
10th CEIES Seminar – Education and Training Statistics 43

patterns. With the help of the statistical register the sample can be selected only from the interesting categories in the population. A great advantage with statistics based on administrative sources is the possibility to report results for many subdivisions. For example, in describing young persons’ transition to the labour market, it is important to report results for different courses and study programmes. In a sample survey of reasonable size it would be difficult to give reliable estimates for many simultaneous subdivisions. This is the reason why administrative sources are very important for regional statistics. The choice is sometimes between register statistics or no statistics at all!
3. Registers
To describe the transition from education to the labour market we use the following registers: The Register of Compulsory School Grade 9 Register of Pupils in Upper Secondary School Register of Higher Education Register for Municipal Adult Education Total Population Register (RTB after its Swedish abbreviation). The main variables in this
register are; Personal Identity Number, Place of Residence, Name, Address, Marital Status, Citizenship, Country of birth, Immigration and Emigration.
Population Censuses. In our education statistics we mostly use the population censuses to obtain social background for the students through their parents occupations.
The Education Register. This register contains information on education completed for all persons 16-74 years old living in Sweden.
The Register of Persons Studying (RPU after its Swedish abbreviation). The Employment Register (RAMS after its Swedish abbreviation). This register contains
variables like enterprise size and ownership, location and industry of establishment for all gainfully employed in Sweden.
The Wage Statistics Register (contains -except wages- occupation for about 75% of the gainfully employed and is sometimes used in absence of an Occupation Register)
The Income Register The Central Enterprise and Establishment Register. This is a continually updated data base that
describes the current conditions (industry, sector, size, location etc.) among all enterprises and establishments in Sweden. Each enterprise/establishment has a unique identification number.
From these registers an integrated data base, called LUCAS (Swedish abbreviation for Longitudinal register for education and labour market statistics), has been created. The objective of preparing integrated data bases is to simplify and cheapen the dissemination of statistical information. LUCAS contains data from most of the registers mentioned above and is specially designed for producing statistics on the flows within the education system and the transition from education to the labour market. The two latest statistical reports are: U 81 SM1 9901: The transition from education to the labour market 1991 - 1997 UF 81 SM 0001: Activity after education - industry, sector and income during 1997
As an example on a table from LUCAS you may see below how the labour market after compulsory school has been eradicated:Table 1. Activity after compulsory school in the autumn after leaving school. Per cent
Academic year
Year of activity
Employed
Employed and students
Students Other Total Total number
1 All statistical reports (SM) mentioned in this paper are in Swedish with an English summary and a list of terms.
44 10th CEIES Seminar – Education and Training Statistics

1990/91 1991 6 10 80 5 100 104 0001991/92 1992 2 6 89 3 100 99 0001992/93 1993 0 2 95 4 100 97 0001993/94 1994 0 2 95 3 100 94 0001994/95 1995 0 2 95 3 100 97 0001995/96 1996 0 2 95 3 100 100 0001996/97 1997 0 2 96 2 100 97 000
The most fascinating with the Swedish statistical register system is that it is possible to connect persons and enterprises/establishments. This is possible through the Income Verification Register, which is originally created for applications by the Swedish taxation authorities. This register contains every job being possessed by an employee during a year. The register contains rather few variables, but constitutes the basis for the register system, as every job is attached to the identity of the person and the identity of the enterprise/establishment. As can be imagined this gives enormous statistical opportunities e.g. which types of enterprises recruits students from different educational programmes? Or how is the educational level in different types of enterprises? The Income Verification Register is the base for the Employment Register (RAMS) mentioned above.
4. Student follow-up surveys
4.1 Introduction
The follow-up of students is based on sample surveys to a selected number of students from a certain type of education. The sampling frame is normally the education statistical individual register for each respective form of school. The sample size varies from about 5 000 to almost 15 000. The surveys are postal surveys and using telephone interviews to raise the response rate. The normal response rate is about 70 per cent. Thanks to the RTB (Total Population Register) it is easy to find the correct addresses of the selected students. Thus, it is easy doing follow-up studies in Sweden compared to most other countries.
The purpose of the follow-up studies of students is to obtain a description over ”how things turn out for those who have obtained a certain education”, how useful the education has been to them and how different people for different reasons choose different ways through the educational system and into the labour market.
Based on Government subsidies we do two or three follow-up surveys each year (we do about ten surveys on assignment, that is the users pay us to carry out the survey, a year. The sample size is normally smaller in these ‘assignment’ surveys than in the ‘government’ surveys).
We divide our student follow-up studies in three different categories: The transition from upper secondary school to higher education (section 4.2) The entrance to the labour market (section 4.3) Ad hoc surveys (section 4.4)
10th CEIES Seminar – Education and Training Statistics 45

4.2 The transition from upper secondary school to higher education
Statistics Sweden has made annual surveys of the interest in higher studies among upper secondary school students since 1993. The latest survey which was carried out during autumn 1999 was based on a sample of 4 500 upper secondary school students in final year classes of 1999/00. A comparison since 1994/95 is made in the following table.
Table 2. Plan to start in higher education within three years. Per cent
1994/95 1995/96 1996/97 1997/98 1998/99 1999/00Women 58 58 60 65 61 61Men 49 43 45 51 47 46
A good half of the students who will leave upper secondary school in spring 2000 have plans to apply for a university or a university college within three years. Women are more interested than men. The final year classes of 1997/98 had the highest interest if a comparison over time is made. At that time almost 60 per cent of the students planned to enter higher education. The result from the last survey shows that the interest in entering university or university college studies is almost at the same level as the previous year.
Register-based statistics (table 3 below) show that the transition from upper secondary school to higher education has stagnated during the nineties. The transition frequency within one year after graduation during the years 1990/91 until 1997/98 varied between 16 and 18 per cent. The transition frequency of women within one year after graduation increased from 18 up to 20 percent, while it decreased from 14 to 12 per cent regarding men.
46 10th CEIES Seminar – Education and Training Statistics

Table 3. Transition rate to higher education
The transition frequency within three years has increased from 35 to 37 per cent during the period 1992/93-1995/96. The frequency in 1995/96 was 42 per cent for women and 32 per cent for men, a difference of 10 percentage points.
The number of beginners at universities or university colleges is expected to stay at today’s level for the next five years. From year 2005 and a couple of years ahead an increase in the number of students entering higher education is to be expected in consequence of a change in the age structure. The number of nineteen year old individuals will in ten years be 30 per cent more compared to today. This means that if the transition frequency from upper secondary school to higher education will remain at present level, the number of persons entering higher education within ten years after they leave upper secondary school will increase from today’s 42 000 till about 50 000 in ten years. The latest statistical report published is: UF 36 SM 0001: The transition from upper secondary school to higher education. Interest in higher
education among upper secondary school students 1999/00.
4.3 The entrance to the labour market
Every other year Statistics Sweden carries out a follow-up survey among those who left upper secondary school and those who passed their undergraduate and postgraduate exams at universities and university colleges. The survey is called ‘The entrance to the labour market’ and is carried out three years after leaving school/graduation. The results from the survey describe the transition from education to work and the situation on the labour market for persons with different levels of education.
10th CEIES Seminar – Education and Training Statistics 47

The purpose of doing the survey every other year is of course to build up time-series. We have so far published results from two such surveys and a third is carried out this spring: U83 SM 9601: The entrance to the labour market. Survey spring 1996 among school-leavers from upper
secondary school and graduates from higher education 1993. U83 SM 9801: The entrance to the labour market. Survey spring 1998 among school-leavers from upper
secondary school and graduates from higher education the academic year 1994/95.
4.4 Ad hoc surveys
The objective of the ad hoc follow-up surveys change somewhat with changes in reality. When, for example, the situation on the labour market is hard, the surveys will focus on questions describing how the labour market functions. In times when there are problems in the educational system, such as recruitment of students, the interest in questions about the reasons for studying, interruptions etc. grows proportionally greater. Here are two examples from recent years: U30 SM 9801: University entrants. Survey in spring 1998 among university entrants the academic years
1990/91 and 1995/96 U48 SM 9901:What happens after the nine-year compulsory school? Survey in spring 1999 among youth
born in 1978.
5. Panels of pupils for longitudinal studies
5.1 Introduction
This section describes a program of longitudinal statistics and research which started in 1961 and now is including nationally representative samples from seven birth cohorts in Sweden. The oldest group was born in 1948, the youngest in 1987. With one exception the samples consist of between 9 000 and 12 000 individuals, i.e. between 8 and 10 per cent of their birth cohorts. The samples are being followed from the age of ten or thirteen through the educational system and to a growing extent also after entry to the labour market. Most of the text in section 5 has been taken from Härnqvist (1998).
5.2 Cohorts and samples
The program was planned to include samples from every fifth cohort of 13 year old pupils, and so it began in 1961 and 1966. For different reasons there was a temporarily discontinuation in the programme and the next data collection was made in 1980. See table 4 below where an overview of the cohorts and sampling designs is presented.
48 10th CEIES Seminar – Education and Training Statistics

Table 4. Cohorts and samples in the panels of pupils
Year of birth Year of first data collection
Grade Sampling design
Samplesizes
1948 1961 Normally 6 Birth date 10%= 12 000
1953 1966 Normally 6 Birth date 10%= 10 000
Normally 1967
1980 6 Class in grade 6
9 000
Normally 1972
1982 3 Class in grade 3
9 000
Normally 1977
1987 3 Class in grade 3
4 500
Normally 1982
1992 3 Class in grade 3
9 000
Normally 1987
1997 3 Class in grade 3
9 000
The first two cohorts were sampled on an individual basis by means of the birth dates. Everyone born on the 5th, 15th and 25th in any month of the year was included in the sample. This produced 10 per cent samples of whole birth cohorts. This implies that the pupils were found in different grades, about 90 per cent however in grade 6 - the normal age for the grade.
After the restart a multi-stage sampling of school classes has been used, first in grade 6, later on in grade 3. The cohorts are normally named after the birth year of the majority of the pupils. In all cohorts except the 1977 cohort the sample size approximates 10 per cent of cohorts in Sweden. The 1977 cohort approximates 5 per cent.
Both sampling principles have their advantages and disadvantages. Sampling of individual pupils according to birth date in all municipalities of the country gives a better coverage than class sampling in stage-wise selected classes. On the other hand the thin and widespread sample makes the data collection very heavy to administer. Since most classes are represented by only two or three pupils, analysis of the class composition becomes impossible and that of school characteristics difficult. Sampling of classes facilitates the data collection, especially the first one. It also makes analysis at the class level possible for the grade where the sample is taken. In return statistical estimation with proper attention to the clustering effects becomes complicated.
5.3 Co-operation between Statistics Sweden and the researchers
The program was started around 1960 by Statistics Sweden’s plans to collect ‘administrative’ data from the schools for a 10 per cent sample of every fifth cohort at the age of 13 when the pupils normally were in grade 6. Researchers then suggested that the ‘administrative’ data collected by Statistics Sweden should be complemented with more research-oriented information.
This was the start of a long unique and fruitful co-operation between Statistics Sweden and the education researchers. Without a close co-operation, until now for almost 40 years, between Statistics Sweden and the researchers this longitudinal program would not be possible at all. The backbone of the program is the recurrent collections of basic data for large national samples of pupils at a strategic time in their school education. The response rate has, in general, been high and
10th CEIES Seminar – Education and Training Statistics 49

the representativity of the samples good, both when based on birth dates as in the first cohorts and later on stepwise cluster sampling.
The research part of the program has been economically supported by several research councils and foundations during its existence. The Statistics Sweden part has been financed the normal way by state grants from the Government.
5.4 Information collected
An overview of the categories of information collected is presented below. The so called ‘Administrative data’ is collected by Statistics Sweden, either directly from the schools for the cohort (yearly in Primary school) or data is coming from other registers at Statistics Sweden (Upper secondary school, Municipal adult education). The other data is collected by the researchers.
Statistics Sweden:Administrative data from the schools, such as grade, class, school marks (if available), achievement test scores (if available), language choices, special pupil support.Father’s and mother’s education and occupation (social background for the pupil)Excerpt from the register of higher educationExcerpt from the register of municipal adult educationExcerpt from the population censuses and income registersExcerpt from the employment register (RAMS)
Education Researchers:Scores from verbal, inductive and spatial ability test (identical in all cohorts)Questionnaire responses from pupils on school adjustments, interests, educational and occupational plans etc. (varying between cohorts)Questionnaire responses from parents on similar items (from the 1967 cohort on, varying by cohorts)Questionnaire responses from schools and teachers on teaching and on class and school characteristics (from the 1982 cohort on)Scores from military classification tests (only men in the 1948 and 1953 cohorts)
Thanks to the personal identity numbers other registers for special purposes may also be used e.g. the records on study finance.
5.5 Results
A longitudinal database like the one described here is valuable not only for longitudinal studies but also for cross-sectional analysis within each cohort and comparisons between cohorts.
Statistics Sweden publish statistical data from the panels in Statistical reports (SM), one or two each year. Here are some examples from the late nineties: U 73 SM 9501: Panels of pupils for longitudinal studies. 1967 panel. Education and employment 1983-
1992. U 73 SM 9601: Panels of pupils for longitudinal studies. 1982 panel. School attendance third grade to
sixth grade in elementary school. U 73 SM 9602: Panels of pupils for longitudinal studies. 1972 panel. Studies in local authority
administered adult education and higher education. U 73 SM 9801: Pupil panel for longitudinal studies. 1977 panel. From compulsory school through the
upper secondary school 1993-1997. U 73 SM 9901: Panels of pupils for longitudinal studies. 1982 panel. School attendance and transition to
upper secondary school.
50 10th CEIES Seminar – Education and Training Statistics

The education researchers produces doctoral thesises and other research reports. Results from the panels of pupils have also been used extensively as information before large reforms in the Swedish educational system. Here are a few examples on important areas covered: The transition to upper secondary education in different birth cohorts Ability and achievement in relation to gender and social background A path-model for upper secondary and higher education Analysis of extreme groups Recruitment to science and technology Financial aid and recruitment to higher education Selection effects in taking the Scholastic Aptitude Test Intelligence changes between cohorts Intelligence changes within individuals Long term effects of education
Already from the start it was stressed that the data base should be regarded as a national database and to some extent the data has been shared with other researchers. Moreover, the data from the first two cohorts are available in unidentified form from the Swedish Social Science Data Service. The sharing of data with other disciplines (e.g. labour market economists) should be promoted.
5.6 ..into the Labour Market
As can be seen in section 5.5 the pupil panels have been used very much on statistics and research inside the educational system including the flows between different educational levels but - so far - not so much to describe the transition to the labour market.
We will use the 1967 panel and supplement it with data from 1990 to1998 about the labour market from the Employment Register and the Income Register. We will co-operate with labour market researchers (economists) and the results will be very interesting. The researchers will look at the connection between marks/test results and labour market entrance and income. Do higher marks/test results imply a better career in the labour market? What are the effects of social background, gender, ethnicity etc.?
We will produce a report in English together with the researchers on how the panels of pupils may be used in describing the transition from education to the labour market. It is possible that we will enrich the material further by sending a questionnaire to the 1967 panel about their entrance to the labour market.
10th CEIES Seminar – Education and Training Statistics 51

6. References
Abrahamsson, Kenneth (1999): Vocational education and training in Sweden. Monograph prepared for CEDEFOP.
Carling, Jan (1996): The Role of Administrative Registers in Sweden’s Statistical System. Paper presented at the 82ND DGINS CONFERENCE in Vienna, May 1996.
Härnqvist, Kjell (1998): A Longitudinal Program for Studying Education and Career Development. Department of Education and Educational Research, Göteborg University. Report No 1998:01.
Olsson, Anna-Karin and Arvemo-Notstrand, Karin (1997): Transition to the Labour Market. Memo, Statistics Sweden. Paper prepared for the Sienna Group Meeting in 1997, Session A: Immigration and Working Life.
Statistics Denmark (1995): STATISTICS ON PERSONS IN DENMARK - A register-based statistical system. Eurostat 1995.
Swedish Ministry of Education and Science (1997): The Swedish education system, March 1997, Eurydice.
Tegsjö, Björn (1998): Labour Statistics Based on Administrative Sources. The Swedish system linking individual data with enterprise information. Memo, Statistics Sweden 1998-04-15.
Wallgren, Anders and Wallgren, Britt (1997): Role of Administrative Registers in an Efficient Statistical System - Methodological Problems and Quality Issues. Memo, Statistics Sweden, Paper prepared for a Seminar in Luxembourg 15 and 16 January 1997.
52 10th CEIES Seminar – Education and Training Statistics

EDUCATIONAL EXPANSION AND SKILL CREATION: THE GENERATION-BASED APPROACH
Catherine Béduwé & Bernard FourcadeLIRHE, URA CNRSUniversité de Sciences Sociales de Toulouse 1Place Anatole FranceF- 31042 Toulouse [email protected]
The object of this paper is to demonstrate the usefulness of a generation-based approach when analysing the impact of rising educational achievement levels on labour market dynamics. This approach is based on the use of the age variable in individual statistical surveys of employment and/or training.
The arguments put forward (part 1) and the practical illustrations (part 2) are based on the EDEX international research project (Educational Development and Labour Market), which is being carried out by five teams in Europe (in France, Germany, Spain, Italy and the United Kingdom) and one in the United States1. The statistics used come from national administrative sources (ministries of education) and employment surveys (Labour Force Survey or national surveys of the active population) in several European countries.
An individual's age on a given date in a statistical survey provides two essential items of information for analysing the relationship between education and employment, namely the generation to which the individual belongs and an indication of how long the individual has been on the labour market.
As a concept, the generation is independent of the year being investigated (surveyed). Individuals born in the same year (of the same age) will have this characteristic in common for their entire lives. Thus, an individual's year of birth allows us, once we have a set of surveys repeated at regular intervals - as is the case with Eurostat's Labour Force Survey or France's employment survey - to follow a generation over a period of time. We can observe changes in the generation's characteristics, particularly its qualification structure, as it ages. Similarly, if we obtain the age of pupils from the records that some ministries of education keep, we should be able to reconstruct the educational profiles of individual generations of pupils.
Age as an indicator of length of time on the labour market is a more complex notion and one which, for a given generation, depends on the observation date. In each subsequent survey, each generation is one year older. Age allows us to place generations on the labour market in relation to one another - the older the age, the longer the period of time the generation as a whole has spent on the labour market, and the greater the average professional experience acquired by the generation. In previous studies that paved the way for the EDEX project2, we used this concept of age to introduce the notion of skills: an individual is identified on the labour market by his skills, which 1 Project funded by the European Union under the Fourth RDFP, TSER programme, 3rd call, entitled
Educational Expansion and Labour Market (EDEX, http://edex.univ-tlse1.fr/edex/) with the following participants: Coordinator: LIRHE Université des Sciences Sociales de Toulouse, France ; Partner Institutions: GRET, Universitat Autònoma de Barcelona, Spain; CEP, London School of Economics, UK; Zentrum für Sozialforschung Halle (ZSH), Germany; Centro di Recherche Economiche e Sociali (CERES) Roma, Italy ; C.R.I.S. International, USA. The EDEX project addresses the question of the rise in educational levels in Europe and its impact on the labour markets. The project is divided into four phases, as follows: 1 - the long-term structural changes in education systems; 2- The distribution of skills within employment systems; 3- Employers' response to rising educational achievement levels; 4- Future prospects. The findings presented here are based on national reports from phase one.
10th CEIES Seminar – Education and Training Statistics 53

depend not just on his qualifications but also on his professional experience. This combination of an individual's qualifications and age and thus, by extension, the qualification structure of a generation at a given age, allows us to position generations that are active on the "skills market"3.
In an educational expansion situation, it is obvious that the most recent generations will, generally speaking, be the best qualified but have the least experience, as they are new to the job market. Conversely, the older generations, which will be less well qualified on the whole, will have been on the labour market longer, and this - again, generally speaking - will be reflected in their professional experience. This explains why individuals from different generations and with differing levels of academic achievement may do the same jobs and have comparable levels of productivity. Using age in this way gives us a picture of competition for access to the labour market, competition that is both intergenerational and intragenerational.
Once we have done this, we have two options for analysing the impact of educational expansion: the impact on changes in the qualification structure of the active population and thus on the supply of skills to the labour market, or impact on the ways in which educational qualifications disperse through the job market. The first option is based essentially on the concept of generation, whilst the second uses the additional concept of length of time on the job market. In both cases, a distinction must be made between the effects of generation, age and moment (year of observation).
The purpose of this paper is to demonstrate the usefulness of the generation-based approach when dealing with the first problem, i.e. building up a picture of the qualification structure of the active population in a time of educational expansion4. This approach allows us to introduce the dynamic factor of time, which is necessary if we are to reconstruct the qualification structure of the active population. It involves charting the acquisition of qualifications by individual generations over a period of time, particularly close attention being paid to the state of the education system in question. In order to understand how the qualification structure of the active population is made up, we must plot the complex of educational paths taken by each generation.
On the methodological level, the generation-based approach is a useful way of comparing national education systems. To understand the dynamics of national education systems without dwelling on structural differences between them, it is useful to be able to chart the educational paths taken by individual generations. Various milestones are of help here - the end of compulsory schooling, the award of a qualification giving access to higher education, etc. International comparisons can thus be based on references that highlight differences between, as well as features common to, different types of social set-up.
I – THE IMPORTANCE OF THE GENERATION-BASED APPROACH FOR RESEARCH INTO EDUCATIONAL EXPANSION
The EDEX project analysed this problem from two angles: the impact in terms of the output of education systems (qualification structure of generations) and in terms of changes within education systems (structural modification of paths). Most of the participating countries opted for a generation-based approach in order to find answers to a few straightforward questions: how have the qualification structures of today's generations changed, at what point does a given generation see its qualification structure stabilise, and what is the state of the education system that each generation passes through?
2 Cf. [Béduwé Espinasse 95], [Mallet 97] and [Béduwé Giret 99]3 Planas et alii, Cahier du LIRHE No 6, 2000.4 The dispersal of qualified individuals through the labour market has been dealt with by, for example,
Béduwé Espinasse 95, Mallet et alii 97, Béduwé Giret 99. Cf. also the national reports on the EDEX website.
54 10th CEIES Seminar – Education and Training Statistics

The full process involves charting the educational paths of a generation from the start of compulsory schooling to the moment it ceases to be active (intragenerational monitoring) and then to compare changes in these paths over time for different generations (intergenerational monitoring).
Application of this approach in five European countries produced significant results that prove its worth.
1 The generation as the vector of the active population's educational achievement expansion
The expansion in the educational achievement of the population is a phenomenon that is observed in all European countries. The vector of this expansion is generation renewal: young Europeans are staying longer in education and are thus becoming more highly qualified in ever greater numbers1. Once their schooling is over, or drawing to a close, young people enter the labour market whilst the older generations, which are generally less well qualified, leave the labour market to enter retirement2.
At the same time, each generation replaces the preceding generation in the age structure. And since each generation is more highly qualified than the previous one, the ageing of individuals in a given generation pushes up the average level of educational achievement for a given age group and for the active population as a whole, by means of a simple ripple effect.
In other words, a country's active population can be seen as a layering or juxtaposition of generations characterised by their qualification structure, these two concepts being closely linked. Before we can study the educational level of the active population, we must study that of each constituent generation.
From a methodological point of view, monitoring each generation in order to evaluate educational expansion is not the same as studying the output of education systems (ES) via the concept of "system leavers". We are concerned with the very long-term monitoring of the qualification structure of a generation, not with analysing the moment at which it enters the labour market, which occurs at different ages for individuals within the same generation: it takes around 10 years for an entire generation to leave the initial schooling system. Long-term monitoring of this type allows us to measure educational expansion by looking at all qualifications obtained, in terms of initial and continuous training, throughout an individual's life. This is the only way of establishing a link between the output of education systems and the qualification structure of active populations. Conversely, the methodology based on "ES leavers", which is invaluable for studying the job commencement phase, covers a dozen different generations. Monitoring on the labour market is not an option.
The generation-based approach provides a picture of the increase in the educational achievement of the active population that is consistent with analyses of the distribution of qualified individuals within the active population.
2 A given generation acquires most of its qualifications before the age of 30.1 Cf. Key Data on VEP, Eurostat Cedefop 2000, pages 18-19. 2 It should, however, be borne in mind that a given generation enters and leaves the labour market at different
ages and on different dates, i.e. at different points in the (short term) economic cycle.
10th CEIES Seminar – Education and Training Statistics 55

Generally speaking, the education/employment flow can be broken down into major sections. The same pattern is discernible in the long term in all European countries. First there is the initial period of compulsory schooling, then specialisation and the acquisition of "initial" qualifications1, followed by entry into the labour market, then a career with the option of further training, followed by retirement. However, the age of a generation at each of these stages changes with time owing to the impact of longer schooling, and varies from one country to another. The longitudinal study of a generation's progress through the education and employment systems via statistical surveys yields additional details of changes in these parameters - decrease in the length of obligatory schooling, lower average age upon completion of studies, increasingly late entry into the labour market, older retirement age - and allows comparisons to be made on an international basis.
On a more basic level, intragenerational monitoring has shown that a generation acquires the bulk of its qualifications by the age of thirty. Continuous training received after the age of thirty2
(generally known as "life-long" training) has only a very marginal impact on this basic parameter. Every generation is permanently marked by the education system it followed when young. This shows that "initial training" in Europe, with slight national variations that we cannot go into here, basically shapes the subsequent award of educational qualifications. The functioning of the education systems, which results from the interaction of all the parties involved in the initial phase of educating young people, has a crucial impact on the generation's educational achievement level, and thus on the nature and volume of skills subsequently available on the labour market.
The generation-based approach allows us to pinpoint the moment in time when the qualification structure of a given generation reaches the value that it will basically retain thereafter.
3 Each generation has its own educational history that makes it unique on the labour market.
The educational expansion of the active population is caused by the spread of additional qualifications acquired by new generations. These, in turn, owe the structural increase in their level of qualification to the longer period spent in initial education. All that remains to be established is how, i.e. by what mechanisms within the system, by what changes to the educational process, this increase was maintained or initiated. The way an ES operates can be likened to the fractional distillation process used in refining. The raw material (the entire generation starting school) is gradually channelled towards different types of education resulting in qualifications at different levels, after periods of education that differ in length and that are shaped by different educational partners (businesses/schools).
Thus, each generation experiences the education system in a slightly different form, its progress being marked by the total number of paths created by orientational nodes, with varying percentages
1 This is initial training in the broadest sense. For our purposes, Germany's dual system of vocational education and training is considered initial training. It also includes "post initial" training, i.e. people returning to training after a number of years' work. This is particularly common amongst young people leaving the education system without qualifications, and also covers certain types of adult training schemes.
2 This continuous vocational training provides the individual with a diploma at a level higher than that previously achieved.
56 10th CEIES Seminar – Education and Training Statistics

of the generation (at birth) being affected. The influence of educational policies is fundamental to the state of the ES at a given point in time: the volume of flows is unstable, as are the orientiational nodes, and each generation is different in terms of the upward shift. This means that each generation's experience of the ES is unique, giving it a unique educational history.
It should be noted that it is paradoxical to talk of the "form of the ES2" experienced by a given generation in that it describes a longitudinal state of affairs, and differs from the status of the ES described in the organisation charts published by the ministries in the Member States. These charts show the different types of teaching, or streams, available on a given date. They are static descriptive mechanisms that do not show how young people actually move within the system, either at a given point in time (functioning of orientational nodes for a given school year) or, a fortiori, for a particular generation. In order to produce a graphic representation of a generation's entire educational history, we can use school demographic methods, drawing on the distillation image mentioned above: the path taken by a generation is charted by the successive rates of entry to the orientational nodes. This produces an "educational graph" for the generation (cf. paragraph II.2).
The uniqueness of a generation's educational history, depicted in graph form, is statistically recorded and "photographically reproduced", so to speak, in the qualification structure which the generation ultimately attains (at the age of thirty).
And it is this unique pattern that emerges years later on the labour market in studies of the qualification structure of the labour supply.
This is easier to understand if we look at the first generations to be affected by the creation of a new qualification. In France, for example, the first generation affected by the award of the baccalauréat professionnel [vocational baccalauréat]3 will occupy a unique position for its entire working life, both in respect of previous generations (which were unable to proceed beyond the BEP4), and in respect of more recent generations (which hold more vocational baccalauréat qualifications). Obviously, the pioneer generation will occupy a unique position, though this is equally true of all subsequent generations in that the relative quantities of the various vocational qualifications will necessarily lead to competition - albeit numeric - between qualification holders. By extension, this is true for all levels of qualification in an educational expansion situation. And unqualified individuals, which were the norm in older generations, are now being edged out by the increase in qualified individuals, in both number and kind.
Generation-based analysis shows the educational history behind the educational structure of a generation on the labour market. In other words, it allows us to establish a link between educational history and relative position on the labour market. This enhances the value of the inter-generational approach in analyses of the competitive forces at work on the labour market.
4 The long-term effect of educational measures on the functioning of labour markets
A generation's unique educational profile charts its course through the ES, i.e. how its schooling was shaped by the education policies and actions of the parties involved. 3 This qualification, introduced in 1985, first appeared on the labour market in 1987, and affected several
generations simultaneously owing to time lags in the educational system (figures from the Ministry of Education show that the first vocational baccalauréats were sat by the 1964 to 1970 generations).
4 Brevet d’Etudes Professionnelles [vocational studies certificate], which is lower than the vocational bac and provides access to it.
10th CEIES Seminar – Education and Training Statistics 57

As the educational structure acquired during initial schooling is a lasting feature of each generation, the impact of an educational measure can be likened to a wave moving at a speed that is proportional to the ageing of a generation.
In other words, the first generation to experience an educational policy measure will remain the prime vehicle of this measure within the active population for the duration of its career.
Moreover, an educational policy measure taken at a given moment will, as a result of the ripple effect initiated by the generations that were the first to benefit from it, have a very long-term effect on the way the labour market functions: it will take around 40 years for the vocational baccalauréat to disperse fully, and another 40 years or so for it to completely disappear from the active population once it is discontinued. Over the past few years, France has seen certificates of primary education disappear from the active population. This is because the last generations to have received this qualification, which was discontinued many years ago, are now reaching retirement age. The impact of this dispersion phenomenon is comparable to that of demographic variations: the appearance of generations with new types of qualifications prompts changes in the way the labour market functions, changes akin to those created by the arrival of generations with low or high birth rates. In terms of the individual, forming part of a generation with a high or low birth rate affects the individual's chances of mobility and promotion during his or her working life. Similarly, forming part of a generation that is "pre or post" a particular reform may have an impact on where the individual comes in the queue for a particular job1.
The generation-based approach thus allows us to take long-term account of the impact on labour market dynamics of educational policy measures taken at a particular point in time.
II – USING AVAILABLE DATA FOR THE GENERATION-BASED APPROACH
There are no statistical sources that can be used to monitor the educational and professional progress of all active generations between the ages of 10 and 65 on an annual basis. Other than specific surveys, countries generally have two types of source - long or short series of sample surveys of the active population that provide snapshots at more or less regular intervals, and ministry of education records of pupils enrolled in educational/training institutions.
For generation-based monitoring, we therefore used both types of source in each country, i.e. administrative data to monitor pupils in training institutes, and series of surveys of the active population to monitor changes in the qualification structure during working life. For each source, we will illustrate the points made above, and provide a brief description of the method we used. We will also briefly describe the problems encountered, many of which were country-specific.
1 Chronological monitoring of a generation's qualification structure: data from employment surveys
1 The two phenomena may go hand in hand; cf. for example [CHAUVEL 98].
58 10th CEIES Seminar – Education and Training Statistics

The French employment surveys carried out annually by the INSEE are sample surveys conducted on a representative sample of the total population of individuals aged over 15. 22 surveys, from 1976 to 1998, were drawn on and compared in order to chart changes in the characteristics of various generations over a period of 22 years. This is the longest series used in this project, which is why we are presenting it here.
Each generation may be observed 22 times. The age at which it is observed varies according to the generations: thus, the generation born in 1960 has been monitored from the age of 16 (1976 ES) to the age of 38 (1998ES). This is the first generation for which changes in the qualification structure from the end of compulsory schooling can be monitored. By contrast, generations born after 1980 only "exist" statistically in the most recent surveys and so cannot be monitored. Finally, all generations born between 1940 and 1960 may be observed at different points of their active life over a period of 22 years.
Armed with a file covering all 22 surveys (3.5 million records), we used a specific relationship [Age = Year of survey - Year of birth] to produce two types of monitoring system, intra-generational monitoring to chart changes in the qualification structure over time (cf. Fig. 1) and inter-generational comparisons showing the rise in the average level of educational achievement from generation to generation (cf. Fig. 2) and the very slight rise in the number of holders of tertiary education qualifications over the age of 30 (cf. Fig. 3).
The 1960 generation was chosen for the first type of system. Changes in the qualification structure between the ages of 16 and 38 are given in a classification of qualification levels ranked in terms of number of years' study, ranging from category 1 ("no qualifications") to category 5 (holder of a certificate of higher education") (Cf. Steedmann&Vincens 2000].
10th CEIES Seminar – Education and Training Statistics 59

Fig. 1 : Rate of acquisition of qualifications for the generation born in 1960 in France
Source: French national report [Béduwé Fourcade 99]
[BOX ON RIGHT READS:No qualificationCEP(1b) [certificate of primary studies]BEPC(2) [study certificate, first cycle]Niv5(3) [level 5]BAC(4) [baccalauréat]SUP(5) [higher]
x-axis reads:Age (76 to 98ES, INSEE, France)]
At the age of 16, all young people born in 1960 in France are still at school and none of them hold certificates of education. At the age of 38, the structure has stabilised at 23% without any certificate of education, with 11.5% of the cohort holding a certificate of higher education. These percentages, and those for intermediate qualifications, remain virtually unchanged once the cohort reaches the age of 30.
In order to compare several generations, we converted the educational structure into an "mean human capital" indicator, transforming each qualification level into a mean number of study years. The intra-generational plot of this KH indicator - its turning point and peak value - can be compared for several generations (Fig. 2).
60 10th CEIES Seminar – Education and Training Statistics

Fig. 2 – Mean KH indicator for several generations, by age
Source: French national report [Béduwé Fourcade 99][x-axis reads:Age of individuals,Employment Surveys 1976 to 1998, INSEE, France]
The above graph shows all "observable" generations around 16-30, i.e. generations born between 1956 and 1976 (for clarity's sake, we have only shown one generation in four). The expansion in educational level is evident from the fact that, at a given age, the younger the generation, the higher the indicator.
For the four generations shown (though this is equally true of all intermediate generations), 30 is the age beyond which the KH indicator remains virtually unchanged, the extreme value increasing constantly for a given age and for each new generation. It increases from 5.8 at the age of 30 for the generation of 1956, to 6 for the generation born in 1968. And subsequent generations are set to see a major increase in this indicator by the age of 30.
We can run a more accurate check on the stability of the qualification structure beyond the age of 30 for the generations currently on the labour market (Fig. 3). We need merely observe cohorts at different points in time, i.e. in several surveys. The example below shows the proportion of higher-education qualifications for generations born between 1946 and 1960; observations over a 20-year period (1978 to 98) shows negligible variations in this proportion.
10th CEIES Seminar – Education and Training Statistics 61

Fig. 3 - Variation over 20 years of the proportion of higher-education qualifications in France, by generation
Source: EDEX comparative report EDEX [Vincens, Steedman, 2000][x-axis reads:Year of birth]
Problems encountered
The United Kingdom and Italy worked with data from the Eurostat Labour Force Survey and the ISTAT Labour Force Survey. In these sources, the age variable is recorded in age groups of four years. This means working on four generations simultaneously, i.e. monitoring them at intervals of four years, as the following graph for Italy shows (Fig. 4):
Fig. 4 – Rate of acquisition of qualifications for generations born between 58 and 63 in Italy
Source: EDEX comparative report [Vincens, Steedman, 2000]
[Box on right reads:Primary school leaving certificate or no qualificationLower secondary school leaving certificateUpper secondary school leaving certificateDegree etc.
x-axis reads:Age of generations '58-'63, Labour Force Surveys, ISTAT, Italy]
62 10th CEIES Seminar – Education and Training Statistics

The phenomenon of the gradual acquisition of qualifications between 14-19 years and 20-25 years is impossible to reproduces graphically. What this graph does show is that, for the 58-63 generations, the qualification structure did not really stabilise at the age of 30. The following graph bears this out - Italy is the only country that participated in the survey that does not show a turning point at around 30. Students begin working before they have obtained their university degrees, thus delaying their acquisition. Unfortunately, this phenomenon cannot be charted in greater detail, because the age category is not precise enough and the series are too short.
Fig. 5 – Share of "Laurea" [degree] qualifications in Italy for several generations: changes 93-97
Source ISTAT, comparative EDEX report [Vincens, Steedman, 2000]
[y-axis reads:% with Laureax-axis reads:Year of birth]
Germany, by contrast, was unable to produce a graph charting intra-generational trends owing to a lack of data: as the question on the level of education in the microcensus was made optional in the 90s, changes in structure are biased by the rate of non-response, particularly amongst the less well qualified.
2 Construction of educational paths: administrative data on pupil flows
Method used
The comparative analysis of changes in education systems in the long term must take account of the educational expansion of successive generations passing through systems that are in a state of constant flux. This complex phenomenon can be represented by using a graphic method that takes account of the way young people move within the system (cf. graphs below). To do this, we can use school demography methods, and once again draw on the "refinery" image. A cohort of children enters primary education (generally around the age of 6), then moves from year to year. As it moves upwards, it will encounter a number of junctions leading to different educational paths and the acquisition of qualifications at different levels. At each of these junctions (or nodes, which can be likened to valves in the piping of a refinery), there is the likelihood of transition to such and
10th CEIES Seminar – Education and Training Statistics 63

such a stream or path. This produces a chart for a given generation showing the proportion of each generation that reaches a certain level or obtains a certain type of qualification.
It must be borne in mind that this type of graph does not show an educational system at a given point in time (as an organisational chart does), but shows the system through which a generation has passed - it gives a "longitudinal" picture, or a picture of the "state" of an educational system in relation to a particular generation.
Once we have graphs for several generations, we can depict the national dynamics of a system. Then we can compare successive graphs for several national systems and examine their dynamics.
The following graphs show the progress of three different generations (1952, 1962, 1972) through the education systems of two countries (Germany and France).
In these graphs, as in the organisational charts for national education systems, the main orientational classes appear on the grid at the theoretical age at which pupils or students should reach them. In reality, for a given generation, the more a national educational system makes use of repeats, the greater the variation will be in the actual ages at which these classes are reached. The figure at a given point in an educational pathway indicating the portion of the generation that reached this point takes account of this variation, but the figure appears in the graph at the theoretical age. Thus the Abitur level is at 19 for Germany, and the baccalauréat at 18 for France. The graphs chart the main educational pathways actually followed by a generation.
For the German system, the graph for the 1952 generation shows that 14% of this generation reached Abitur level, 23% the mittlere Reife, 69% completed the dual apprenticeship system and 11% graduated from university. For the 1962 generation, the proportions have changed: 19% take the Abitur, 33% the mittlere Reife, 72% complete the dual system and only 9% graduate from university, representing a slight fall. For the 1972 generation, the proportions have changed again, and again upwards for the Abitur, the mittlere Reife and the dual system. German data do not yield any information about university completion rates for this generation.
It should, however, be noted that, for all generations, the German system has remained structurally stable - no new educational paths or streams have been created. The overall functioning has changed in terms of the distribution of flows between basic points.
The graphs for France show that, for the 1952 generation, 40% reached class three, 17% obtained the baccalauréat, 19% obtained the CAP (including apprenticeship), the recently introduced BEP was obtained by 1% of pupils only, whilst at tertiary level 1% graduated from engineering colleges, 5% were awarded degrees and 2% diplomas of short tertiary studies. For the 1962 generation, an upward trend is discernible at all levels: 66% reached class three, 25% obtained the baccalauréat, 27% the CAP and 9% the BEP. At tertiary level, engineering and commercial colleges accounted for 2% of the generation, degrees 6% and short tertiary 5%. 75% of the 1972 generation reached class three, 41% obtained the baccalauréat,, 29% the CAP and 14% the BEP, whilst 4% obtained the vocational baccalauréat. The tertiary level also shows an increase, the figures for colleges, degrees and short tertiary being 4%, 12% and 10% respectively.
The French system shows structural changes from one generation to the next, i.e. educational pathways are modified. The secondary/upper primary double stream disappears (the 1952 generation being the last to be affected by it), the BEP stream appears for the 1962 generation and the baccalauréat extension is well established for the 1972 generation. The graph considerably simplifies pathways within tertiary education: although at first sight this appears to be highly stable, there is in fact an increase in the number of bridge and conversion courses.
64 10th CEIES Seminar – Education and Training Statistics

Problems encountered
Before we can compute indicative figures for the graphs, we need to know the age distribution for the pupils in a given year at the start of several new school years.
Since 1991, the French the Ministry of Education has published a table for the terminal class of the baccalauréat, which we can use to calculate a given generation's access to this level of schooling. This table distributes pupil numbers in the terminal class by years of schooling and year of birth. Six successive years are needed to calculate the final rate of one generation's access to the baccalauréat.
The ministry keeps national records of pupils that can be used to make such calculations for all primary and secondary classes (up to the baccalauréat) from the 1985 school year. 1975 is the first generation for which we can calculate graph values for the two main secondary classes (third and baccalauréat) using data from these records. As from the 1985 school year, we can calculate the total number of pupils from the 1975 generation that reached the third class (by adding up all pupils from this generation that were in class three between the age of 10 and 22). This shows that 87% of this generation reached this level, and that 73% reached class three at the "normal" age of 14 or 15.
For older generations (pre-1975), we cannot calculate the proportion reaching class three using these records. For the baccalauréat level, we can go back to 1969, but no further1.
1 The Ministry of Education publishes data by class and age in the "National Education Tables" (1966 to 1973) for the school years 1964 to 1972. These data could be used to provide the information needed for certain generations.
10th CEIES Seminar – Education and Training Statistics 65

GERMAN EDUCATION SYSTEM
1952 generationTheo. age.
11 12 13 14 15 16 17 18 19 20 21 22 23 24
Year 1963 1968 1969 1971 1972 1976Level Lower secondary Upper secondary Post-secondary/tertiary
GRAPHICS READ AS FOLLOWS, FROM TOP TO BOTTOM:Abitur examination UniversityFachhochschulereife [Technical secondary school certificate]Fachhochschule [Institution of higher education offering degree programmes]Fachschule [Technical school providing advanced vocational training]Mittlere Reife examinationNo certificate of general education, Hauptschule [Lower secondary school], Berufsfachschule [Part-time vocational school at upper secondary level] 1 yearApprenticeship, BFS 2-3 yearsTechnicians and master-craftsmen schools
1962 generationTheorectical age.
11 12 13 14 15 16 17 18 19 20 21 22 23 24
Year 1973 1978 1979 1981 1982 1986Level Lower secondary Upper secondary Post-secondary/tertiary
GRAPHIC IDENTICAL TO ABOVE
66 10th CEIES Seminar – Education and Training Statistics
sans diplôme d’instruction
générale, Hauptschule, 60
23
Mittlere Reife
Fachhochschulreife3
Abitur
14
Apprentissage, BFS 2-3 années
69
Fachschule
6
Fachhochschule
6
Université
11
Ecole techniciens et maître-artisans
5
sans diplôme d’instruction
générale, Hauptschule, 45
33
Mittlere Reife
Fachhochschulreife 3
Abitur
19
Apprentissage, BFS 2-3 années
72
Fachschule
5
Fachhochschule
6
Université
9
Ecole techniciens et maître-artisans
4

1972 generationTheor. age.
11 12 13 14 15 16 17 18 19 20 21 22 23 24
Year 1983 1988 1989 1991 1992 1996Level Lower secondary Upper secondary Post-secondary/tertiary
GRAPHICS IDENTICAL TO ABOVE, BUT LEFT-HAND BOX READS:Orientation cycle
FRENCH EDUCATION SYSTEM
11 12 13 14 15 16 17 18 19 20 21 22 23 24Lower secondary Upper secondary Tertiary
1952 generation
1963 1964 1965 1966 1967 1968 1969 1970 1971 1972 1973 1974 1975 1976
GRAPHICS READ:BaccalauréatBEPC level [certificate of lower secondary education]Ecoles d'ingenieurs [engineering colleges]BEP [vocational studies certificate]IUT [university institutes of technology]BTS [advanced technical certificate]licence [degree]CAP [vocational aptitude certificate]
10th CEIES Seminar – Education and Training Statistics 67
sans diplôme d’instruction
générale, Hauptschule, 40
37
Mittlere Reife
Fachhochschulreife ?
Abitur
23
Apprentissage, BFS 2-3 années
75
Fachschule
?
Fachhochschule
?
Université
?
Ecole techniciens et maître-artisans
?
Cycle d‘ orientation
17
1
19
5
1
40
2
NiveauBEPC
BAC
Ecoles d’ingénieurs
licence
IUT, BTS
CAP
BEP

1962 generation
1973 1974 1975 1976 1977 1978 1979 1980 1981 1982 1983 1984 1985 1986
GRAPHICS AS ABOVE
1972 generation
1983 1984 1985 1986 1987 1988 1989 1990 1991 1992 1993 1994 1995 1996
GRAPHICS AS ABOVE, EXCEPT FOR LAST BOX:Bac professional [vocational baccalauréat]
Consequently, producing figures for the graphs depicting the generations chosen in the five countries to illustrate changes in national education systems over a long period (1942, 1952, 1962 and 1972) proves a hazardous exercise. All we can do is piece together a rough picture using data on the number of pupils in the various classes, though we need not go into the details here. The resultant indicators are very approximate, but there are various ways of checking them.1. Calculated using the same method for all four generations, these values have the merit of allowing meaningful chronological comparisons to be made for the four generations in question.
1 The data produced by Duru-Bellat/Kieffer (1999) using the French FQP [professional training and qualification] surveys allow us to monitor changes in access rates to the sixth, third and terminal classes for the generations of 1920 to 1972.
68 10th CEIES Seminar – Education and Training Statistics
NiveauBEPC
NiveauBEPC
BAC
BAC
Ecoles d’ingénieurs
Ecoles d’ingénieurs
licence
licence
IUT, BTS
IUT, BTS
Bac professionnelCAP
CAP
BEP
BEP
66
25
95
6
2
27
75
29
14
4
12
10
4
41

In Germany, figures for the graphs come from a secondary analysis of a representative survey of the occupied population in 1991/19922. The survey yields information on the biography of individuals, and this was used to reconstruct the passage of several generations through the education system. To analyse paths through the education system, the cohorts born in 1940-44, 1950-54 and 1960-64 were determined. Thus, the figures shown in the graphs for the three generations that were selected (born in 1942, 1952 and 1962) are in each case the average of the aggregated survey cohorts.
CONCLUSION
The generation-based approach used in the EDEX project has produced some invaluable findings about the dynamics of education systems and about the impact of the educational expansion on the qualification structure of different generations. These will be useful for the second phase of the project, which will look at how this increase in the academic achievement level of successive generations will affect the labour market.
In the educational field, the production of the necessary tools (i.e. graphs) for retrospective analyses has often been stymied by the lack of age-based data in a suitable form, no doubt because the publication of "generational access rates" is not yet as widespread as conventional statistics on rates of transition from one level to another (with no distinction according to generation). Conventional statistics effectively provide a snapshot view, whereas generational access rates can be compiled only once a generation has completed a given level (owing to repeats and other delays). However, the picture is more promising when it comes to monitoring the younger generations, particularly as from the 1975 generation in the case of France - it is a simple matter to chart the expansion in the academic achievement level. The oldest data, where they exist, are often in paper form only, so input work is obviously considerable.
For activity monitoring, the situation also varies considerably from country to country. It is a pity, for our purposes, that full use cannot be made of the detailed data supplied by the annual European Labour Force Survey, as the age groups are four years. Though this would initially appear to be an advantage, it means that each generation's progress cannot in fact be monitored using the longitudinal method. As is to be expected, the further we go back in time, the sparser the data. But some of the men and women making up today's labour supply received their schooling/training 40 years ago. If we are to understand the competitive forces at work on today's labour market, it is important to establish what education these people received.
More important still is the likely impact of this expansion in education. It is an undeniable fact that all European countries saw an increase in the award of qualifications during the 80s, i.e. for the generations born in the early 70s. The first of these highly educated generations is now aged 30. The impact that this surge in the number of qualified individuals can be expected to have on employment has therefore yet to be felt. Our statistical system must be ready to measure this impact, and we must be prepared to analyse it.
2 BIBB/IAB 1991/1992: "Qualifikation und Berufsverlauf" [Qualifications and career profile]. Sample of 24 116 Germans resident in Western Germany or Berlin and aged between 18 and 64.
10th CEIES Seminar – Education and Training Statistics 69

BIBLIOGRAPHY
BÉDUWÉ C., ESPINASSE J.M., (1995), "France : Politique éducative, amélioration des compétences et absorption des diplômés par l'économie", Sociologie du Travail, 4, pp.527-556.
BÉDUWÉ C., GIRET J.F., (1998), "Analyse comparative des modes d’intégration des jeunes aux marchés du travail européens", note LIRHE, No 281 (98-20), October. "Desarrollo de la formacion y mercados de trabajo en Europa", Revista de Educacion, Numéro spécial Economia de la educacion, ENERO – ABRIL 1999, Spain
CHAUVEL L. (1998). « Le destin des générations. Structure sociale et cohortes en France au XXème siècle ». Le lien social. PUF. Paris.
DURU-BELLAT M., KIEFFER A. (1999). « La démocratisation de l’enseignement « revisitée ». Une mise en perspective historique et internationale des inégalités des chances scolaires en France ». Cahiers de l’IREDU No 60, Dijon, May 1999.
MALLET et ALII, (1997), "Diplômes, compétences et marché du travail en Europe", Revue Européenne de la Formation Professionnelle (CEDEFOP), No 12, pp.21-36.
PLANAS J., GIRET JF., SALLA G., VINCENS J. (2000) . "Marché de la compétence et dynamique d’ajustement". Cahier du LIRHE No 6.
National reports produced as part of the EDEX project:
JM MASJUAN, G. SALLA, J. VIVAS (1999) "Analyse des structures éducatives en Espagne" Final report. GRET, Spain
L FREY, E GHIGNONI, A CAVICCHIA (1999) Final report WP1, CERES, Italy
H STEEDMANN and A VIGNOLES (1999) "Schooling and the Supply of Qualifiactions in the UK 1930-1997" LES, UK.
C. BEDUWE ET B. FOURCADE (1999) "Générations et hausse d’éducation en France", Lirhe, Université des Sciences Sociales, France.
B. LUTZ, J.HAAS (1999) "Politics, Educational System and Educational Flows in Germany", ZSH, Halle, Germany
International report produced as part of the EDEX project:
J. VINCENS and H. STEEDMAN (2000), "Dynamique des systèmes éducatifs et qualification des générations", summary report for the TSER EDEX project.
70 10th CEIES Seminar – Education and Training Statistics

THE USERS VIEW
Mário CarvalhoSindicato dos Professores do NorteR.D. Manuel II, 51-3°4050-345 [email protected]
1. INTRODUCTION
Education can be seen as a prime means of encouraging and implementing modernisation, i.e. adapting to change and ensuring that human resources have the qualifications necessary for national development. This will involve expanding the education system and raising the level of education of the population, and may well also entail diversifying the entire education system which follows the basic level in terms of courses, curricula and institutions. "Education has an equally crucial role to play, as an infrastructure and an instrument in the modernisation process which can regulate the quantity and quality of labour supply at the same time as it can encourage and guarantee that young people are mobilised in schools and prepared for the move into working life at a time when structural unemployment is becoming much more pronounced" 1.
Educational reforms are implemented in response to cultural, economic or political changes or imperatives. They always reflect a move onto new ground (or into equilibrium) where tensions persist because several objectives are being pursued or because a range of options are available in defining priorities.
Historically, the difficulty which is usually encountered is that education systems have to adapt to the new needs encountered by a society faced with constant change. In this context, training provides the response to the need to acquire skills and knowledge which can be used in the working world.
The future may see the gap between education and training narrow and closer links being forged between general training and vocational training.
2. A SNAPSHOT OF THE POPULATION IN PORTUGAL
The Instituto Nacional de Estatística (INE)2 estimates that some 10 million people live in Portugal today (Tables 1 and 2), and this population has aged gradually as the proportion of young people has declined and older groups have gained ground 2, 3. In 1995, 12.4% of the population was between 5 and 14 years of age, the age of compulsory education 3. While INE projections also show a figure of 12% in 1995, this value will decline to 11.6% in 20104.
The projections (Table 2) indicate that this demographic trend will persist, which means that a considerable effort to educate and train young people will be essential to ensure the country's development and to offset the gradual rise in the number of elderly people.
10th CEIES Seminar – Education and Training Statistics 71

Table 1 - Resident population in Portugal by age group
Resident populationAge 0-14 15-64 65 or over Total1960 29.1 % 62.9 % 8.0 % 8 889 3921970 28.5 % 61.8 % 9.7 % 8 611 1251981 25.5 % 63.1 % 11.4 % 9 833 0141991 20.0 % 66.4 % 13.6 % 9 862 540
Source: Instituto Nacional de Estatística
Table 2 - Projections of the resident population by age group
Projections of the resident population in PortugalAge 0-14 15-64 65 or over Total1995 17.6 % 67.8 % 14.6 % 9 920 7602000 16.8 % 67.7 % 15.5 % 9 998 1742005 17.1 % 67.9 % 16.0 % 10 107 7442010 17.2 % 66.4 % 16.3 % 10 238 047
Source: Instituto Nacional de Estatística
3. THE EDUCATION AND TRAINING SYSTEM IN PORTUGAL
3.1. THE EDUCATION SYSTEM
3.1.1. COMPULSORY EDUCATION
Compulsory education in Portugal is provided in basic education (ensino básico), a nine-year programme intended to provide everyone with a standard general preparation which may be followed by further study or schemes geared to working life.
Basic education consists of three linked cycles (4 years + 2 years + 3 years), each of which rounds off and expands on the previous one. It is universal, compulsory up to the age of 15 and is free.
In the first cycle, a single teacher provides an overall education over four years, possibly calling on assistance in specialised areas.
In the second cycle, education is organised in interdisciplinary areas of basic training, which is mainly provided by one teacher in each area over two years.
In the third cycle, different disciplines are taught by specialists. On completing basic education, students are faced for the first time with the choice of continuing their studies in any of the range of forms offered in secondary education or going onto the labour market.
Although compulsory education lasts nine years, the drop-out rates at national level in 1995 ranged between 2% in year 5 and 9% in year 9 (Table 3), although there were significant regional variations. Low levels of qualification make it difficult to integrate these young people into working life.
72 10th CEIES Seminar – Education and Training Statistics

Table 3 - Drop-out rates in 1995 (second and third cycles of basic education/mainland Portugal/daytime education )
Second cycle of basic education Third cycle of basic education Year 5 Year 6 Year 7 Year 8 Year 9
2 918 2%
4 622 3%
9 271 6%
6 660 5%
12 679 9%*
Source: Appraisal and Forecasting Services of the Appraisal and Forecasting Department,
Ministry of Education (DAPP/ME), 1998 5
N.B.: * 2% left the system without a diploma and 7% with a diploma;
3.1.2. SECONDARY EDUCATION
Secondary education is the level of standard education which follows on from basic education and aims to take the student's training into greater depth with a view to continuing studies or taking up work. The courses are either predominantly geared towards continuing studies (general courses) or are predominantly geared to working life (technological courses), and free movement between these is guaranteed. It has, however, not been possible to establish the technological course as a model with a degree of ambiguity in its status, and it seems to have become the alternative for the less able or for young people who do not aspire to continue their studies, and failure rates are frequently in excess of 50%.
Both kinds of course last three years, corresponding to school years 10, 11 and 12.
Training middle-ranking technical staff in vocational schools has provided one alternative to the traditional education system. The vocational schools were set up in 1989 under the joint supervision of the Ministry of Education and the Ministry of Employment, with direct input from agencies outside the public sector, and specifically the municipalities, regional and sectoral associations and business. From the very outset, they have maintained strong links with the economic structure and the working world. The number of vocational schools increased until 1994/95, at which point the number of start-ups dipped. In 1998, the approximately 160 schools with 25 000 students in the sector accounted for approximately 6% of the secondary education supplied.
Students who successfully complete secondary education are awarded a diploma certifying the training they have received. The certificates awarded in technological courses and in the vocational schools are also qualifications for the purposes of pursuing professional activities at level III. On completing secondary education, students are for the second time given the choice between continuing their studies in any of the subsystems of higher education or going onto the labour market.
Approximately 90% of students who complete basic education move on to secondary education . According to data from the Ministry of Education, 28% of students enrolled in secondary education in mainland Portugal in 1997/98 attended technological and vocational courses, and 7.5% of them did so in vocational schools 5,6 (Table 4).
10th CEIES Seminar – Education and Training Statistics 73

Table 4 - Number of students in secondary education in 1996/97
Number of students
%
TOTAL 427 409 100%General courses 237 953 55.7%Technological courses 79 580 18.6%Year 12 in education 36 547 8.6%Secondary education - night school 20 676 4.8%Vocational schools 26 372 6.2%Recurrent education 26 281 6.1%
Source: DAPP/ME
The drop-out rates in secondary education are high. In 1995/96, they were around 18% in year 10, 12% in year 11 and 25% in year 12 (Table 5). In technological education, the rate may be as high as 90%, and is higher than 50% in most cases 6. In vocational schools, however, this is not the case, possibly because the students are more motivated and the conditions on offer are better.
The DAPP/ME forward study cited ("Simulation of Demand for Basic and Secondary Education")4
concerns daytime education in mainland Portugal, does not include students in alternative training systems such as vocational schools and the vocational training offered by the Ministry for Qualification and Employment and was based on the total number of students completing compulsory education in 2000/01. This study, to which Table 5 refers, indicated an overall rate of enrolment in education of 66% in 2000/01 as compared with European rates of the order of 78%.
Table 5 - Enrolment in basic and secondary education (mainland Portugal/daytime education )
Year 6 Year 9 Year 11 Year 121990/91 82% 58% 47% -1995/96 98% 85% 64% 56%2000/01 100% 100% 72% 66%
Source: DAPP/ME forward study of daytime education in mainland Portugal 4
N.B.: does not include students in alternative training systems such as vocational schools and vocational training provided by the Ministry for Qualification and Employment.
3.1.3. HIGHER EDUCATION
Higher education is available to students who have completed secondary education or the equivalent and have demonstrated the ability to take up higher education. It is also open to people of more than 25 years of age who do not have those qualifications but have passed the tests to qualify for acceptance.
While the public higher education system does not have a strictly binary structure, it does comprise two sub-sectors (university and polytechnic) which are linked at various levels and for which the Basic Law on the Education System lays down common general objectives and specific objectives between which it is difficult to distinguish: University higher education aims to guarantee a solid scientific and cultural education and to
provide technical training for the pursuit of professional and cultural activities and encourages the development of conceptual and innovative skills. The degrees awarded are licenciado (after four or five years' study), masters and doctorates.
Polytechnic higher education aims to provide a solid higher-level cultural and technical education, to develop innovative and critical analysis skills and to provide theoretical and practical scientific knowledge for application with a view to pursuing professional activities.
74 10th CEIES Seminar – Education and Training Statistics
The degrees awarded are bacharel (after three years' study) and licenciado (after four or five years' study, possibly including a period of work experience).
In some areas of polytechnic education, the degrees are structured in two parts, and are known as two-stage degrees. Courses in engineering last 3+2 years. The degree of bacharel is awarded on completion of the third year and permits entry onto the labour market. Entry to the fourth year is only open to students who have been awarded a bacharel degree.
Higher education after work is not widespread, being more common in polytechnic education and in the former higher education schools which were incorporated into this sector. In some cases, as many as one-third of the students studying in a school may be taking classes organised after work.
The university and polytechnic subsystems are linked, and movement from one to the other is guaranteed.
Postgraduate study is predominantly academic, and vocational postgraduate work is extremely limited in the public sector and does not exist in the private sector. Table 6 shows the number of graduate and postgraduate degrees awarded in Portugal. No information is available on the number of doctorates at national level 7.
Table 6 - Academic degrees awarded in the higher education sector 7
Academic year
1992/93 1993/94 1994/95 1995/96
Bacharel 9 515 10 047 10 344 10 756Licenciado 16 873 21 311 24 239 26 119
Masters 714 871 1 457 1 704
Because the polytechnics were established more recently, polytechnic education is often seen as "second-rate university education". The distinguishing feature of the polytechnic network, which incorporated the former higher education colleges, is its pronounced regional presence, and it represents a training response to the reference figure of "senior technical staff" with prospects of employment in professional activities 8.
The expansion of the higher education system in Portugal in the 1980s and 1990s began with the introduction of public polytechnic education and in particular with the explosive growth of private supply (Table 7), which in numerous cases could not provide the minimum conditions to guarantee the quality of the courses provided, and was concentrated in Lisbon, Oporto and the Norte Region.
Between 1987 and 1991, student numbers increased by 40% in the public sector, as compared with 250% in the private sector. In 1991, for the first time, supply in the private sector overtook the public sector. As of 1993, the total number of places on offer in higher education (public + private) exceeded the number of applicants 4. The striking feature of this supply is the fact that approximately 60% of students in private education are concentrated in courses in the area of social and behavioural sciences, management and law, as compared with 25% in the public sector.
10th CEIES Seminar – Education and Training Statistics 75

Table 7 - Distribution of students enrolled in higher education by sub-sectors
Public sector Private sectorUniversity Polytechnic University Polytechnic Total students
1983/84 76.0% 12.6% 7.9% 3.3% 95 8661989/90 63.5% 15.0% 10.5% 11.0% 157 8691996/97 46.7% 18.6% 15.0% 19.7% 344 620
Source: Ministry of Education
With the relaxation of the conditions for access and the increase in the number of private institutions, the percentage of the 20-24 age group in higher education rose dramatically from 1989/90 on, as shown in Table 8.
Table 8 - Percentage of the 20-24 age group attending higher education 7
Academic year 89/90 90/91 91/92 92/93 93/94 94/95 95/96 96/97% of age group 18.4 24.4 28.1 31.0 33.3 35.1 37.3 39.4
Source: data estimated by the Instituto Nacional de Estatística and provided by the Department of Higher Education of the Ministry of Education in May 1998
Students' preferences on going into higher education are predominantly determined by the degree of satisfaction with the quality and prestige of each course and institution, and there is a clear preference for public universities. The second criterion in choice is proximity to students' place of residence, and, combined with the costs/expenditure factor, this means that public polytechnics come second, with private education taking up the rear4.
In the light of this table and given the sustained decline in the birth rate, the forward study conducted in 1999 by the CIPES (Portuguese University Foundation's Higher Education Policy Research Centre)4 forecasts a significant fall in the number of applicants for higher education by 2005/06 and serious difficulties for higher education institutions, and private ones in particular. It is now - belatedly - forecast that, as students' last choice, the private sector may collapse following a period when institutions will inevitably have to close or to merge.
Some changes in the profile of the choices made by applicants for higher education may be linked to increasing difficulties in entering the labour market due to excess supply as well as the poor quality of the training received.
3.2. OTHER FORMS OF EDUCATION AND TRAINING
In addition to the education system, including recurrent education, Portugal has a body of training programmes overseen by the Ministry of Labour and Solidarity (MTS) and the offices of the State Secretary for Youth (SEJ). The programmes organised by the Ministry are conducted in Vocational Training Centres and the Employment Centres of the Institute of Employment and Vocational Training (IEFP). The courses organised by the offices of the State Secretary for Youth are conducted by the Institute for Youth. Table 9 shows the number of participants in the various MTS training programmes.
3.2.1. RECURRENT EDUCATION
This form of education is open to anyone over the normal age for basic education and secondary education (15 and 18 years of age) who has not had the opportunity to go through the standard education system or who has not obtained any qualifications due to failure or leaving education at an early age. It has its own specific curricula, methodologies and assessments, and the diplomas and certificates awarded are considered equivalent to those for standard education.
76 10th CEIES Seminar – Education and Training Statistics

In 1996/97, 9.6% of the students enrolled in basic education and 7.2% of the students in secondary education were in recurrent education (Annex I).
3.2.2. EDUCATION AND INITIAL VOCATIONAL TRAINING COURSES
Set up in 1997 on the joint initiative of the Ministry of Education and the Ministry for Qualification and Employment (currently called the Ministry of Labour and Solidarity), education and initial vocational training courses are intended to provide young people who have completed basic education with access to one year's vocational training leading to a level-II vocational qualification certificate while also guaranteeing completion of nine years' basic education.
These courses are organised in basic and secondary education establishments, in conjunction with other community bodies, and are aimed at young people wishing to begin working life who have attended or completed year 9 but have no vocational qualifications. They last a minimum of 960 hours, are organised to a flexible schedule during the day, and include academic training and training in the context of real work. These courses are offered by schools providing the third cycle of basic education which have the resources to provide this training or, when this is not the case, by schools which have entered into partnerships with entities in the local community, and specifically the Vocational Training Centres which are overseen by the Institute of Employment and Vocational Training.
In 1997, initial training courses for slightly more than 13 000 participants accounted for 11% of the vocational training on offer in Portugal. (Table 9).
3.2.3. APPRENTICESHIP COURSES
This system of vocational training provides sandwich courses for young people over the age for compulsory education but who, preferably, are not yet over 25 years of age.
The training is broad-based and offers young people specific job openings by giving them vocational qualifications while permitting them to make progress and obtain academic certificates.
The typical feature of these sandwich courses is the combination of theoretical and practical training components. The practical training is provided on the job, and is spread over the entire training process
On completion of an apprenticeship course, young people are awarded a Vocational Aptitude Certificate corresponding to a qualification level (II or III) which is equivalent to a specific level of education (year 9 or year 12) for the purposes of continuing studies.
During the training, each trainee signs an apprenticeship contract with the entity providing the practical training and receives a series of benefits (insurance, training grant, board and travel allowances), while the entities involved are given technical, teaching and organisational support for managing and operating measures in addition to the financial support linked to the co-financing of training costs.
The apprenticeships on offer are in vocational areas linked to the main sectors of economic activity. Nationally, approximately 15 000 young people received vocational training in sandwich courses and apprenticeships in 1997, which represents roughly 4% of young people in secondary education. One of the main obstacles to the development of the apprenticeship system is the fact that the
10th CEIES Seminar – Education and Training Statistics 77

country's economic structure is dominated by small and medium-sized enterprises with low levels of qualification.
The apprenticeship system has recorded low drop-out rates and high levels of employability.
3.2.4. OTHER VOCATIONAL TRAINING INITIATIVES
These are training schemes and systems aimed at the labour market for the purposes of initial training (job starts or qualification), continuing training (qualifications, further training, retraining or specialisation) in which no certificates or equivalents to schooling are awarded.
These are essentially enterprise-based initiatives. Some are offered by the IEFP's Directly or Jointly-Managed Vocational Training Centres, and may provide vocational qualifications at levels II and III. Others are continuing training initiatives for the purposes of further training, re-qualification or vocational retraining, and are based in enterprises/organisations as well as in training centres.
i) Initial Training
The aim is to provide vocational qualifications for young people and adults looking for their first job or higher-level post-secondary technical training. In 1997, some 13 000 participants, most of whom had completed nine years' schooling, took part in this kind of measure in Vocational Training Centres.
ii) Continuing training
The aim is to improve the qualifications of the economically active so as to give them the skills to adapt more readily to technological and organisational changes. The number of participants in continuing training measures in 1997 amounted to 63.5% of all the trainees covered (Table 9).
iii) Training for the unemployed
The aim is to provide people who have been unemployed for less than one year and those at risk of unemployment (including people intending to set up their own activities) with vocational training geared to the demands of the market which will permit their re-employment or professional mobility.
iv) Negative sectoral change
The aim is to provide the unemployed and those at risk of unemployment in regions facing negative changes in certain sectors or in the business environment with retraining to improve their prospects of employment in another occupation, sector or region, or of setting up in independent activity.
78 10th CEIES Seminar – Education and Training Statistics

v)Training trainers and other agents
These measures concern the initial and continuing training of trainers, promoters, managers and specialists in training and audiovisuals.
Table 9 - Number of participants by type of training
TYPE OF TRAINING 1997 1998*Apprenticeship 14 293 17 908Initial training 13 314 15 977Continuing training 76 152 91 382Training for the unemployed 2 668 3 202Negative sectoral changes 1 291 1 549Training trainers 12 231 14 677
Source: Institute of Employment and Vocational Training (IEFP)(*) Forecast
4. UNEMPLOYMENT IN PORTUGAL
With a view to development and lifelong training, the first problem with repercussions on young people's move into working life is the combination of the drop-out rates from basic and secondary, education and a degree of internal inefficiency in the system which is evident in areas such as mathematics and science teaching.
While the unemployment rate among young people with low levels of qualification (up to four years' schooling) is more than double the general unemployment rate, at 15.3% (Table 10), it is nevertheless lower than the average in that age range.
Oddly, the highest unemployment rate is recorded among young people with higher education, who face increasing difficulties on the labour market. In 1996, the unemployment rate for higher education graduates was 25.1%, a particularly worrying figure given that only 7% of the Portuguese population between 25 and 64 years of age have university-level qualifications. The difficulty in getting a first job, which is not encountered in every specialist area, may be related to excess supply of higher education training in some fields and the quality of the training, as mentioned at 2.1.4. This phenomenon has become more marked and is not divorced from the fact that the vast majority of our businesses are small and medium-sized enterprises (SMEs) which, by their nature, do not see the need to recruit, or are headed by people who are not sufficiently informed of the qualifications provided by higher education.
Table 10 - Unemployment rates by levels of academic qualification (1996)
Level of education TOTAL Age range 15-24Up to 4 years' schooling 5.9 15.3Schooling to year 6 9.1 11.7Schooling to year 9 9.8 19.3Schooling to year 12 9.7 19.3Higher education 4.5 25.1Any level 7.3 16.6
Source : Instituto Nacional de Estatística (INE)5
The distribution of the unemployment rates by age and level of qualifications (Table 11) also proves that it is predominantly young people with qualifications below year 12 schooling who are absorbed by the labour market.
10th CEIES Seminar – Education and Training Statistics 79

Table 11 - Youth unemployment by age and level of education in Portugal, 1995
Level of education 15-19 20-24 25-29Lower than secondary education 16 14 9Secondary education 34 20 10Polytechnic education 23 10University education 15 10Any level 17 16 9Source: OECD5
5. TRAINING AND THE LABOUR MARKET
5.1. BUSINESS STRUCTURE
In 1995, the outstanding feature of the business structure in Portugal was the predominance of enterprises employing up to nine people (80.6%), and this characteristic has become more marked (Table 12). Enterprises employing 10 to 49 people represented 16.1% of the total. Large enterprises (employing 100 or more) accounted for only 1.4% of the total and 39% of employment.
According to data from the Statistical Department of the Ministry of Labour and Solidarity (DE-MTS), the index of regional concentration of enterprises and of associated employment is extremely high. Five coastal districts alone (Aveiro, Braga, Lisbon, Oporto and Setúbal) are home to approximately 66% of enterprises and nearly 75% of employment. These same five districts are home to 81% of the enterprises with 100 or more employees, and 58.4% of these are located in the districts of Lisbon and Oporto alone. The greatest number of enterprises, 58.5% of all businesses set up, are also located in these districts.
Table 12 - Distribution of enterprises by size Mainland Portugal - %
1991 1992 1993 1994 1995Up to 9 employees 75.9 76.5 77.7 79.8 80.6
10 - 49 employees 19.6 19.2 18.4 16.9 16.150 - 99 employees 2.6 2.4 2.2 1.9 1.9
100 - 499 employees 1.7 1.7 1.5 1.3 1.2>500 employees 0.2 0.2 0.2 0.2 0.2
Source: Statistical Department of the Ministry of Labour and Solidarity (DE-MTS) - Personnel Tables N.B.: does not include general government
5.2. THE STRUCTURE OF EMPLOYMENT
According to data from the INE's Employment Survey for 1997, the economically active population in employment was 4 331 900 individuals. In terms of age (Table 13), 564 700 are under 25 years of age (13.0%), 2 486 300 are between 25 and 49 (57.4%) and the remaining 1 281 000 (29.6%) are over 49 years of age.
80 10th CEIES Seminar – Education and Training Statistics

Table 13 - Unemployed population by age groupMainland Portugal - (000)
1995 1996 1997Population in employment 4 225.2 4 250.5 4 331.9
<25 559.7 549.2 564.725-49 2 554.3 2 512.3 2 486.3>50 1 111.2 1 189.0 1 281.0
Source: Instituto Nacional de Estatística (INE) - Survey of Employment (annual averages)
By age group, in 1997, the number of young people under 25 years in employment increased by 2.8%, a value greater than that observed in employment as a whole.
The data from the Statistical Department of the Ministry of Labour and Solidarity (DE-MTS) indicate a gradual improvement in the qualifications of employees in enterprises with at least 100 workers (Table 14).
Table 14 - Distribution of employees by level of qualificationsMainland Portugal - %
1991 1992 1993 1994 1995Senior and middle managers 4.2 4.4 4.4 4.9 6.3Supervisors and highly qualified professionals 8.3 8.3 8.3 8.4 9.4Qualified professionals 39.0 39.2 40.0 40.9 43.9Semi-qualified professionals 18.1 17.4 16.9 16.7 17.5Unqualified professionals 10.8 11.3 11.2 11.9 12.1Trainees and apprentices 11.6 10.9 10.3 8.9 8.4Level unknown 8.0 8.5 8.9 8.3 2.4Source : Statistical Department of the Ministry of Labour and Solidarity (DE-MTS) - Personnel TablesN.B.: does not include general government
Analysing the qualifications of employees (92.4% of those in employment) in terms of academic qualifications and levels of qualification to take account of the complexity of the duties performed in addition to qualifications, the predominant group on the labour market are qualified and semi-qualified professionals who have completed the first and second cycle of basic education.
The DE-MTS data show that, in 1995, 3.2% of workers had qualifications below the first cycle of basic education and 42.1% had completed only the first cycle of this level of education. Middle and senior managers, on the other hand, accounted for only 5.2% of those in employment.
The results from the Social Balance Sheet, covering enterprises with at least 100 workers regardless of the contractual link, identify 5.4% of workers who have not completed the first cycle of basic education (Table 15).
Table 15 - Levels of education in the workforce
Level of education in the workforce 1991 1992 1993 1994 1995 1996 1997*
Below the first cycle of basic education 9.9 7.9 7.3 6.3 5.4 4.7 4.1Complete compulsory education 15.6 16.4 16.8 16.5 17.4 17.9 18.0 University-level higher education 4.2 4.7 5.1 5.3 5.6 6.0 6.8Sources: Statistical Department of the Ministry of Labour and Solidarity (DE-MTS) - Social Balance Sheet 10,11
5.3. ENTERPRISES' VOCATIONAL TRAINING REQUIREMENTS
10th CEIES Seminar – Education and Training Statistics 81

The bulk of investment in employee training is recorded in medium-sized and large enterprises. SMEs, which would benefit most from vocational training, do not have the finances for prolonged employee training and are particularly dependent on the training provided by the education system. Entrepreneurs have no in-depth understanding of how important knowledge and certain qualifications could be for their businesses, and the lack of skilled workers makes their enterprises vulnerable to economic and technological change.
The Survey of Enterprises' Vocational Training Needs (1996/99)12, carried out by direct interview between September and October 1996 in a sample of 1 500 enterprises with 10 or more employees in the non-agricultural sector in mainland Portugal, showed that the vocational training needs forecast for that three-year period concerned a total 1 185 600 participants, 696 700 thereof in the sort term and 488 800 in the medium term. The forms of vocational training which enterprises considered most important were further vocational training (81.4% participants in the short and medium term), initial training (14.8%), apprenticeships (1.0%) and retraining (0.8%).
The survey of continuing vocational training conducted by the European Commission in 1993 (Continuing Vocational Training Survey - CVTS)14 in 50 000 enterprises with 10 or more workers in the 12 Member States showed that investment in vocational training by enterprises in Portugal (0.7% of personnel expenditure) was the lowest in Europe, at less than one-half of the Community average (1.6%). The data referring to the Social Balance Sheet between 1991 and 199610 (0.8% of personnel expenditure) confirm this result, and show no change whatsoever in this situation. While a significant number of enterprises have a staff training plan, they have no budget for putting it into action.
5.4. THE SUPPLY OF VOCATIONAL TRAINING
The training market is greatly affected by a set of factors which have as much to do with the characteristics of the production system and the labour market as they have with the education and training system. The following are of particular importance 13:
significant illiteracy rate, which currently amounts to functional illiteracy; a very low percentage of the population with intermediate or higher education, or even
with education beyond compulsory education; per capita GNP barely above the Community average, which affects the volume of
financial resources applied to education and training; backwardness in terms of the technologies and the management methods used in most
enterprises, which are more concerned with material investment than key aspects like competitiveness, technological innovation and the strategic role of personnel development;
most enterprises (SMEs and microenterprises) show no propensity to invest in training or to incorporate vocational training for their staff into their development plans.
SMEs are, of course, highly dependent on external supply for training their staff, but this training is also more expensive. By contrast, however, according to the DETEFP12, 76.5% of Portuguese enterprises with 10 or more workers take the view that the enterprise itself is the prime location for training. Employers' and business associations and the IEFP's Directly or Jointly-Managed Vocational Training Centres come second in their preferences, at less than 20% in each case. This choice of in-house training confirms the results obtained at Community level 14 in 1993, which indicated that 72.2% of training time was devoted to in-house courses. As for external training, there would appear to be no doubt as to the nature of the institutions which provide this kind of measure, but higher education institutions' direct involvement in this area seems to be limited. There are, however, any number of public and private institutions outside
82 10th CEIES Seminar – Education and Training Statistics

higher education which provide vocational training for middle and senior managers with a view to getting graduates started in working life, extending their training to other specialist areas and high-level training for graduates with several years' experience at the height of their careers. The key areas in which these operate are engineering and technology, management, marketing and advertising, project planning and management, foreign languages, European integration, I.T., training and trainer training and banking and finance.
Of the ten most frequent training areas in Portugal, those attracting the greatest numbers of trainees are I.T., banking and insurance, administration and management and the distributive trades, which would seem to indicate the predominance of action in service areas at the expense of manufacturing.
Overall, the rate of investment by enterprises in staff training is persistently meagre. Only 13% of Portuguese businesses offered training courses in 1993, while the Community average (EU12) was 43%14. In 1997, the DETEFP16, 17 estimated that this rate was between 10.6 and 10.9%.
Types of training other than the traditional forms (courses, conferences, workshops and seminars) are insignificant in Portugal, and are not even identified or broken down in the national statistics. In 1993, 8% of Portuguese businesses said they provided on-the-job training 14, a rate barely ahead of Greece's and far below the 38% cited as the Community average (EU12). Self study, which is significant in northern Europe, according to the same source 14, was offered by only 1% of businesses in Portugal.
This aspect is extremely important inasmuch as, for example, self study as a form of training offers advantages to SMEs which should be consistently seized upon because, by reducing the burden of hours spent on training and lowering costs (39% of training costs 14), it can remove some of the obstacles perceived by these enterprises which prevent them from investing in vocational training.
5.5. THE IMPACT OF TRAINING
No information is available to permit any assessment of the quality and effectiveness of the external training for middle and senior managers provided by external institutions 15.
In 1997, the DETEFP conducted the Survey of the Impact of Vocational Training in Enterprises (1994/96) by direct interview in 1 600 enterprises with 10 or more employees in all sectors of economic activity other than agriculture, fisheries, the extractive industries, some sectors of education (pre-school, basic and secondary education) and other collective, social and personal services (religious orders)17.
According to the DETEFP17 most recruits to enterprises which provide vocational training (10.6% of all the total enterprises) did not have the characteristics appropriate for the duties they were to assume. More than one-third of them took part in training initiatives during the period 1994/96, which were funded. Of those leaving, the largest group are those who had already undergone training outside the school system. Vocational training was given to 591 000 workers, the majority being provided for enterprises' own employees (57% of the total), and nearly one-third of the unemployed people who received training in these enterprises (6.8% of the total) were taken on by these 17.
According to the DETEFP17, again, most of the enterprises which provided training recorded better indicators with a bearing on the business (increased productivity, better quality of the goods produced, better rationalisation, introduction of new technologies, greater internal mobility, etc.).
10th CEIES Seminar – Education and Training Statistics 83

In the enterprises which did not provide training, changes in indicators referring to the employees (greater job stability, changes in working hours, improved remuneration, lower average ages, etc.) were more significant.
6. STATISTICAL PRODUCTION CONCERNING VOCATIONAL TRAINING
Statistical production in the vocational training area is closely linked to the development of this system. The Institute of Employment and Vocational Training (IEFP) was set up in 1979, and the system expanded and diversified in the 1980s. Until the mid-eighties, initial vocational training provided by the IEFP was the predominant alternative for early school leavers and young people with poor employment prospects 12.
Only in the 1990s was a system of statistics on vocational training with a methodological model covering all vocational training in Portugal developed 12. The entities responsible for this system are the Statistical Department of the Ministry of Labour and Solidarity (DE-MTS) and the Appraisal, Forecasting and Planning Department of the Ministry of Education (DAPP/ME).
The DE-MTS produces, analyses and disseminates statistics in the areas of employment, vocational training outside schools and industrial relations by virtue of powers delegated to it by the INE within the National Statistical System.
The DAPP/ME, also by virtue of powers delegated to it by the INE, is responsible for the production, development and dissemination of statistics on education as well as the vocational training initiatives taken within the scope of its remit.
Any user of statistical data referring to vocational training first encounters difficulties because these data are frequently dispersed, inaccessible and fragmented, in that they exclude important sectors and therefore do not reflect the situation in every field and in every form which vocational training may take.
Another kind of problem arises from the fact that existing statistical data do not reveal any correspondence between the supply of vocational training and the needs of the business fabric, the bulk of which consists of very small enterprises (Table 12). As stated at 5.3, the survey of vocational training covers enterprises with at least 10 employees and affords a picture of demand for vocational training indicated by enterprises 12. There is, however, no statistical source indicating individual demand for vocational training, and this is essential if imbalances are to be identified between supply and demand in vocational training.
Another dimension of the training market is not easy to quantify, in that private, own-initiative training which is not cofinanced is often confused with the work situation, although this appears to arise in the largest enterprises, which are in a minority within the production system.
A further limitation on statistical sources concerning vocational training stems from the fact that they do not provide any information on the impact which the various kinds of training initiatives have on enterprises and on the participants' working lives.
The vocational training market in Portugal has been heavily supply-led. The areas covered by training measures are essentially those which are seen as a priority or are eligible for programmes financed out of structural funds. The existence of a statistical system within the general field of education and training which will permit forecasting to facilitate the choice of individual options and provide a basis for policies for managing human resources will be the key to turning this situation around. This system will also have to permit training requirements in different sectors of
84 10th CEIES Seminar – Education and Training Statistics

activity and different regions to be monitored and assessed and changes to be identified as well as contributing to statistical information on different measures in employment policy and, in particular, in vocational training.
References:
1 - Antunes, F., "POLÍTICAS EDUCATIVAS PARA PORTUGAL, ANOS 80-90: O debate acerca do ensino professional na escola pública", Políticas de Educação nº 4, Instituto de Inovação Educacional, Lisbon, 1998
2 - INE, População Residente por Grandes Grupos Etários em 31/XII/98 - Estimativas, Lisbon, 1998
3 - OECD, Education at a Glance, OECD Indicators, Paris, 19974 - Centro de Investigação de Políticas do Ensino Superior (CIPES), "Previsão da evolução do
número de alunos e das necessidades de financiamento: Ensino Superior - 1995 a 2005", Fundação das Universidades Portuguesas, 1999
5 - OECD's Thematic Review of the Transition from Initial Education to Working Life, Portugal Background Report, November 1997
6 - Azevedo, J., "SAIR DO IMPASSE: Os ensinos tecnológico e profissional em Portugal", Cadernos Pedagógicos nº 50, Oporto, ASA Editores AS, 1999
7 - Soares, V. M., "Employment and Work Conditions of Academic Staff in Higher Education : A Comparative Study in the European Community", National Report, Portugal, Oct. 1988
8 - Simão; J. V., Costa, A. A., " O Ensino Politécnico em Portugal", January 2000 (Estudo policopiado)
9 - OECD's Thematic Review of the Transition from Initial Education to Working Life, Portugal Country Note, January 1999
10 - Department of Labour and Vocational Training Statistics (DETEFP), "Social Balance Sheet - 1996", Colecção Estatísticas, Lisbon
11 - Department of Labour and Vocational Training Statistics (DETEFP), "Social Balance Sheet - 1997: INDICADORES ESTATÍSTICOS - Estatisticas em Síntese", Lisbon
12 - Department of Labour and Vocational Training Statistics (DETEFP), "Inquérito às Necessidades de Formação Profissional das Empresas - 1996/99", Lisbon, 1996
13 - Employment and Vocational Training Observatory (OEFP), "Mercado de Formação - Conceitos e Funcionamento", Estudos e Análises, nº 9, Lisbon, 1998
14 - European Commission, "Continuing Training in Enterprises: Facts and Figures", February 1999
15 - Programming and Financial Management Departament of the Ministry of Education (DEP/GEF) and Prospective Studies Institute, "Prospectiva do Ensino Superior em Portugal", J.M. Gago, Ed., 1994, Lisbon)
16 - Department of Labour and Vocational Training Statistics (DETEFP), "Inquérito à Execuação de Acções de Formação Profissional - 1997", Lisbon, 1997
17 - Department of Labour and Vocational Training Statistics (DETEFP), "Inquérito ao Impacto das Acções de Formação Profissional nas Empresas - 1994/96", Lisbon, 1997
10th CEIES Seminar – Education and Training Statistics 85

Annex 1 - STUDENTS REGISTERED, BY SEX - DISTRIBUITION IN PERCENTAGE TERMS, BY LEVEL AND FORM OR KIND OF EDUCATION
1996/97 Mainland Portugal
Sex Total Males FemalesLevel and form or kind of education % % %
1 2 3 4 5 6 7
Total 2192540 100,0 1087526 49,6 1105014 50,4
Pre-School education 187539 8,6 96364 51,4 91175 48,6Ministry of Education network 113652 60,6 58014 51,0 55638 49,0Ministry of Solidarity 73887 39,4 38350 51,9 35537 48,1
Basic education 1223169 55,8 632113 51,7 591056 48,3First cycle 500823 40,9 259903 51,9 240920 48,1
Standard 489962 97,8 255759 52,2 234203 47,8Recurrent 10861 2,2 4144 38,2 6717 61,8
Second cycle 284573 23,3 150620 52,9 133953 47,1Standard 273563 96,1 145607 53,2 127956 46,8Recurrent 11010 3,9 5013 45,5 5997 54,5
Third cycle 437773 35,8 221590 50,6 216183 49,4Standard 395782 90,4 199793 50,5 195989 49,5
Years 7, 8 and 9 394650 99,7 199073 50,4 195577 49,6Vocational Courses(level 2) 1132 0,3 720 63,6 412 36,4
Recurrent 41991 9,6 21797 51,9 20194 48,1
Secondary education 437212 19,9 210504 48,1 226708 51,9Standard 405716 92,8 193285 47,6 212431 52,4
General courses 239111 58,9 103289 43,2 135822 56,8Technological courses 79229 19,5 44673 56,4 34556 43,6Vocational courses(level 3) 26024 6,4 13863 53,3 12161 46,7
Artistic education - Visual arts 1604 0,4 678 42,3 926 57,7
Supplementary nightschool courses 20546 5,1 10557 51,4 9989 48,6
Liceu 16507 80,3 8372 50,7 8135 49,3Technical schools 4039 19,7 2185 54,1 1854 45,9
Year 12 of standard education 38594 9,5 19749 51,2 18845 48,8
Technical and vocational courses (after-work) 608 0,1 476 78,3 132 21,7
Recurrent 31496 7,2 17219 54,7 14277 45,3
Higher education 344620 15,7 148545 43,1 196075 56,9University 211056 61,2 90496 42,9 120560 57,1Non-university 133564 38,8 58049 43,5 75515 56,5
86 10th CEIES Seminar – Education and Training Statistics

CURRENT USES OF EDUCATION AND TRAINING STATISTICS: THE PORTUGUESE SITUATION
Fernando MarquesRepresentante dos trabalhadoresGabinete de Estudos da CGTP-IN.Rua Vitor Cordon, nº 1 - 2ºP – 1294 LISBOA [email protected]
INTRODUCTION
In my intervention, I shall be introducing some aspects related with the use of statistics in education and vocational training.
First, to demonstrate how these statistics fit in the Portuguese Statistics System.Second, to highlight some aspects of statistics in education.Third, I will mention vocational training statistics.
I will also be mentioning some administrative statistics with regard to aspects of vocational training, but which are not integrated in the statistics system.
Finally, I will draw some conclusions which I consider more relevant.
THE NATIONAL STATISTICS SYSTEM – STATISTICS IN EDUCATION AND VOCATIONAL TRAINING
The Portuguese Statistics System is moderately centralised since it allows the producing body (the INE) to transfer some of its responsibilities. These are very important in the area of education and training, and some of those responsibilities were passed over to the Ministry of Education (ME) and to the Ministry of Employment and Solidarity (MTS).
The main work carried out by the INE in these areas is: The Population Census and the Survey on Employment. The Ministry of Education is responsible for the yearly publishing of Education Statistics.
Statistical production in the area of vocational training is, to a large extent, concentrated in the MTS Statistics Department. Vocational Training’s strong growth and diversification since the 80’s led to the development of statistics production. This arose the need to create systems that are capable of assessing training in its different aspects, like needs’ analysis and efficiency assessment.
Still worth mentioning is the development of administrative – based statistics (growing in importance), produced by the Institute of Employment and Vocational Training (IEFP). These statistics are still not integrated in the statistics system.
10th CEIES Seminar – Education and Training Statistics 87

USING STATISTICS IN EDUCATION
The main statistical source in the area of education is the Ministry of Education which was entitled with this responsibility since 1992. Until then, statistics were mostly provided by the National Statistics Institute (INE), through enquiries.
Education statistics give us quite a good coverage of the more relevant information concerning all levels of the education system, including the area of professional education with technological, professional and technico-professional courses. It also covers areas like special education, extra-school education, school social support and education funding. The tendency has been one of making more information available.
Some of the main obstacles concern:
The lack of articulation between the Ministry of Education and the Employment and Vocational Training Institute which produces data in the area of extra-school vocational training. Particularly relevant is initial training concerning the apprentiship system which prevents the user from having an overall view of education and initial training;
The insufficient articulation with the National Statistics Institute (INE) in the framework of its acquired responsibilities;
The delicate data comparability, given changes that tookplace in education. There is a need to build long time-series with comparable information. The Ministry of Education has this project for the 1960-1999 period;
Delays in issuing out information – at the moment there are only final statistics for 1997 – due to delay in the gathering of information. Investment in modernisation is equally needed;
The lack of derived statistics, building and popularising essential indicators;
The need to improve the quality of information, for instance concerning the country education budget. The spending on education should be integrated, to cover both public and private education expenses.
Quality improvement also needs to ensure a model of statistics which are independent from government sponsored bodies. This is a sensitive issue which is essential to the development and credibility of statistics.
THE UTILISATION OF STATISTICS IN VOCATIONAL TRAINING
The system of vocational training statistics is shared by the INE (National Statistics Institute), producing statistics in the framework of families and the DE-MTS (Ministry of Labour and Solidarity Statistics Department), with surveys on enterprises.
The INE publishes the “Employment Survey” with data referring to the population’s total, on a quarterly basis. One part of the enquiry is dedicated to vocational training issues. But part of this available information has not been published.
As for surveys on enterprises carried out by the MTS they cover three key-moments in vocational training: needs, implementation and evaluation. With regard to needs, the main statistical source is the “Enquiry on the Enterprises’ Vocational Training Needs”, published quarterly, and carried out
88 10th CEIES Seminar – Education and Training Statistics

in companies with over 10 employees. An important indicator is given by the type of vocational training actions which are seen as more relevant by companies. In terms of implementation, we have the “Social Balance Sheets” covering companies with over 100 workers and also the “Enquiry on the Implementation of Vocational Training Actions”. In evaluation, we have the “Survey on the Impact of Vocational Training Actions in Companies”, covering the 1994-1996 period.
All of these make up a coherent system which covers the most important moments of vocational training.
Despite this, the user meets with considerable difficulties:
surveys are addressed to companies, thus immediately leaving out other entities like Public Administration (although there is specific information available in this case);
therefore, not all sectors are covered, and agriculture should also be added; they do not cover small enterprises; there is still some time irregularity in their implementation.
Users find it also difficult to understand the efficiency of vocational training in terms of worker’s qualifications. For instance, Portugal has made strong investments in vocational training, to a large extent as a result of European Union funding, but in analysing statistics on qualifications (in the staff maps) we see very little progress made.
The impact of vocational training actions may also be assessed by the statistics of the “Observatory for Entry into Active Life”, which was set up at the end of the 80’s, through a joint initiative of the Ministry of Education and the Ministry of Labour and Solidarity.
EMPLOYMENT AND TRAINING POLICIES THE PRODUCTION AND UTILISATION OF STATISTICS
The Employment and Vocational Training Institute plays a major role with regard to the active policies on employment and vocational training. This role was enhanced through the years with access to European funds and, more recently, by the adoption of National Employment Plans in the framework of the Employment Guidelines approved by the EU. The training dimension appears in the vocational training actions and programmes as well as in the employment programmes since these include training components. Particularly relevant are:
Initial vocational training programmes aimed at integration into the labour market, as is the case of the apprentiship system; continuous vocational training;
training the unemployed and other less favoured social groups;
certification or validation of formal or non-formal skills and qualifications.
The IEFP also manages the “National Trades Classification”.
Despite all this, information is little known. The IEFP publishes statistics both in the areas of employment and training but these statistics are not integrated in the statistics system.
Both the common users and the public opinion face a permanent dilemma: either they don’t have information or they have “too much” information, with many disperse figures without coherence. If
10th CEIES Seminar – Education and Training Statistics 89

measures that have similar goals are adopted by different ministeries, they may produce information (if they do so) that as a rule cannot be brought together for it results from different concepts and methodologies. There is neither an integration in the statistics system nor an articulation with the INE. An example of this comes from the trades classification being regarded as administrative nomenclature and not as statistical. Likewise, there is lack of articulation with the INE.
FINAL REMARKS
In ending, I leave you with four final notes:
1. The Portuguese statistical system has accompanied the changes occurred in the system of education and vocational training, although with more difficulty in this latter one. Clearly we have more information available, with its access facilitated, particularly through the Internet;
2. Nonetheless, some difficulties remain, mostly due to the way in which, in practical terms, statistics are produced, some of which external to the statistical system. As I previously mentioned, we don’t have an overall assessment of costs related with education and training.
3. In training, some information gaps persist, but above all, what we miss most is a global and coherent vision. We need a deeper knowledge of training impacts. We need to know the individual demand for training. We need to move forward in the standardisation of concepts and more availability of classifications and nomenclatures that allow for training’s systematisation. Training bodies do not utilise uniform concepts of training.
4. In education, we lack long harmonised series and derived statistics, to build essential indicators.
90 10th CEIES Seminar – Education and Training Statistics

THE STRUCTURE OF EDUCATION SYSTEMS - AN INTERNATIONAL COMPARISON RESULTS AND PROBLEMS FROM AN AUSTRIAN PERSPECTIVE
Arthur Schneebergeribw-Institut für Bildungsforschung der Wirtschaft / Institute for Research on Qualification and Training of the Austrian EconomyRainergasse 38A-1050 [email protected]
The globalisation of the economic, employment and education sectors has led to an increased demand for empirically sound information on the structure of qualifications in individual countries, compared to others not only within but also outside Europe. Such information is required by political and administrative circles, student exchange organisations and firms which are active internationally, to say nothing of socio-economic researchers and policy consultants.
With regard to the subject of the seminar, I would like to address the following five points, as someone who uses comparative statistics in Austria:
1. The size of the education system - excluding education at upper secondary level - and the labour market problems affecting it, especially with regard to data on men and women.
2. The size of the middle education level, which covers 70% of the Austrian population.3. The background to the structure of qualifications in Austria.4. The vertical and horizontal structure of the post-secondary education sector.5. Graduation structures and comparability of statistics on graduates.
1. Declining percentage of the population without further education qualifications - relevance to the labour market of increasing the numbers of those participating in vocational education
As the prosperity of the labour force and the number of jobs in the services sector have increased, so too have the numbers of individuals remaining in education after leaving school. Mass prosperity and diminishing employment opportunities in both the agricultural sector and primary industries have gone hand in hand with a lengthening of the different stages of education. Thus, the percentage of the population who receive an education only at lower secondary level (or less) in the countries of the European Union has fallen from 55 to 31% within the space of thirty years.
TABLE 1:
Educational attainment level of selected population age-groupsin the European Union (1997) (%)
Age Low Medium High Total(<ISCED 3) (ISCED 3) (ISCED 5,6,7)
25-29 30.5 48.1 21.4 100
55-59 54.9 31.4 13.7 100
Change: % points -24.4 +16.7 +7.7 -Source: Eurostat, Education across the European Union, 1988; own calculations.
10th CEIES Seminar – Education and Training Statistics 91

Towards the end of the 1990s in the EU Member States, an average of approximately 70% of young adults obtained at least a qualification at upper secondary level. According to Eurostat's comparison by age-group, the percentage of young adults who do not receive an education at upper secondary level has fallen across the board.
Outside the 15 EU Member States, 91% of young adults in Norway, for example, 88% in Korea and 87% in the USA obtain at least a qualification at upper secondary (high school) level1. As the proportion of individuals commencing and receiving an education at upper secondary level should still be higher than the proportion of those obtaining qualifications at this level, the education system at this level is becoming increasingly all-encompassing in many countries. This creates new problems, such as defining and setting a minimum level or evaluating pupil attainment.
When the situation is analysed from a gender-specific viewpoint, it is evident that women under 30 are no longer at a disadvantage within the education system in Europe. It is already the case that a slightly higher proportion of young women obtain advanced qualifications. Compared to their parents' generation, however, a revolutionary change has taken place in that the proportion of women unable to attend school beyond lower secondary level has halved (from 62 to 30%).2 In 11 of the 15 EU Member States, the proportion of women under 30 without a further education qualification is lower than that of men of the same age (see Table 2).
TABLE 2:Percentage of 25-29 year-olds
without qualifications at upper secondary level (1997)
Country Total Male Female Difference*Finland 12.7 13.8 11.5 2.3Sweden 13.6 13.8 13.4 0.4Germany 14.6 13.1 16.1 -3.0Denmark 15.2 15.9 14.5 1.4Austria 17.0 12.8 21.2 -8.4Belgium 22.2 24.5 19.7 4.8France 23.3 23.5 23.0 0.5Netherlands 26.0 27.7 24.2 3.5Greece 28.5 31.4 25.9 5.5EU-15 30.5 31.0 29.9 1.1Ireland 31.1 35.3 26.9 8.4United Kingdom 38.9 37.1 40.9 -3.8Spain 43.4 47.4 39.1 8.3Italy 45.8 48.1 43.5 4.6
1 OECD: Education at a Glance - OECD Indicators 1998, Paris 1998, p. 44.2 EUROSTAT, Education across the European Union, Statistics and indicators, 1998, p. G2.
92 10th CEIES Seminar – Education and Training Statistics

Luxembourg 47.7 47.1 48.4 -1.3Portugal 58.7 63.6 53.6 10.0*Percentage points
Source: EUROSTAT, Education across the European Union, 1998, p. G2; own calculations.
The marked difference between the sexes in Austria at the low educational attainment level is due to the fact, among other things, that more girls than boys take full-time training courses following compulsory schooling - such courses include short school-based courses below upper secondary level - and that girls are less likely than boys to enter dual training after compulsory schooling. Although girls are more successful than boys in full-time school-based courses - judging by the percentages of those successfully completing this type of training - they continue to be less successful on the whole than boys at upper secondary level, which has repercussions on the labour market. Employed persons of both sexes in Austria who do not obtain qualifications at upper secondary level are at a significantly greater risk of being unemployed than those at all other education levels3. It is thus considered to be a matter of priority in policy-making that as many individuals as possible should be integrated into the vocational education system after they complete their ninth and final year of compulsory schooling.
Of the 16-17% of 20-24 year-olds who did not obtain a qualification at upper secondary level in Austria at the end of the 1990s, it is estimated that 10-12% received several years of school-based or dual training but did not obtain any qualifications4. Declining employment opportunities in the agricultural sector and falling demand for low-skilled workers in industry have led to a reduction in employment opportunities for individuals who leave compulsory schooling and do not enter further training. It is thus becoming increasingly important that young people aged 15 and above be provided with vocational training opportunities, whether on a full-time or dual basis.
The indicator "without education at upper secondary level" (<ISCED 3) therefore fulfils an important function for Austria by making it possible to assess the suitability of the country's education policy and compare it with countries which have similar systems.
2. The medium educational attainment level of the Eurostat classification covers too diverse a segment of the Austrian education system
If one examines the medium education level of the Eurostat classification alone, it becomes apparent that there are marked differences between the various countries. The German-speaking and northern European countries have the highest proportion of inhabitants who reach the medium attainment level, whereas the proportion of the population in this category in the English-speaking countries is smaller.
Translator's note: Under the dual training system apprentices work for up to four years with master craftsmen while receiving both general and job-related training in vocational schools; it may be compared with day-release schemes.
3 Lorenz Lassnigg, Arthur Schneeberger: "Transition from Initial Education to Working Life. Country Background Report: Austria", Vienna, July 1997, p. 62.
4 See: Arthur Schneeberger, Bernd Kastenhuber: "Berufliche Bildung im Strukturwandel. Perspektiven und Optionen" (No. 112 of the series published by the "Institut für Bildungsforschung der Wirtschaft") Vienna 1999, p. 107.
10th CEIES Seminar – Education and Training Statistics 93

TABLE 3:International comparison of formal educational attainment level of 30-34 year-olds
according to the Eurostat categories (1997) (%)
Country Low Medium High Total
Austria 17.0 72.2 10.8 100
Germany 14.3 61.1 24.6 100
Finland 14.0 59.8 26.2 100
Sweden 14.9 55.7 29.5 100
Denmark 17.6 53.7 28.8 100
France 28.5 49.8 21.7 100
Netherlands 27.9 46.6 25.6 100
EU-15 33.4 44.6 22.0 100
Greece 36.3 40.6 23.1 100
Italy 50.3 39.8 9.9 100
Belgium 28.8 39.3 31.9 100
Ireland 37.7 33.9 28.4 100
United Kingdom 42.3 32.1 25.5 100
Luxembourg 47.8 30.6 21.6 100
Spain 52.3 21.7 26.1 100
Portugal 69.5 16.5 14.0 100
Source: EUROSTAT, Education across the European Union, 1998, p. G2.
Of the 83% of 30-34 year-olds in Austria surveyed in 1997 who had obtained a qualification after completing the ninth and final year of compulsory schooling, 72% were grouped in the "medium educational attainment level" (ISCED 3) according to the Eurostat classification and almost 11% in the "high educational attainment level"(ISCED 5, 6 and 7). Austria is the country with the highest proportion of inhabitants at the "medium educational attainment level" because the educational pathways in Austria subsumed under "ISCED Level 3" vary considerably in length and correspond to very different qualification levels. This is particularly true of the upper secondary vocational school (berufsbildende höhere Schule (BHS)) which students normally attend for five years. There are also many special types of BHS at post-secondary level, but these have also been categorised under ISCED 3 hitherto. Thus, the "medium educational attainment level" actually covers qualifications which are very diverse. According to the 1997 microcensus (annual results), 30-34 year-olds in the resident population (N=722.600) obtained qualifications as a result of pursuing the following educational pathways at upper secondary or more advanced levels5:
5 ÖSTAT (Austrian Central Statistical Office): "Mikrozensus-Jahresergebnisse 1997" (1997 microcensus - annual results), Vienna 1999, p. 7, the internal breakdown of secondary schools is based on additional information.
94 10th CEIES Seminar – Education and Training Statistics

Subsumed under ISCED 3
44 % Apprenticeship in a firm and a vocational school Initial vocational
training10 % Intermediate vocational school (berufsbildende mittlere Schule - BMS)
7 % Academic secondary school (allgemeinbildende höhere Schule - AMS)
General education/ Access to higher education
10 % Upper secondary vocational school (berufsbildende höhere Schule - BHS)
General education / Access to higher education and vocational diploma
Above ISCED 3
2 % Academies of higher education, medical and technical courses
Compulsory teacher training, etc.
8 % Universities, institutes of higher education Degrees
The following conclusions may be drawn:
1. The ease with which individuals can enter the educational pathways available after compulsory schooling is due to the variety of educational opportunities on offer and the choice between school-based and dual training as well as different forms of vocational schools (intermediate and upper secondary vocational schools) which offer different types of practical training (training in laboratories and workshops, compulsory traineeships during holidays, project studies and virtual firms).
2. However, the diversity of education in this sector also means that "higher education" begins at upper secondary and not post-secondary level. This creates a considerable difference between education systems, which, because it is ignored in international discussions with educational experts, repeatedly leads to misunderstandings, which have far-reaching consequences.
3. As someone who uses international educational statistics, I feel that subsuming the diversity of courses available at upper secondary level under ISCED Level 3 leads to a loss of information.
It is possible that a distinction could still be made between short and long educational pathways after lower secondary level. Level 4, which was added to the 1997 version of the ISCED (UNESCO 1997), might be a more realistic category into which the main type of upper secondary vocational school (BHS) (5 years) could be grouped. As a considerable number of qualifications from upper secondary vocational schools are not obtained from the main type of school (schools for high-achieving 14-19 year olds) but in special types of schools for adults (usually for individuals who have successfully completed a course of vocational training or who have obtained qualifications from an academic secondary school (AHS)), I believe that consideration could also be given to including the special types of school in ISCED Level 5.
10th CEIES Seminar – Education and Training Statistics 95
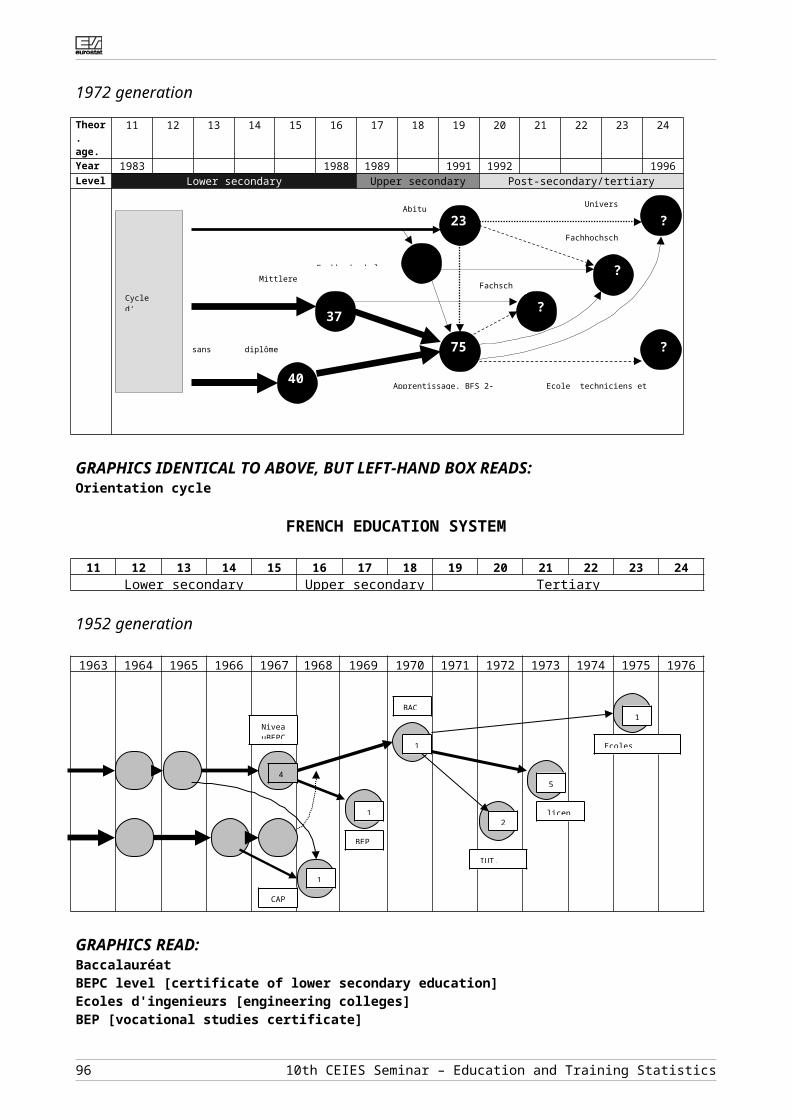
3. Background to the structure of qualifications in Austria
Compared to countries whose system of qualifications forms a clear pyramid structure, the Austrian qualifications structure tends to form an "onion" shape, with a narrow base, a broad middle section and a narrow top. Some may ask why Austria has not brought this structure more closely and more quickly into line with comparable international structures. I suspect that the key reasons behind this lie in the relatively good employment prospects of adolescents and young adults, acceptance by the business sector of the variety of secondary level training available and strong public support for the training opportunities available. Here are some points to illustrate this:
1. Unemployment, particularly long-term unemployment, is a problem which mainly affects older members of the labour force in Austria. In 1995, for example, the OECD produced comparative data on youth unemployment showing that this is a problem which affects Austria to a relatively small extent (6% in Austria as against an average of 22% for the OECD countries as a whole). When the figures for the Austrian age-group are compared with those for the same population age-group in all the countries surveyed, Austria also fares well (3% in Austria as against an average of 10% for the OECD countries as a whole)6. Even more recent data based on the EU definitions show that Austria has been relatively successful in integrating adolescents and young adults into the labour market.
2. There are concerns that Austria has too few graduates from institutes of higher education and it has also been suggested that we might be at a competitive disadvantage in terms of human capital. However, these concerns have not been voiced strongly or convincingly enough to prompt far-reaching structural change at upper secondary and university level (although Fachhochschulen - vocational colleges offering university-level science-based education - have been in existence since 1994). Company surveys and other labour market analyses have revealed only a very small number of companies which have problems finding graduates with technical qualifications. In reaction to similar findings, one of Austria's leading economics professors said, in summing up a study of business locations, that Austria's business sector had a lot of catching up to do with regard to the proportion of graduates it employed and that the business sector was largely unaware of this.7
3. Even the shortage of qualified staff in the field of information technology does not altogether disprove the argument. In 1999, companies in the IT sector made substantial efforts to make up for a shortage of IT specialists. The underlying debate revealed, above all, a desire for individuals with qualifications from relevant mainstream higher vocational schools (for 14-19 year-olds)8 or from special higher vocational schools, which require a Matura - a leaving qualification giving access to university - from an academic secondary school, or a general certificate giving access to university, but are not considered to form part of the tertiary education sector. There was no real debate about increasing the numbers of individuals qualifying from long courses at university (6 to 8 years on average until a first degree is obtained); nor was it relevant, in this context, to consider introducing a baccalaureate.
4. Students and recent graduates are faced with a contradictory situation: on the one hand, they are constantly confronted in the media with the message that Austria has the world's lowest percentage of graduates, on the other hand, they are faced with reduced prospects of finding "suitable" employment in the public sector (the main employer of graduates in academic
6 OECD: Education Policy Analysis 1998, Paris, p. 92.7 Gunther Tichy: "Technologie und Bildung". In: Heinz Handler (Pub.): "Wirtschaftsstandort Österreich.
Wettberbsstrategien für das 21. Jahrhundert", Federal Ministry of Economic Affairs, Vienna, February 1996, p. 109.
8 e.g. Upper secondary technical colleges for data-processing and data organisation.
96 10th CEIES Seminar – Education and Training Statistics

disciplines) owing to the constraints of consolidating public finances. Despite this uncertainty, the introduction of short courses is not really popular among students. The main aim is to ensure that university graduates are capable of taking up employment commensurate with their qualifications, such as employment as A-grade staff in the public sector.
5. Despite the concerns raised by highly regarded experts in the field about the relatively low percentages of graduates from institutes of higher education in Austria compared to other countries and about the problems of suitable employment and the need for further training for university graduates, I do not believe that these should be seen as priority issues for education and employment policy. An issue which, since 1996, has been considered far more important as regards policy-making than the problems facing university graduates on the labour market9 is the shortage of apprenticeships in dual training. This has prompted substantial efforts by the government and the social partners and, consequently, has generated significant investment to create a "safety net". Public concern that any erosion of apprenticeship training would put an end to the hitherto steady rise in the numbers of those participating in training and cause problems for society and the labour market was far greater than public concern about the modernisation of universities.
9 Rather than being unable to find any kind of employment and being registered unemployed, graduates tend to face the problem of being unable to find "suitable" employment.
10th CEIES Seminar – Education and Training Statistics 97
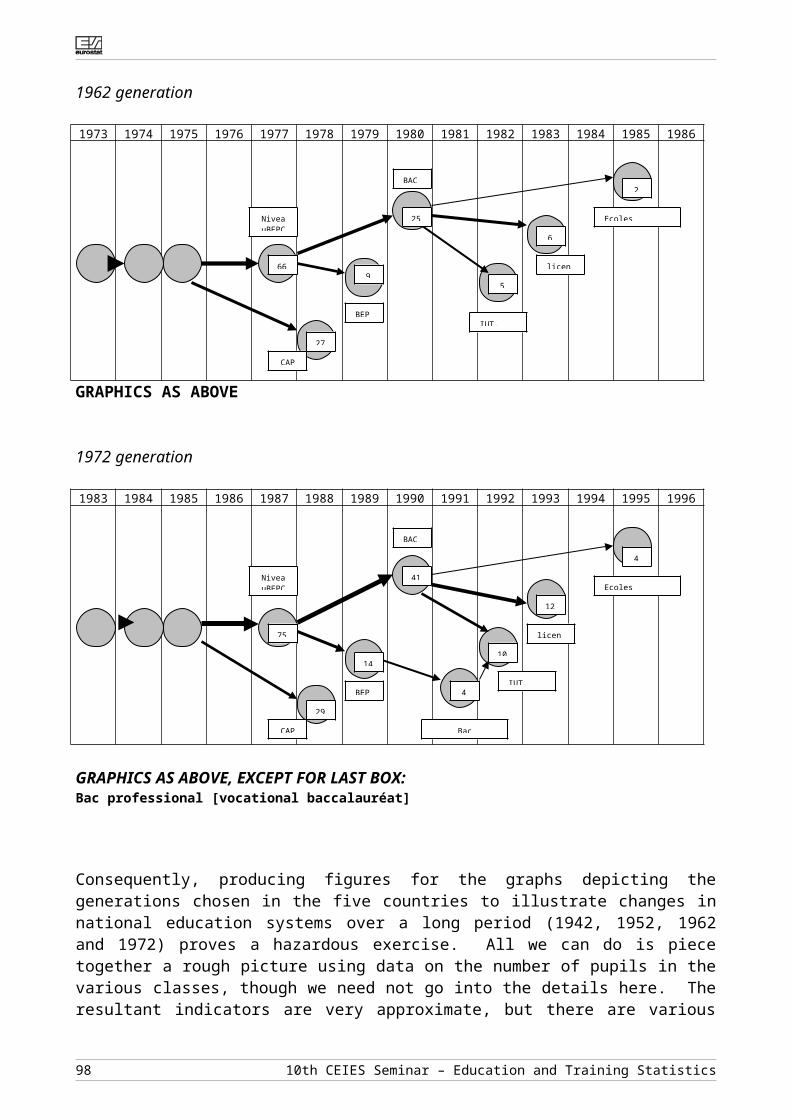
TABLE 4:Integration of young people into the labour market - a comparison of European countries (1995)
1995 Late September 1999
Countries Unemployment rate of 15-24
year-olds
Unemployed 15-24 year-olds
as a % of the population
Unemployment rate of labour force under
25
Unemployment rate of labour force aged 25
and over
Austria 6 3 5.6 4.0
Germany 9 5 9.1 9.2
Denmark 10 7 6.0 4.0
Netherlands 12 7 6.5 2.4
Portugal 17 7 8.3 3.6
Belgium 24 9 21.0 7.6
Luxembourg * * 6.0 2.4
Ireland 20 9 8.2 5.8
Sweden 19 9 13.7 6.0
France 27 10 24.3 9.3
Greece 28 10 - -
United Kingdom
16 10 12.7 4.7
Italy 33 13 32.0 8.4
Spain 43 18 27.5 13.0
Finland 38 20 20.8 8.4
EU Member States
22 10 17.3 7.9
*No data available for Luxembourg as the sample was too small
Source: OECD, Education Policy Analysis, 1998.
4. Data on post-secondary level: need for more thorough differentiation of higher educational attainment levels
According to the Eurostat classification, approximately 8% of individuals under 30 and 10-11% of 30-34 year-olds in Austria and Italy have a high level of educational attainment. In other countries, 30-35% of the same age-group are classified as having a high level of educational attainment. It is immediately obvious that there cannot be a strong correlation with economic performance. It is clear that in countries where traditional universities with long courses of study predominate, the proportion of the population participating in the post-secondary system tends to be smaller than in others. Italy did not introduce short courses in order to diversify the options available at universities until the 1990s and Austria has adopted a strategy of diversifying educational institutions themselves through university-level vocational colleges (Fachhochschulen) in 1994.10 The
1 0 See: Arthur Schneeberger: "Universitäten und Arbeitsmärkte. Strukturelle Abstimmungsmechanismen im internationalen Vergleich (No 113 of the series published by the "Institut für Bildungsforschung der Wirtschaft")
98 10th CEIES Seminar – Education and Training Statistics

universities are based on a two-tier system of studies which is vastly different from the three-tier system in the English-speaking countries as regards to the duration and purpose of courses, the graduation structure and the age of graduates when they obtain their first degree.
Both countries have introduced long courses leading to advanced vocational qualifications at upper secondary level. The fact that a higher proportion of 30-34 year-olds complete their studies than 25-29 year-olds indicates that these countries have long courses leading to a first degree.
TABLE 5:International comparison of the "high educational attainment level" (ISCED 5, 6 and 7) of
young adults broken down according to sex (1997) (%)
25-29 year-olds
30-34 year-olds
Difference: % points
Male 30-34 year-
olds
Female 30-34 year-
olds
Difference:% points
Belgium 35.2 31.9 3.3 29.1 34.7 -5.6
Ireland 34.1 28.4 5.7 28.0 28.7 -0.7
Spain 33.2 26.1 7.1 24.1 28.0 -3.9
Sweden 28.0 29.5 -1.5 27.1 31.9 -4.8
France 27.9 21.7 6.2 20.1 23.2 -3.1
Netherlands 25.8 25.6 0.2 27.0 24.1 2.9
United Kingdom 25.1 25.5 -0.4 27.0 24.0 3.0
Luxembourg 22.8 21.6 1.2 21.5 21.8 -0.3
Greece 21.7 23.1 -1.4 22.5 23.6 -1.1
Denmark 21.5 28.8 -7.3 27.8 29.8 -2.0
EU-15 21.4 22.0 -0.6 22.5 21.5 1.0
Finland 21.0 26.2 5.2 24.2 28.2 -4.0
Germany 17.2 24.6 -7.4 28.4 20.5 7.9
Portugal 16.5 14.0 2.5 10.6 17.1 -6.5
Italy 7.9 9.9 -2.0 9.6 10.2 -0.6
Austria 7.7 10.8 -3.1 11.2 10.4 0.8Source: EUROSTAT, Education across the European Union, 1998, p. G2.
I believe that the category of "high educational attainment level" is rather too inclusive on the whole and likely also to include intermediate qualifications. This is highly probable at European level and, even more so, at international level. For example, the total percentage of recent graduates in the post-secondary system in 1996 was 89% in Canada, 46% in Korea, 57% in the USA and 53% in Japan.11
Vienna 1999, p. 52ff., 221 ff., and 297ff.1 1 See: OECD, 1998, p. 200.
10th CEIES Seminar – Education and Training Statistics 99

TABLE 6:
International comparison of the composition and level of the total percentage of graduates in the post-secondary system (ISCED 5, 6) in a typical age-group (%)
Countries Non-university tertiary-level qualifications
First degrees* Total
Canada 57 32 89
Norway 50 28 78
USA 22 35 57
Japan 30 23 53
New Zealand 16 31 47
Korea 20 26 46
United Kingdom 12 34 46
Belgium (Flemish Community)
28 16 44
Finland 19 24 43
Ireland 16 25 41
Denmark 8 28 36
Australia - 36 36
Switzerland 26 9 35
Netherlands - 30 30
Spain 2 26 28
Germany 11 16 27
Sweden 4 19 23
Portugal 6 16 22
Greece 5 13 18
Italy 3 13 16
Austria 5 10 15*after a short or long first degree
Source: OECD, Education at Glance - OECD Indicators 1998, p. 200.
In Europe, 78% of the population in Norway, for example, obtain post-secondary qualifications, 46% in the United Kingdom, 44% in Belgium (Flemish Community) and 43% in Finland. The corresponding figures lie between 20 and 30% for Spain, Germany and Sweden and below 20% for Greece, Italy and Austria.
5. International comparison of graduation structures and graduate ratios
If graduation structures are also considered, considerable differences can be observed concerning training and selection within the higher education system in the various countries (Table 7). Japan, for example, has a high percentage of graduates but a comparatively small percentage of graduates
100 10th CEIES Seminar – Education and Training Statistics

with higher degrees (fewer than 2% of a given age-group obtain a master's degree). In the USA, an even higher proportion of the population obtain bachelor's degrees, and 12.5% of the population in the same age-group obtain a master's degree.
The different ways in which higher education systems award qualifications and filter students become even clearer if one compares the proportion of individuals obtaining degrees with the proportion of new students. In the English-speaking countries, for instance, between 40 and 50% and more of the population in a given age-group are new students. The USA, at 52%, has the highest proportion of new students of the OECD countries. In Europe, Finland is the only country where the rate is well over 40%. The proportion of new students in higher education is approximately 35% in the Netherlands and Denmark, and less than 30% in Germany and Austria. Switzerland, where 16% of a given age-group are new students, is well behind the other countries in this regard.
The large differences in the percentages of new students correspond to relatively small differences with regard to upper secondary level qualifications (second qualifications, qualifications after a long initial course of study), particularly if the qualifications obtained as a result of a long initial course of study at university are calculated separately from those obtained at university-level vocational colleges (Fachhochschulen) and comparable institutions. The main difference between education systems is whether or not courses are introduced prior to (or alongside) courses leading to qualifications for traditional academic occupations or for research work. The system in the German-speaking countries is of a two-tier type with diversity between educational institutions (university-level vocational colleges alongside universities, etc.), whereas the system in the English-speaking countries is organised on three levels and involves a greater measure of diversity within educational institutions.
10th CEIES Seminar – Education and Training Statistics 101

TABLE 7:
First-time students and graduates at institutes of higher education as a percentage of the typical age-group in the population (1996)
Country First-time students in the
higher education
sector
Graduates of short initial
higher education courses
Graduates of long initial
higher education courses
Graduates obtaining
second degrees
Australia xxx 36 X 12.2
USA 52 35 X 12.5
Canada xxx 32 X 5.1
Korea xxx 26 X 3.2
Japan xxx 23 X 1.9
United Kingdom 41 34 X 12.3
Ireland 29 14 11 4.5
Netherlands 34 X 20 10.0
Denmark 35 20 8 4.4
Sweden xxx 11 8 3.0
Norway 26 22 6 9.3
Finland 45 11 13 -
Belgium (Flemish Community) xxx X 16 4.9
Germany 27 X 16 X
Austria 29 X 10 X
Italy Xxx 1 12 1.2
Spain Xxx 11 15 X
Greece 18 X 13 0.3
Portugal Xxx 2 14 1.5
Switzerland 16 X 9 X
X = No graduates
xxx = No data available
Source: OECD, 1998
On comparing the percentages of graduates with master's degrees and first degrees (after a long initial course of study), there are considerably fewer differences between Germany, Italy, Austria or Switzerland on the one hand and the English-speaking countries on the other. When evaluating the data with regard to the occupations which graduates pursue (e.g. when assessing which degrees give access to traditional professions), this comparison is, in my view, the most relevant. Approximately 12-13% of a given age-group obtain a second university degree in the USA and the United Kingdom. If graduates from university-level vocational colleges (Fachhochschulen) were
102 10th CEIES Seminar – Education and Training Statistics

excluded, the proportion of students graduating from universities in Germany would remain at approximately 10% for a given age-group, as was the case in the mid-1990s, i.e. the same figure as for Austria, Italy and Switzerland.12
In countries with a relatively small proportion of university graduates (Switzerland, Italy, Austria and Germany, if the university-level vocational colleges (Fachhochschulen) are not taken into account), the university system, in terms of its structure and the qualifications it is expected to provide, is tailored to traditional graduate occupations (public service, education, research, liberal professions and business management). For this reason, university education is still attractive, even at a time when it has already become impossible for some to fulfil their ambitions of pursuing a traditional occupation. It is hoped that the structure of higher education institutions will be diversified by creating different types of institution, such as university-level vocational colleges, or will occur as a result of the labour market adapting its needs - a process which has been subject to little investigation so far.
Among the key educational indicators which make it easier to understand the differences between higher education systems are, besides the different percentages of graduates, the age of students when they begin their studies, the duration of an initial course of studies and the age on completion of the course. Thus, on average, new students in Germany and Denmark, for example, are not much younger than graduates with first degrees in Australia and the United Kingdom.13
The problem of appellations for comparative educational statistics
In connection with universities, Martin Trow has addressed, from a US perspective, the semantic problems of comparing educational systems: "Differences between the United States and other countries in their forms and structure of higher education are obscured by the fact that we tend to call elements of our systems by similar names."14 OECD experts say that the countries involved in surveys are ultimately responsible for defining concepts in higher education: "Although the term "equivalent" is used to guide data reporting for these categories, these distinctions remain dependent to some degree on national definitions of educational qualifications and on historical distinctions between the types of programmes that are, and are not, offered in traditional universities".1
On the other hand, to admit that problems and restrictions arise when comparing data in this field is to recognise the relative nature of educational qualifications and to respect cultural diversity. In spite of such epistemological problems, improving the gathering of data on the post-secondary education sector is a task which is becoming increasingly important for educational researchers. The easiest way to predict whether the post-secondary education system will expand is to look for any expansion of the secondary school system, irrespective of whether the secondary school system
1 2 See: Schneeberger, 1999, loc. Sit., p. 94.1 3 OECD, 1998, p. 183, p. 201.1 4 Martin Trow: "The Exeptionalism of American Higher Education". In: Martin Trow, Thorsten Nyborn (eds.):
University and Society, "Essays on the Social Role of Research and Higher Education", Jessica Kingsley Publishers Ltd., London, Bristol, PA, USA, Second impression 1997, p. 156.
1 OECD: Education at a Glance - OECD Indicators 1997, Paris 1997, p. 326; italicisation by the author, A.S.
10th CEIES Seminar – Education and Training Statistics 103

tends to offer more general or more vocational education.2 On the other hand, whether or not the secondary school system will expand, depends on socio-economic variables (size of the services' sector, prosperity) and political variables. There are signs from the labour market that the supply of medium level and intermediate vocational qualifications should be expanded and diversified.
2 Francisco O Ramirez, Phyllis Riddle: The Expansion of Higher Education, in: International Higher Education, an Encyclopedia, Garland, New York 1991, p. 94.
104 10th CEIES Seminar – Education and Training Statistics

STATISTICS ON LABOUR MARKET PROBLEMS IN THE PUBLIC SECTOR IN THE NETHERLANDS: EXPERIENCES OF A USER
Lex HerweijerSocial and Cultural Planning OfficeP.O. Box 16164NL - 2500 BD The [email protected]
1 INTRODUCTION
Like many European countries, the Netherlands has seen a sharp increase in educational participation in recent decades. The number of adults who have been through higher education has more than doubled in 25 years. This growth in participation in higher education is due largely to the growing interest in studies in the humanities and social sciences. Graduates from these courses have traditionally moved into careers in the public sector. In the 1980s, however, the need to control public spending made it clear that the public sector could not continue growing. Repeated warnings were voiced against the creation of a surfeit of graduates trained for a public sector, which could not accommodate them. In spite of this, courses focusing on careers in this sector continued to attract large numbers of students, and in fact even today, at the end of the nineties, half of all students in the Dutch higher education system still opt for courses of this type.
This has given rise to the question of how graduates from these courses have fared on the labour market. Are they finding it increasingly difficult to find employment? Are increasing numbers of them ending up in other sectors or in different careers from those on which their course was focused? At the same time, concerns have increasingly been voiced in recent years warning of a shortage on the Dutch labour market of graduates with training fitting them for specific areas of the public sector. Staff shortages in the education and health care sectors, for example, are gradually becoming a serious problem.
These differing views on the labour market for people with “public sector training” prompted the Social and Cultural Planning Office (SCP) to carry out a study of the match between the education system and the labour market in the Dutch public sector.3
The purpose of the study was fourfold:- to obtain a picture of the surpluses or shortages of graduates trained for the public sector;- to determine the match between the training followed and the career of these graduates;- to identify factors which influence the decision to choose courses focused on careers in the
public sector;- to provide an insight into the perception of work and the attraction of careers in the public
sector.
The aim of this paper is to discuss the availability and usefulness of statistics on the match between education and employment in the Dutch public sector. What data are available? How important are they? What are the strengths and weaknesses?
Section 2 defines ”matching” and lists a number of factors, which influence the match between supply and demand. This leads to a list of themes for which there is a need for statistical data.
3 L.J. Herweijer. Tussen overschot en tekort. De aansluiting tussen onderwijs en arbeidsmarkt in de quartaire sector en de marktsector vergeleken. The Hague: Elsevier/Social and Cultural Planning Office, 1999 (Report 162).
10th CEIES Seminar – Education and Training Statistics 105

Section 3 provides a summary of the available data and presents a few results by way of illustration. Section 4, finally, presents a few conclusions.
2 MATCH BETWEEN SUPPLY AND DEMAND
In exploring the match between education and career, a distinction can be drawn between quantitative and qualitative matching.
Quantitative matching concerns the relationship between supply and demand for a particular type of graduate. Quantitative matching problems manifest themselves on the labour market in the form of surpluses or shortages of a certain type of graduate.
Qualitative matching concerns the relationship between an employee and his/her occupation. Do the employee’s educational background and the educational background appropriate to his/her occupation match? What is the relationship between the employee’s education and his/her salary? Qualitative matching problems may be revealed by “objective” indicators such as the relationship between educational and occupational level, or between education and salary level, but also by subjective indicators such as job satisfaction.
Adaptation mechanisms on the labour market can transform quantitative tensions on the jobs market into qualitative matching problems in the workplace. During periods of staff surpluses, job-seekers will have to be satisfied with a job which matches their training less closely. Similarly, employers can relax the selection criteria for vacancies, which are difficult to fill and make do with a candidate who does not entirely meet the training requirements for the post. Such forms of flexibility reduce the (quantitative) matching problems on the labour market, but can create (qualitative) matching problems in the labour system: employees and posts, which are not ideally suited.
It is worth bearing in mind that the relationship between jobs and education is by no means a uniform one: not all education courses lead to a specific occupation, and it is not possible for all occupations to indicate what the most appropriate educational background is. As a result, it is not always clear if there is a good match between education and work. It is only in specific sub-sectors of the labour market that there is a more or less one-to-one relationship between training and occupation. These are markets for vocational or job-specific skills, which can be deployed in a wide range of companies and where the training is geared to a clearly defined occupation or discipline. Areas of the public sector such as teaching and health care are examples of this: professions such as teaching, nursing or medicine are the result of specific training, and the relationship between training and occupation is reinforced by statutory training requirements. The scope for addressing staff shortages by employing people with a less appropriate training background is consequently extremely limited.
The degree of matching on the labour market is thus the result of the confrontation between supply and demand. The magnitude and development of the demand for staff in the private sector is largely dependent on economic trends. In the public sector political decision-making and social trends also play a key role. Social trends such as the growing participation in education or the ageing of the population can lead to a greater need for education or health care. Ultimately, however, translating these social trends into higher budgets and more staff for education and the health service is a question of political decision-making. In the eighties the growth in the public sector in the Netherlands was halted on account of the perceived need to reduce public spending. As a result, the increasing participation in higher education was accommodated mainly through increased efficiency rather than through increases in the number of staff.
106 10th CEIES Seminar – Education and Training Statistics

Apart from the total demand volume, the outflow of incumbent personnel is the most important factor influencing the need for new staff. In parts of the Dutch public sector, and particularly education, the high age profile of the incumbent personnel is an important factor, and considerable numbers of staff will be leaving over the next few years as a result of retirement.
The supply of personnel with an education background focused on the public sector depends on the process of school and career choice and on the decisions, which those in work take in their further career. The process starts when young people, based on their educational and career preferences and the image they have of a career in various sectors, choose their education course. After completing their education they are then faced with actually looking for a job in the sector for which their education has qualified them - though some prefer to look in a different sector; for example, a proportion of teacher training graduates decide to look for a career outside education. Such decision moments return throughout a person’s career: should they switch to a similar occupation within the same sector, or go in search of a job in a different sector? Which way this choice goes depends on the person’s satisfaction in their current job and the available alternatives.
In the public sector, the choices made by women are also of particular importance. The public sector attracts a relatively high proportion of women, but many of them prefer to work part-time, especially after having children. In addition, some Dutch women withdraw from the labour market altogether after having children. The preference for part-time work and the lower labour market participation rate of women depress the number of people with “public sector training” on the jobs market.
In summary, to gain an insight into the matching problems in the public sector, we need data on:
- the demand for labour in the public sector and the future development;- the supply of graduates with education backgrounds focusing on the public sector;- the labour market participation and unemployment rate among graduates of courses aimed at the
public sector;- vacancies in the public sector;- the match between an employee’s education and occupation according to “objective” indicators
(job level, income);- the satisfaction of public sector employees with their work and with choices made during their
career;- the choice of school and occupation (motives, actual choices) by young people; - the entry of school-leavers into the labour market.
3 AVAILABLE DATA AND A FEW FINDINGS
Statistics are defined as quantitative information, which is available on a regular basis and which is generally accessible. Statistics Netherlands (CBS) is the main provider in the Netherlands of statistics on the match between education and employment. In addition to summaries (tables, etc.) which are published in the form of statistics, CBS also administers micro-databases which serve as a basis for statistics and which are made available to researchers under certain conditions. Besides the statistics produced by Statistics Netherlands, data are also available from studies carried out by other research institutes. Sometimes these studies are repeated with some regularity, while in other cases they are one-off studies. To obtain the most complete picture possible, it is necessary to draw data from all these different sources.
3.1 Data on the quantitative tensions on the labour market
10th CEIES Seminar – Education and Training Statistics 107

Data on the magnitude of the demand for and supply of labour form the starting point for the analysis of bottlenecks on the labour market. The annual Labour Force Surveys carried out by Statistics Netherlands are the chief source of these data. These surveys offer an insight into the size of the supply (those in work, the unemployed and non-workers who are not looking for work: the potential supply) and their main characteristics (age, sex, education level and type and number of hours worked per week).
The Labour Force Surveys are also an important source of information for describing the demand for labour. In combination with data on job numbers from companies, a typology of employment is obtained by job level and content in the various sectors of the economy. For research into the match between education and employment, it is fortunate that job level and content have been characterised in terms of required education since the overhaul of the Dutch job classification system in the early nineties. This makes it easier to compare supply and demand.
The demand picture is completed by data on vacancies derived from a quarterly survey of employers which is carried out by Statistics Netherlands.
The Labour Force Surveys also provide essential input for forecasts concerning the Dutch labour market. The combination of data from the Labour Force Surveys with expectations concerning the development of the demand for labour4 and concerning the outflow of students from the education system enable forecasts to be compiled on future surpluses or shortages of certain groups of education graduates. An example is the forecast model developed by the Research Centre for Education and the Labour Market (Researchcentrum voor onderwijs en arbeidsmarkt) for the Dutch labour market, which charts the quantitative bottlenecks on the labour market in the medium term.
A few results
The unemployment rate observed among higher education graduates in the Labour Force Surveys in the second half of the nineties suggests that there are slight bottlenecks for a few course types (in particular “language and culture”; see table 1). Generally speaking, graduates of courses aimed at the public sector are not in a bad position. The feared surplus of people with “public sector training” has not materialised. And since unemployment in the Netherlands has fallen further in recent years, the labour market position of these people will only have improved further.
More striking than the differences according to education type followed are the differences between men and women; unemployment is higher among women than among men in every education type - often as much as twice as high. The Dutch government runs campaigns aimed at encouraging women to enroll on technical courses, but unemployment among women who have done so is actually even higher. Possible explanations for this high level of unemployment among women may be the re-entry of women who have interrupted their career in order to have children and the greater selectivity of women with children and a working partner; there are also indications that employers in some sectors prefer to take on men. Table 1 Unemployment among higher education graduates by type of course followed, average
percentages 1995-1997
men and women men womenhigher professional focused on the private sector
Technical 3.4 2.9 8.0Economic 4.1 3.2 5.6
4 The future demand for labour is derived from macroeconomic forecasts and forecasts of the take-up of public sector amenities.
108 10th CEIES Seminar – Education and Training Statistics

focused on the public sectorteacher training 4.2 2.5 5.6health care training 4.1 2.2 4.7language and culture 7.6 5.3 10.2social sciences 6.0 4.3 7.1
total 4.5 3.1 6.1
universityfocused on the private sector
technical 5.7 5.1 11.5economic 3.8 3.1 7.7legal 5.3 4.6 6.2
focused on the public sectorteacher training 2.4 1.7 3.4health care training 2.9 1.8 4.5language and culture 6.9 6.4 7.5social sciences 6.5 5.7 7.3
total 5.3 4.8 9.5Source: Statistics Netherlands (Labour Force Survey 1995, 1996, 1997 )
The fall in unemployment has been paralleled in recent years by a considerable increase in the number of vacancies, including in the public sector. This growth in the number of vacancies and the falling unemployment rate are the signs of a general tightness on the Dutch labour market. The vacancy intensity (number of vacancies per 100 employees) is not as high in the education and health care sectors as in some parts of the private sector (notably the ICT sector), but the importance attached to education and health care, and the lack of substitute possibilities, make the problem a pressing one. Waiting lists for urgent medical treatment and school classes which are sent home for lack of staff make a greater impression than ICT companies which are forced to disappoint their customers.
Training focused on a career in health care or teaching attract a large number of women. As a consequence, the persistently fairly low labour market participation rate of Dutch women presents a problem now that shortages have arisen in both sectors. The ultimate effect of women’s preference for part-time work is more uncertain: on the one hand it means limited deployment of women in the jobs market, while on the other hand the increase in labour market participation by women in the Netherlands is due precisely to the ability to work part-time. The Labour Force Surveys also show that a proportion of graduates of courses focused on the public sector have made the switch to the private sector. Roughly a third of teacher training graduates and almost a quarter of graduates of medical training are employed in sectors other than those for which they were trained.
Both these factors - not doing paid work and opting for a job in a different sector - mean that the actual supply of potential employees in the education and health care sectors is markedly smaller than the potential supply.
10th CEIES Seminar – Education and Training Statistics 109

3.2 Data on the qualitative match
Dutch labour market research has a tradition of research into the match between the education level of employees and the level of the jobs they hold. The Labour Force Surveys form the starting point for this type of research, too. The level of a person’s education and the level of their job are observed and can be compared with each other. Analysis of successive Labour Force Surveys leads to the conclusion that the education level of the labour supply has risen more rapidly than the level of their jobs. The consequence of this is that, for a given employee education level, the job level has fallen in recent decades. Some researchers conclude from this that there is increasing “overtraining” on the Dutch labour market (employees with an unused surplus of training). However, caution is needed in drawing conclusions of this nature. The level of a job is determined separately from the person who holds it. It is possible that more highly educated employees perform what is in principle the same job in a substantively different way than people with a lower education level, so that the job is in reality upgraded. Moreover, better educated people are likely to be more productive in jobs of the same level. The fact that a “training surplus” carries financial benefits for the employee tends to support this suggestion.
In addition to the level of the job, the pay level is also an indicator of the match between an employee and his/her job. Statistics on the relationship between education and income are less plentiful, however; the Dutch Labour Force Surveys, for example, contain no data on income. By linking the Labour Force Survey data and information from employer pay administrations, however, Statistics Netherlands manages to supplement the Labour Force Surveys with information on pay (the Pay Structure Survey). This creates an interesting widening of the scope for analysis, enabling the relationship between education, occupation and pay to be analysed.
A few results
The job level of employees with a higher education background focused on the public sector indicates that the influx of large numbers of such people into the Dutch labour market has not taken place at the expense of large-scale downgrading of their job level. In general graduates of courses aimed at the public sector hold jobs of a higher level than graduates of courses focused on the private sector. Switching to the private sector generally means a retrograde step in terms of job level for “public sector” graduates. Those who - by necessity - have made this transition most frequently - graduates of courses in the field of language and culture - consequently have the lowest job levels.Women and part-time workers have a lower job level on average than men and full-time workers. However, by choosing the public sector women and part-time workers (there is considerable overlap between these two groups) manage to limit their disadvantage in this respect (table 2).5
5 A difference of one point is equivalent to the difference between a job for which a secondary education background is sufficient and a job requiring a higher education level
110 10th CEIES Seminar – Education and Training Statistics

Table 2 Difference in job level between men and women and between full-time and part-time employees in the private and public sector, by education level, 1995-1997
women “large” part-time jobsa “small” part-time jobsb
private sectoreducation level
secondary education -0.23 -0.26 -0.46higher professional education -0.38 -0.35 -0.79university training -0.29 -0.34 -1.05
public sectoreducation level
secondary education -0.07 -0.08 -0.13higher professional education -0.15 -0.13 -0.17university training -0.11 -0.08 -0.14
a 20-34 hours per week compared with 35 hours and aboveb 12-19 hours per week compared with 35 hours and above
Source: Statistics Netherlands (Labour Force Survey 1995, 1996, 1997)
According to data from the Pay Structure Survey carried out by Statistics Netherlands (i.e. the Labour Force Survey supplemented with information from company pay administrations), people with a higher education generally earn less in the public sector than in the private sector. However, there are considerable differences between individual segments of the public sector. The pay for administrative posts in the government service is virtually equal to that in the private sector, whereas pay in the health care and welfare sector lags a long way behind for large groups of employees.
Women and part-time workers are generally more poorly paid than men and full-time employees. As in the case of job level, however, this discrepancy to the disadvantage of women and part-timers is much smaller in the public sector than in the private sector. The public sector thus offers a degree of protection to women and part-time workers.
3.3 Data on the perception of work and career
Objective indicators such as job level and remuneration provide some insight into the attraction of occupations in the public sector. However, they give no indication of how public sector employees themselves perceive their work. In order to retain workers in sectors such as education and the health service, it is important to know what they themselves think of their work. How closely do they consider that their job matches their training? How satisfied are they with their job content, pay and career prospects? How do they rate the working conditions? What motivates employees to move to jobs in different sectors?
The core statistics on the match between education and employment, the data derived from the Labour Force Surveys, contain no subjective indicators. There is also no information on the course of people’s careers or on what motivates people to opt to work in a different sector from the one for which they have been trained.
In the broader context of the ongoing research carried out by Statistics Netherlands into the living situation of the Dutch population - the POLS Survey - attention is also given to perception of work. One limitation of the survey is the relatively small number of respondents, although the number has been extended in recent years; this puts constraints on the possibilities for differentiating between different occupations and sectors of the economy.
10th CEIES Seminar – Education and Training Statistics 111

A few results
In the opinion survey, public sector employees emerge as relatively satisfied with the content of their work (possibility to development one's talents, enjoyment and variety in the work) and with the match between their work and their training and experience. They are also relatively satisfied with their working conditions, with the exception of health care employees, who complain about severe physical stress. Education workers indicate more than others that their work regularly becomes too much for them. The reasons for this cannot be deduced from the available information.
The level of dissatisfaction with pay and career opportunities is relatively high in the education and health care sectors. The Dutch education system appears to be confronted primarily by an image problem in the area of the conditions of employment. In reality the conditions of employment are not much worse than for other employees with higher education backgrounds, while the starting salaries in the Dutch education system are actually quite high.
3.4 Data on choice of study
Dutch education statistics have traditionally focused on describing the participation in education during the compulsory schooling years and the phase immediately thereafter (initial education).There is a fairly complete picture of student numbers and on the movements of students between the different school types. Thanks to these statistics it is also possible to compile forecasts of the numbers of young people who will eventually leave the education system and start looking for a place on the jobs market. The Dutch Ministry of Education, Culture and Science administers such a forecasting model, which is used to make annual predictions of the outflow from the education system in the coming years.
The Dutch statistics on adult education are less complete - in spite of the importance that is attached to lifelong learning. For example, the most recent survey of company training programmes dates from the early 1990s (though a new survey is being held in 2000). Traditional education statistics also provide no insight into the motives of young people in choosing a given education course. The statistics are based on the administrations of education establishments, so that the emphasis lies on institutional data; of the participants themselves, nothing is known beyond their age and sex. For example, the statistics reveal that the interest in teacher training courses and nursing training declined in the nineties; however, they offer no clue as to the background to this trend.
Occasional studies have however been carried out to ascertain the motives underlying people’s choice of study and their wishes and expectations with regard to their later occupation. For example, a 1991 survey looked at the choices and study progress of students who had entered higher education in that year, and this survey was repeated in 1995. Additionally, the subject of school choice is one of the topics covered in a survey which is held every two or three years among secondary school students and which is organised in part by the Social and Cultural Planning Office (the National Secondary School Students Survey).
A few results
These surveys reveal that young people with an interest in courses aimed at the public sector consider job content to be important. Young people with an interest in courses focused on the private sector, by contrast, are more concerned with issues such as remuneration and promotion opportunities. One specific area of attention is the ability to combine working with having a family
112 10th CEIES Seminar – Education and Training Statistics

and children. In the Dutch situation, a part-time job is often seen as a condition for achieving this combination successfully. Given the wide opportunities for part-time employment in the public sector, many young people who regard the ability to combine paid work and having a family as important therefore look for a job in the public sector. Education, in particular, benefits from this.
3.5 Data on entry to the labour market
Once young people have completed their studies, they look to enter the jobs market. To meet the need for information on the entry of school-leavers into the Dutch labour market, annual samples are taken among those leaving secondary education, higher professional education and, more recently, university. These surveys provide information on the level of unemployment among school-leavers and higher education graduates, the amount of time it takes young people to find a job, the type of job, the match between their work and education, the level of remuneration, etc. The surveys are not organised by Statistics Netherlands, but by the Research Centre for Education and the Labour Market. They are a valuable addition to the education statistics compiled by Statistics Netherlands.
4 CONCLUSION
To gain an insight into the labour market problems in the Dutch public sector, a wide variety of data are needed. In addition to data on the actual discrepancies, there is a need for information on the background to how these discrepancies arise.
Quantitative tensions on the Dutch labour market can be charted fairly accurately using data from the Labour Force Surveys and vacancy statistics. Indicators such as the unemployment rate among groups with different educational backgrounds and the number of vacancies in different sectors of the economy provide a picture of the occurrence of surpluses and shortages. The Labour Force Surveys also provide an insight into the size of the potential labour supply for a given sector (unemployed graduates who are not looking for work, graduates who are employed in a different sector from the one for which they trained). Mobilising these groups can contribute to the elimination of shortages.
The Labour Force Surveys also provide important indicators for the qualitative match between education and work. Moreover, linking data on remuneration from company pay administrations to data from the Labour Force Surveys generates information on the match between educational background, occupation and pay. Finally, the Labour Force Surveys are a valuable building block for forecasts of quantitative trends on the Dutch labour market.
As well as the Labour Force Surveys, the annual surveys of the outflow from the Dutch education system also provide an important source of information for charting matching problems in the transition from education to the labour market. Although these surveys are not carried out by Statistics Netherlands, they have become a key element of the mainstream supply of statistical information on the Dutch labour market.
Beyond these well-developed statistical sources, however, there are several domains for which less statistical information is available. Education statistics provide an extensive insight into the actual choices made by students and thus into the educational backgrounds of the future labour supply. What is missing is information on what motivates young people to make a particular choice, how they perceive different courses and occupations, what leads them to choose certain courses in favour of others. The occasional surveys carried out offer a few hints, but this is a theme which deserves more attention within the statistics on education.
10th CEIES Seminar – Education and Training Statistics 113

A further point is that the emphasis in Dutch education statistics still rests on initial, government-funded education. The information on education and training in later life is more limited. Given the importance that is attached to lifelong learning as a condition for functioning in the labour market, this is an area which logically deserves greater attention.
One final area, which deserves more attention relates to data on the perception of work and on the course of people’s careers. Information on employees’ job satisfaction and on the decisions they take during their careers is one of the starting points for a policy aimed at reducing the matching problems in the public sector.
114 10th CEIES Seminar – Education and Training Statistics

ANALYSIS OF LABOUR MARKET OUTCOMES FROM EDUCATION AND TRAININGIN ENGLAND
Chris LittlerDfEE, Analytical ServicesW608MoorfootUK- Sheffield S1 [email protected]
Introduction
1. This paper describes some of the data and methods used in England to analyse outcomes from education and training. It concentrates in particular on:
the use of education and labour market data sources in understanding the labour market destinations of young people on leaving compulsory education;
the analysis of long term economic benefits and value for money of education and training as proxied by lifetime earnings gains; and
the use of data on flows into and out of unemployment as a means of evaluating the impact of labour market policy and programmes.
Education and labour market data
2. The DfEE publishes data on the education and labour market status of young people in England through a regular Statistical Bulletin6. This draws together information from a number of sources:
population data from the Office for National Statistics (ONS) and Government Actuary’s Department;
labour market data from the Labour Force Survey (conducted by ONS); education data from censuses: Schools Census, Further Education (FE) Statistical Record
and Individual Student Record of the FE Funding Council; and higher education data from the Higher Education SA?; Government supported training from Training and Enterprise Council (TEC)
Management Information; employer funded training from the LFS; and further information on the activity of young people from the Youth Cohort Study (YCS).
6 DfEE (1999)
10th CEIES Seminar – Education and Training Statistics 115

3. From the analysis of this data we know that currently:
many young people (almost half of 16-18 year olds) are active both in the labour market and in education and training;
27% were in education and training but not in the labour market;
22% were in the labour market but not receiving education or training; and
4% were not in education, training or the labour market.
Overall 9% were not in education, training or employment.
4. Looking at trends over time we know that:
the population of 16 year olds has fluctuated widely over the last 40 years, but will be relatively stable over the next 15 years (chart 1);
numbers of 16 year olds staying on in school and college increased up to 1993, but has been fairly stable since then (chart 2);
whilst numbers studying General National Vocation Qualifications have risen, numbers taking GCSEs and lower level NVQs has declined (chart 3);
numbers of 15 year olds getting level 2 qualifications increased dramatically since the introduction of GCSEs, but the proportion who get no qualifications was not affected (chart 4);
the proportion of 16 and 17s not in education, training or employment has remained stable around 9% (chart 5);
ILO unemployment rates for 16-17 year olds continue to rise whilst those for the whole population have declined (chart 6).
5. This descriptive information is useful in telling us about the status of young people in their first years following compulsory schooling, and how this has changed over recent years. The Government is now focusing more on reducing the numbers who are not participating in education and training, and increasing the proportions who attain levels 27 and 3 in order that young people will fare better when they enter the labour market, and meet the increasing skill needs of employers.
7 There is a target to increase the proportion of those aged 19 to have achieved NVQ level 2 or equivalent from 72% to 85% by 2002;
116 10th CEIES Seminar – Education and Training Statistics

6. In order to inform target setting for qualification attainment, and to monitor progress against those targets, the Department makes projections of level 2 and level 3 outcomes. These are based on projections of participation in the various routes of education and training at age 16, and on assumed success rates. Participation in education is modelled from trends in GCSE attainment at age 15, combined with trends in staying on rates; participation at 17 is then largely based on estimates for age 16, and so on. Success rates are based not only on pass rates for qualifications but also incorporate drop-out from courses, changes between routes, and re-engagement after age 16.
7. We would like to assess future trends, not only on the basis of current polices, but also if policy changes. Thus the above modelling is carried out for different policy scenarios, and combined with rates of return analysis (described below) to make an appraisal of the likely value for money of the policy options.
Rates of return
8. To assess the value for money, or cost effectiveness, of an investment in education and training we estimate rates of return, or net present value of that investment. We have looked at the returns to specific qualifications as an indicator of the likely value of expanding provision in certain types of training, and we have looked across the board at particular age ranges to appraise the value to the economy of expanding provision generally. This section discusses the DfEE’s approach to rate of return analysis using Labour Force Survey data on earnings by qualification. For a wider review of academic work in this area see Blundell et al (1999).
9. The estimates are of social rates of return8, which are a measure of the resource benefits relative to the resource costs of a programme or policy. Resource benefits are the resultant increase in national output, proxied by the increase in participants’ lifetime earnings (plus associated non-wage labour costs). Resource costs are national output foregone to provide the policy or programme.
10. Rates of return for education and training are estimated from the difference in the lifetime earnings of those who have undertaken a particular type of education and training compared with individuals who have not. This difference is then expressed relative to the costs of that learning. In order for the difference in earnings to be attributable to the learning episode, the comparison group must be as similar as possible in other characteristics as those undertaking the learning. We use the term “alpha factor” to represent the proportion of an earnings gain that is due to the training rather than other factors.
11. Some limitations on the use of rates of return calculations include:
rates of return measure economic benefits and costs, they do not measure distribution effects such as equality of opportunity and issues of social inclusion;
rates of return do not include wider and indirect economic and social benefits or costs, due to the inherent difficulties of measurement. Indirect benefits might include the impact of better educated and trained workers on international competitiveness which benefits the whole economy (and which is hence not fully reflected in the earnings of those individuals participating in the education or training programme), and effects on health and crime levels;
8 To some extent the term social rates of return is a misnomer as they do not include effects on health, crime and the environment, effects which the term social often conjure up. A better term for the estimates in this paper may be economic rates of return, since they seek to measure the net increase in economic resources available to the country, i.e. national output arising from the investment in learning.
10th CEIES Seminar – Education and Training Statistics 117

rates of return normally measure the past effects of programmes, reflecting data availability, which may not necessarily be a good guide to the future in periods of rapid change in the economy or other policy developments. For example the earnings of someone now aged 45 with a particular qualification are taken to be what someone now aged 18 gaining that qualification will earn by the time they are aged 45, adjusted for average national real earnings growth;
it is not clear whether rates of return focus on the average or marginal rate of return to beneficiaries of the programme, or somewhere in between; given wage determination in competitive markets with homogeneous individuals then the estimates would represent an average of individuals’ marginal rates;
a lack of information exists on the proportion of individuals’ earnings premium due to the learning rather than to other factors such as innate ability (often known as the alpha factor). The earnings premium due to learning derives both from a direct effect on productivity due to learning how to do the job, and to the impact of the qualification itself acting as a signal of abilities and enabling a better match of individuals to jobs;
it is not clear the extent to which relative wages reflect individuals productivity or are determined more by social factors;
rates of return tend to be static, based on a framework where skills supply affects the level of GDP, and fail to capture fully the impact of skills supply on the rate of national economic growth, for example, by allowing or generating a faster pace of technical change.
12. A number of factors make the estimation of rates of return to vocational qualifications more difficult when compared with general education qualifications:
there can be a wide variation in the ages at which individuals gain vocational qualifications and thus a variation in the period over which lifetime earnings are enhanced post-qualification. The available data sources on earnings do not record the age at which respondents gain their qualifications, rather the age at which they left full time education;
little information exists on the resource costs of gaining vocational qualifications through the work place. There are real difficulties in distinguishing the costs of on the job training from the cost of simultaneous productive activity. Employers keep limited records of such costs and, even if they did, it is likely that costs would vary between different employers and types of training;
for vocational qualifications it is sometimes less obvious who should form the comparison group against which to measure the increase in individuals earnings post-qualification;
the sample sizes in the available data sources are smaller;
some vocational qualifications are too new to allow data on the lifetime earnings of those attaining them e.g. Modern Apprenticeships.
118 10th CEIES Seminar – Education and Training Statistics

13. The table below shows the raw information available from the LFS; it shows average earnings by highest qualification. The figures are ‘crude’ data in that they make no allowance for other factors affecting earnings, such as innate ability. The figures will be affected by the composition by age of those holding the different qualifications, in particular they will be biased downwards for qualifications disproportionately held by younger people since younger people normally have lower earnings.
Gross weekly earnings (£), full-time employees, Spring 1998, England and WalesAll Males Females
First degree & above 524 587 409
Other HE 386 446 306
All A levels 393 438 311A level: 2+ 408 450 328Vocational level 3 345 371 251All level 3 369 399 290
Trade apprenticeship 348 359 238
All GCSEs grade A-C 301 345 251GCSE grade A-C: 5+ 327 385 271GCSE grade A-C: <5 279 316 236Vocational level 2 243 276 202All level 2 304 350 251
CSE below grade 1, GCSE below grade C 273 296 224
No qualifications 246 271 197
All 357 395 285
Source: Labour Force Survey
14. The next step is to compare earnings by age for one qualification against a comparison group. The chart below gives a simple visual representation of the apparent earnings benefits over a working life for a vocational qualification (ONDs) compared to GCSEs.
10th CEIES Seminar – Education and Training Statistics 119

Earnings By Highest Qualification - Males (ONDs with 5 or more GCSEs 1994-1998
16-19 20-24 25-34 35-44 45-640
50100150200250300350400450
Gro
ss w
eekl
y ea
rnin
gs
16-19 20-24 25-34 35-44 45-64Age
<5 GCSEs>5 GCSEsONDs
Some methodological details
15. The value of costs and benefits arising sooner are greater than those arising at a later date (£1 today is worth more than the promise of £1 tomorrow). Therefore the costs and benefits arising in future years are discounted to their present value, using a standard discount rate of 6%. The rate of return is the discount rate at which the sum of discounted benefits equals the sum of discounted costs, and a rate of return above 6% is taken to indicate a worthwhile investment.
16. LFS data are used to identify individuals’ highest qualification, whether this was gained through school, college or work, and their age when they completed continuous full-time education.
17. Higher qualifications tend to be associated with lower unemployment rates, so this is factored into the earnings data, again using information from the LFS.
18. To get a full measure of the productivity gain from higher qualifications, we need to add in non-wage labour costs, to represent the value of an additional worker to an employer. This boosts the earnings figures (at all levels) by 25%.
19. We expect real wages to grow in the future, and assume a rate of 2% growth per annum at each qualification level.
20. Whilst people are spending longer in education, their earnings will be lower than if they had entered the labour market sooner, or had stayed in the labour market instead of returning to education. We take account of earnings foregone during the additional period of education, by estimating how much longer the period of education will be, and how much people will earn through part-time jobs whilst learning.
120 10th CEIES Seminar – Education and Training Statistics

Using flows data in labour market policy evaluation
21. Labour market policies in the UK are often evaluated on a programme by programme basis, using specially commissioned surveys and using a combination of quantitative and qualitative techniques to examine and process and outcome effects of the programme. But in addition, in the case of large policy changes, or when assessing the aggregate effects of policies in combination, the Department has used analysis of unemployment flows data.
22. This method has only been possible for programmes targeted on people aged 18 or over, because the data is not available for 16 and 17 year olds.
23. The stock of unemployment is driven by flows. Both inflows and outflow rates reflect how people move between different labour market states due to the influence of the economic cycle and the impact of policies and programmes. There is a clear correlation between outflows and inflows, and the relationships is determined by outflows, ie outflows determine the average duration of unemployment, or the time lag between an increase in inflows and an increase in outflows. We observe a fairly stable relationship over time (although the numbers of off-flows vary over the economic cycle, the proportions of inflows passing through specific unemployment durations are similar irrespective of the economic cycle.
24. The impact of the economic cycle on flows is different to that of policy: in an economic downturn we would expect to see an increase in lay-offs and a reduction in new hires, but a successful active labour market policy would increase the rate of off-flows. Hence analysis of off-flows can play an important part in policy evaluation. Estimation of how we would expect off-flows to behave over the cycle can form a baseline against which to judge the impact of a policy change.
25. Simple analysis of LFS data reveals the extent of movement between labour market states (employed, unemployed and inactive). The LFS has a longitudinal element that allows us to see what individuals were doing in consecutive periods (quarterly). But this understates the extent of movements since it does not record multiple changes within the quarter, nor does it record movements within states (around a half of job changes are direct to another job without a period of unemployment).
26. In policy evaluation we want to know the impact of the policy compared to if it had not existed. In particular, has the target group’s outcomes changed compared to expected outcomes without the policy?; has the policy affected employers’ behaviour, individually or in combination?; has the policy affected flows into non-job outcomes?
27. We don’t have comprehensive data to track individuals from state to state over time, but the claimant count is useful for tracking groups. We can use claimant count data to test, for example, whether outflow rates for the target group increased above that we would expect for given labour market conditions (deadweight); we can test whether outflow rates for non-target groups changed compared to the target group (inflows may also rise in this case) (substitution); and we can test whether outflows fell generally due to disadvantaged firms reducing recruitment due to the policy, or inflows increased due to layoffs (displacement).
28. From the claimant count we also have information on other destinations, for example education and training, other benefits, and those who “fail to sign”, and so can assess policy impacts more widely than changes in job outcomes.
10th CEIES Seminar – Education and Training Statistics 121

29. Policy aims are likely to be broader than simply getting people into work; they may also aim to increase people’s long term employability, so we need to look at the duration of employment for those who leave the count using longitudinal data. From the claimant count we have information on stocks and flows of the claimant unemployed; we have information by duration, age, sex, marital status, destination on leaving, and sought and usual occupation, all by geographical area. But these data are not at individual level. To look at individuals’ experiences we can use the JUVOS dataset, a 5% sample of people from the claimant count, which tracks individuals over time, giving us exact unemployment durations, and enables calculation of propensities to return to the count, and, if people return, analysis of where they go next. Even if someone returns to unemployment post-programme, we can check if employability has increased because less time is spent on the count.
30. Use of the LFS for this type of analysis is limited because of small sample sizes, but the Department intends to examine its potential for analysing labour market outcomes for people aged 16 and 17, for whom we do not have claimant count information. Another option is to use specially designed longitudinal surveys with matching against individuals not affected by the policy. Crucial in such work is the ability to identify individuals who were similar in characteristics whether or not they were affected by the policy. This too has proved more easy in the case of adults on labour market programmes, than for young people on education and training programmes. However, where possible, such surveys enable more sophisticated assessment of the characteristics of individuals and of their experiences pre and post programme, for example whether they secured full or part time work, and, if people re-enter unemployment, the reasons for doing so. A recent example of a matched comparison group study can be found in Payne et al (1999).
__________________________
References
Blundell, R. et al (1999) Human Capital Investment: the returns from education and training to the individual, the firm and the economy, Fiscal Studies Vol 20, No.1, Pp 1-23
DfEE (1999) Statistical Bulletin: Education and labour market status of young people in England, aged 16-18: 1992-1998, Issue No11/99, October 1999
Payne, J. et al (1999a) Work-based training and job prospects for the unemployed: an evaluation of Training for Work, DfEE Research Report RR96
Payne, J. et al (1999b) The Impact of Work-Based Training on Job Prospects for the Unemployed, Labour Market Trends, July 1999
122 10th CEIES Seminar – Education and Training Statistics

10th CEIES Seminar – Education and Training Statistics 123

124 10th CEIES Seminar – Education and Training Statistics
10th CEIES Seminar – Education and Training Statistics 125

126 10th CEIES Seminar – Education and Training Statistics

10th CEIES Seminar – Education and Training Statistics 127

128 10th CEIES Seminar – Education and Training Statistics

10th CEIES Seminar – Education and Training Statistics 129

PART 2:THE FUTURE AND FUTURE
DEVELOPMENTS
130 10th CEIES Seminar – Education and Training Statistics

10th CEIES Seminar – Education and Training Statistics 131

SURVEYS ON EDUCATION AND TRAINING IN ITALY
Aurea Micali Liana VerziccoISTATViale Liegi 13 [email protected]
Introduction
Over the last few years ISTAT’s surveys on education and training have undergone profound restructuring.
The restructuring affected both content and organisation. With regard to the latter, it should immediately be stated that the main change is that the competent ministries have been put in charge of the surveys. In 1999/2000, after a process that lasted almost four years, ISTAT ceased producing data from administrative sources on students and teachers, both for schools and universities (though it continues to cooperate with the two Ministries in order to define the variables needed to analyse the sector and the systems for gathering and processing data).
Stopping the administrative surveys of schools and universities opened new doors: firstly, it provided an opportunity to take a second look at the information included in the surveys themselves, and secondly, it allowed ISTAT to tackle new fields of investigation and thus to enrich the scope of information available on information and training.
The following pages give a brief introduction to the Italian educational system, followed by a description of the main statistical innovations regarding it.
1. The structure of the Italian educational system
Since 1998, significant innovations have been made to the legislation governing the Italian educational system, and are gradually having an effect. Specifically:
the age limit for compulsory education has been raised from 14 to 15; elementary and lower secondary education will be combined into a single seven-year programme
(one year less than it currently lasts). From now on, upper secondary school – which up to now was almost always a single programme lasting five-years – will consist of two successive stages, the first lasting two years, and the second, three.1
training, either within or outside the school system, has been made compulsory up to the age of 18. 15-year-olds will have to continue some form of training, choosing from school, regional vocational training (outside the school system), or apprenticeships.
university education (with the exception of doctorates and specialisation courses) has been divided into two consecutive programmes, the first lasting two years, the second, three. Until now, the two programmes (short and long), were independent. Students could choose to register for the long degree programme without having completed the short one, which was exactly what the immense majority did. The two programmes are now sequential. Students may register for a specialised degree only after having completed a short, introductory-level
1 In this way, obligatory schooling, which until now only provided students with a lower secondary school diploma, will in future come to an end after the first stage of upper secondary school.
132 10th CEIES Seminar – Education and Training Statistics

programme.
The reform therefore lengthens the period of compulsory schooling, while offering students programmes that are more varied and, above all, shorter. Up to now, in Italy, education was quite a bumpy road, and many of those who attempted to continue their studies ended up abandoning them. Upper secondary level programmes were much too long, and, in practice, most of them were too focused on preparing for university. University programmes themselves were long (4 to 5 years) and became almost interminable, given the actual time students took to complete their degrees (the average is currently over six years).
The following breakdown will help explain the old course structure’s undesirable effects. If we follow the education of an imaginary generation of 1000 students who have completed lower secondary school, we see that, even before the period of compulsory education was lengthened, practically all Italian students chose to continue their studies beyond the legal minimum age. As we see in Figure 1, 93% of students with a lower secondary school diploma (14-year-olds) go on to the next level. However, our educational/university system was quite wasteful of students’ (and their parents’) resources - not only in financial terms. The number of students leaving the school system early is extremely worrying. Of 1000 lower secondary school graduates, only 731 complete upper secondary school, and only 169 complete a university degree. In fact, every year around 17% of those who register for upper secondary courses drop out, as do approximately 63% of those who have begun a university programme.
Moreover, regional vocational training (outside the school system) was not a real alternative since, until now, the diplomas granted under this system were not recognised by the school system. Only 33 out of 1000 lower secondary school graduates decided to take regional vocational training, and only 15 chose this type of course after completing upper secondary school.
In addition, the lack of any upper-level technical training at post-secondary level forced almost all those who wished to continue their studies to register for a university degree programme. And, as mentioned above, almost all the students opted to take the long programme (435 out of 1000 lower secondary school graduates chose to pursue a long degree, while only 24 chose a short one). These choices were made because short university degrees were not explicitly recognised on the labour market2 and, especially, because enrolment for many of these programmes is limited, which is not the case for the long degree.
2. Surveys of students in schools and universities
The above problems, and the projects for reform that are underway, had repercussions on the statistics on education and training. Over the last few years, these have been re-examined so that the monitoring the changes taking place might be improved.
With regard to statistics specifically on universities, in 1999 ISTAT completed a project to set up an information system that would provide instruments for monitoring and assessing universities. Funding was provided by the Ministry of Universities. One of the project’s goals was to enable the Ministry to support ISTAT in its role as a producer of data. Now that the work is complete, some new surveys, including those on the short and long university programmes, are being carried out directly by the Ministry of Universities. These are the last such surveys to be transferred to the competent ministries.
2
For example, the civil service does not hold competitions that are restricted to those who hold degrees of this kind.
10th CEIES Seminar – Education and Training Statistics 133

134 10th CEIES Seminar – Education and Training Statistics

The review of the surveys on the various levels of education had two objectives:1) to provide the data needed for international comparisons;2) clarify the selection process carried out by universities.
The main innovations were, first of all, that the structural characteristics of registered students (age, place of residence, etc.) were systematically recorded, and secondly, that the students’ educational paths were analysed in greater detail. This is particularly the case with regard to universities, where, as we have seen, the drop-out problem is most serious.
Age was not included in surveys on education until four years ago. Students’ educational paths, the length of their studies, and the results were all analysed for the year of the programme being taken. This approach was satisfactory and practical as long as the Italian educational system’s structure was as rigid and unvarying as that described in figure 1. The creation of new educational paths (advanced technical training, the growth in public and private vocational training outside the school system, etc.) splintered the previously monolithic system. It thus became necessary to include age as a guiding criterion for the analysis of both registered students and of graduates from the various levels.
As of this year, Italy will thus be more prominent in the educational indicators produced by both the OECD and EUROSTAT. Both of these use age as a guiding criterion for comparing the results and processes of educational systems which sometimes differ widely in structure. ISTAT recognised the need to expand the observation of our educational system to include comparisons of performance between different countries and ensured that, from nursery school on, age data was collected for the whole educational system, both within and outside the school system proper.
With regard to the second objective (analysing the educational path), a large number of variables are now being collected, both for schools and universities (changes of address at upper secondary school level, transfers between public and private schools, examinations passed by university students, date of entry into university, etc.). As we will see, this information does not only come from surveys of schools and universities, but also from a series of surveys of students that ISTAT has recently launched.
3. Vocational training outside the school system
Vocational training used to be somewhat ignored in our statistics because of the minor role it played within the training system. Nowadays however, thanks to the possibilities opened up by the law which makes it compulsory to complete schooling, whether within the regional training system or the school system, statistics on vocational training have also been improved.
In Italy, vocational training outside the school system has been regionally based since 1971.Besides the gathering done at local level by each individual region, the only sources of statistical data capable of describing the national system coherently and completely are the surveys carried out by ISTAT and ISFOL (Istituto per lo Sviluppo della Formazione Professionale dei Lavoratori (Institute for the development of vocational training activities), a research institute run by the Labour Ministry). Private vocational training does exist, but it is not yet included in official statistics.
10th CEIES Seminar – Education and Training Statistics 135

Processing of administrative data by ISFOL
Every year the regions present a report on the activities they have carried out to the Labour Ministry. On the basis of this, the Ministry is able to monitor and assess the efficiency of training programmes created in the regions.Generally once a year, ISFOL gathers and redistributes the data included in the reports, e.g. number of programmes, number of students registered and taught, typology and economic branch of courses (administrative budget data).A large part of regional training is now co-financed by the European Social Fund – approximately 75% of courses in 1998. In order to assess the system and the policies which are co-financed by the ESF, ISFOL, at the behest of the Labour Ministry, has set up an evaluation structure. Once a year, this structure produces financial, effectiveness and efficiency indicators, as well as an assessment of the effect on the socio-economic background.
ISTAT’s surveys
ISTAT carries out an exhaustive statistical survey of vocational training courses once a year. In this survey, it collects information on the activity carried out in various regions directly from training schools which are run by the regions, as well as from those private schools which have an agreement with the regions (trade union, entrepreneurial or religious centres).
Beginning with the survey of courses given in the 1996-97 school year, the survey’s structure has been extensively updated with the addition of new variables: students registered and their ages, the area of the training course (according to the Eurostat “Fields of Education and Training” classification) and, for introductory level courses, the participants’ diplomas. The information contained in this survey, which gathers data on both courses and students, makes it possible to analyse the training courses available and how they are used in detail. By comparing them with other socio-economic indicators (enrolment rate, employment and unemployment rates, local labour markets, etc.) the region’s ability to run schemes to support employment that meet the specific local conditions can be assessed.In particular, including age, the diploma or degree granted and the number of students who are qualified/trained in the questionnaire makes it possible to analyse the population’s participation in the training system as a whole, and not solely in the school system.The rates of participation, selection and passing (qualification) can now also be calculated for students taking vocational training. New indicators of efficiency and effectiveness can now be produced for the training system as a whole.
Let’s look at some figures... Between 1996 and 1997 the number of students registered in regional vocational training grew from 422 000 to 670 000. Despite this significant rise, this type of course is still used relatively little (Table 1). Initial training, which is open to youth with only a lower secondary school diploma, attracts only 1.8% of those between 14 and 21, and peaks at 3.2% for 15-year-olds.
136 10th CEIES Seminar – Education and Training Statistics

Table 1 – Participation rates in the training system broken down by age, 1997/98
Not all regions are equally active in supplying training courses. The North has the most courses available, 57.6% of the total, while the Centre provides 25.7%. The South, where unemployment is highest, provides only 16.6%.
Consequently, use is concentrated in the North (Table 2), where 3.87% of 15 to 21-year-olds are registered for initial training courses. In the South, the rate is only 0.8%.The low use holds true for other types of courses as well: it is only 0.8%. Once again, the highest rate is in the North (1.1-1.4%).
Table 2 – Rates of student participation in regional vocational training (percentage of 14 to 21-year-olds), 1996-97
4. Surveys on entering the job market
Despite their many innovations, surveys of schools or universities are poorly suited to an approach which focuses on participants in the training process because the information stored in their management records is limited.ISTAT, taking advantage of the opportunity provided by the transfer of surveys on education to the Ministries, has therefore launched a series of surveys of the students.
A set of three surveys focuses on analysing the value of various diplomas and degrees on the labour market:
10th CEIES Seminar – Education and Training Statistics 137

1 Survey of choices made concerning further study and employment of upper secondary school graduates; 2 Survey of employability of university graduates (short degree); 3 Survey of employability of university graduates (long degree).
This is an integrated survey system. The methodology used in the three surveys is highly consistent, the questionnaires are similar in structure and the questions are put in as similar a way as possible. In addition, some questions are the same in all the surveys to ensure that linking them with the Labour Force Survey will be possible. All three surveys: last three years, are carried out on students from a single year, are carried out approximately three years after the diploma or degree was granted.
The survey of graduates from upper secondary school and from short degree programmes was first carried out in 1998 (and will be repeated in 2001). The survey of graduates from the long degree programme is now being carried out for the fourth time and has undergone major revision to ensure that the information from it is comparable to that from the other two surveys of the system3.
Since the survey of upper secondary school graduates is the largest and the questionnaires are interchangeable to a large extent, only the latter’s structure will be described here.
4.1. Survey of educational and career paths of upper secondary school graduates
Up to 1998 in Italy, analyses of the education and career paths could rely on having a large amount of information available on university graduates, but no equally-rich information on secondary school graduates was available.And yet, this is the group which has the highest rate of unemployment and of which many (approximately 50%) return en masse to university in an often failed attempt to improve their qualifications and escape from a long and discouraging job hunt.
In order to throw some light on these aspects, the questionnaire focuses on three main areas, each of which is subdivided. These areas are:
Education (Preceding and current)
Jobs/Job search
3. Socio-economic status of the student
The survey proposes to, firstly, analyse the jobs of those who choose to enter the working world, and secondly, examine in depth the university career of the many young people who choose to continue their studies. Each student’s course history after graduation from lower secondary school is also provided4.
3
Work has also been done to ensure consistency in terms of survey techniques: surveys of graduates from upper secondary school and short degree programmes are done by telephone and follow C.A.T.I. (Computer Assisted Telephone Interview) standards, while the next survey of graduates with a long degree, which used to be carried out by mail, will be done by telephone following C.A.T.I. standards.
4
Much of the information on educational paths given above comes from this study in particular.
138 10th CEIES Seminar – Education and Training Statistics

Carrying out the surveys three years after graduation makes it possible to investigate how (or whether) the young people have entered the workforce (the average time needed for a graduate under the age of 24 to find a job is 23 months) and their commitment to university studies (number of examinations sat, attendance, etc.) or, conversely, the reasons for leaving university. The first years of degree programmes are precisely those where dropping out is particularly prevalent.
In its attempt to discover the causes behind choosing various educational paths, the analysis takes into account the socio-economic background of the student, thus permitting assessments to be made of the known link between social background and selection/rejection by universities and of the ability of right-to-study policies to compensate for it.
The questionnaire’s main priorities and the related areas of investigation are shown in Figure 2.
4.2 A comparative analysis of the surveys
Perfecting a survey system provides additional information derived from a comparative analysis of the results. Having consistent information available on three levels of education allows some new questions to be answered, such as how long should one continue one’s studies? From what point of view? To what extent does the educational system ensure “equal opportunities”?
Since the same methodology was used in the three surveys, certain conclusions can be drawn with regard to the value of different investments in education (secondary school diplomas, degrees, etc.) in terms of jobs for the effort, cost and time involved, and the reasoning behind certain choices made by young people and their families can be explained.
Along with the obvious problem of over-education of university graduates in this country (particularly in some areas), there is a massive influx of new secondary school graduates into universities. An accurate examination of the jobs available to holders of different diplomas and degrees should help determine what motivates this behaviour.
The unemployment rate among secondary school graduates (Table 3), even three years after they have completed their studies, is extremely high (35%). As we have already mentioned, this is the reason many young people decide to attempt university studies after secondary school. Conversely, few have a permanent job (35.8%). Those with little work are consequently called upon to do relatively undesirable jobs. Legal employment (not on the black) only accounts for 60% of cases, and more than a quarter work at jobs requiring qualifications similar to those of labourers (27.5%). Only 8% earn over LIT 2 million a month.The data clearly show that, in the Italy of today, a secondary school diploma is a de facto minimum required to enter the labour market and avoid being marginalised.
10th CEIES Seminar – Education and Training Statistics 139

140 10th CEIES Seminar – Education and Training Statistics

Table 3 – Upper secondary school and university (short and long degree) graduates three years after graduation. Main employment indicators, 1998/99
A university degree is definitely more advantageous than a secondary school diploma. Three years on, unemployment among young university graduates is lower (23.7% vs. 35%) and the stability and regularity of employment is higher (55.5% have permanent positions, as compared to 35.8% of secondary school graduates), the 93% who are not self-employed regularly pay social security contributions (compared to 60% of secondary school graduates). Another sign of higher-quality employment is remuneration: the percentage of those earning over two million lire per month is 8% of secondary school graduates, and more than four times that for university graduates.
The situation as regards short degree programmes is as follows. These programmes appear to make it easier to enter the workforce (graduates have the lowest unemployment rate at 13.4%, and the highest rate of permanent positions at 58%) and the general distribution is similar in terms of quality to that of graduates with a long degree, with the exception of somewhat lower pay. The data therefore confirm that what was already apparent from the strictly scholastic point of view holds true for the labour market. That is, there is a need for intermediate diplomas, both from an educational and employment point of view.
In fact, not all young graduates end up with a job suited to their education. Often they are over-educated. 25% of them consider a long university degree to be an excessive qualification for the work they carry out, particularly those with literary, scientific and engineering degrees.Even when a long degree is required for the work young graduates do (which is only in 67% of cases), 39% of them end up in “non-intellectual” professions (Table 4). This problem is particularly serious for graduates in engineering, politics/social sciences and economics/statistics, which happen to be the programmes with the largest number of students in Italy.As for the third point – “equal opportunity” in terms of access to and results of a university education – comparing the three surveys provides a way of monitoring the effects of
10th CEIES Seminar – Education and Training Statistics 141

university selection on socially-disadvantaged/privileged youth.
Table 4 - 1995 graduates of long degree programmes employed in a job requiring a long degree three years after graduation, broken down by type of degree (percentage of graduates with the same degree)
(a) Excluding legislators, managers, entrepreneurs, professionals, scientists and highly-specialised professions
Since the survey of secondary school graduates was carried out three years after these had completed their education, it allows a comparison to be made between the family backgrounds of those who chose to continue their education and those who attempt to enter the workforce directly.5 The survey of those who hold long or short degrees also makes it possible to compare the background of those who complete a university degree with those who began it.
Both the father’s level of education and his profession affect the “probability” of whether the children will register for university.The level of education appears to be the most influential variable (Table 5). 33% of those whose father only has an elementary school diploma choose to register for university, but the percentage for the children of graduates from a long degree programme is almost double that (84.9%). Correspondingly, the percentage of those who decide to enter the workforce drops
5
The same survey allows the family background of those who have begun a degree but then discontinued their studies to be analysed as well.
142 10th CEIES Seminar – Education and Training Statistics

from 42.1% of those whose father has only an elementary school diploma, to only 8.5% of those whose fathers hold long university degrees.The influence of the parents’ diploma or degree is clear throughout the child’s education. For example, the percentage of students whose father has a long university degree, rises from 9% of upper secondary school graduates to 15.5% of new entrants to university to 23% of those who graduate from the long degree programme.
Table 5 – Upper secondary school graduates who are university students, have left school, or are working three years after graduation, broken down by the father’s diploma or degree (percentage of graduates in the same situation)
(a) Excluding those in permanent employment
5. Gaps in information and future developments
Despite the many innovations made, the survey system on education and training still has a few gaps concerning both the relationship between education and employment and the analysis of the training system proper.
With regard to the first matter, it should be pointed out that ISTAT has launched a study on how to carry out a national survey of the results in terms of employment for those who have completed some regional training. The survey should be held by 2002. Like the other surveys of students, this one will be carried out three years after courses have been completed. Thus it will be possible to check if the training received was efficient in helping the students enter the workforce and to compare the results with those of other kinds of programmes, such as secondary school diplomas, short university degrees, etc. Over the last few years, several surveys on placement have been carried out at regional level in Italy. The most interesting of these was carried out by ISFOL, which analysed the employment opportunities (in 8 of the 20 regions) of a sample of young people who took courses co-financed by the ESF during 1996. It looked at the long-term unemployed, youth searching for their first job and equal opportunities. The information gathered in two surveys done a year after training was completed was compared with a representative sample of individuals who had not undergone any training obtained from the longitudinal data of ISTAT’s labour force survey.
Another aspect of the relationship between training and work to which insufficient attention has been paid in Italy is lifelong learning. Admittedly this is partly because Italy lags seriously behind in terms the availability of this type of training. The prevalence of SME’s in our system of production is an aggravating factor, since the amount of training supplied by an enterprise increases with its size. Only 15% of enterprises with over 10 employees have
10th CEIES Seminar – Education and Training Statistics 143

provided training for their employees. However, this percentage rises from 8.6% of enterprises with 10-19 employees to 89.1% for those with over 1000 employees1.While this problem is definitely significant, and even more so when seen through the lens of ever wider international competition, the main source of information on lifelong learning in Italian enterprises comes from the Eurostat sample survey, the “Continuing vocational and training survey” (CVTS). However this is only carried out sporadically. Italy took part in 1993, and will repeat the survey with reference to 1999 as part of the second CVTS survey.As for government sponsored programmes, they have gaps in two areas. No complete framework regarding lifelong learning provided within the public administration is available. Nor are complete descriptions of the courses provided by the Labour Ministry in collaboration with the regions (for example, there is no information on the vocational skills provided by the courses, nor on the ages of the participants). Given the patchwork nature of the information Italian statistics provide on this subject, the Eurostat vocational and training survey, in combination with the Labour force survey, is a precious source of information. As we know, the surveys refer to training activities carried out in the four weeks preceding the interview. Besides recording information on the programme registered for, its duration and the reasons for taking it, the survey makes it possible to associate this information with the main socio-demographic characteristics of the respondent, their level of education and their employment situation.Beginning with the April 2000 survey, Italy has decided to include the ad hoc module in its questionnaire. The information will therefore be gathered in each successive labour force survey.
As we mentioned above, another gap in professional training concerns private training, on which no systematic information is currently available.
Returning to the subject of surveys of students, in 2002 ISTAT will begin a survey of students who completed lower secondary school in 2001. Once again, the survey has two goals: to monitor the effect of the reform that extended compulsory schooling to the age of 15, and to determine the extent to which the labour market is “responsible” for students leaving school. After all, whether a student leaves school is partly a function of their family’s socio-economic status, and partly the result of competition that sometimes takes place between school and the labour market.
As we can see, a significant part of statistics work in Italy concerns the problem of school-leaving (even many surveys of upper secondary school graduates are concerned with those who drop out of university). Rather than basing such figures on sample surveys, it would be more efficient to set up a student register. Both the Education and University Ministries have done feasibility studies on this matter.In addition, the register could be the basis for sample surveys on entering the workforce, which would require much less effort in terms of organisation.
To complete this description of the innovations that are taking place in the training sector, the survey of expenses incurred by families for education and training is worth mentioning. This data is needed both in order to reconstruct the total amount of expenditure on education and training according to the international standards set in the UOE models (Unesco, OECD, Eurostat), and to meet the national requirement of verifying the effect of these expenses on family budgets. This would allow the effectiveness of right-to-study policies to be judged.
1
CVTS 1994.
144 10th CEIES Seminar – Education and Training Statistics

Italy has already experimented with such a survey of all levels of education. The definitive survey will be launched in 2001.
In conclusion, it should be emphasised that over the next few years, statistical activity will not be limited to carrying out the projects just mentioned. To a large extent it will also focus on later revision of the surveys of schools and universities. New reform initiatives that should make these consistent are now underway. Even if ISTAT will no longer be directly responsible for these statistics, it will be involved in the restructuring process to be launched by the statistical offices of the relevant ministries.
10th CEIES Seminar – Education and Training Statistics 145

STATISTICS ON ADULT TRAINING - CONCEPTUAL PROBLEMS
Helge NæsheimStatistics NorwayP. O. Box 8131 Dep.N - 0033 [email protected]
When producing statistics of good quality it is important to have a clear definition of the phenomena in focus. If you want to compare statistics over time and between countries as well, it is important that this definition is commonly agreed and used. But one could go one step further. To achieve comparable statistics the definition must also be "measurable" because making statistics also involves collection of data. This means that the definition has to be implemented as a set of questions to be used in surveys or as programs for extracting data from administrative registers. In this paper I will look at one specific problem connected with statistics on adult training.
The OECD is working on a thematic review on adult learning involving Norway among other countries. We have been presented a paper calling for tables. In the paper they define adult learner as" A person who has left initial education but have taken up training again".
In this paper I will first present some reflections on two elements in this definition:
"Education" vs. "training" "Has left initial education"
The main part of my paper is, however, a presentation of empirical results of three different implementations of the element "has left initial education".
Education vs. training.
Since there are used two different word for learning, "education" is used in the first part of the definition ("initial education") and "training" in the last part ("taken up training again") I consider this is done to reflect two different concepts. My understanding would be that "education" is connected to institutions in the educational system from primary schools up to universities. The learning activity in this system normally ends up with public recognised diploma based on that you have passed some tests. I consider then "training" to be a broader concept. It will include education but also small informal lessons at the working place with no diploma based on a public test but perhaps only stating that you have attended the course. However, compared to learning achieved just by working, in training there is a minimum level of organisation connected to the learning process. This distinction is of course not easy to implement on a consistent way in a survey.
In an OECD paper to the Working Party on Employment and Unemployment Statistics ("Guidelines on the Measurements of Training - a Draft Proposal", DEELSA/ELSA/WP7(2000)6) there is a discussion on different concepts of education, training. I suppose some of this will be presented at the CEIES seminar as well.
Initial education
In the manual to ISCED (the International Standard for Classification of Education) "initial education" is mentioned as "education at the early stages of a persons life prior to entry into the world of work". This is pretty vague and is perhaps not meant do be a strict definition. As
146 10th CEIES Seminar – Education and Training Statistics

mentioned earlier OECD as a part of their thematic review, asked for statistics on those having left initial education. "Having left initial education" could be implemented as the first interruption in a person's educational career for more than x months/years. In discussions with the OECD 1 or 2 years have been mentioned as two possible limits. Using a long time limit reduces the probability to include interruptions that you do not want to include (military service, sickness..). Another way of dealing with this problem would then be to have short period and then ask for the reason for interruption. But this of course means more resources needed/higher response burden and measurements problems.
This year the member countries of EU are conducting an ad hoc module to the European Labour Force Survey on "transition from school to work". The problem in this survey to define "when people leave education" is somewhat parallel to the problem in statistics on adult learning. In the LFS ad hoc module one have chosen 1 year as a time limit.
We will in this paper present figures based on three different implementations of what is initial education. a. Those who have left initial education for one year or more b. Those who have left initial education for two years or more c. Those 30 years and older
Alternative a. versus b. is only of interest if you are including young people in your definition of adult learners. For older people one would expect the two methods to give the same results.
Alternative c. is interesting of two reasons: From a conceptual point of view it can be argued that one should accept a certain transition
period from education to working life and that 30 years could be seen as a relevant time limit for defining a persons initial education. It can also be argued that some of the training received at the first job in the labour market can be seen as part of the initial education in the way that the school system do not give all the necessary education in how to implement theoretical knowledge in a working environment.
Concerning data collection age is normally easy to measure and in most cases it will give comparable figures between countries.
We will look at the impact these different definitions have on the number of adult learners.
Data sources
Our analysis will be based on data from two different data sources. We will use register datato identify those who have left initial education. And then by linking data on micro level we use data from the Norwegian Labour Force Survey (LFS) to identify those on training. The reference period for the LFS-data is the second quarter 1998. The sample in LFS is 24 000 persons aged 16-74 years old.
In the Norwegian LFS we have a question to the respondents if they participated in any training for the last 4 weeks. At the moment we have a cue in the first question, which restrict "training" to what is considered by the respondent to be relevant for the present or a future job. In the forthcoming revision of the LFS this restriction will be taken away (in the first question). Besides that cue, the definition of training is based on the respondent's opinion. Later in the sequence of questions we do however have questions that can be used to restrict (but not to broaden) the definition.
10th CEIES Seminar – Education and Training Statistics 147

Statistics Norway has a register on everyone registered as students by 1 October each year. This register covers all formal education lasting more than 300 hours. As can be seen the reference point is not quite the same in the LFS and the Education register. In the future the Norwegian LFS will have questions on training every quarter so that we will be able to have a better overlap in reference period. On requests of the OECD we use an upper age limit of 64 and a lower age limit of 25 years.
Results and discussion
First we look at those "having left initial education" using the three different methods mentioned above. It is important to remember that this is only "the potential" adult learners. To be defined as adult learners they have to be in training as well. Method a (using 1 year as lower limit for interruptions in education) gives the highest number of potential adult learners. Method b (2 years interruption or more) gives a figure that is 69 000 or 3 per cent lower and method c (at least 30 years of age) gives a figure 235 000 or 11 per cent lower. Comparing method a. and b. we find that the difference is highest for those 25 years of age (13,5 per cent) and then it decreases by age. For older people all three methods gives as expected only minor differences. In fact we would have expected the three methods to give the same figures for those over 35 or 40 years old. To be in education without any interruptions (longer than 1 or 2 years) seems unreasonable at that age. It is probably shortcomings of the registers or the way we use them that explains these results.
Table 1 Population by age and method of defining "having left initial education". 1998. 1000
Age 1 year interruption
Total As per cent Of population
2 years interruption
Total As per cent of population
Age 30 years or more
Total As per cent of population
Total 2 223 96.0 2 154 92.6 1 988 85,5
25 years 49 76.5 40 63.0 : 26 " 55 81.6 46 69.0 : 27 " 59 86.4 51 75.3 : 28 " 61 89.6 55 80.1 : 29 " 65 91.2 60 84.3 : 30 " 66 93.0 61 87.0 71 100 31 " 65 94.4 62 89.4 69 100 32 " 66 95.2 63 90.8 70 100 33 " 66 95,7 63 91.9 69 100 34 " 66 96,0 63 92.7 68 100 35-39 " 312 96.8 303 93.4 322 100 40-49 " 606 98.0 594 96.0 618 100 50-59 " 520 99.3 515 98.5 523 100 60-64 " 177 99.9 177 99.7 178 100
We then link the register data on those having left initial education with the LFS sample. Since both data sources identify persons by their National Personal Identification number the linking process is straightforward. We restrict our study to the employees. In our data set we have also excluded education in "General subjects". This is education on primary school level and some courses on secondary school level. We expect the number of adult learners to be low in this kind of education as long as we look at those in paid work.
According to the LFS the number of adult learners do not differ much among the three methods. The percentage of adult learners among all employees is the same (9.4 per cent) for method a. and
148 10th CEIES Seminar – Education and Training Statistics

b. For the youngest age group method a. gives a somewhat higher percentage than method b. (8.5 vs. 8.2).
A lower percentage of training among young people compared to those over 30 years, can be explained by the fact that they may have chosen a more relevant education for the present labour demand and that they for the same field of education as older people, are more theoretically updated. On the other hand everyone do need some training when starting in a new job. As young people are over represented among starters one would then expect them to have a higher proportion of adult learners. The effect of this is probably the reason why those with 1 year of interruption from initial education have a higher rate of adult learners than those with 2 years of interruption.
If we use method c the total number of adult learners is lower than the two other methods because those under 30 are excluded. The rate of adult learners based on the population over 30 years is however higher of the same reason.
Table 2 Employees having received training during the last 4 weeks by age and method of defining "having left initial education". 2 quarter 1998. 1000
Age 1 year interruption 2 years interruption Age 30 years and more
Total 210 24 69109 7
202 21 66107 7
189:
71110 7
25-29 years 30-39 " 40-59 " 60-64 "
Table 3 Employees having received training during the last 4 weeks as per cent of the total number of potential adult learners by age and method of "having left initial education". 2 quarter 1998.
Age 1 year interruption 2 years interruption Age 30 years or more
Total (25-64) 9.4
8.510.8 9.6 4.0
9.4
8.2 10.7 9.6 4.0
9.5
: 10.6 9.6 4.0
(30-64)
25-29 years 30-39 " 40-59 " 60-64 "
10th CEIES Seminar – Education and Training Statistics 149

Conclusions
There is a lack of international recommendations concerning statistics on adult learning Defining persons under 30 years of age as adult learners could be questioned. It increases
measurement problems and costs and the need for training is to some extent of a different nature. Training data for this group should be presented separately.
The most difficult measurement problem concerning training statistics is the borderline between "informal" training at the workplace and learning by just working. One should therefore collect data that can distinguish between different kind of training.
Robust and important indicators on adult training should be developed for the LFS. A more comprehensive collection of data should be done in separate surveys.
150 10th CEIES Seminar – Education and Training Statistics

STATISTICS ON IN-SERVICE TRAINING AND FURTHER EDUCATION IN NORWAY
K. Jonny EinarsenStatistics Norway Post Box 1260N - 2201 [email protected]
1. INTRODUCTION
Whenever a business produces goods or services, there are three factors in particular which have a major bearing on the result of that which is produced. These factors are the technology and the routines and procedures used by the company and the skills and expertise which the employees in the business have at their disposal in order to make use of the technology of the company and to train in the routines and procedures employed. In a world which is increasingly marked by a globalised information economy, both technology and routines and procedures are becoming ever more uniform from one company to the next. This means that the ability of a company to produce goods and services will depend increasingly on the skills and expertise of its employees. In order that a company is able to increase production, its competitive ability or the quality of its products or services, it is therefore necessary to view skills and expertise as a strategic tool (Berg, Bremer Neppen and Arup Seip 1999). This recognition of skills and expertise as a critical advantage over the competition has set in motion work by the authorities to develop an organised system for in-service training and further education.
Skills and expertise reformTo help realise the vision of life-long learning, work was set in motion in the 1990s to redevelop the range of in-service training and further education available in Norway. However, several important aspects of the Norwegian In-service Training and Further Education Reform (EVU) are yet to be resolved. Nevertheless, it seems clear that the In-service Training and Further Education Reform should be based on the statutory right of the individual to have leave for education, the right to further education for all adults, the development of systems for the documentation of actual skills and expertise, new modified support arrangements from the State Loan Society for education, and a three-way funding arrangement by the State, employers and employees (NOU 1997: no. 25)1. In addition, the In-service Training and Further Education Reform should be part of the central pay settlements between parties in the working relationship.
Attempt to define in-service training and further educationIt is difficult to provide a clear definition of in-service training and further education. One alternative could have been to define in-service training and further education as “an official education activity which a person starts a given number of years after his or her original education was completed". It does, however, need to be clarified what is meant by official educational activity, how long the educational activity should be, and how many years’ gap there should be after the original educational activity in order to qualify as in-service training and further education, and so on.
Another way to approach this is to define in-service training and further education by breaking down by age. In-service training and further education in further training may, for example, be restricted to “persons in further training aged 21 years or over", whilst a corresponding definition
1 The Norwegian State Loan Society for education is a public bank which offers pupils and students grants and loans at better rates than do private banks. Loans from the State Loan Society, for example, do not have to be repaid during the period of study and are interest-free during this period.
10th CEIES Seminar – Education and Training Statistics 151
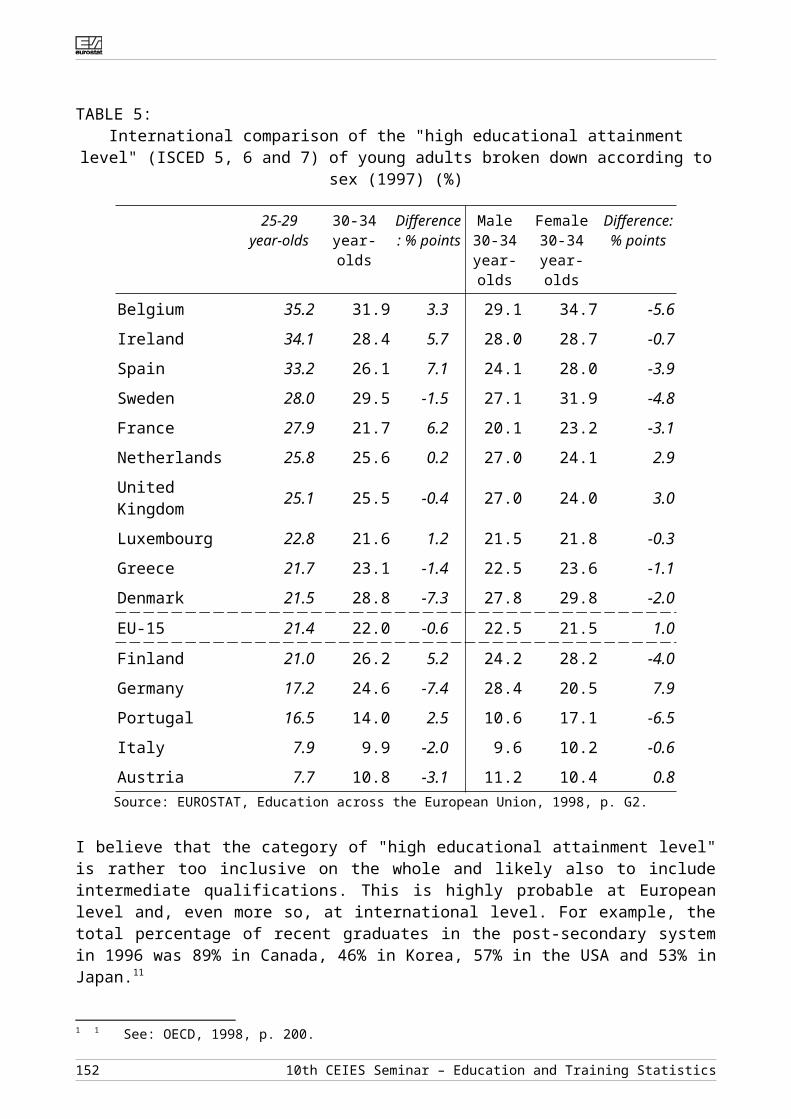
for higher education could be limited to "persons in higher education who are 30 years of age or older".
The following definition, however, provides a somewhat more succinct definition of in-service training and further education. "In-service training means shorter courses which do not necessarily end in officially recognised skills and expertise, but are intended to renew and update what has been learnt the first time round. Further education means exam-focused studies that result in officially recognised skills and qualifications, often with a view to specialising in or building on basic education (Norwegian Central Statistical Office, Latest statistics on education 6/1999)."
2. EXAMPLES OF IN-SERVICE TRAINING AND FURTHER EDUCATION STATISTICS IN NORWAY
There are statistics available in Norway covering the following main groups within the field of in-service training and further education: 1. Practical candidates who enrol for vocational examinations as private, external candidates in
further training. 2. Package available from the Employment Service as part of job training3. Specific in-service training and further education course at universities and colleges.4. Age-related, individual-based statistics within further and higher education.5. Labour-market statistics on attendance at courses by employees.6. Other statistics in the grey area between in-service training/further education and adult training.
Practical candidates in further trainingThe “practical candidate system” (also known as private, external candidates) gives adult employees the opportunity to enrol for vocational or apprenticeship examinations with almost all training carried out during work time. To be eligible to apply for vocational or apprenticeship examinations, candidates must be over 21 years of age, must have completed a short course on the theory and must be able to document 25 per cent more all-round practice within a specialist field than for the total training time of the subject. In 1998, 20,300 private external candidates were registered has having enrolled for vocational exams. This figure represented around 60 per cent of all candidates. A clear majority of those who took vocational or apprenticeship exams in Norway were adult employees who did almost all their vocational training during their work time. The SSB has statistics at individual level on practical candidates.
Package available from the Employment Service as part of job training The National Employment Service in Norway offers employment training courses (AMO course) which are an important source of in-service training and further education in Norway. The Employment Service courses are offered to anyone registered as being unemployed. The aim of the course is to get job seekers qualified to do ordinary work, to reduce the gap between the job requirements and the skills of the job-seeker and to motivate the unemployed to go into higher education. The number of people attending AMO courses depends on the number of unemployed. In the 1997/98 academic year, almost 34,000 participants attended an AMO course, of whom a good 53 per cent were women. SSB has statistics about individuals on AMO courses at individual level.
Specific in-service training and further education courses at universities and colleges In 1998, some 94,000 were registered as being enrolled on specific in-service training and further education course at universities and colleges. Of these, a good 65,000 attended shorter in-service training courses and 29 000 took up further education studies. The source of these statistics is the Norwegian Socio-Scientific Data Service (NSD), which has statistics in summary form on those attending specific in-service training and further education courses at university and college.
152 10th CEIES Seminar – Education and Training Statistics

Age-related, individual based statistics within further and higher education A simple way to provide an indication of the extent of in-service training and further education is to divide the individual-based statistics by age. Since the statutory right of the student to attend further training must be taken up within four or five years from the time he or she left primary school for pupils or apprentices, the age of 21 years or older is an appropriate age limit for in-service training and further education in further education.In 1998, almost 22,000 pupils in schools of further education and 11,000 apprentices were aged 21 years or older. This is equivalent to 13 per cent of the total number of pupils, and 34 per cent of apprentices.
Within higher education, the number of students aged 25 years or over or 30 years or older may provide a good indication of the scope of in-service training and further education. In 1998, a total of 184,000 students were registered in higher education. Of these, 50 per cent were 25 years of age or older and 26 per cent were 30 years of age or older. The source for these statistics is the SSB’s age related, individual-based statistics.
SSB’s individual-based statistical system for education statisticsThe most central part of the educational statistics is the SSB’s individual-based education statistical system. This statistical system contains personal data, through the individual’s national identity number, relating to all persons in further and higher education. It differentiates between "education in progress" and persons who have "completed" their education. In addition, the individual-based statistical system contains data about the highest level of education completed for all people over the age of 16 in Norway.
The individual-based statistics have a clearly higher statistical value than statistics in summary form. This is due to the fact that the individual-based education statistics provide much greater opportunities for analysis thanks to the use of personal identity numbers as a key link. When using personal identity numbers as a key link we can, for example, produce analyses of the length of education, and link the education of individuals with aspects such as income, skills, social background, level of parents’ education, address, immigrant status, so on and so on. In addition, these education statistics provide much better opportunities to build up cost-effective systems for providing quality assurance for statistics. Individual-based statistics are, therefore, normally of clearly higher quality than summarised statistics.
Labour-market statistics relating to courses attended by employeesIn the SSB’s selected investigation, the Labour Force Survey (AKU), questions were asked about the attendance on courses by employees every 2nd quarter. In 1998, a total of 226,000 employees attended courses over a four-week period in the second quarter of 1998. Attendance on courses by employees is highest among women with higher education. Around 20 per cent of women educated to university or college level have attended a course. Most courses lasted for less than one week. These statistics provide an indication of the extent of in-service training and further education in the workplace.
10th CEIES Seminar – Education and Training Statistics 153

Other statistics in the grey area between in-service training and further education and adult educationOther adult training statistics can also provide an indication of the extent of in-service training and further education in Norway. Within primary school, a basic offer of teaching is available to adults. Since primary school is compulsory, this offer of education, however, is of very limited scope only. In 1998, just under 1,900 pupils were registered as attending primary school education for adults. SSB has summary statistics on primary-school training for adults.
One important form of in-service training and further education for adults is teaching in Norwegian with sociology for adult immigrants, asylum seekers and refugees. In 1998, some 17,300 people were registered as being enrolled in this form of adult education. The Ministry of the Church, Training and Research is the source of these summarised statistics.
“People’s colleges” are another important strand of the adult education statistics. People’s colleges are popular colleges with a liberal approach to education, where there is no required course of study or exams from institutions or bodies outside the people’s college. In 1998, 13,500 students were enrolled at such colleges in Norway. Almost 70 per cent of pupils were women. SSB has individual statistics about these colleges.
Perhaps the most flexible form of adult education in in-service training and further education is carried by distance-learning institutions. Teaching is done via the internet, video conferences, TV, video, telephone, etc.. In 1998, around 45,000 pupils were registered on distance-learning courses. SSB has summary statistics on distance learning.
The study associations are freely independent bodies that offer a very comprehensive range of adult training and in-service training/further education. The studies offered are, in common with the people’s colleges, traditionally based on "the ideology of popular education", and most courses are short, week-long courses. In 1998, a full 681,000 people were registered as attending courses from the study associations. SSB has summary statistics on activities at these associations.
3. WEAKNESSES IN THE STATISTICS ON IN-SERVICE TRAINING AND FURTHER EDUCATION
Our analysis above reveals that there are some relatively extensive statistics on in-service training and further education in Norway. The in-service training and further education statistics, however, have a number of obvious weak points.
1. A lot of definition work to be doneThe area of in-service training and further education is so new, unique and diverse that there is a good deal of work to be done in clarifying the terms in the field of statistics. Centralised terms such as in-service training and further education, for example, and “actual” skills and expertise are not sufficiently clearly defined. In addition, the terms are incorporated only to a limited extent in SSB’s individual-based statistical system.
2. In-service training and further education integrated into SSB’s individual statistics to a limited degree onlyOne of the most basic limitations of SSB’s individual-based education statistics is that they only chiefly cover pupils and students on courses or study lasting longer than 300 hours. Many of the study courses on offer for in-service training and further education, however, last less than 300 hours. These shorter study courses are, therefore, not included in SSB’s individual statistics.
There are, however, ways to sort out shorter courses in parts of SSB’s education statistics, but the shorter courses are systematised in SSB’s individual-based training statistics to a far lesser degree
154 10th CEIES Seminar – Education and Training Statistics
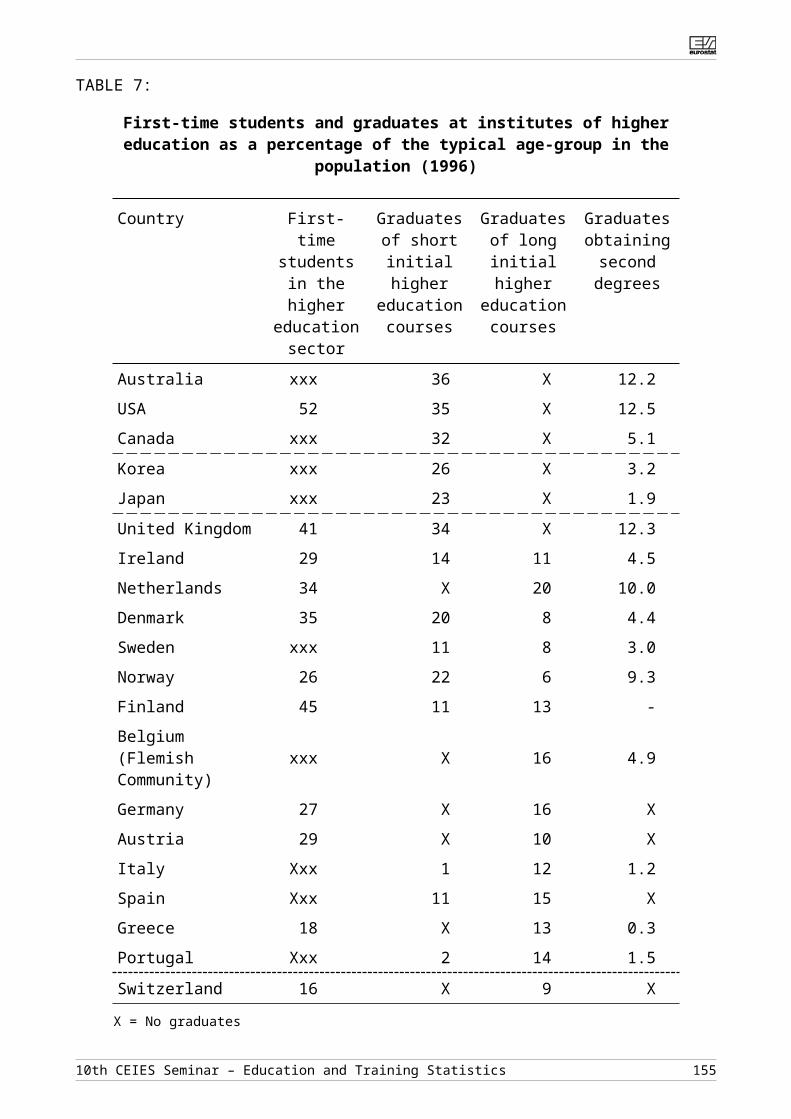
than are the longer courses. Since the individual statistics represent that element of the education statistics which are of the highest quality and which offer the clearest user potential, this means that in-service training and further training statistics have not been incorporated into the most central parts of the training statistics in Norway. 3. Small volume of statistics relating to internal company in-service training and further educationA significant proportion of in-service training and further education is conducted through in-service training and further education during work at companies, on courses, seminars, in-service learning, etc. With the exception of a small amount of data from the AKU (Labour Force Survey) there is, however, extremely little in the way of statistics on internal company in-service training and further education.
4. Limited link between further education and in-service training statistics and employment statisticsWithin in-service training and further education, the link between the education system and the needs of the labour market are particularly important. This link, however, is only taken care of to a limited degree in official statistics in Norway.
5. Lack of an overall picture in the area of statisticsStatistics for in-service training and further education constitute an extremely fragmented area in statistics, arising due to the many different parts from various sources. There is little in the way of a tight, overall grasp of in-service training and further education statistics. It is, therefore, difficult to get a complete picture of this field of statistics.
4. HOW TO IMPROVE IN-SERVICE TRAINING AND FURTHER EDUCATION STATISTICS?
There are nevertheless comprehensive statistics available in Norway on in-service training and further education. And we have had a sensible, step-by-step approach, and perhaps have come a long way in setting up a lot of statistics. The statistics have, however, a lot of obvious weak points, of which the most important ones are the fact that in-service training and further education statistics are only slightly integrated into the SSB’s individual-based training statistics, the weak link with employment statistics and the low volume of statistics on in-company in-service training and further education. At the same time, the authorities’ work on the In-service Training and Further Education Reform has progressed so much that there is now a need to take a more overall grip to ensure that we can create forward-looking statistics of high quality. The SSB should, therefore, take the initiative to conduct a preliminary project funded by the Ministry of the Church, Training and Research (KUF) to see how we can establish better, more universal statistics for in-service training and further education. The project should take into account such aspects as:
1. Assess the current position and shortcomings in the existing in-service training and further education statistics
2. Clarify the potential consequences of the In-service training and Further Education Reform for the statistical requirements of society.
3. Draw up definitions of the most central terms within the field of in-service training and further education, and define the statistical scope in relation to other statistics
4. Specify how a more uniform statistics for in-service training and further education can be createdIncluding assessment of :
10th CEIES Seminar – Education and Training Statistics 155

How to integrate the in-service training and further education statistics into the SSB’s individual-based education statistics.
Propose solutions for the creation of improved statistics on in-company in-service training and further education.
Establish better links between statistics on in-service training and further education and the labour market.
Create good links between national statistics and international statistics on in-service training and further education.
Assess solutions for reporting, revising and publication.
5. Proposal on how we can include central user groups in the development of in-service training and further education statistics
6. Against the background of the examination of the points above, work out a specific project specification for a project on the development of more uniform in-service training and further educational statistics
Bibliography
Berg, Lisbeth, Bremer Nebben, Eivor og Arup Seip, Åsmund (1999): Etter og videreutdanning i statent, Fafo-rapport 268. Oslo: Fafo.
NOU (1997:25): Ny kompetanse. Grunnlaget for en helhetlig etter- og videreutdanningspolitikk, The Ministry of the Church, Training and Research, Oslo: Akademika.
Statistisk sentralbyrå (Norwegian Central Statistical Office) (1999):Voksenopplæring i Norge, Actuell utdanningsstatistikk no (“Latest Education Statistics”). 6/1999.
156 10th CEIES Seminar – Education and Training Statistics

CHANGES IN LABOUR MARKETS AND THEIR IMPACT ON EDUCATION AND TRAINING STATISTICS
Roger FoxFAS (Foras Áiseanna Saothair)Training and Employment AgencyPO Box 45627-33 Upper Baggot StreetDublin [email protected]
IntroductionIn this paper I aim to present some ideas in respect of the future of education and training statistics. These ideas are based upon a consideration of the functioning of labour markets and how this functioning has changed, and may change further in the future. Thus the paper concentrates on changes driven by labour market changes - not other changes driven, for example, by information and communication technologies. The paper also ignores the issues of survey fatigue and data protection restrictions through these, too, are of major importance to future statistics collection and analysis.
The perspective is based upon over twenty years experience in the research department of FAS - the national training and employment authority of Ireland. FAS is a public body responsible for a range of training and employment services for both the employed and unemployed. The organisation's concerns relate to initial vocational training, including apprenticeship and training for early school leavers, and to training for the adult unemployed and persons wishing to return to work after family responsibilities. FAS also promotes and assists training by enterprises and for employees. The research department, naturally, has a strong responsibility in training statistics to support the work of FAS. Indeed, the department is both a producer and user of training statistics. The author has also been involved with a number of international statistical data collection which help to inform the views expressed in this paper.
Why collect statistics on education and training? Some of the reasons are to measure progress towards some target, to allow for comparisons with other countries or sectors, to examine issues of access of target groups, to assess sufficiency against future needs and to measure cost-effectiveness and/or cost-efficiency. To be useful statistics on education or training must usually be comparable either through time or with some other statistic. The principal users of education and training statistics are public policy makers and researchers. Individuals, the unemployed and employers are rarely interested.
The Increased Importance of Human Resources in Economic DevelopmentThere are a range of changes happening in labour markets that impact on the types of education and training statistics required in the future. These will be considered in turn in the following sections. The most important is the fundamentally increased importance of human resources in economic development. While there is a danger of exaggeration in relation to the information society, the general premise is valid. Economic success is less and less dependent upon physical resources (whether land or raw materials), and capital equipment can be purchased freely in world-wide markets. Thus competition is largely based on the relative quality and price of human resources. The implication of this is that increasingly Governments are concerned to compare their country's human resource capability with other countries, and to improve it wherever cost-effective. Of course, this is not a totally new development, but it seems to me that the need for such international comparisons will become increasingly strongly expressed in the coming years. As
10th CEIES Seminar – Education and Training Statistics 157

globalisation continues, such comparisons will also need to cover a wider range of countries. Concentration on OECD or EU country comparisons will not be adequate. The key problem for statistics in this area is the issue of comparability. Even assuming that all countries do not deliberately attempt to present statistics in a biased way and this is a very strong assumption), it seems that real comparability will be hard to achieve. This author's (limited) experience of international statistics has indicated that a wide range of factors reduce the comparability of many education and training statistics. To take an obvious example, the definition of training, and its distinction from education, differs between EU countries - and perhaps over time within any country. I am not raising a new point here, but given that the policy-makers demand is for comparability, then a failure to achieve it makes any published statistics useless. Indeed, it can be argued that they are worse than useless because they may mislead. There seems no easy answer to this problem. nternational organisations will have to take a tougher, more interventionist, role in dealing with countries supplying statistics for international comparisons.
Measuring Outputs, not InputsThe second aspect of change relates to the issue of what is to be measured. Increasingly, policy numbers are interested in capabilities and attainments. Comparisons of HRD capability between countries is of most interest. A comparison of amounts of education and training between countries is a comparison of inputs - relevant as a measure of efficiency - but of less interest than a comparison of outputs. Thus, for example, the amount of training in one country may exceed another, but the second country may still have a better skilled population. The conclusion is that measures of the outputs of education and training will be increasingly required.2 Again, this is an area which has gained in interest over the years with, in particular, international comparisons of students' abilities in a range of areas such as language, science and maths, and adult literacy. However, in the vocational training area the lack of comparability of vocational qualifications has prevented any attempt to simply count the number of certificates awarded in different countries. Nevertheless, controlled testing of outputs is likely to be an area of increased activity and one, I suggest, where official statistical bodies may become increasingly involved.
Life SkillsThe next area of change relates to the importance of non-formal qualifications and skills. Such skills are known by a number of terms; 'life skills' , 'generic skills'. The labour market places a very high value on such skills and employers, in particular, attempt to recruit persons with such skills.
There is a hypothesis that more flexible labour markets allow employers to 'hire and fire' more easily, and thus enable them to recruit people on a trial basis. If this were true, then employers would be less interested in what certificates potential recruits hold. However, there is little support for this hypothesis in practice. Rather, the increasing importance of the human resource component to value added is leading in the opposite direction. Because of the need for co-operation to permit integrated processes in manufacturing, it is vital that employers do not recruit poor performers. Equally, in the services areas customer relations skills are vital. Increasingly, large employers are engaging in a range of methods to assess social/interpersonal skills in relation to recruits at all levels (whereas in the past these would have been confined to management - type staff).
The message for policy from this is that education and training providers need to find ways of measuring and certifying these 'soft' skills. When they can do so, then statisticians can count such certificates and thus assist policy-makers to assess the sufficiency or otherwise of national attainment in these areas.
Non-Formal Ways of Learning2 It is recognised that the value of individuals' abilities depends upon the context that they find themselves in.
Thus, even measuring outputs is a simplification of reality.
158 10th CEIES Seminar – Education and Training Statistics

The next factor for change relates to the ways in which learning takes place. Increasingly, recognition is being given to the importance of non-formal ways of learning. Two of these are of particular note; work-based, experiental, learning and self-managed, open, learning. The former of these is not, of course, new but education and training policy-makers are increasingly aware of the importance of work (and indeed outside work) experiences in human resource development. The previous point about the importance of 'social skills' re-inforces this development, as many commentators believe that such skills are most strongly developed in non-classroom situations. Employers, too, are more consciously planning their organisations to give greater opportunities for employees to develop within the work environment. This includes such approaches as quality circles, job rotation, mentoring and work-shadowing. The problem for education and training statistics is that measuring the extent of these activities in terms of quantities of persons involved or similar activity-based measures is of little value. Rather, output-based measures are worthwhile and this raises the problems discussed above of measuring 'soft' skills. Similar problems arise in respect of open learning where measures of inputs are not very useful. Even if one gathered information on the number of persons undergoing open-learning activities, and the duration, the extent of learning development involved would be difficult to determine. Fortunately, however, open learning is most prevalent in respect of formal, education or vocational, knowledge or skills that can be certified upon attainment. Thus for example, it is quite straightforward to count the numbers of European Computer Driving Licences awarded.
Changing Occupations and Hybrid SkillsA further important development in labour markets is the 'blurring' of formerly clearly-demarcated occupations. Traditional craft-level occupations are becoming subject to multi-skilling and new hybrid occupations are being formed. This is, in the first instance, a problem for the design of training programmes. The response of trainers has been to increase flexibility and variation through modularisation, while the social partners have had to accept less conformity of occupations at the wage bargaining stage.
The issue for statisticians is how to approach traditional occupational classification systems. Should a range of hybrid occupations be defined and used to classify persons, or should the dominant occupation be the one to which individuals are classified? To take an example from the Irish labour market, there are training courses (and jobs) in the hotel industry for waiters, receptionists and waiters/receptionists. Some waiters are also qualified barmen, others are not, and, of course, there are also barmen who have no waitering qualifications. It seems to me that reporting only the dominant function is misleading. Systems should attempt to include all the skill sets, qualifications and job tasks that pertain to individuals. Fortunately, this is not really a problem for data stored on a computer data-base, because the data-base can be accessed along whatever characteristic is of interest. Such an approach, however, is impractical for printed publications. It is also impractical for employer-based surveys. However, individuals can relatively easily list whatever skills, qualifications and job tasks they perform.
International Mobility of LabourLabour markets, in common with all markets, are becoming more internationalised. This is reflected in greater individual mobility. Within the EU, of course, such mobility is a fundamental right. There is likely in the future to be significant flows of immigrants to the EU from less-developed countries. At least for some EU countries, this will partly reflect their own need for increased labour resources to compensate for declines in their birth-rate over the last decades. It will also reflect the desire of persons from poorer countries to improve their standard of living and their increased ease of travelling to the EU and North America. In relation to education and training statistics, likely issues will include measuring the flows of persons with recognised qualifications, identifying and forecasting gaps in the labour market that could be filled by qualified immigrants and measuring the extent of the 'brain drain' between countries.
10th CEIES Seminar – Education and Training Statistics 159

The Irish experience may be of interest in this respect. The changing labour market in Ireland has led to a situation of net immigration over the last few years. Forecasts of the future have indicated a continued labour shortage over the rest of this decade which will need to be partly met by immigration. As well as general labour shortages, the country is experiencing particular skill shortages. The Expert Group on Future Skill Needs has undertaken work to compare forecast skill needs in certain occupations/sectors with projected education and training supply. This type of analysis has been conducted in relation to IT specialists, the construction sector and biological sciences.3 While there is nothing new about education and training statistics being used to project gaps, its use in influencing immigration policy is new in Ireland. Indeed, a recent Government Inter-Department Committee on Immigration used such analyses in making recommendations for a skills - based immigration policy. The committee also requested that additional analyses, covering other occupations/sectors, be conducted by the Expert Group on Future Skill Needs.
For statisticians, this primarily poses problems of trying to document, and project, the myriad flows within the labour market. Labour turnover (wastage) is typically the largest cause of demand for new recruits but is very hard to forecast. In fact, in Ireland and many countries, there has been poor data on wastage flows. This reflects the lack of longitudinal data on individuals due to non-linking of separate census or labour force survey data over an extended period of time. This, however, thanks to modern computer power should no longer be a practical problem and we should be able to track individuals' changing employment and occupational status over a lifetime. In addition, there are more panel-based statistics available that can provide data on labour turnover.
Evaluation of Labour Market ProgrammesThese developments also provide much better possibilities for the evaluation of education and training programmes. While such studies have been undertaken for many years, there is in many countries an increased demand for evaluation and cost-effectiveness analyses of publicly-funded education and training programmes. This reflects the developing ethos of public sector reform and management by objectives. Most assessments of education and training have either been based on broad, production function, approaches using education levels or on short-term (up to 2 years) information on employment outcomes after training. The use of longer-term data from census or labour force survey sources could allow more comprehensive, detailed and longer-term evaluations to be made with consequent benefits to policy-making.
ConclusionIn this paper I have noted six developments in labour markets that are having an impact on the types of education and training statistics required for research and policy-making. The short discussion on each development indicates the considerable gap between existing statistics and what would be ideally required. Some of these gaps reflect the nature of the subject of study and will never be fully closed. In some cases, too, the first stage in filling them must come from the education and training systems through more useful means of assessment. However, statisticians also have a role to play in ensuring that they fully co-operate on an international level. They also must use modern data-processing methods to allow more multi-dimensional collection and reporting of data. As I noted at the beginning of the paper, non-comparable statistics are of little value. This is the primary challenge for statisticians over the coming years.
3 Second Report of the Expert Group on Future Skill Needs, FAS/Forfas, Dublin, 2000.
160 10th CEIES Seminar – Education and Training Statistics

EDUCATION/EMPLOYMENT INTERFACESSKILLS4 AND STATISTICAL COVERAGE
Jordi Planas & Guillem Sala5
ICE-GRETEdifici RectoratUniversitat Autonoma de BarcelonaE - 08193 BELLATERRA (Barcelona)[email protected]
The ideas outlined here are based on two research projects in which the authors were involved: as part of a TSER (Targeted Socio-Economic Research) project entitled Education Expansion
and Labour Market (EDEX)6; as part of the second CEDEFOP report on Research on vocational training in Europe, report on
Skill market: dynamics and regulation7.
They are ideas that are still being formulated and are not conclusive findings. They deal with the methods of acquiring and recognising skills that comprise an interface, in a more or less formal manner, between enterprises and the products of the educational system. In this regard, our contribution does not come under either the precise definition of the substance of the skills required in our labour markets or, as a result, their assessment in terms of productive performance, as other works have attempted (OECD, 1996).
These notes deal with the process of institutionalisation of certain features, whose effect has been to go beyond paper qualifications as evidence of the productive skills of those in the labour market. To do this, we start by assuming a more or less general development, in our labour markets, of the structures linking educational systems and productive bodies.
The study of these structures runs up against statistical information systems that are fashioned by the major areas of policy action (education, employment). But the application of scientific criteria shifts the study of the processes of acquiring and recognising skills to a multidimensional approach. The analysis of social change calls for a change in the pattern of available data.
1. From market in qualifications to market in skills
The European countries are experiencing profound changes in the relations affecting individuals' productive skills and how they are described and allotted within the job market.
A look at the output side of productive skills reveals at once a strong trend towards more education. It has become more generally and more universally available, and at the same time it has become longer, leading to an upgrading of qualifications.
4 Skills: Compétences in the original French version. This term can be translated as skills or competencies. Is a dichotomy that poses some non-solved conceptual problems, which we do not deal with in this paper but that should be cleared before any statistical analyses of the skills market.
5 Research workers at GRET (Grup de Recerca sobre Educació i Treball - Institut de Ciències de l'Educació, de la Universitat Autònoma de Barcelona) and members of the EDEX network (Education Expansion and Labour Market).
6 http://edex.univ-tlse1.fr/edex/7 A French version exists (Marché de la compétence: dynamique et régulation - see bibliography). An English
version will be published by CEDEFOP this year (2000).
10th CEIES Seminar – Education and Training Statistics 161

How has increased education affected the description of individuals' productive skills? As it has become more common, the school certificate has become a standard classifier. It distributes school-leavers in successive years in a rigidly organised structure. This results in a more and more prevalent filter effect; in other words, school certificates are no longer enough to ensure job access and promotion.
At the same time, as the filter effect increases, its significance for the labour market is reduced. School certificates reflect a less rigorous selection process than before, and they therefore include a wider range of individuals. School certificates increasingly seldom indicate the relative excellence of those who hold them. By encompassing wider and wider social elements, school certificates reflect more and more varied aspects - cultural and social legacies - that blur the meaning the certificates seek to provide for the labour market.
In conjunction with the variety of starting points, there is also an increasing diversity of educational paths. Certificates now attest to the completion of increasingly varied syllabuses, in terms of the courses followed, i.e. internal diversification. Lastly, there is an increasing number of access routes to the same qualification, with routes ranked according to prestige. An example of this is the significance of the university for graduates in the United States and, to an increasing extent, in the United Kingdom (Buechtemann, Verdier, 1998; Kivinen, Ahola, 1999). Without additional information - in this instance, the name of the university where the graduate obtained his degree - the degree itself proves to be a vaguer indication than before of relative academic achievement and, as a result, of the features traditionally associated with academic success.
On the other hand, changes in the structure of employment, new ways of organising work and the outsourcing of productive activities in turn call for a new approach with regard to identifying and recognising individuals' productive skills.
First of all, the increased complexity of the skills demanded by the production system brings with it the need to implement more precise methods of identifying and assessing skills. The traditional way of acknowledging productive achievement, which can be conventionally called qualifications, has been queried (Marsden, 1994; Lichtenberger, 1999). In its place comes a personalised approach based on actual work situations - skills - for the purpose of classification in the job market.
However, it is not "skills" as such that constitute a novelty in our labour markets. An awareness of skills has always co-existed alongside the institutional idea of qualifications. But in recent years, as a result of the steady erosion of internal job markets, the skills recognition based on interpersonal relations has been weakening. Direct, extended knowledge of workers was in a sense the foundation of occupational careers and the key to the effective assignment of individuals to jobs.
The erosion of internal markets has led to a loss of information about available labour. In turn, this has led to a desire to institutionalise the way in which occupational skills are recognised. The interfaces linking the education system and enterprises have been affected by recognition mechanisms that are in fact organised in a more or less formal or institutional manner, but which set out to indicate the productive skills of individuals.
162 10th CEIES Seminar – Education and Training Statistics

2. Interfaces: between institutional and informal
The acknowledgement that skills are to an increasing extent the basis for trading in the job market means that there is a need for new systems of standardised indicators, which can take the place of qualification-based systems. These indicator systems are deeply linked to the set of rules that govern our job markets and which are themselves undergoing change. How are these rules devised? What part do the State and the social partners play in their construction? Who benefits?
The history of labour markets in Europe is marked by various segments, that are associated with unfair working conditions, and socially created industrial standards that have emerged. These processes have resulted in social and institutional responses, which vary from country to country, concerning the connection between training systems (those with qualifications) and categories of vocational opportunities (jobs).
The formulation of new indicator systems is bound to follow social conventions. Their standardisation in each country depends on specific social contexts where the very notion of skill reflects a wide variety of circumstances (Merle, 1997). Devising an operational system of standardised indicators at the European level must be accompanied by gradual and concerted negotiation based on harmonising the rules in the Member States. This is difficult to foresee in the short term.
The study of the interfaces between the educational system and enterprises prompts two fundamental questions: how are non-qualification skills obtained, and what are the practices that allow them to be identified or recognised by employers?
As part of the discussion prompted by the EDEX project (TSER programme), J.F. Germe has distinguished two models for the relations between the educational system and productive organisations. We shall call them A and B.
In model A there is an immediate link between the output of the educational system - i.e. produced by the system - classified by level and branch and study and the jobs offered by enterprises. In accordance with the model, raising the level of education results in at least a time lag between speedier production of qualifications, especially at the middle and higher levels, and the much slower development of jobs requiring - at least according to the conventions of our labour markets - these particular levels of study. Model A can be found in countries where initial training is essentially based on a school system that incorporates or even absorbs vocational studies. This is typical of the school systems in France, Spain and Italy.
Model B, on the other hand, provides an explicit interface between the products of the educational system and access to employment. This non-academic interface apparently has a threefold function: provide a better understanding of job applicants' skills in relation to the indicators produced by
the educational system by explaining them in more suitable terms or, at least, in terms that are more readily understandable to employers;
attenuate or redirect the expectations of those seeking vocational placements among those with the same level of qualification;
reduce the tendency to continue in higher education; Germany and the United Kingdom in fact have far fewer university students than the Latin countries.
Model B is typical of Germany and the United Kingdom. In the case of the latter the interface comprises a multitude of institutions and training methods, while in the case of Germany it basically comprises the dual system, with an expanding range of internal differences.
10th CEIES Seminar – Education and Training Statistics 163

It is our theory that interfaces similar to model B are gradually developing in all our countries, even though - as in the countries typical of model B - with very different methods and degrees of institutionalisation. In other words, all the European countries are tending towards model B as a result of the need to devise mechanisms that allow the three functions to be performed.
These interfaces consist of every:a) "new" (?) method of acquiring skills outside school;b) "new" (?) method of identifying and recognising skills.
An initial attempt to chart these interfaces can be made by completing the cells of the table which relates their component parts (methods of acquiring and identifying skills) to their formal or informal nature. The formal or informal quality of training methods is related to the explicit and organised intention to provide training; in addition, with regard to methods of recognising skills, formalisation consists of certifying them in some way or other that is externally verifiable.
This is undoubtedly a simplified approach, but the priority here is to define the matter as a whole (the basic features of the interfaces) while ignoring for the time being the tremendous diversity it comprises.
Table 1 - Components of interfaces between educational system and enterprisesFormal Informal
Methods of acquiring skills A BMethods of identifying skills C D
A) Formal (non-academic) methods of acquiring skills:This heading has to include: The tremendous differentiation, among pupils belonging to the same class group in the explicit
initial training, that is introduced by parallel explicit training - which is increasing - with training goals or timetable adaptation between pupils and their parents. This type of explicit but extracurricular training, while it is often advertised by education centres as a service, can result in - what with supplementary lessons after school hours, courses in school holidays, etc - some 50% extra hours of training for some pupils in relation to others in the same class.
The amazing development of explicit ongoing training that has occurred in various guises in our countries. The institutional basis for the development of these "courses" varies tremendously (State, regions, enterprises, training bodies, etc), which means that recording and certification vary as well. The policies financed by the European Social Fund are not unconnected with this development.
Measures for the vocational placement of young people, which have also expanded greatly in recent decades.
Internally accepted standardised courses, organised by recognised public bodies (for example, the British Institute's English courses).
Courses organised through the Internet, and for which certificates are awarded, such as Microsoft courses.
Institutionalised alternating training programmes.
B) Informal methods of acquiring skills: Experience of "spontaneous" work by young people receiving initial school training,
widespread in some countries, that can provide an asset when differentiating young people with the same academic qualifications.
164 10th CEIES Seminar – Education and Training Statistics
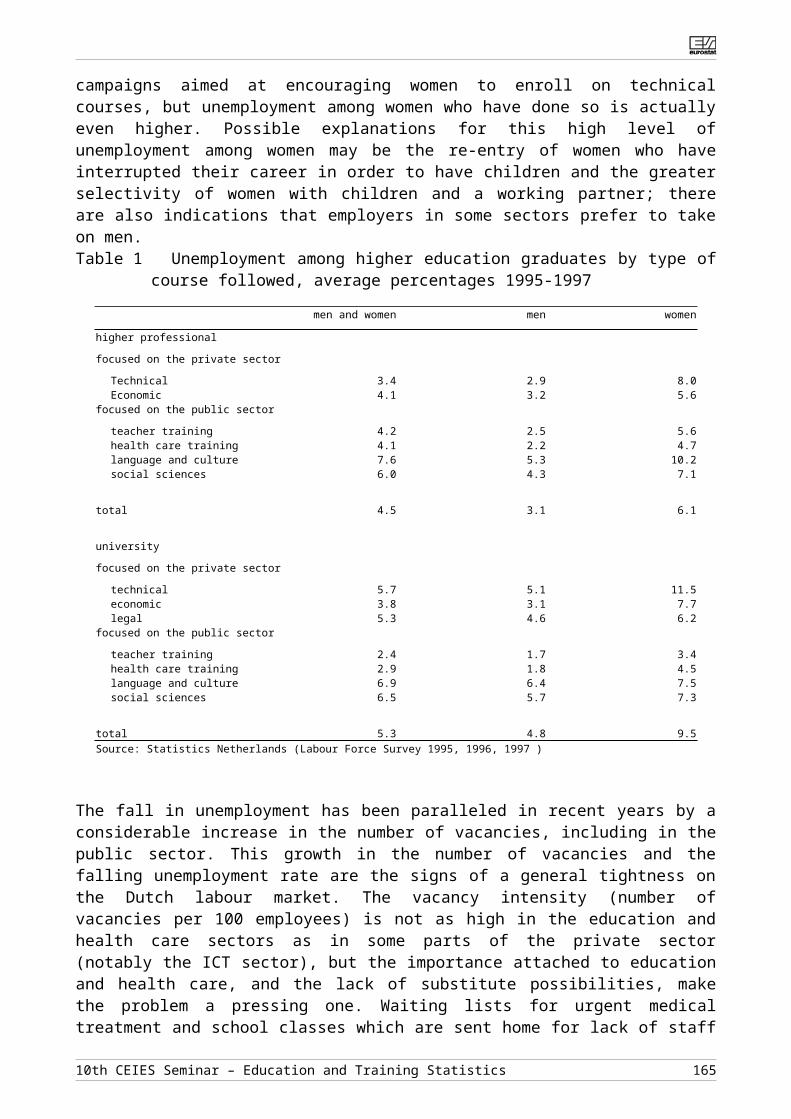
Work experience and its qualitative aspects, as a result of which seniority can be an advantage as well as a disadvantage (when earlier acquired skills are forgotten without anything taking their place).
Social accomplishments, such acquisition as personal or family experiences, which comprise the background and the ability to acquire other skills on a simpler cognitive or practical level.
"Cultural consumption", i.e. interest in what happens in certain cognitive or social areas. This refers to spontaneous ongoing learning or intellectual gymnastics, which keep the brain cells fit to access new knowledge that is required.
C) Formal methods of identifying skills: "Quasi diplomas"8, connected with explicit ongoing training schemes. Certificates issued by "government bodies" at the end of informal apprenticeship. Awarding of "virtual diplomas" by multinationals, which accredits universally recognised
acquisition of skills. This ranges from the British Council to Microsoft diplomas, through a variety of certificates that sometimes have a decisive sectoral value.
The "formal" role that certificates awarded by certain enterprises develop concerning recognition of skills. Such certificates are connected with traineeships or competence in certain technologies, "machines" or "emergencies".
The gradually formal role - externally "recognised" - of experience in enterprises that are at the forefront of their sector.
English examinations certified on the spot by Cambridge University (First Certificate, Proficiency).
D) Informal methods of recognising skills: The curriculum vitae, which has existed for a long time but which is changing, as it
increasingly contains information about hobbies and socially acquired values. It has become an indicator of skills background.
Staff recruitment agencies, with the range of assessment tools they have developed. Interviews attempting to identify the individual skills required for jobs or to distinguish
between applicants. Trial contracts, that allow the occupational skills of applicants to be identified in an informal
context by means of direct personal relations.
3. Institutionalisation of interfaces
As education expands and the work force becomes more mobile, is it likely that there will be a gradual institutionalisation of these interfaces (as in the United Kingdom) and that this process of institutionalisation will go beyond the occupational placement of young people to assume a "lifelong" aspect?
It is unlikely that it is simply by chance that is precisely in the United Kingdom where the need to devise and institutionalise - by means of centralised and standardised recognition - this interface has proved most "urgent". This vanguard role stems from the weakness of "qualifications" in relation to the universal classification of employees and potential employees and the polymorphic explosion of types of training in between the education system and employment which cannot be categorised using a standardised code. In this regard - see Bjørnåvold (1998) - the problem has some similarities with the monetary system and its need for legitimacy and transparency: how can you produce simple, standardised and legitimate information about the value of what you are trading in a context of new skill requirements?
8 Formal and explicit certification relating to formal and explicit non-academic training activities that are not part of the qualifications system of the education system.
10th CEIES Seminar – Education and Training Statistics 165

The problem is not so pressing, nor does it appear in quite the same way, in countries where the system is primarily based on "qualifications" (France and Spain), where they nevertheless retain a fundamental role in allocating jobs, responsibilities and salaries (F. Dauty, 2000). In highly organised education systems, the level of qualifications plays a central role in the ranking of jobs and salaries; it underlies the merit-based approach which is its justification. Nor is it an urgent matter in countries that have institutionalised an interface between the education system and enterprises.
But the problem persists - and will probably intensify in future - in the countries where the former model, based on qualifications, is becoming weaker. There is therefore a pressing need for reform. But should schemes à l’anglaise be envisaged (with centralised recognition capable of identifying skills regardless of how they are acquired) in order to forestall these needs?
In other words, the French and Spanish systems are beset by a kind of "qualifications inertia" as a solid and valid indicator allowing basic labour market decisions to be made. On the other hand, Germany has a dual system which, with a greater or lesser degree of success, covers this function. However, the British model has more urgent need for the development of institutions fulfilling this role, this occurring on the basis of skills (QCA/NVQ)9.
The "Latin" systems do not have the same urgency but raise a de facto question of the recognition of skills that are increasingly in institutional terms. What is the future for the former and the latter? Could the British model to some extent become the point of reference for the potential development of other national circumstances? In the strict sense, as an exported "model", the answer is probably not; but it undoubtedly represents a fundamental point of reference for future developments in countries sharing the same economic and social features.
Another topic of discussion that emerges concerns the accreditation of certificates for skills acquired outside the education system. There is a tendency to use the procedure of "ratifying" skills acquired outside the education system in the form of school certificates or "quasi-academic" certificates by means of certification and/or methods of ratification and/or certification.
Are there other methods of universal accreditation, apart from those approved by the education system, that can serve as a reference? Is it that new independent academic coordinates based on skills are emerging? Are there methods of assessment and accreditation than can provide an alternative to academic certification?
These are fundamental queries for understanding the possible processes of institutionalising the interfaces between education systems and enterprises.
4. How to cover interfaces in statistical terms
Tackling interfaces as a subject of study means dealing with two central questions that have already been mentioned: how are the skills not sanctioned by qualifications acquired, and what are the methods that allow employers to identify or recognise them?
9 The most recent proposals concerning graduates are evidence of this.
166 10th CEIES Seminar – Education and Training Statistics

A suitable methodology for this topic of study cannot ignore the fundamental features of skills.
a) Features of skills as a topic of study
Skills are vectoral. An individual's level of skill is the conjunction of sets of basic skills. The components of the individual vector are acquired in different ways. Some are acquired through explicit training, others by systems of implicit training (on-the-job training, learning by doing, etc), others through social interaction outside work, and some are innate (or acquired very early in the form of primary social skills). Lastly, some skills can be acquired in an alternative manner through a combination of these means. Studying the acquisition of skills involves looking at a wide variety of locations and routes. It involves the collecting of information from a very wide range of sources.
Skills are hard to measure on an ex-ante basis. Assessments are peculiar to each firm and, at the extreme, to each job. As a rule, a worker does not use the whole range of his individual skills in a job. Depending on the circumstances, he calls on some or other of his skills. There are no intrinsic (absolute) skills: useful skills depend on the functional circumstances of an occupation. There has to be separation of the "content" of skills and their a priori "indicator", which can provide only an approximate probability.
b) Limitation of available data
Vinokur (1995: 153) states that the theory of human capital conceals the function of certification inasmuch as it depends on perfect and unadulterated information about individuals with regard to labour supply and demand, and where the quality of the work is directly dependent on the cost of studying and, for a specific education technology, its duration. Viewed in this light, the prime indicator of an individuals' productive capacity has traditionally been the level of his qualifications.
However, there have been attempts to go beyond this indicator (as part of a research project funded by CEDEFOP - Mallet et al, 199710). But skills could be identified only by rudimentary proxy elements that were very weak in the face of the complex situation they were trying to describe: level of qualifications d for explicit training, age a for occupational experience. The limitations of these indicators are clear in the light of the considerations presented here. As the study of these phenomena progressed, the research in question also brought to light the current shortcomings of information systems concerning skills.
The acquisition of skills - and this is in line with its vectoral character - calls for the incorporation of methods that the quantitative approach tends to set aside. Simple variables need to be combined in order to construct multidimensional variables.
10 These studies are the direct antecedent of the EDEX project (TSER programme).
10th CEIES Seminar – Education and Training Statistics 167

In quantitative studies of interfaces between the education system and productive bodies, the difficulty arises from gaps in information as well as from the lack of connection between the information that is already available. When data are presented, the various methods are governed exclusively by their own "internal" rules. This means that employment statistics are based on employment policies, education statistics by education policies, and so on. If the use of the data for distinct purposes is not borne in mind, it is difficult to use them in conjunction with each other.
Conclusion: tautological effect of statistical information systems
Only observed phenomena can be handled in a transparent manner. The fact is that you can study only what it is possible to study; topics of study are determined by available data. Statistical information systems thus delimit the scope of observable phenomena. Outside this, the collection of data does not always comply with criteria that meet the needs of scientific analysis.
Indeed, in most cases, statistical information systems are devised in relation to major policy fields (education, employment, etc) and are separate from each other. This results in a tendency to tautology in analysing the implementation of policies by collecting only information about what is "expected" and what tends to confirm "what was expected". There is therefore a risk of being misinformed about the real impact of policies in their actual implementation.
There is a clear need for investment in research services in a dual sense: on the one hand, to promote synergies among existing information, since this would make it possible to devise indicators that were more consistent with the complex task of identifying skills; and on the other hand, to find new systems and tools for collecting information.
Social change precedes its quantitative assessment. Its study therefore requires changes in statistical information systems. Management of the changes we have covered will be more and more difficult if there are statistical gaps. Phenomena such as the development of interfaces between training and employment could thus fall into a "black box", where too much information obscures the overall picture.
Bibliography
Bjørnåvold, J. (1998): "¿Una cuestión de fe? Las metodologías y los sistemas para evaluar aprendizajes no formales requieren una base de legitimidad", Formación Profesional revista europea, No 12, pp. 76-83.
Buechtemann, C., Verdier, E. (1998): "Education and Training Regimes Macro-Institutional Evidence", Revue d'économie politique, No 108, pp. 292-320.
Dauty, F. (2000): "Diplômes et marché du travail: des liens qui évoluent", mimeo.
Kivinen, O., Ahola, S. (1999): "Higher education as a human risk capital", Higher Education, No 38, pp. 191-208.
Lichtenberger, Y. (1999): “Compétence, organisation du travail et confrontation sociale”, Formation emploi, No 67, pp. 93-107.
Mallet L. et al (1997): "Diplômes, compétence et marchés du travail en Europe", Revue Européenne de Formation Professionnelle, No 12.
168 10th CEIES Seminar – Education and Training Statistics

Marsden, D. (1994): "Mutation industrielle, compétence et marchés du travail", Formation Professionnelle Revue Européenne, No 1/1994, pp. 15-23.
Merle, V. (1997): “La evolución de los sistemas de validación y certificación. ¿Qué modelos son posibles y que desafíos afronta el país francés?”, Formación Profesional Revista Europea, No 12, pp. 39-52.
OECD (1996): Mesurer le capital humain. Vers une comptabilité du savoir acquis, Paris.
Planas, J., Giret, J.F., Sala, G., Vincens, J. (2000): Marché de la compétence et dynamiques d'ajustement, Cahier du Lirhe. An English version will be published by CEDEFOP in 2000.
Vinokur, A. (1995): "Réflexions sur l'économie du diplôme", Formation et emploi, No 52, pp. 151-183.
10th CEIES Seminar – Education and Training Statistics 169

THE USERS VIEW
Domenico PaparellaCESOSVia Po, 10200136 [email protected]
1. Introduction
This paper reviews an experimental use of statistical information to provide the social partners with useful intelligence.
The experiment to which I shall refer involved the development and testing of a system for surveying training needs in Italian industry.
The author of this paper took part in this experiment, which is still underway, as joint project manager.
The project was conducted by the National Bilateral Agency for Training set up by Confindustria (the main employers’ confederation) and CGIL, CISL and UIL (the major trade union confederations) and financed by the Ministry of Labour.
I propose, in this paper, to:a. review the purpose and outcome of experiments with bilateral bodies in Italy;b. present the project, from the point of view of its cultural foundations, its method
choices and its results;c. look at the statistical problems that arose during the conduct of the project;d. examine whether the experience gained from the project offers any teaching that
could improve the quality of the data supplied to the social partners;e. consider areas in which national and European social partners and statistical offices
could cooperate.
2. Bilateral experiments in Italy
A period of far-reaching innovation in the system of industrial relations led to the establishment of bilateral agencies for training resource management.
The result was a participatory approach to industrial relations that made it possible for the parties to take very politically significant action and to refocus attention on the issue of vocational training11. The institutional outcome of this action was the Treu law (196/97) which sets out a structure for the continuing training system in Italy.
Other significant results achieved during this period included the launch of the bilateral agencies for training resource management12. Their existence bears witness to a desire among the parties to 11 Cf Varesi Pier Antonio, “La formazione professionale negli accordi di concertazione” (Vocational training in
concertation agreements), Lavoro Informazione, No 8, April 1999.
12 Edited by Domenico Paparella, La risorsa formazione nella gestione bilaterale delle parti sociali (Training resources in bilateral management by the social partners), Rome, Chirone 2000, 1998.
170 10th CEIES Seminar – Education and Training Statistics

share objectives, purposes and instruments concerning some aspects of the employment relationship.
In this particular case, the parties were largely in agreement with the following cultural and political options: training is a basic trigger for innovation in the production and services system; training is indispensable if enterprises are to become more competitive; making the most of workers’ vocational abilities is essential if their employability, i.e. their
position on the labour market within and outside enterprises, is to be improved.
The bilateral agencies set up by the trades unions and employers were given various objectives. For instance, the social partners gave the bilateral agency for vocational training the task of promoting measures aimed at: improving training, guidance and retraining schemes, matching the training system to the requirements of businesses and workers, by, for instance,
promoting the drawing up of studies, proposals and innovative projects.The project on assessing the training needs of Italian industry, assigned to the Ministry of Labour's bilateral agency for training, falls into this framework.
3. The training needs survey project
3.1 Objectives of the project
The aim of this National Bilateral Agency for Training (Confindustria and CGIL-CIS-UIL) project, financed by the Ministries of Labour and Social Security, was to:formulate and test a process for surveying the demand for occupational skills, that could be continually updated and improved, in order to provide the training system with “useful intelligence” enabling the range and content of the training supply to be geared to the operating and development needs of the production system and the labour market, and paving the way for anticipation of needs by the training system.
10th CEIES Seminar – Education and Training Statistics 171

Figure 1
As can be seen, the overall surveying scheme was underpinned by two choices relating to the features of the information, i.e.:
- usefulness for the end user (the training system);- training policies (anticipation).
The first choice of field (usefulness) made it necessary to select information to be supplied to the training system as a function of its practical utility. In this respect, the social partners undertook to use an appropriate method of expression of the demand, in terms of content (aggregation of occupational profiles, descriptions, terminology)13 and reference time scale (long-term data and trends)14 .
The second choice of field (needs anticipation) involved, as mentioned above, social agreement which was not just the cornerstone but also the most critical element in the entire surveying process. It was necessary to decide how, and according to which criteria, to formulate the demand, in other words to set the rules of the game.
In this particular case15 it was decided that, in formulating the demand, it was necessary to pursue two objectives felt to be complementary by the social partners:
13 An attempt was made to avoid the three classical errors of communication: supplying information that is too generic (for instance, skilled worker), too specific (for instance, maintenance worker in milk packaging plants) or inappropriate because it relates to job classification levels (for instance, shift worker).
14 The information supplied to the training system does not have to do with short-term recruitment forecasts, but with structural variables likely to shape how local production systems operate and develop.
15 See Agreement of 20 January 1993 between CGIL-CISL-UIL and Confindustria.
172 10th CEIES Seminar – Education and Training Statistics
range
training supply
objective
content
useful intelligence
anticipation of needs

- supporting the competitiveness of the production systemand- improving the potential for employment of human resources, i.e. improving their position on
the labour market (within and outside enterprises).
Formulation was not, therefore, based on the shifting horizon of occupations, but on the horizon considered most promising in terms of competitiveness for enterprises and employability for workers.
It involved identifying an ideal scenario, abstracting it from the many possible scenarios or, in other words, carrying out a kind of “benchmarking” of development trends in occupational systems. In this respect, the different potential for innovation in the production world as a whole raised the most problems.
The problem lay more in the organisational than the technological variable. It is not always easy, when formulating the demand, to go beyond the functional division of work, and to find a fair balance and mediate correctly between reality and desired development16.
The two fields chosen (usefulness and anticipation of needs) helped to pinpoint what was to be surveyed, i.e. the information that the production system has to supply to the training system to make it possible to update:- the range of the supply, and therefore course planning;- contents, and therefore the design of training routes.
16 An example may shed light on this aspect. Cutting, sewing and pressing workers are generally three separate profiles in actual production work. From the point of view of their training, it is possible to envisage a single starting profile (cutting-sewing-pressing worker) and to delegate the task of teaching more specific techniques to alternance and on-the-job training systems. This would help to make enterprises more competitive (flexibility), and would assist workers because it would make them more employable. To what extent is it appropriate, however, to identify a single reference profile in a sector such as clothing in which (especially in larger firms) cutting, sewing and pressing departments are very separate?
10th CEIES Seminar – Education and Training Statistics 173

Figure 2
For the purposes of updating the range of the training supply, it was necessary to focus on the “virtuous dynamics” of occupational systems in the various production sectors: which profiles would need to be trained to promote their development?
In this respect, the surveying process had to deal with two conflicting pressures.
On the one hand, the need to re-organise the demand around an appropriate number of profiles, able to cover the entire spectrum of needs and having meaning throughout national territory17, identifying
17 An emerging need in terms both of the development of Italy’s production apparatus and the development of the training system.The boundaries within which enterprises actually work (relationship networks) are continuing to expand. Globalisation is a development that is also affecting smaller enterprises. This again raises the issues of multi-location enterprises, production decentralisation and the need to encourage a greater mobility of human resources throughout national territory.The undue proliferation of course titles does not reflect a very wide-ranging training supply but rather a confusion of language, making this supply less and less transparent, and does not enable the transfer of best practices or facilitate guidance for young people. This raises the need to formulate training standards and the problem of recognising and certifying training credits.
174 10th CEIES Seminar – Education and Training Statistics
identification trends
t r a i n i n g s u p p l y
RANGE
which profiles shouldbe trained?
CONTENTS
how should they be trained?
R e f e r e n c e p r o f i l e s
description

a register of reference profiles18 for each sector. On the other hand, the need to interpret local development approaches and vocations from the point of view of their actual scope, and therefore to survey – through regional surveys – trends in demand (if, where and to what extent they affect these reference profiles and what form they are taking in geographical contexts).
It was decided to centralise the process of identifying the reference profiles, delegating them to the National Industrial Federations (which appointed an employers’ representative and a trade union representative for each sector) and to decentralise the surveying of needs, delegating it to the Regional bilateral agencies (which appointed coordinators in each region).
As regards the updating of the content of the training supply, it was necessary to describe the profiles, again referring them to an ideal production process and a radius of action not lower than the national19.
In this case, the problem was one of formulating and testing a process and a method of description that was comparable for and agreed by all the sectors.
It was decided for this purpose to set up a joint bilateral workshop, composed of experts nominated by the social partners, in order to identify the description process and instruments and to involve the sectoral representatives 20 in the development and testing of the process and the instruments put forward by the workshop.
A dedicated information network was designed and set up to enable exchanges and dissemination of information between the bilateral agencies and to the outside world and to ensure comparable processing of the data at national and local level.
To summarise, the architecture of the surveying system makes the social partners responsible for managing the overall process, drawing on their specific skills.
18 Cf the reference profiles of Italian industry, edited by OBNF - Rome, November 1998. The term “reference profile” is an abstraction, i.e. an ideal profile, formulated by the social partners, that is in keeping with the operating and development needs of the sector in question, from a medium-term point of view.The 1993 agreement between the social partners specifies and offers guidance on the methods of this abstraction at two levels:-the needs of the working world: making “realistic” reference to the most promising occupational scenario from
the point of view of technological and organisational development;-the need for dialogue with the training system: avoiding providing the training system with information that it
cannot use because it is too generic, too specific or inappropriate.The reference profile is therefore the result of social agreement. A whole range of occupational profiles can be deduced from it.
19 During this stage of the research, several of the people involved noted the need to look beyond national borders and launch joint work by the social partners at a European level.
20 Experts for each product group appointed by the social partners.
10th CEIES Seminar – Education and Training Statistics 175

Figure 3
At national level, the national federations, via the sectoral representatives, and the bilateral workshop formulated and tested the instruments (register and description of reference profiles).
At local level, the bilateral agencies used instruments – comparable throughout national territory – to survey trends in demand (regional surveys) and interpret and manage the findings.
The project’s most significant results concerning the identification of reference profiles, local surveys on demand trends and the description of reference profiles, are presented on two levels:- the definition and development of methods agreed with the social partners, and- the results of field tests21.
21 At the time of drafting this report, the field tests were still in their final stage.
176 10th CEIES Seminar – Education and Training Statistics
i n f o r m a t i o n n e t w o r k
REGIONAL BILATERAL AGENCIES
(Coordinators)trends in demand
BILATERAL WORKSHOP(Experts from the social
partners)
description of reference profiles
NATIONAL FEDERATIONS(Sectoral representatives)
register of reference profiles
NATIONAL BILATERALAGENCY FOR TRAINING national survey of training
needs

3.2. The process of identifying reference profiles
Identification of production processes
16 sector research projects
Identification of ideal processes
16 sector seminars
1.a Hypothetical reference profiles
16 sector seminars
Hearing of businesses in the sector
16 sector seminars
Register of reference profiles for drawing up of questionnaires
16 sector seminars
Comparison/finalisation of results
2 inter-sectoral seminars
Drawing up of questionnairessummary of profiles
1 inter-sectoral seminar
Valuation of results of local surveys
16 sector seminars
10th CEIES Seminar – Education and Training Statistics 177

3.3. Reference profiles
An examination of the register of reference profiles for the 16 sectors produces the following table:
Total profiles Multi-sector profiles
Specific profiles
Hotels 18 2 16Construction 30 5 25Dairy products 29 27 1Pasta and bakery products
30 28 1
Basic chemicals 33 29 1Fine and special chemicals
31 31 0
Pharmaceuticals 32 29 3Graphics and printing 27 22 4Furniture 27 23 4Mechanical engineering 38 38 0Electronics 31 31 0Plant and equipment 37 37 0Transport 33 31 1Weaving 27 25 1Textile finishing 27 26 1Packaging 32 28 4
Setting aside the hotel and construction sectors, for the 14 other industrial sectors examined, there are not many specific profiles as such. It should also be noted that in many cases, the multi-sectoral nature of the profiles derives from the similarity of certain sectors (e.g. basic chemicals and fine chemicals; mechanical engineering and plant and equipment).However, above all we should not allow ourselves to be misled by the apparent transversality and specificity of the profiles.
Identical denominations may cover skills of different types, even though the technical element still applies. For instance, almost all the industrial sectors include among their reference profiles customer service/assistance skills, but the skills required by, for example, the weaving sector are quite different from those of the plant and equipment sector, despite the fact in both cases social skills are of great importance.Conversely, profiles which on the face of it are different may to a large extent overlap. For example, operators of mailing and printing systems (graphics and printing) and operators of mechanical production systems (furniture) are to a large extent comparable to operators of automated systems (mechanical engineering, plant and equipment, electronics, and transport).
3.4. Demand survey
On the basis of the sector identification results, the technological and organisational analyses of the sixteen production processes examined and the resulting, bilaterally validated, register of reference profiles, the eighteen regional bilateral agencies coordinated and directly managed surveys in their respective regions, in order to assess demand trends concerning the reference profiles contained in the register (place and level of interest) in relation to local production activities and business size.
178 10th CEIES Seminar – Education and Training Statistics

The survey was carried out using structured questionnaires, sent to a sample of businesses throughout the country22.
The respondents received the questionnaire by post and were helped to fill it in by an interviewer who contacted them by telephone.The regional bilateral agencies:- checked local statistical sources, identifying any differences between the businesses to be
sampled and bringing to light missing businesses;- finalised regional samples, business lists and respondents to be interviewed for the drawing up
of mailing lists.
3.5. The sample
The survey provided for the collection of data using a questionnaire sent to a sample of businesses.
To establish the sampling plan the following was determined. the total number of entities (the universe) from which the sample was to be taken; the data to be surveyed (observable data); the theoretically probable distribution of the data; the level of accuracy required; the number of samples necessary to ensure the desired level of accuracy.Apart from these criteria, it should be noted that: there was a specific survey for each sector; there was a specific survey for each region.
For these reasons and for institutional reasons, inherent to the responsibility for training which the Italian constitution assigns to the regions, the survey was broken down into sub-universes consisting of combinations of:
a) regions;b) sectors of economic activity.
The choice of the regional dimensions was based on the need to limit the survey and the institutional factors mentioned above.For operational reasons concerning the drawing up of the sampling lists, the sectors were defined on the basis of the current classification standard (Ateco91 or Nace rev.1). Size was defined by the number of employees shortly before the survey; the size therefore had to be recorded at the time the sampling list was drawn up. For survey purposes, the sample was broken down into three groups according to the number of employees:a) 20-49 employees, b) 50-249 employees, c) 250+ employees.The priority was to measure three attributes for each reference profile:x) current presence in businesses;
22 Excluding Trentino Alto-Adige.
10th CEIES Seminar – Education and Training Statistics 179

y) requirement trends;z) presence in the local labour market.The accuracy requirements of the sample plan were determined on the basis of these aspects. The number of samples was set at a level which would ensure a certain degree of accuracy in the establishment of specific profiles which would produce at least the same accuracy for transversal/multi-sectoral profiles.The samples were taken from exhaustive lists of businesses belonging to the sub-universes on which the survey was based23.
The ASIA register fulfilled the sampling requirements of the bilateral national agency survey.
Section 1 features of the business:- location- number of employees- staff breakdown- type of market- role of the respondent
Section 2 concerns information on24:- the family of products/services- characteristic activities.
Section 3 consists of a number of forms corresponding to the reference profiles identified for the sector25.Each form/profile comprises the following parts:
- the name of the profile (and possibly a brief description);- part 1, to record presence, consistency, recruitment area, and
possible use by the business of external resources;- part 2, to ascertain business requirement trends in the medium
and long terms;- part 3, to ascertain recruitment difficulties on the local labour
market;- part 4, to ascertain the ideal level of training provided by the
business for that profile.
4. Problems encountered
Throughout the project outlined above, two statistical problems had to be dealt with:
the availability of statistical information and its ability to satisfy the information needs of the social partners;
23 The “general” registers, whose accessibility is affected by the uncertainties collected with the new rules on data protection, include:i the ASIA file compiled by Istat in accordance with an EU Directive;ii the business register (Chamber of Commerce);iii the tax register (Ministry of Finance);iv the files of businesses with employees (Inps);v the INAIL business file.
24 The definition of the family of products/services and the activities characteristic of the generation/production process of the product/service (this variable can be used to calculate the business's degree of verticality) have, as we have seen, been discussed in particular depth at the sector seminars.
25 The section is preceded by instructions on completing the form, in which the objectives of the survey and the reasons for adopting the concept of reference profile are very briefly summarised.
180 10th CEIES Seminar – Education and Training Statistics

the problems of matching the register of reference profiles with the classification of professions (ISTAT).
Public statistics were used for all the stages of the process of testing the training needs survey model. The first stage involved the composition of the goods sectors to be observed.
The Ateco 91 code, used for the 1991 census, is used to classify the goods sectors in Italy.
The way in which these sectors are structured is in keeping with criteria of comparability with the production structure of other European countries.
The definition of the survey object, i.e. the composition of the sectors or production cycles to be analysed, entailed time-consuming research to pinpoint what production activities were involved in the production cycle.
The classification of production activities, as emerges from the statistical sources, does not correspond to the goods aggregates which the social partners used as a basis for observing occupations. In addition to the differing classification of the basic data, it was essential to identify accurately the statistical aggregates which make it possible to ascertain the composition of the production cycles observed.
However, an ad hoc aggregation was made of the production cycles to be analysed, with the aim of selecting the data base of the businesses making up the sector surveyed.
The national categories were used to identify 16 sectoral aggregates, on the basis of their size (number of employees) and/or their relevance for the development of the industrial system.
The identification of aggregates (determination of the sectors) took account of two functional requirements:- compliance with the objective of the survey (relevance of needs) taking due consideration of the
specific features of the production processes26;- compliance with the statistical data available in documentation (ATECO ’91 codes).
The following 16 sectors were chosen:- hotels- basic chemicals- fine and special chemicals- packaging- construction- electronics- pharmaceuticals- graphics and printing- dairy products- plant and machinery- mechanical engineering- furniture- textile finishing- pasta and bakery products- weaving
26 For the purposes of the survey, there was little reason to include the engineering sector, which involves a wide variety of production processes, ranging from those of the steel industry to the automobile and electronics industries.
10th CEIES Seminar – Education and Training Statistics 181

- construction of land vehicles
Recognition of the production processes was the crucial aspect of the activity cycle which was aimed at identifying the reference profiles of each production cycle surveyed.
On the basis of a general plan agreed in advance between all the sectors, the representatives, sometimes using experts appointed by them, carried out an initial identification concerning:- the scenarios (situations and market trends, current or likely technological/organisational
innovation);- the products (families of products/services and/or activity typology)- the production cycle (projection, production, maintenance and quality).
It is thus possible to assess the differences which emerged – for the sectors covered by the survey – between the classification of activities adopted by the statistical institutions and those which emerged from the analyses of the production cycles.
Apart from the problems concerning the criteria for the classification of production activities, the project brought to light the difficulty of obtaining data identifying businesses in such a way as to be able to determine definitely whether or not they belong to a particular section of the sample.
The “general” registers available in Italy are problematic regarding both their reliability and their accessibility.
All the registers in fact are affected by data protection rules. All this has lead to constant verification of whether a business actually belongs to the section of the sample to which it has been allocated, as regards both sector and size class.
Another question emerged concerning the possibility of structuring the sample by sub-region.
The project did not deal with the analyses at local level but at regional level.
This is a limitation of the project. The information which the production system was to exchange with the training system was on the need for professionalism at local level, the level at which it is possible to reduce the mis-match between demand for professionalism and the training on offer.
An agreement is needed at European level on the definition of the concept of local regarding the structure of production and the labour market.
On the basis of this idea, the national statistical systems should provide structured data by region. Alternatively, these data should be made available on a municipal basis so that it is possible to reconstruct the same areas which are to be surveyed again from time to time.
The other group of problems concerns the classification of occupations. The “official” approach to the problem consists of classifying all existing occupations in advance on a theoretical basis, identifying the criteria which make it possible to place each individual job in one class or another.
Traditionally, the most usual criterion has been the breakdown of occupations on the basis of study qualifications, which separates manual work from intellectual.
Other criteria often used in addition are those of qualification and the independence required to carry out the job, etc. On the basis of such criteria classifications as comprehensive as possible have been established. These are hierarchical systems which start at the top with broad professional categories and move down ultimately to the individual occupations. They have been drawn up
182 10th CEIES Seminar – Education and Training Statistics
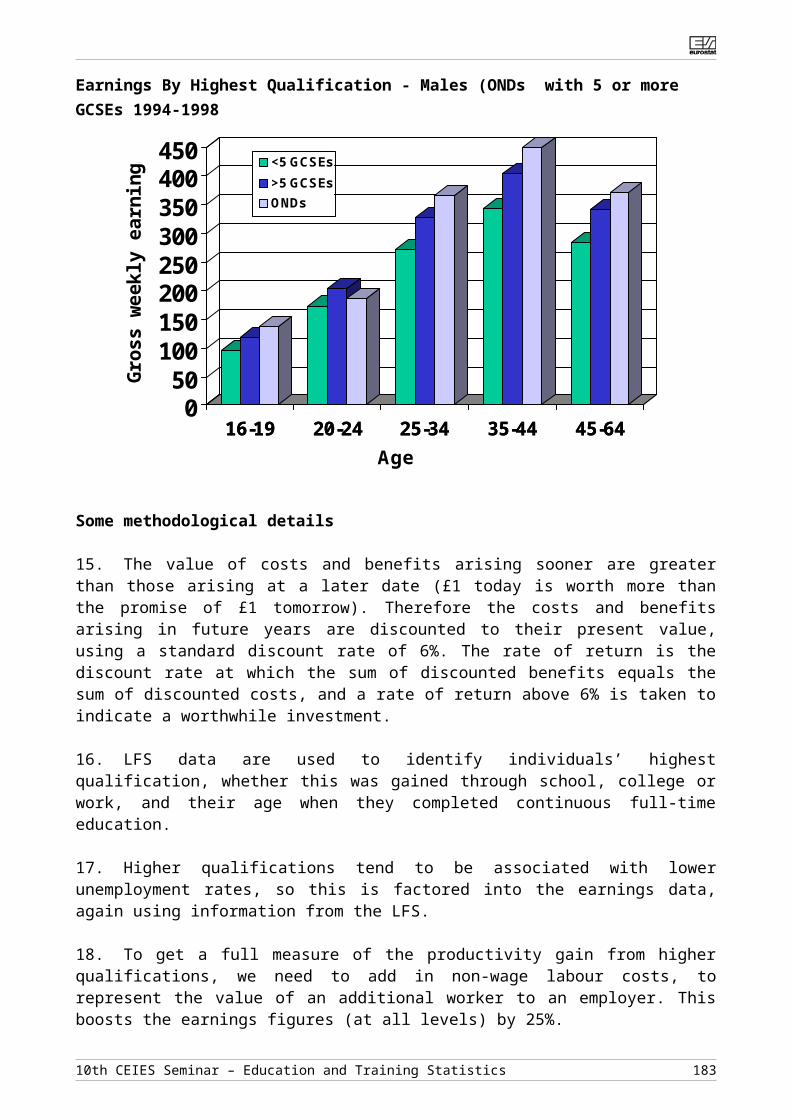
almost always for statistical purposes and have not always corresponded to the real situation, because they are rigid systems which are not able to take account of the constant changes occurring in the world of work.
In contrast, the Istat-91 classification differs substantially from previous ones. Following the fundamental economic changes in the 1980s and in anticipation of the technological changes of the 1990s, Istat warned of the need to make a fundamental change to its own classification of occupations, paying most attention to the Isco-88 classification. The main classification criterion is moved from the production sector to the level of training and/or academic qualifications. Occupations are divided into 9 categories, 35 groups, 599 basic occupations and 6 319 individual headings. The codes adopted consist of 4 digits.
In general it can be seen that the classifications proposed by Istat reduce the need to systematically turn data on occupations into a question purely of nomenclature. Furthermore, account should be taken of the fact that these classifications have been drawn up mainly for statistical purposes.
When the Ministry of Labour, for its part, drew up the classification of occupations, it mainly considered the occupations relevant to the implementation of the law governing employment, which was directed at employees and did not, therefore, cover certain existing occupations. Above all, for bureaucratic reasons concerning updating, emerging occupations (mainly in the field of computers) are not taken into account, while many occupations now obsolete are still included. The terminology is also obsolete. There are therefore problems of comparability with other systems, and with the terminology adopted for the qualifications resulting from vocational training courses.
The absence in Italy of a stable occupation identification system, capable of reflecting the changing situation and providing systematic information according to a constant typology, was the main reason why Isfol (Institute for the development of vocational training for workers) set up an occupation observatory. However, it is not within Isfol's remit to define a comprehensive, detailed system to classify and describe all existing occupations.
What the observatory essentially tried to do was to create a cognitive instrument which could serve as a useful support for the various types of training body and for labour policy in general.
The classification proposed by Isfol is contained in the Register of occupations, the latest version of which dates back to 1991. The Register is a useful instrument. The Isfol document is very often one of the main sources of basic information on occupational profiles used by career advisory services. However, since the Isfol classification does not have officially recognised legal status, it is not strictly speaking an official classification. The documents contained in the Register are considered more as a consolidation instrument than a comprehensive cataloguing system. The classification covers almost only those occupations which may be entered via a professional training course.
The reference profiles compiled in the training requirement survey are an initial attempt to standardise the language used in production and training systems.
The subsequent description of the profiles in terms of skills, which should make it possible to deal with problems concerning the certification of skills, could also be adopted at institutional level. In this case there would be a single classification validated by the social partners in accordance with the requirements of the training and educational system, the career and employment services and the statistical institutions, for the purposes of surveys on and the classification of occupations.
5. Lessons to be learned from the project
10th CEIES Seminar – Education and Training Statistics 183

The possibility of producing, through structured social dialogue, information of use to the educational and training system on the demand for professionalism arising from organisational, technological and market changes, depends on the availability of data and reliable information compiled using shared classifications.
The project brought to light the following needs:
to adapt the criteria for the classification of production activities so that clusters of activities can be defined which are organised by process and by product;
to make available, according to shared regional aggregates, the information on individual firms with which they can be classified according to sector of activity and size class;
to standardise the identification /description of "elementary occupations", which, even from the conceptual point of view, no longer correspond either to developments in the organisation of labour or to the education/training on offer.
6. Cooperation between the social partners and the national and European statistical institutions
The project revealed the need to identify areas where, through the extensive application of the principles of social dialogue, it is possible for interchange between the national statistical institutes and the social players.
At this level of permanent dialogue, it is possible to ascertain the information needs of the various systems.
For the survey of training requirements, apart from the social players, local bodies and educational and training establishments are also involved in the process of information production.At local level the statistical institutes may considerably help the bodies managing training resources to take decisions which match needs.
Moreover, it is to be hoped that the help of the statistical institutes can be extended beyond making basic data available for need assessment and include the performance of surveys actually in businesses. The statistical institutes certainly have a more solid basis in terms of methodology and experience in business surveys.
Discussions between the same players, at least on the survey of vocational and training requirements, should be set up at European level.
The professional requirements which training has to meet emerge in fact from these surveys.
The certification of skills depends on the description of individual professional profiles.In other words, the transparency of qualifications and their comparability at European level, necessary to guarantee free movement of workers, depends on the comparability of occupational definitions and the equivalence of their contents in terms of the skills each profile should be able to express.
The old European project of a single register of occupations never materialised.
184 10th CEIES Seminar – Education and Training Statistics

The situation which has emerged in many countries, with the participation of the social partners - albeit through differing procedures - in the definition of these problems, may make the objective more realistic.
Ceies and Cedefop could together set up a subject-based network linking all the European bodies dealing with these problems, in order to ascertain the possible scientific, methodological and technical directions in which the individual national systems could develop, with a view to harmonisation, which technology, the organisation of labour and the opening of the markets require.
10th CEIES Seminar – Education and Training Statistics 185

186 10th CEIES Seminar – Education and Training Statistics

2nd day:PART 3:
CONCLUSIONS AND RECOMMENDATIONS
10th CEIES Seminar – Education and Training Statistics 187

188 10th CEIES Seminar – Education and Training Statistics

USABLE EDUCATION AND TRAINING STATISTICS – IS IT POSSIBLE?
Ebbe K. GraversenDanish Institute for Studies in Research and Research PolicyFinlandsgade 4DK- 8200 Aarhus [email protected]
The functioning of the labour market is of interest in itself but from a policy point of view it is even more so. When the economy moves from the industrialised to the “new” knowledge based, it is important to know the national knowledge stock and the distribution among individuals. Tracking the flows of knowledge in the economy is the fundamental building stone for a fully understanding of the innovation potential in the economy. Hence, believing that knowledge creates growth by an increasing rate, cf. OECD (1996), means that ways to compare and measure knowledge using various indicators is becoming increasingly important.
From a researchers point of view, the present state regarding empirical data is not overwhelming. In theory, the researcher defines a problem, sets up a model, collects the empirical data and tests the theory. However, in reality, the researcher often tries to solve a model using the available information. A major problem in this process is the difficulties in finding data to describe the problem of interest precisely. A second best solution is often the compromise and outcome of the research process. Hence, the researchers may choose to focus on projects where data are available, and not necessarily on subjects with the largest community and policy interest.
From the political point of view, this is not the best way to follow. Research programmes with targeted objects has been one among many ways to deal with the spread between “free” and “wanted” research themes. Unfortunately, the researchers prefer the “free” and the political system the “wanted” kind of research. An obvious solution is to focus on long-term incentives in the choice of research themes.
At this point, the work of CEIES comes in. There are some needs present that has to be fulfilled or at least partly fulfilled on an international level. Among others these are the following: Comparable statistics across countries and regions in order to allow both a measuring and a
benchmarking of the measures. In order to increase the use, the data information has to be easy accessible and cheap to use. The statistics may be survey or register based but it has to be generally representative. The comparability aspect has to be secured once and for all by the national statistical bureaus and not by the single researcher in every project.
Development of common indicators usable for analyses of the functioning of the labour markets. The development has to be on a micro based level and for analytical purposes. The “old” macro level purpose is not suitable for defining indicators to analyse the “new” knowledge based economy. Suggestions have to come from the research environments but institutions like Eurostat has to collect the data in order to secure comparability.
Meaningful new indicators have to deal with formal as well as informal information on the education, training, knowledge and labour markets. Tacit knowledge has to be implemented in the indicators sooner or later. Formal education indicates ability, but such a measure is no more than a minimum measure. Fully individual specific comparable records are the way forward. Causality, selectivity and the amount of on-the-job training are then easier to determine as well as the burden of net cost of education and training
Data on individual levels has to be fairly recent. Even though structural models can be presented, the more descriptive analyses needs data from the present in order to be valuable for policy purposes. Construction of updated longitudinal data or second best, panel data, is
10th CEIES Seminar – Education and Training Statistics 189

preferable. However, the comparability aspect and the knowledge that it may be impossible for some countries, make this less likely. Instead, an extended CLFS or CIS database may very well be the way forward.
Delays in statistics create delays in actions to symptoms both in the short and long run. This is especially the case on the international level where comparisons are useable as benchmarks. For policy reasons the data collection has to be speeded up in the future. For the researchers, the quality of the data may be more important. Again this creates a trade-off that can be solved if the will is present. It is the story about descriptive on average “correct” statistics on an aggregated level versus testable models, which requires detailed “correct” individual level information.
It is interesting to see whether the CEIES seminar can bridge some of the divergence between the researchers wishes on data that can confirm theoretical models and the political systems wishes on data that can confirm the political needs for policy recommendations. In my eyes it will be a bridge between medium to long run research and short run needs. Such a bridging of research possibilities and community needs is one of the purposes of the Danish Institute for Studies in Research and Research Policy. Cooperation across countries is needed to map the common building stones in the bridging.
190 10th CEIES Seminar – Education and Training Statistics

SUMMING UP
Max van HerpenStatistics NetherlandsPrinses Beatrixlaan 428Postbox 40002270 JM [email protected]
The Seminar was organised by the CEIES subcommittee on Social Statistics and hosted by Cedefop. The vice-chairperson of the CEIES, Mr. Lamel, welcomed about 70 participants and the director of Cedefop, Mr. Van Rens, addressed the opening speech. Cedefop informs the education community of the different countries on systems and methods used in training. One of the instruments therefore is "The electronic training village". On this site of the internet there is an enormous amount of information available, among them vocational education and training databases, a monthly newsletter and a large number of discussion forums, with more than 10.000 participants. Mr. Van Rens stressed the importance of the subject of the seminar, on which Cedefop was working a long time already. In November the European Commission would publish a memorandum, which will contain a proposal to set up a system of reporting on life-long learning in Europe. In earlier studies Cedefop had already concluded that there was a lack of coherence of the available information in the different countries.
The seminar was organised in three parts:- Part 1: Current issues of education and training statistics;- Part 2: Future developments, both parts had a producers and users view; and- Part 3: Conclusions and recommendations, which was divided in three parts- reaction from Eurostat by Mr. Skaliotis;- roundtable chaired by Prof. Psacharopoulos;- summing up by the chairman of the organising committee Prof. Frey.
Part 1: Current issues of education and training statistics.
First Mr. Freysson presented an overview of the available data sources, which combine both education and labour market information. The most important of these is the Labour Force Survey. Others are the Community Household Panel, Structure of Earnings Survey, Labour Cost Survey, Continuing Vocational Training Survey, Vocational Education and Training data collection and Labour Market Policies data collection. The potential of the existing data sources encompasses a very large area of issues in which all kinds of relations between human capital characteristics, school to work transitions and education and training outcomes can be explored. Data quality, among which harmonisation of national surveys, are necessary conditions to make these data sources useful. Therefore much effort is put into this.
Pekka Myrskylä informed the audience on the graduation and transition to the labour market according to the register based statistical system in Finland. Population registers are linked to administrative records on incomes, jobs, unemployment, pensions, enterprises, education and place of graduation. Children are linked to their parents and vice versa, in a way that family members can be matched if they don't live in the same household. Register based statistics means lower costs, lower response burden, the annual availability of data for the total population and also for small areas and small subgroups, data quality is generally better. Longitudinal data are available so that transitions from school to work and changes in occupation are easily detectable. This makes it possible that in Finland on a continuing basis very recent information is available on all sorts of changes that are happening in the economy and the labour market and the implications for different graduates by type of study, field of training, age, sex and so on.
10th CEIES Seminar – Education and Training Statistics 191

Ronnie Andersson, Statistics Sweden, gave an overview on data available on transition from education to the labour market in Sweden. He stressed that administrative data are not cheap, because they have to be transformed to meaningful statistical data. Administrative data neither are a substitute for survey data. These two sources should supplement each other, because each would have its own strengths and weaknesses.
George Lemaître, OECD, presented a paper on training of adult workers in OECD countries, its measurement and analysis. A highly skilled workforce is of increasing importance in modern economy in which knowledge is a key issue. Learning continues through the working years and national skill development systems should be assessed in terms of how effectively they support the goal of life-long learning. Until recently little systematic information has been available, which would make international comparisons possible. Four "harmonised" surveys of training are used to assemble a set of "stylised" facts concerning international differences in the level and distribution of training for 24 OECD countries. The surveys differ in the degree of cross-country harmonisation that has been achieved. Considerable variation exists in the content of questionnaires and the protocols for the data collection, which make data incomparable. There is also difference in the way training is defined and measured in the surveys. Reference periods differ (training during last 4 weeks or 12 months), respondents (employers or employees), the distinction made between initial and continuing vocational training, the degree to which less structured forms of training as on-the-job training is included, populations (only employed, small enterprises and certain sectors are excluded). All this results in highly incomparable data. Participation rates within a country differ to a great extent; this is also the case for volume of training and costs. Correlations between these variables and background variables, as e.g. age or economic outcomes are less vulnerable. The analysis of the determinants and consequences of training is not yet sufficiently developed to provide policy makers with reliable estimates of the economic returns that would accrue to specific policy approaches. Further progress in the harmonisation of training statistics could make a useful contribution to filling that gap.
In the users forum Bernard Fourcade from the University of Toulouse presented a paper on educational expansion and skill-creation: the generation-based approach. The paper describes a project in progress in which the impact of the rising educational achievement levels on labour market dynamics are analysed on the basis of the generation approach for 5 European countries. The problem is tackled from two angles: the impact in terms of the output of education systems (qualification structure of generations) and in terms of changes within education systems (structural modifications of paths). The project looks at the very long-term aspects of changing education systems in which time, age and volumes of generations are important variables.
Mr. Marques from Portugal presented a paper describing the situation in Portugal concerning the education and training system, the labour market and the statistical system. Marques points out a number of problems: data are frequently dispersed, inaccessible and fragmented; they do not reveal any correspondence between the supply of vocational training and the needs of the business fabric; private, own-initiative training which is not co-financed is often confused with the work situation and therefore not easy to quantify; there is no information available indicating any impact which training can have on enterprises and on the participants' working live.
Arthur Schneeberger, Austria, talked about the problems he had when comparing the Austrian education system with other countries. He would like to see more diversification in the middle and higher segment of the International Standard Classification of Education (ISCED), which has been revised in 1997 and which is now in a stage of implementation. Of the Austrian population 70% is covered by ISCED 3 and in the higher education sector similar names are used for quite different elements in the different countries. The allocation of the national education systems to ISCED is
192 10th CEIES Seminar – Education and Training Statistics

politically very sensitive. He pleaded for a much finer elaborated categorisation, in which employers and policymakers should be involved.
Chris Littler gave a description of the methods and data used for the analysis of labour market outcomes from education and training in England. He concentrated in particular on the use of education and labour market data sources in understanding the labour market destinations of young people on leaving compulsory education; the analysis of long term economic benefits and value for money of education and training as proxied by lifetime earnings gains; and the use of data on flows into and out of unemployment as a means of evaluating the impact of labour market policy and programmes.
Part 2 Future developments
Aurea Micali from the National Statistical Institute of Italy presented the new system that ISTAT has developed for education and training. Significant innovations have been carried out in the Italian education system and by consequence, the administrative surveys are no longer carried out by ISTAT but by the ministries themselves, though ISTAT stays involved to provide statistical support. ISTAT has reviewed its program by which international data needs are better satisfied and better information about the selection process carried out by universities becomes available. There are however still some gaps in information, among these are employment after leaving school, life-long learning and private vocational training.
Jonny Einarsen and Helge Næsheim, Statistics Norway, informed about the statistical system that they were setting up on adult learning. They concluded that there is a lack of international recommendations concerning statistics on adult learning. Defining persons under 30 years of age as adult learners could be questioned. It increases measurement problems and costs and the need for training is to some extent of a different nature. Training data for this group should be presented separately. Robust and important indicators on adult training should be developed for the LFS. A more comprehensive collection of data should be done in separate surveys.
Roger Fox from Ireland presented a number of developments that are having an impact on the types of education and training statistics required. The most important is the fundamentally increased importance of human resources in economic development. However there is much to improve in the comparability of education and training statistics. International organisations should take a more interventionist role in dealing with countries supplying statistics. Outputs (the skills of the population) are more important than inputs (the amount of training received). Education statistics is very much input oriented. Non-formal or life skills or becoming more important in a flexible economy. Non-formal ways of learning (e.g. quality circles, job rotation) are increasing and relevant for output measures like life skills. These are difficult to cover in education statistics, however they should be paid attention to. Occupations are changing, they are subject to multi-skilling and new hybrid occupations are being formed. Labour markets are becoming more internationalised, this will consequently increase the need to measure flows of human capital for education and training statistics, brain drains between countries. Governments are more inclined to evaluate labour market programmes, therefore longer-term longitudinal data are of necessity.
Lex Herweijer from The Netherlands presented a study carried out on the match between the education system and the labour market in the Dutch public sector. The study obtained a picture of the surpluses and shortages of graduates trained for the public sector; it determined the match between the training followed and the career of these graduates; it identified factors which influence the decision to choose courses focused on careers in the public sector; and provided an insight into the perception of work and the attraction of careers in the public sector. Herweijer mentioned as problems the difficulty to get access to detailed data for researchers, there is little or
10th CEIES Seminar – Education and Training Statistics 193

no information available on subjective factors like motivation of choices, perceptions and evaluations of courses and occupations by students, job-satisfactions by workers; life-long learning is a blind spot.
Jordi Planas from Spain presented a paper on the interface between training and employment, how these are different and changing in the different countries, that there are very different methods of acquiring and recognising formal and informal skills, and that very much of this is not covered by statistics. Employment statistics are based on employment policies; education statistics are based on education policies. There is no connection between these two; as a result, data on this connection are very poor. Research is needed to combine the different already available data sources, but also to find new systems and tools for collecting information.
Mr. Paparella from Italy told about the training needs survey project that is still under way and aims at formulating and testing a process for surveying the demand for occupational skills, that could be continually updated and improved, in order to provide the training system with "useful intelligence" enabling the range and content of the training supply to be geared to the operating and development needs of the production system and the labour market, and paving the way for anticipation of needs by the training systems. The survey which is a permanent dialogue between social players, local bodies and educational and training establishments, makes it possible to ascertain the information needs of the various systems. The classifications on production activities, occupations and the information on individual firms need however to be updated.
Part 3 Conclusions and recommendations
Mr Skaliotis, Eurostat, concluded, that Eurostat was on the right track by creating a Task Force for the measurement of life-long learning. A conceptual framework had been set up in which all the relevant aspects of life-long learning, whether it can be measured or not, are included. The LFS and also the Household Panel survey give room for improvement. One of the things he had in mind is the setting up of an ad-hoc module in the LFS on life-long learning. Harmonisation of data is having a high priority, as also the timeliness of the data.
Prof. Psacharopoulos chaired the roundtable and tried to provoke the audience. Statistics should be much faster available, they should be most of all policy relevant and we should have fewer statistics in stead of more. He did not believe in the possibility of comparable data between countries, consistency within a country is important, so that developments are observable. He pleaded for data that made rigorous evaluation possible. Ms. Descy, Cedefop, doubted the possibility of measuring learning competencies. Mr. Lassnigg, Austria, found data on the transition from education to employment too superficial, other inquiries should be made; for the integration of administrative and survey data systems for acceptance should be set up, he advised to learn from new theories in knowledge management. Mr. Van Uitert from the Netherlands pleaded for more contacts between users and producers of statistics, both parties would profit from that. Mr. Graversen from Denmark made a distinction between rapid data being not very accurate and accurate data needed by the scientific community, for which timeliness was not an important issue. Mr. Drymoussis from the European Commission told that the Commission was preparing a yearly indicator report that monitors the training aspect of employment. Life-long learning was an issue that was very prominently present at the last Lisbon Summit. A more proper assessment and more thorough evaluation would be made after 2½ and 5 years.
Prof. Frey, chairman of the subcommittee, did the summing up of the seminar. In his view the system approach used in education and training statistics is important, but needs to be valorised. The Labour Force Survey is a central pillar in that system. A continuous programme of modules in the LFS is recommended. ISCED should be implemented, related to ISCO. A system of meta-data,
194 10th CEIES Seminar – Education and Training Statistics

in which the methods, definitions and classifications used are clearly described, is a necessity. The measuring of life-long learning along three dimensions: the learning grid, the knowledge grid and the social and economic background grid as proposed by Eurostat, is supported. Regional dis-aggregations and special groups (e.g. elderly, ethnic minorities) should be paid attention to. Finally, easier access for users and customisation of data is recommended.
Mr. Lamel, the vice-chairman of CEIES, thanked the participants and speakers for their contribution and Cedefop for putting their conference facilities at the Committee's disposal and closed the meeting.
10th CEIES Seminar – Education and Training Statistics 195

196 10th CEIES Seminar – Education and Training Statistics

List ofParticipants
10th CEIES Seminar – Education and Training Statistics 197

198 10th CEIES Seminar – Education and Training Statistics

LIST OF PARTICIPANTS
Eurostat Laurent FreyssonNicole LauwerijsJoseé NollenMichail Skaliotis
Cedefop P. DescyMarie Jeanne MaurageJ. van RensS. Stavrou
CEIES Margit Epler, Bundeskammer für Arbeiter und Angestellte – Statistische AbteilungLuigi Frey, CERESEllen Horneland, Norwegian Confederation of Trade UnionsJoachim Lamel, Bundessektion Industrie, Wirtschaftskammer ÖsterreichFernando Marques , Gabinete de Estudos da CGTP-IN.Henrik Bach Mortensen, Danish Employers' ConfederationIneke Stoop, Social and Cultural Planning Office
European Commission Ioannis Drymoussis, DG Employment and Social AffairsEttore Marchetti, DG Education and Culture
Austria Lorenz Lassnigg , Institute for Advanced StudiesArthur Schneeberger, Institute for Research on Qualification and Training of the Austrian Economy
Belgium Kris Degroote, Conseil Central de l’EconomieSigrid Dieu, FOREM
Czech Republic Jan Koucky, Ministry of EducationMiroslav Prochazka, Institute for Information on Education
Denmark Ebbe K. Graversen, The Danish Institute for Studies in Research and Research PolicyLars Borchsenius, Statistics Denmark
Estonia Katrin Jõgi, Estonian Ministry of Education
Finland Pekka Myrskyla, Statistics FinlandKaija Ruotsalainen, Statistics Finland
France Bernard Fourcade, Université des Sciences Sociales, LIHREG. Lemaitre, OECD
10th CEIES Seminar – Education and Training Statistics 199

Greece Georges Psacharopoulos, University of AthensDimitrios Kavakas, American College of ThessalonikiChristos Tzimos, National Statistical Service of GreeceProf Evangelia A. Varella, Aristotle Unviersity of ThessalonikiMrs Paraskevi Zigra , Ministry of National Education and Religious AffairsMichael Litsardakis, Univeristy of MacedoniaEleni Kechri, Ministry of National Education and Religious AffairsAnna Konstantinidou, Ministry of National Education and Religious AffairsJohn Georgiades, Marketing Intelligence Specialist
Ireland Roger Fox, Foras Áiseanna Saothair (Training and Employment Authority)
Italy Aurea Micali, ISTATDomenico Paparella, CESOSCristina Berliri, ISOFOLBarbara Buldo, Committee for the Guarantee of Statistical Information - Council of MinistersClaudio Franzosi, ISOFOLPaola Stocco, ISOFOLNatalija Zimina, uropean Training Foundation (National Observatory in Lithuania)Cesare Imbriani, stituto di Economia e Financza Roma “La Sapienza”
Madeira João José Silva Martins, Direcção Regional de Estatística
The Netherlands L. Herweijer, Social and Cultural Planning OfficeC.J. (Kees) van Uitert , Deputy director of ABUMax van Herpen, Statistics Netherlands
Norway Jonny Einarsen, Statistics Norway Helge Næsheim, Statistics Norway
Slovenia Suzana Gerzina, Centre for Vocational Education and Training, National Vet Observatory Dušanka Lužar, Human Resource Development FundSonja Pirher, Employment Service of SloveniaJadranka Tuš, Statistical Office of the Republic of Slovenia
Spain Jordi Planas, ICE-GRETTeresa Guardia , S.G. Estadísticas Sociales y LaboralesRosario Martin Herranz, Ministerio de Trabajo y Asuntos Sociales
200 10th CEIES Seminar – Education and Training Statistics

Sweden Ronnie Andersson, Statistics SwedenAnna-Karin Olsson, Statistics SwedenSven Sundin , National Agency for Education
Switzerland Anna Borkowsky , Swiss Federal Statistical Office
United Kingdom Chris Littler, DfEE, Analytical Services
10th CEIES Seminar – Education and Training Statistics 201