geron. - home page | california state water resources ... · cooling tower conclusions ... the...
TRANSCRIPT

GerOn.
April 1, 2011
Mr. Philip Isorena
Chief, NPDES Unit
State Water Resources Control Board
Division of Water Quality, 15th Floor
1001 I Street
Sacramento, CA 95814
GenOn West, L.P. 696 W. 10- St. P.O. Box 192 Pittsburg, CA 94565
Re: Mandalay Generating Station Implementation Plan for the Statewide Water Quality Control
Policy on the Use of Coastal and Estuarine Waters for Power Plant Cooling (Policy)
Dear Mr. Iso rena,
GenOn West, L.P. (GenOn) owns and operates the Mandalay Generating Station (OBGS), which is
subject to the Policy. Attached is GenOn's Implementation Plan for the MGS, submitted pursuant to
Section 3(A)(1) of the Policy and the November 30, 2010 letter from the State Water Resources Control
Board setting forth information requirements related to the Policy's requirement to submit
implementation plans.
Please contact me with any questions at (925) 427-3567 or [email protected].
Peter Landreth
Director, California Environmental Policy
GenOn West, L.P.
{00103357.1 \ 09-0098-1502}

MANDALAY GENERATING STATION IMPLEMENTATION PLAN FOR THE STATEWIDE WATER QUALITY CONTROL POLICY ON THE USE OF COASTAL
AND ESTUARINE WATERS FOR POWER PLANT COOLING
GenOn West, L.P.
April 1, 2011

i
Page TABLE OF CONTENTS
I. INTRODUCTION..............................................................................................................1
II. MGS FACILITY DESCRIPTION ...................................................................................1
III. TRACK 2: OPERATIONAL AND TECHNOLOGICAL MEASURES TO ACHIEVE 83.7% REDUCTION FROM DESIGN FLOW BASELINE LEVELS OF ENTRAINMENT AND IMPINGEMENT ......................................................................4
a. Existing Entrainment and Impingement Mortality Baseline Data ...................5
b. Track 2 Compliance Analysis ...............................................................................6
1. Flow Reduction Technologies and Operational Measures Analyzed .......7
i. Variable Frequency Drives ...........................................................7
ii. Circulating Water Pump Recirculation .......................................8
iii. Enforceable Operating Restrictions .............................................8
iv. Other Flow Reduction Technologies ............................................8
2. Screening and Other Technologies Analyzed ............................................9
i. Screening Technologies .................................................................9
ii. Filtration Through Natural Materials .......................................10
iii. Other Technologies ......................................................................10
c. Proposed Steps to Implement Track 2 ...............................................................10
1. Conduct Baseline Monitoring ..................................................................10
2. Conduct Effectiveness Studies ..................................................................11
i. Cylindrical Wedgewire Screens ..................................................11
ii. Variable Frequency Drives and Circulating Water Pump Recirculation ................................................................................12
iii. Enforceable Operating Restrictions ...........................................13
3. Review Data and Develop Final Compliance Proposal ...........................13
4. Design, Engineer and Permit Track 2 Compliance Measures ................13
ii
5. Construct and Implement Track 2 Measures...........................................14
6. Conduct Compliance Monitoring .............................................................14
d. Track 2 Compliance Implementation Timeline ................................................14
e. Market-Based Constraints ..................................................................................15
f. Track 2 Compliance Conclusion.........................................................................16
IV. TRACK 1: DEMONSTRATION OF INFEASIBILITY ..............................................17
a. Overview ...............................................................................................................17
b. Engineering and Technical Feasibility ...............................................................18
1. Siting ..........................................................................................................18
i. FWCT............................................................................................19
ii. SWCT ............................................................................................20
2. Critical Feasibility Factors .......................................................................20
i. FWCT............................................................................................21
ii. SWCT ............................................................................................23
c. Market-Based Constraints ..................................................................................25
d. Cooling Tower Conclusions ................................................................................25
V. COMPLIANCE WITH INTERIM REQUIREMENTS ..............................................26
a. Offshore Intake Screening ..................................................................................26
b. Curtailment of Intake Flows ...............................................................................26
c. Interim Mitigation ...............................................................................................27
1. Existing Mitigation Efforts .......................................................................27
2. Proposed Interim Mitigation ....................................................................28

List of Exhibits: • Summary of IM&E Studies at Mandalay Generating Station (Exhibit A) • Impingement Mortality and Entrainment Monitoring Plan (Exhibit B) • Alternative Flow Reduction Technology Evaluation (Exhibit C) • Screening and Other Aquatic Impact Reduction Technology Evaluation (Exhibit D) • Entrainment Estimates for GenOn Ormond Beach and Mandalay Generating Stations
(Exhibit E) • Discussion of Market and Contracting Factors Related to Investments in Compliance
Measures for the Once-Through Cooling Policy at GenOn's Mandalay, Ormond Beach & Pittsburg Generating Stations (Exhibit F)

1
I. INTRODUCTION
GenOn intends to comply with the State Water Resources Control Board’s (State Board) “Statewide Water Quality Control Policy on the Use of Coastal and Estuarine Waters for Power Plant Cooling” (Policy) at the Mandalay Generating Station (MGS) by the prescribed deadline of December 31, 2020, through implementing a combination of technological and operational measures under Track 2. GenOn has assessed the feasibility of complying with Track 1 based on currently available information and has concluded that compliance under Track 1 at MGS is not feasible, as that term is defined in the Policy. Several technological, logistical, environmental and permitting hurdles render cooling towers infeasible at the MGS.
Accordingly, GenOn proposes to comply with the Policy under Track 2 by (1) conducting baseline impingement mortality and entrainment studies that meet the requirements set forth in Sections 4(A)(1) and 4(B)(1) of the Policy; (2) achieving compliance with the Policy’s impingement mortality reduction standards by implementing technological and/or operational measures to reduce impingement mortality to a comparable level to that which would be achieved under Track 1, consistent with Section 2(A)(2)(a)(ii) of the Policy; (3) achieving compliance with the Policy’s entrainment reduction performance standard by implementing a combination of one or more technological and operational measures to reduce entrainment to a comparable level to that which would be achieved under Track 1, consistent with Section 2(A)(2)(b)(ii) of the Policy; and (4) monitoring the effectiveness of such measures consistent with Sections 4(A)(2) and 4(B)(2) of the Policy, as applicable.
As a threshold matter for the purposes of compliance under either Track 1 or Track 2, a fundamental hurdle to any major capital improvement project is the facility’s ability to fund the project. Without net revenue certainty, it would be infeasible to install significant capital improvements even if they were otherwise feasible from a technical, logistical and environmental perspective. This implementation plan addresses the market-based constraints that will be relevant to GenOn’s compliance with the Policy.
Section II of this Plan describes the MGS and specifically its once-through cooling operations. Section III sets forth the proposed method of compliance with Track 2, including a discussion of market-based constraints that would be associated with any major improvements at the MGS. Section IV demonstrates the infeasibility of complying with Track 1, including a consideration of critical technological and logistical factors. Finally, Section V documents GenOn’s proposed compliance with the interim requirements set forth in Section 2(C) of the Policy.
II. MGS FACILITY DESCRIPTION
The MGS occupies an approximately 57-acre parcel within a 205-acre industrial site, and is adjacent to McGrath State Beach to the north and Mandalay State Beach to the south. The Pacific Ocean is directly west of the site. An electrical substation and open areas are located east

2
of the site. The facility is approximately 3.5 miles northwest of the Channel Islands Harbor. The surrounding area is primarily characterized by agricultural and open space uses, and views in the area of the facility consist of broad, flat panoramas of dunes and agricultural fields, along with power line structures.
The MGS is an existing natural gas-fired steam electric generating facility located in the City of Oxnard, California, comprising three units: Units 1 and 2 are each 215MW steam electric generating units that utilize once-through cooling, and Unit 3 is a 130 MW simple-cycle combustion turbine unit.1
The MGS withdraws cooling water from the Channel Islands Harbor via the 2.5 mile, man-made Edison Canal. The Edison Canal was originally connected to Port Hueneme, located approximately 4.5 miles southeast of the MGS, but was cut off from the Port by the construction of the Harbor in 1965. The MGS cooling water intake structure includes the 2.5 mile portion of the Edison Canal that extends northward from Channel Islands Harbor at the West Channel Islands Boulevard overpass to the MGS.
The existing facility includes a 214-foot tall, red-and-white striped stack, and equipment ancillary to electrical generation. The MGS steam units are connected to an onsite 230KV substation, which is in turn connected to the electrical grid via two 220 kV transmission lines terminating at the Southern California Edison Santa Clara Substation in Ventura, California. The MGS is located south of Transmission Path 15 and south of Transmission Path 26.
2
The MGS discharges into the Pacific Ocean via a concrete- and rock-revetted structure at a point directly across the beach. Cooling water intake and wastewater discharges at the MGS are
The Edison Canal terminates at the MGS forebay, where the cooling water flows through two angled intake bays, each approximately 12 feet wide. Each bay is fitted with a pair of vertical slide screens 11.5 feet wide by 21 feet high with ½ inch mesh panels that are arranged parallel to each other. Screens are alternately removed from the water and cleaned with a high pressure spray to remove any debris or fish that have become impinged on the screen face. Downstream of each screened intake bay are two circulating water pumps (CWPs) rated at 44,000 gallons per minute (gpm) each; thus, when all four CWPs are operating, there is a total facility capacity of 176,000 gpm, or 253.4 million gallons per day (MGD). In addition to the CWPs, there is a single 3,200 gpm low capacity saltwater pump that provides bearing cooling water supply to the combustion turbine (Unit 3) cooling water heat exchanger whenever Unit 3 runs. This pump is also used to provide backup cooling to the steam unit bearing cooling water heat exchangers when the steam units are out of service; the pump typically runs 3 to 4 hours once or twice per day when utilized for this purpose. An emergency diesel powered firewater pump also draws supply water from the intake structure; although the engine is tested monthly, it is typically disengaged from the pump and no water is withdrawn during these tests.
1Unit 3 does not use once-through cooling and is therefore not subject to the Policy. 2See March 6, 2007 letter from Los Angeles Regional Water Quality Control Board to Robert Lawhn.

3
authorized under NPDES Permit No. CA0001180 (Los Angeles Regional Water Quality Control Board Order No. 01-057), which is currently pending renewal.
The units at MGS no longer operate as baseload generation resources and normally operate as capacity resources to serve critical grid support functions during periods of high electric load demand and transmission system emergencies. Consequently, in contrast to the 80%+ capacity factors anticipated for baseload units, recent capacity factors at this station are relatively low (Table II-1). The average composite capacity factor during the last five years was 9.4% for the MGS.
Table II-1: MGS Average Capacity Factors 2006-2010
Unit Number
Capacity Factor
2006 2007 2008 2009 2010
Five Year Average
Unit 1 8.5% 8.7% 12.1% 7.7% 1.3% 7.7%
Unit 2 9.9% 14.8% 19.4% 8.3% 2.8% 11.0%
Combined 9.2% 11.8% 15.8% 8.0% 2.1% 9.4%
The capacity factor data in the table above illustrate the overall utilization of the total MGS capacity, but to understand the operating profile of the MGS it is also important to note the variability in unit loads. The California Independent System Operator (CAISO) will often take advantage of the MGS’ low minimum operating level and its ramping capabilities and operate the MGS at minimum loads to meet existing and anticipated electrical reliability needs. Table II-2 shows that average loads have generally been well below maximum loads.
Table II-2: MGS 2006-10 Average Operating Profile
5 Year Average (2006-2010)
Power Output (MW) U1 U2
0 MW 79.5% 73.3%
> 10 MW 19.5% 25.2%

4
5 Year Average (2006-2010)
Power Output (MW) U1 U2
> 25 MW 13.4% 19.0%
> 50 MW 11.7% 14.5%
> 100 MW 7.0% 10.3%
> 150 MW 5.1% 7.5%
> 200 MW 2.0% 2.1%
Note: Units are rated at 215 MW Each The MGS is anticipated to operate at similarly low capacity rates and load levels into the foreseeable future.
III. TRACK 2: OPERATIONAL AND TECHNOLOGICAL MEASURES TO ACHIEVE 83.7% REDUCTION FROM DESIGN FLOW BASELINE LEVELS OF ENTRAINMENT AND IMPINGEMENT
GenOn proposes to comply with the Policy under the Track 2 provisions detailed in Section 2(A)(2) of the Policy no later than December 31, 2020. Based on preliminary evaluations of potential technological and operational measures and existing data, GenOn believes that the MGS can achieve compliance under Track 2 by the prescribed deadline of December 31, 2020. GenOn intends to meet the impingement standards detailed in Section 2(A)(2)(a) of the Policy by reducing impingement mortality by at least 83.7% from baseline levels (i.e. at least 90% of the reduction in impingement mortality required under Track 1) by implementing operational and/or technological measures (Section 2(A)(2)(a)(ii)). GenOn intends to comply with the entrainment standards specified in the Policy by implementing one or more control technologies in conjunction with reductions in circulating water flows to reduce entrainment from baseline levels by at least 83.7% pursuant to Section 2(A)(2)(b)(ii) (i.e., at least 90% of the reduction in entrainment required under Track 1). Based on preliminary evaluations, GenOn believes that a combination of flow reduction and screening technologies, such as variable frequency drives (VFDs), operating restrictions and cylindrical wedgewire screens, can effectively reduce impingement mortality and entrainment mortality to achieve compliance under Track 2.
The final design and capital cost of physical modifications necessary to achieve Track 2 compliance cannot be fully defined until the monitoring studies discussed below are complete. Additionally, any operating restrictions imposed as part of Track 2 compliance may reduce expected revenues, or increase uncertainty around net revenues available to pay interest and

5
principal or to recover GenOn’s investment. Section III(e) provides an overview of the market and contractual considerations relevant to GenOn’s assessment of additional investments in its generating stations. It is possible that revenues available from existing market structures and contracting mechanisms will be insufficient to support GenOn’s investment in a Track 2 compliance plan. As a result, GenOn cannot at this time commit to such investment until estimated costs and operating restrictions can be estimated, and GenOn is able to reasonably forecast the impact of the MGS Track 2 compliance plan on the adequacy of net revenues. GenOn will continue to evaluate these market-based constraints through the implementation process described below.
a. Existing Entrainment and Impingement Mortality Baseline Data
Section 4 of the Policy requires baseline impingement and entrainment studies unless prior studies accurately reflect current levels of entrainment and impingement. GenOn does not believe that studies that have been conducted at the MGS in the past accurately reflect current impacts or meet the requirements of Section 4. Accordingly, GenOn proposes to conduct new baseline monitoring studies, as discussed in more detail below. This subsection provides a description of the existing data.
Baseline impingement monitoring was first conducted at MGS in 1978 through 1980 as part of the original 316(b) compliance demonstration. Those data are outdated and do not reflect the existing conditions in the source water or the current operational profile of the MGS. NPDES Permit-related impingement monitoring was initiated in 2001. Additional impingement monitoring and the first entrainment monitoring studies were conducted in response to publication of the 2004 draft 316(b) Phase II rule from January 2006 through January 2007. The results of these monitoring studies and analysis are summarized in Exhibit A.
Existing impingement data are insufficient to provide an accurate and reliable extrapolation of an annual baseline impingement rate for the purposes of Section 4 of the Policy. While impingement data collected at MGS during 2006-07 monitoring included 24 sampling days and 96 sampling points, providing one sufficient year of data, data is much more limited for other years, as historic NPDES sampling was limited due to the scheduling of sampling around the operations of the plant. The low number of impingement sampling events from 2001-2005 resulted in a highly variable range of impingement estimates during that period. It is difficult to accurately extrapolate from such a limited data set, as the rate at which organisms are impinged is dependent upon many factors in addition to plant flow. To obtain an accurate estimate, several robust sampling years like 2006-2007 would be required, with a large number of samples collected regularly and covering numerous operational and environmental conditions over all seasons.
Similarly, entrainment data is limited to a single year of sampling (2006-2007), and GenOn’s biological consultant, Tenera, has questioned whether the data is representative of the actual

6
concentrations of organisms in the source water used by the plant for cooling. As discussed in Exhibit A, prepared by Tenera, while the taxa represented in the entrainment data appear reasonable and representative of expected conditions in the vicinity of the MGS, the relative concentrations of each taxon, seasonal abundance and seasonal variation, were substantially lower in total quantities than comparable data sets in the same coastal region based on Tenera’s experience.
Therefore, GenOn proposes to conduct a three-year impingement and entrainment monitoring program at MGS to meet the requirements of the Policy and ensure that a robust set of baseline information is available to support further analysis. GenOn’s consultant Tenera has prepared proposed impingement and entrainment monitoring plans, attached as Exhibit B for the State Board’s review and approval.
b. Track 2 Compliance Analysis
GenOn has conducted preliminary analysis of various currently known operational and technological measures designed to either reduce the volume of water being pumped through the cooling system or reduce rates of entrainment and/or impingement. The MGS appears to be well suited to Track 2 compliance as a review of the MGS operational data shows there are opportunities to reduce its circulating water flow and rate. Analysis of pump operating information during the last five years yields the following circulating water flows as a percentage of the annual design circulating water flow for the station (Table III-1). Average composite annual circulating water flows as a percentage of annual design flow during the last five years was 34.2% for the MGS. While these percentages are well below design flows, they are significantly higher than corresponding capacity factors, indicating an opportunity to achieve reductions in entrainment and impingement by reducing flows to more closely match capacity factors and utilizing technologies to further improve reduction rates.
Table III-1: MGS Average Cooling Water Flows as Percentage of Annual Design Flow 2006-2010
Unit
Number Actual Annual Circulating Water Flow as Percentage of Annual Design
Circulating Water Flow
2006 2007 2008 2009 2010 Five Year Average
Unit 1 31.3% 28.2% 36.4% 42.5% 14.5% 30.6%
Unit 2 29.5% 42.3% 55.8% 41.7% 19.7% 37.8%
Combined 30.4% 35.3% 46.1% 42.1% 17.1% 34.2%

7
Based on this preliminary assessment, flow reduction measures such as VFDs appear to be extremely beneficial in reducing both impingement and entrainment and could achieve a significant percentage of the total 83.7% minimum reduction required under Track 2. Screening technologies, particularly cylindrical wedgewire screens, appear to be effective at complementing flow reduction technologies. Accordingly, GenOn’s preliminary conclusion is that a combination of flow reduction and screening technologies can be employed to achieve compliance under Track 2. Additional flow reduction measures, such as operating restrictions, will also be assessed. The assessment of these measures will be informed by baseline monitoring, pilot studies, and effectiveness studies as discussed below.
It is important to note that this assessment reflects currently available technologies and information. GenOn anticipates that technologies with the potential to reduce entrainment and/or impingement will continue to develop and evolve, especially as the national regulation of once-through cooling moves forward. The proposed revisions to the federal 316(b) Phase II Rule were published on March 28, 2011, with the final rule scheduled to be issued in July 2012, and GenOn anticipates that this regulatory driver will result in vendors pursuing new or improved technologies that can provide compliance benefits to owners of existing once-through cooled facilities. Accordingly, within the timeframes set forth in the Section III(d) of this Implementing Plan, the final compliance technology may evolve as technology develops.
The measures that were considered are generally summarized below.
1. Flow Reduction Technologies and Operational Measures Analyzed
The various flow reduction technologies and operational measures described below all effectively reduce intake flows. As entrainment and, to a large extent, impingement are directly proportional to intake flows, reductions in aquatic impacts attributable to such flow-based measures can be readily quantified and verified. GenOn believes that flow reduction measures will be an essential and integral component of Track 2 compliance given the logical and proven effectiveness of reducing aquatic impacts by reducing cooling water volumes.
i. Variable Frequency Drives
VFDs will allow GenOn to reduce the speed of the MGS CWPs to more closely match the minimum flow requirements for acceptable cooling and backpressure on the steam turbine generators. VFDs provide little value from an impingement or entrainment perspective when a unit is operating at or near full load, when full circulating water flow is required to support operation. VFDs can be very effective at minimizing entrainment and impingement at facilities operating at less than full load, as is the case at the MGS (see Table II-2).3
3As explained in Section III(e) and Exhibit F, the CAISO relies on the availability and capability of these units to operate at full load to assure reliable operation of the electric grid.
Based on a conceptual VFD design, GenOn estimated the impact on total circulating water flow

8
requirements if the units at the MGS had been equipped with VFDs and the units operated in the same manner they actually did in each of the years between 2006 and 2009. Based on this analysis, GenOn estimates that VFDs would have allowed the MGS to operate in the same manner it actually did while at the same time reducing flows to 35% to 40% of actual levels (which as noted above were already well below design flows), thereby achieving significant further reductions in entrainment and impingement mortality. VFDs were selected as a Track 2 compliance measure to be evaluated for final implementation, consistent with the process set forth below in Section III(c).
ii. Circulating Water Pump Recirculation
This flow-control measure involves modifying the discharge piping of each CWP to add a recirculation control valve. Under this CWP Recirculation technology, valve position is modulated as required to control flow through the unit condenser to maintain optimal steam turbine backpressure. This minimizes circulating water flow through the condenser, and the balance of the water is returned to the intake structure forebay through the recirculation valve. This in turn effectively reduces the amount of makeup water entering the intake structure, reducing makeup water flow requirements and associated entrainment and impingement levels. CWP Recirculation is easier to implement than VFDs, but has higher net operating costs. GenOn will evaluate CWP Recirculation as a potential Track 2 compliance measure as part of the process set forth below in Section III(c).
iii. Enforceable Operating Restrictions
As noted in Section II above, capacity factors at the MGS units in recent years have steadily decreased to between 1% and 20% of full load output, and associated circulating water flows have decreased to between 14% and 55% of baseline design flows. GenOn expects that capacity factors will remain well below design capacity for the foreseeable future. As a result, GenOn believes that committing to operating restrictions for the MGS, in conjunction with other measures, could be a practical mechanism that could be implemented to meet the Track 2 performance standard. Operating restrictions could include restrictions on operating hours, loads and/or flows, and such restrictions could be in annual, seasonal and/or diurnal terms. GenOn will evaluate enforceable operating restrictions as part of the process set forth below in Section III(c).
iv. Other Flow Reduction Technologies
Other variations on reduced speed pumps or CWP Recirculation are further described in Exhibit C. These alternatives qualitatively appear to be inferior to VFDs or the CWP Recirculation measures described above, and therefore are not considered potential Track 2 measures at this time.

9
2. Screening and Other Technologies Analyzed
GenOn commissioned a qualitative assessment to identify technologies that potentially could be implemented as compliance measures under Track 2. Various technological measures evaluated that could achieve a reduction in entrainment and/or impingement are described in Exhibit D. These technologies are summarized by category below.
i. Screening Technologies
There are a number of different technologies that fit into this category, generally either (1) fixed-screen technologies or (2) variations on traveling screens. Based on a preliminary evaluation, GenOn believes fixed-screen technologies hold the most promise for Track 2 compliance at the MGS. GenOn intends to focus specifically on evaluating cylindrical wedgewire screens. A preliminary evaluation of cylindrical wedgewire screens, discussed in more detail below, indicates that substantial reductions could be achieved in entrainment, while also reducing approach velocities to a level sufficient to significantly reduce impingement mortality. Other fixed-screen technologies that were evaluated (see Exhibit D), but eliminated from further consideration at this time include the following:
• Stationary Angled Flat Panel Screens, Eicher Screens, or Modular Inclined Screens will not be considered further as they would be difficult to retrofit into the existing intake structure and would not appear to provide a significant advantage over cylindrical wedgewire screens;
• Aquatic Filter Barriers will not be considered further as this technology is still experimental in nature, and existing installations have faced serious biofouling and overtopping problems;
• Seasonal Barrier Nets and Screens will not be considered further because there is no proven experience with net or mesh sizes sufficient to reduce entrainment; and
• Filtrex Filter Screens and Other Media Filters will not be considered further as they require media that can become clogged, and are not appropriate for the volumes of water used at the MGS.
With respect to variations on traveling screens, retrofitting such technologies into the existing intake structure at MGS would be difficult as they would require a total redesign and reconfiguration of the intake system. They also require fish return systems that would pose significant logistical challenges given the location of the intake structure at the end of the narrow, 2.5 mile long Edison Canal. In addition, there are a number of components in these technologies that will substantively impact plant operation and maintenance (O&M) costs,

10
without providing an appreciable advantage over less complex and costly fixed-screen technologies.
ii. Filtration Through Natural Materials
These technologies utilize natural materials, such as rocks constructed in a dike, or the seafloor itself, to filter organisms out of intake water and are described further in Exhibit D. These technologies are not being considered further due to unproven entrainment reduction performance and the physical size requirements of the technology in order to deliver the required quantity of cooling water.
iii. Other Technologies
This category includes other miscellaneous technologies that do not readily fit into the previous three categories. These technologies are described further in Exhibit D and were eliminated from further consideration at this time for the reasons discussed below.
• Louver Systems and Behavioral Barriers will not be considered further as currently available forms of these technologies have little or no proven value in reducing entrainment; and
• Relocation of Intake Structure (i.e., moving the MGS intake offshore) is not being considered due to the unlikelihood of obtaining the numerous federal, state and local permits that would be required, the numerous environmental impacts that would be associated with the relocation, and the uncertain entrainment and/or impingement benefit that would actually result from the relocation.
c. Proposed Steps to Implement Track 2
Based on the preliminary evaluation summarized above, GenOn is confident that the MGS can achieve compliance with the Policy under Track 2 by implementing a combination of technological and operational measures to meet the entrainment and impingement performance standards. A discussion of implementation steps follows.
1. Conduct Baseline Monitoring
As noted in Section III(a), to meet the terms of the Policy and establish a reliable baseline, GenOn is proposing to conduct a three-year monitoring study in compliance with Sections 4(A)(1) and 4(B)(1) of the Policy prior to finalizing and implementing its compliance strategy. The monitoring proposal received by GenOn from Tenera is included as Exhibit B. GenOn would initiate monitoring activities following State Board approval of the proposed monitoring plans.

11
2. Conduct Effectiveness Studies
During the same three-year period in which the baseline monitoring will be conducted, GenOn will fund and complete the pilot studies discussed below. Specifically, GenOn will assess cylindrical wedgewire screens to determine their suitability for application at the MGS, and GenOn will also evaluate flow-reduction technologies and operational measures.
i. Cylindrical Wedgewire Screens
GenOn considers cylindrical wedgewire screens to be the most promising entrainment and impingement reduction technology based on currently available information. The three-year monitoring program described above will be necessary to meet the requirements of Section 4 of the Policy and to develop an accurate entrainment baseline for Track 2 compliance. For discussion purposes, GenOn evaluated existing entrainment data, which suggest that wedgewire screens with a 2mm slot size could reduce entrainment in MGS intake water, while also reducing through-screen velocities to less than 0.5 fps in compliance with the impingement mortality performance standard in the Policy. GenOn commissioned URS to develop a conceptual design configuration for 2mm cylindrical wedgewire screens to inform GenOn’s ongoing evaluation of Track 2 technologies.
At the MGS, the conceptual arrangement would require a cofferdam to be installed in front of the existing intake structure. A total of five 7.0’ diameter, 24.5’ long wedgewire screens would be installed in front of the cofferdam to accommodate the full design flow of 176,000 gpm for both units. A logistical challenge at MGS that GenOn will evaluate going forward is the need to provide for a sweeping flow to divert fish and larvae that have been prevented from being entrained by the wedgewire screens away from the screens. To address this challenge, GenOn intends to evaluate two alternatives to provide the requisite sweeping function: (1) a Flow Velocity Enhancement System or similar technology to direct such organisms to a fish bypass, which could either be routed further up the Edison Canal, or routed to the Pacific Ocean; or (2) locating the cofferdam and screen assembly at the head of the Edison Canal where it meets Channel Islands Harbor, and allow natural harbor currents to provide the necessary sweeping flow. These approaches could also potentially be combined, which GenOn will also evaluate.
URS’ analysis demonstrates that cylindrical wedgewire screens would be conceptually feasible at MGS, but further site-specific evaluation and pilot studies, as well as analysis of the monitoring data to be collected during the three-year monitoring program, would be necessary to determine the optimal screen configuration.
Selecting the proper screen size to achieve reductions in entrainment while minimizing and mitigating fouling, excessive pressure drop, and other undesirable effects, is critical to designing and implementing an effective system. GenOn intends to co-fund a Pilot Study program jointly proposed by MBC Applied Environmental Sciences and Tenera Environmental that will examine

12
issues associated with utilization of specific entrainment and reduction technologies to comply with the Policy. Specific tasks that will support potential application of cylindrical wedgewire screens include (i) specific field tests to evaluate the effectiveness of 0.5mm, 1.0mm, and 2.0mm slot size wedgewire screens in reducing entrainment, (ii) measurement of length and head capsule dimensions of larval fish for different taxa collected from California entrainment studies, (iii) determination of larval fish shrinkage correction factors, (iv) hydrodynamic studies on wedgewire screen intake designs, and (v) assessment of the potential release of copper from the metal alloy used by the manufacturers of the screens. Based on the results of these initial studies, GenOn anticipates commissioning additional site-specific studies to optimize the design of specific screening installations at the MGS, particularly with respect to screen-slot sizing.
Additional investigations at the MGS will include analysis to determine whether greater reductions in entrainment and/or impingement could be achieved by installing screens near the existing concrete intake structure, or alternatively installing them at the head of the Edison Canal. These studies would also address the conceptual development of any required screen sweeping flow or fish return provisions.
ii. Variable Frequency Drives and Circulating Water Pump Recirculation
VFDs and CWP Recirculation are two alternative flow-reduction technologies that could be employed at MGS. GenOn has conducted a preliminary conceptual assessment of VFDs, described below, and will conduct further evaluation of both technologies.
A precise estimation of the performance of potential flow-control technologies measures depends on an accurate entrainment and impingement mortality baseline. Using the limited one-year data set available, however, GenOn commissioned Tenera to estimate reductions in impingement and entrainment that would have occurred from baseline levels during the years 2006 through 2009 with the application of VFDs, assuming impingement and entrainment concentrations and frequency variations match those determined during monitoring conducted from February 2006 through January 2007. This study, attached as Exhibit E, indicates that individual species entrainment reductions during this four year period would have varied from a low of 82.3% to a high of 98.7%, with a total fish larvae reduction ranging between 86.6% and 92.1%, and a four year average reduction of 89.5%. These calculated reductions compare favorably with the required reduction of 83.7% from preliminary baseline entrainment values.
GenOn’s preliminary technology evaluation indicates that VFDs or CWP Recirculation would be conceptually feasible at the MGS, and Tenera’s preliminary assessment of VFDs suggests that VFDs in particular would be effective at reducing entrainment. A thorough review of the data to be collected during the proposed three-year monitoring program will be essential to informing the ultimate evaluation of whether either of these measures could contribute to achieving the performance standards in the Policy. Follow-up activities that GenOn will conduct in parallel to

13
the monitoring program to more specifically evaluate these alternatives and inform GenOn’s ultimate Track 2 compliance proposal include an assessment of design feasibility, permitting issues, estimated capital costs, and estimated O&M costs.
iii. Enforceable Operating Restrictions
As noted previously, capacity utilization factors at MGS have been consistently well below those of baseloaded facilities. By committing to operating restrictions, GenOn could ensure that the cooling water intake flows are limited and achieve the required reduction from design flows for the purposes of Track 2 compliance. A determination of the kinds of operating restrictions that would be the most environmentally beneficial will depend heavily on the three-year monitoring study. For example, if monitoring data indicates that entrainable species in the vicinity of the MGS intake are more abundant at night, then nighttime operating restrictions, if feasible, would be a logical control measure. GenOn will need to conduct a detailed assessment of operations alongside the forthcoming entrainment and impingement data to identify optimal operating restrictions and determine whether such restrictions can be implemented without significantly reducing revenues and while continuing to enable the MGS to meet electrical grid reliability needs.
3. Review Data and Develop Final Compliance Proposal
Following the completion of the monitoring program, GenOn will submit a final monitoring report to the State Board for approval, to confirm that GenOn has obtained accurate entrainment and impingement mortality baselines meeting the requirements of Section 4 of the Policy. GenOn anticipates engaging consultants to analyze the monitoring data and compare them to the results of the pilot studies and other conceptual studies of operational and technological measures to develop a final compliance proposal. GenOn anticipates that the State Board’s review of the data, and GenOn’s internal evaluation of the data and Track 2 compliance measures, will take approximately 1 year. GenOn will then submit a final Track 2 compliance proposal to the State Board for approval.
4. Design, Engineer and Permit Track 2 Compliance Measures
Following the final determination of a Track 2 compliance proposal and the State Board’s approval, GenOn will proceed with designing, engineering, and permitting the Track 2 compliance measures. The complexity of the design, engineering and permitting process will vary depending on the specific details of the selected compliance measures, but GenOn estimates that this phase will take approximately two years. GenOn anticipates that various permits would be required from the City of Oxnard for most potential Track 2 measures. Depending on the nature and extent of work required in waters of the United States, additional approvals could be required from the U.S. Army Corps of Engineers, the National Marine Fisheries Service, the Los Angeles Regional Water Quality Control Board, the California Coastal Commission, the

14
California State Lands Commission, the California Department of Fish and Game, and the County of Ventura. Environmental review of Track 2 measures would also likely be required under the California Environmental Quality Act (CEQA). Once a final Track 2 compliance proposal and associated costs are identified, GenOn will also need to evaluate how the implementation of the selected Track 2 measures may be funded. Several factors will inform this evaluation, including the total cost of the measures required, market conditions, and projected revenues, as discussed further below in Section III(e).
5. Construct and Implement Track 2 Measures
Construction and implementation time will vary depending on the selected alternative, but for planning purposes GenOn estimates that the installation process will take approximately one year. Outages will be avoided if possible, but GenOn will work closely with the CAISO to coordinate any periods during which generation will not be possible. GenOn expects that with sufficient lead time and coordination, there will be no significant challenges with outages related to the construction and implementation of the types of Track 2 compliance measures under consideration.
6. Conduct Compliance Monitoring
Once the Track 2 compliance measures are in place, GenOn will monitor the effectiveness of the measures, consistent with the requirements in Section 4 of the Policy. GenOn will submit a specific compliance monitoring plan along with the final compliance proposal described in Section III(c)(3) above.
d. Track 2 Compliance Implementation Timeline
In order to complete the various Track 2 compliance activities described above, GenOn anticipates a schedule comprising five sequential elements, summarized below with rough estimates of how long each step will take. GenOn anticipates that State Board review and approval will be required for each of these proposed steps (for example, approval of the Monitoring Plans). It is difficult for GenOn to estimate the review time that will be required for State Board staff over the course of the Implementation Plan process, so establishing a definitive schedule at this point is not possible. The main schedule elements are summarized in Table III-2 below:

15
Table III-2: Track 2 Compliance Implementation Schedule
Implementation Step Estimated Timeframe
1 Conduct entrainment and impingement mortality baseline monitoring; technology
pilot studies
3 years
2 Review data and develop final compliance proposal
1 year
3 Design, engineer and permit Track 2 compliance measures, and secure any
necessary contracts or financing required
2 years
4 Construct and implement Track 2 compliance measures
1 year
5 Conduct compliance monitoring Post-implementation
e. Market-Based Constraints
As noted above, GenOn will not be able to commit to an investment in Track 2 compliance measures until estimated costs and operating restrictions can be estimated, and GenOn is able to reasonably forecast the impact of the MGS Track 2 compliance plan on the adequacy of net revenues. A fundamental hurdle to any major capital improvement project is the facility’s ability to fund the project. In the Supplemental Environmental Document (SED), State Board staff expressly recognized “the complexities of financing” and acknowledged that obtaining financing is a prerequisite to actually constructing improvements.4
Any compliance plan will require investment – the larger the investment, the greater the required revenue certainty and the longer the time that is likely required to recover the investment.
As explained in this subsection, obtaining financing is essentially contingent upon obtaining a sufficiently reliable revenue stream for the MGS units. Without net revenue certainty, it would be infeasible to install significant capital improvements even if they were otherwise feasible from a technical, logistical and environmental perspective.
Exhibit F provides an overview of the landscape that must be considered in evaluating such investments. GenOn has limited long-term market opportunities, and as an independent power
4SED Appendix G at p. G-194.

16
producer in California, GenOn faces significant market and regulatory risks that create uncertainty regarding revenues and costs.
Exhibit F elaborates on the investment criteria that GenOn must consider, and then explains the operating characteristics and capabilities of the MGS and GenOn’s nearby Ormond Beach Generating Station, as well as the Pittsburg Generating Station owned by GenOn Delta, LLC. An introduction is then provided to the market structure in California including how resource adequacy (RA) capacity requirements are developed and how load serving entities contract for RA capacity. The CAISO operates the only transparent competitive markets for energy and ancillary services in California, and a high- level summary of the role and design of those markets is also provided.
In light of these market and regulatory circumstances, Exhibit F explains the many sources of uncertainty GenOn faces, from the economic outlook to market rules, and summarizes the implications these uncertainties for investment in significant capital improvements for the purposes of compliance with the Policy.
The foregoing market-based constraints, explained in detail in Exhibit F, will be considered as noted in the implementation timeline outlined above in Section III(d)
f. Track 2 Compliance Conclusion
In summary, while additional data collection and analysis is required before GenOn can implement a final compliance strategy, GenOn is confident it can comply with the Track 2 requirements of the Policy by applying a combination of one or more operational and technological measures, including, but not limited to, flow reduction measures, cylindrical wedgewire screens, and/or operating restrictions in the MGS NPDES permit. GenOn intends to achieve compliance under Track 2 no later than December 31, 2020.

17
IV. TRACK 1: DEMONSTRATION OF INFEASIBILITY
a. Overview
GenOn has assessed the feasibility of implementing two forms of closed-cycle wet cooling for potential compliance with the Policy under Track 1 at the MGS: (1) fresh water cooling towers (FWCT), and (2) salt water cooling towers (SWCT).5
There are numerous reasons that closed-cycle cooling would be infeasible at the MGS. The definition of “not feasible” in the Policy includes, as one of its prongs, “the inability to obtain necessary permits due to… unacceptable environmental impacts.” The MGS is located within the coastal zone in the City of Oxnard and is subject to the City’s Local Coastal Program, which implements the California Coastal Act. Any major improvements at the MGS would likely require a Coastal Development Permit from the City, which would be the lead agency for the purposes of conducting environmental review under CEQA. The City of Oxnard is considering changes to its Local Coastal Program through development of its draft 2030 General Plan to prohibit non-coastal dependent non-renewable energy uses in Oxnard’s coastal zone.
Overall, these two alternatives face similar logistical, technical and permitting/environmental constraints, but issues unique to each are addressed below.
6
5This Implementation Plan does not specifically evaluate repowering for MGS Units 1 and 2, as repowering would be functionally equivalent to retiring the units and is beyond the scope of regulation of “cooling water intake structures” under Clean Water Act Section 316(b) and the Policy. As State Board staff noted in the SED, the “intent [of the Policy] is not to force OTC [Once-Through Cooling] plants to repower… [and] repowering… is in no way required by the Policy.” SED at p. G-51. Similarly, this Implementation Plan does not specifically evaluate the retrofitting the units to use dry cooling. While dry cooling, as noted by the Policy, would meet the minimum requirements of Track 1, the Policy does not require that the existing units achieve reductions in intake flow rate commensurate with dry cooling, and a requirement to assess the feasibility of dry cooling under the Policy would effectively impose a higher “best technology available” standard than Section 316(b) or Track 1 of the Policy requires.
Additionally, there are numerous potential environmental impacts associated with the installation of cooling towers at the MGS, and whether or not those impacts would be considered unacceptable would be largely a function of agency discretion. GenOn can only speculate as to how the City of Oxnard and other responsible agencies would evaluate those potential impacts under CEQA. Therefore, this Implementation Plan focuses primarily on those specific technological and logistical issues that represent critical feasibility constraints. Based on these critical constraints, GenOn has concluded that compliance under Track 1 is not feasible at the MGS. Moreover, even if it were feasible from a logistical/technical or permitting/environmental
6Goals related to the Local Coastal Program in the City of Oxnard’s Final Draft 2030 General Plan are found in Chapter 3, Community Development, page 3-37, available at: http://developmentservices.cityofoxnard.org/Department.aspx?DepartmentID=7&DivisionID=76&ResourceID=876 The City is considering these amendments to its General Plan in light of the California Coastal Commission’s decision granting Southern California Edison’s appeal of the City’s denial of a Coastal Development Permit for a new 45-MW “peaker” plant, located near the MGS. The Coastal Commission concluded that the new peaker plant would be consistent with the City’s current Local Coastal Program. See Appeal No. A-4-OXN-07-096 (April 8, 2009).

18
perspective to install cooling towers, market-based constraints and uncertainties would make it infeasible to commit to installing cooling towers at this time, as discussed further below.
b. Engineering and Technical Feasibility
With that background, this section evaluates the engineering and technical feasibility of SWCT and FWCT installations at the MGS (i.e. the ability to design, procure and erect the selected cooling tower option in the absence of any other constraints). GenOn understands that Tetra Tech generally assessed the feasibility of installing closed-cycle cooling (FWCTs or SWCTs) at the MGS site in 2008 for the State Board, in a report entitled “California’s Coastal Power Plant: Alternative Cooling System Analysis.” Tetra Tech concluded the following: “The preferred option for MGS includes 2 conventional wet cooling towers (without plume abatement), with individual cells arranged in an inline configuration to accommodate limited space at the site. Space limitations do not appear substantial enough to preclude plume-abated towers at the site if they were required to mitigate visual impacts.”7
1. Siting
GenOn does not dispute the general conclusions of the Tetra Tech report with respect to its analysis of space constraints, but there are critical factors affecting feasibility that Tetra Tech did not take into account and that are addressed more specifically below. Nevertheless, to provide an up-to-date and complete analysis, GenOn independently analyzed cooling tower options, including FWCTs and SWCTs.
To understand the design considerations and physical site constraints and opportunities at the MGS with respect to siting cooling towers, GenOn engaged URS to consider the physical feasibility of installing FWCTs or SWCTs. As discussed below, URS concluded that both forms of cooling towers could theoretically be physically constructed at the MGS, but this conclusion is independent of all other technical/logistical and permitting/environmental constraints that significantly impact the feasibility of installing closed-cycle cooling at the MGS site. The physical design and siting issues for each cooling technology are discussed below.
As a threshold matter for FWCTs and SWCTs, due to the visual impacts that would result from a cooling tower plume on visual resources, especially adjacent beach recreation areas, plume abatement would be required for any FWCT or SWCT installation at the MGS under the provisions of CEQA. Therefore, throughout the rest of this Implementation Plan, the descriptions and analysis of FWCTs and SWCTs assume that they incorporate plume abatement. As a “rule of thumb” the physical footprint dimensions of a plume-abated tower are nominally 20% larger than those of its “non-abated” counterpart.
7Tetra Tech Report at p. H-1.
19
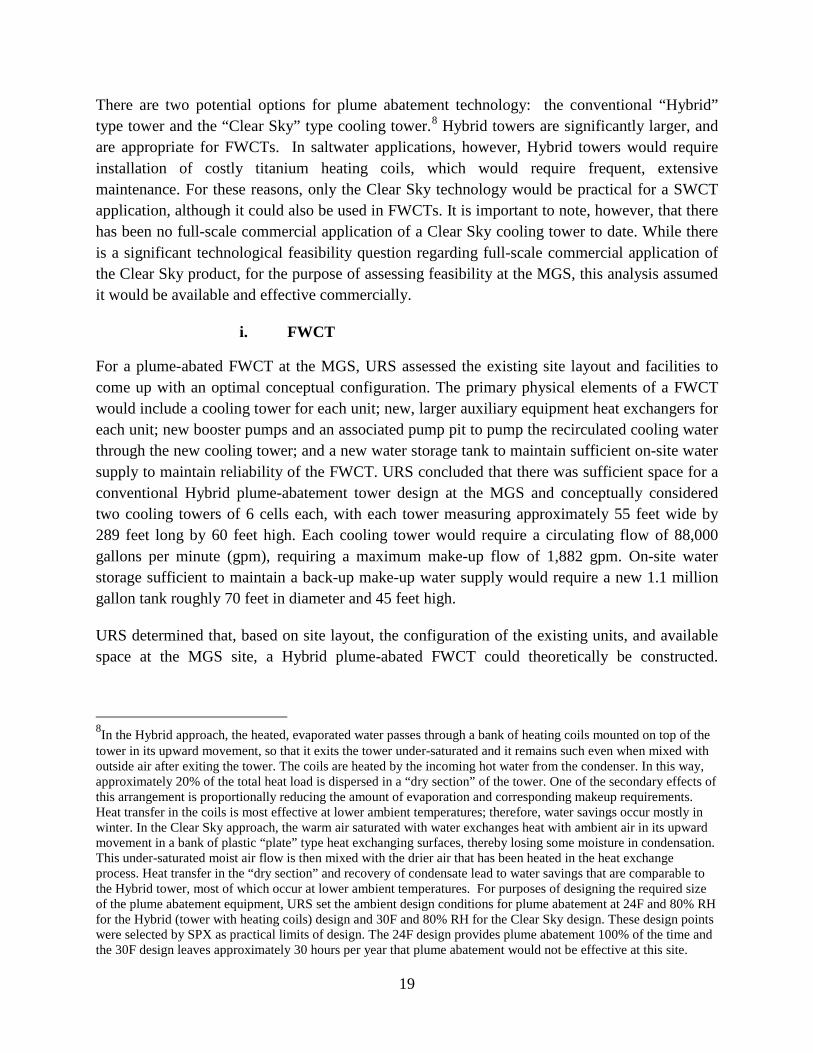
There are two potential options for plume abatement technology: the conventional “Hybrid” type tower and the “Clear Sky” type cooling tower.8
i. FWCT
Hybrid towers are significantly larger, and are appropriate for FWCTs. In saltwater applications, however, Hybrid towers would require installation of costly titanium heating coils, which would require frequent, extensive maintenance. For these reasons, only the Clear Sky technology would be practical for a SWCT application, although it could also be used in FWCTs. It is important to note, however, that there has been no full-scale commercial application of a Clear Sky cooling tower to date. While there is a significant technological feasibility question regarding full-scale commercial application of the Clear Sky product, for the purpose of assessing feasibility at the MGS, this analysis assumed it would be available and effective commercially.
For a plume-abated FWCT at the MGS, URS assessed the existing site layout and facilities to come up with an optimal conceptual configuration. The primary physical elements of a FWCT would include a cooling tower for each unit; new, larger auxiliary equipment heat exchangers for each unit; new booster pumps and an associated pump pit to pump the recirculated cooling water through the new cooling tower; and a new water storage tank to maintain sufficient on-site water supply to maintain reliability of the FWCT. URS concluded that there was sufficient space for a conventional Hybrid plume-abatement tower design at the MGS and conceptually considered two cooling towers of 6 cells each, with each tower measuring approximately 55 feet wide by 289 feet long by 60 feet high. Each cooling tower would require a circulating flow of 88,000 gallons per minute (gpm), requiring a maximum make-up flow of 1,882 gpm. On-site water storage sufficient to maintain a back-up make-up water supply would require a new 1.1 million gallon tank roughly 70 feet in diameter and 45 feet high.
URS determined that, based on site layout, the configuration of the existing units, and available space at the MGS site, a Hybrid plume-abated FWCT could theoretically be constructed.
8In the Hybrid approach, the heated, evaporated water passes through a bank of heating coils mounted on top of the tower in its upward movement, so that it exits the tower under-saturated and it remains such even when mixed with outside air after exiting the tower. The coils are heated by the incoming hot water from the condenser. In this way, approximately 20% of the total heat load is dispersed in a “dry section” of the tower. One of the secondary effects of this arrangement is proportionally reducing the amount of evaporation and corresponding makeup requirements. Heat transfer in the coils is most effective at lower ambient temperatures; therefore, water savings occur mostly in winter. In the Clear Sky approach, the warm air saturated with water exchanges heat with ambient air in its upward movement in a bank of plastic “plate” type heat exchanging surfaces, thereby losing some moisture in condensation. This under-saturated moist air flow is then mixed with the drier air that has been heated in the heat exchange process. Heat transfer in the “dry section” and recovery of condensate lead to water savings that are comparable to the Hybrid tower, most of which occur at lower ambient temperatures. For purposes of designing the required size of the plume abatement equipment, URS set the ambient design conditions for plume abatement at 24F and 80% RH for the Hybrid (tower with heating coils) design and 30F and 80% RH for the Clear Sky design. These design points were selected by SPX as practical limits of design. The 24F design provides plume abatement 100% of the time and the 30F design leaves approximately 30 hours per year that plume abatement would not be effective at this site.

20
However, critical feasibility factors discussed in Section IV(b)(2)(i) below render the FWCT infeasible.
ii. SWCT
Design performance differs between FWCT and SWCT technologies due to the properties of salt water, which has a lower specific heat and a higher specific gravity than fresh water. Due to its lower vapor pressure, salt water is also more difficult to evaporate. This necessitates more cooling tower surface area in a SWCT for evaporation to occur, increasing the tower’s physical size and also increasing auxiliary power demands. Additionally, salt water is highly corrosive, requiring special, and more costly, materials to withstand the higher corrosiveness, separate and apart from plume-abatement considerations.
The primary elements of a conceptual SWCT at the MGS would be similar to those of the FWCT described above, except that a Clear Sky plume-abated tower would be required, and no new water source or on-site water storage would be required. The Clear Sky approach would be the only practical method of plume abatement for a SWCT at the MGS as the technology is completely fabricated of corrosion-resistant materials and is intrinsically less prone to fouling. A conceptual plume-abated SWCT would measure approximately 60 feet wide by 336 feet long by 64 feet high. A SWCT would continue to withdraw seawater via the Edison Canal to provide the maximum 5,628 gpm make-up water per unit.
Another important consideration related to SWCTs is the potential impacts of saltwater corrosion on downwind existing power generation and transmission equipment due to drift from the SWCT. Even with drift elimination incorporated into the cooling tower design, there would still be significant rates of salt deposition. Neither URS nor Tetra Tech specifically evaluated the potential impacts of corrosion on downwind equipment, but corrosion impacts could potentially preclude SWCTs at MGS.
URS determined that, based on site layout, the configuration of the existing units, and available space at the MGS site, a Clear Sky plume-abated SWCT could theoretically be physically constructed at the MGS site. However, critical feasibility factors discussed in Section IV(b)(2)(ii) below render the SWCT infeasible.
2. Critical Feasibility Factors
While the FWCT and SWCT designs can both be hypothetically sited on the MGS site, there are technical, logistical and/or environmental considerations that render them infeasible. These key feasibility constraints are discussed below with respect to each cooling tower option.

21
i. FWCT
The primary technical and logistical constraint affecting the feasibility of FWCTs at MGS is the availability of a freshwater supply. The existing source water for MGS is saltwater from the Pacific Ocean used for the once-through cooled units. Plume-abated FWCT facilities at the MGS would require approximately 5.4 million gallons per day (MGD) of make-up water at full load. Once sufficient water was supplied to initiate the FWCT process, cooling system evaporation would account for most of the consumptive water use. Make-up supplies would be required to offset evaporation losses. The extent of make-up water consumption would be proportional to actual operational levels. Based on prior MGS operations, make-up water demand for plume-abated FWCT facilities would be approximately 2,164 acre-feet per year (AFY).
The MGS is located in the City of Oxnard’s (City) water service area. The City’s current water supplies consist of groundwater and surface water supplies imported under an agreement with the Calleguas Municipal Water District. Calleguas is supplied by the Southern California Metropolitan Water District, which obtains water primarily from State Water Project (SWP) and the Colorado River (City of Oxnard Water Division, 2005 Urban Water Management Plan (Rev 8, Kennedy-Jenks, 2006)) (UWMP). The UMWP, and subsequent water analyses in environmental documents prepared by the City (see e.g., City of Oxnard Planning Division, Sakioka Farms Business Park Specific Plan Draft Environmental Impact Report, September 2010 (Sakioka DEIR)) indicate that existing groundwater and SWP imports will be insufficient to meet anticipated future demands. Groundwater available to the City is regulated by the Fox Canyon Groundwater Management Agency (GMA), which was created by state legislation in 1983 to manage regional aquifers. The GMA’s groundwater allocations to local users, including the City, have been successively reduced by approximately 25% through 2010 (Sakioka DEIR, page IV.N-3). The City’s imported supplies are subject to significant climate variability, endangered species impacts related to SWP pumps located on the southern edge of the Sacramento Delta, and by legal disputes affecting the availability of Colorado River water in California (Sakioka DEIR, page IV.N-5 to IV.N-12). To meet future demand, the City intends to construct new treatment facilities with the capacity to produce approximately 17,500 AFY of tertiary-treated recycled water. The City anticipates that it will receive proportionate groundwater or other potable water use credits by offsetting existing uses or supplementing the local aquifer with approximately 17,500 AFY of tertiary-treated supply, an amount the City has identified as necessary to meet demand by 2030 (UMWP, page 101: Sakioka DEIR page IV.N-13).
Groundwater or imported surface water use by the MGS would be inconsistent with State Board policies that strongly discourage the use of fresh water for power plant cooling purposes.9
9State Board Resolution 75-58 states in relevant part that, “It is the Board’s position that from a water quantity and quality standpoint the source of powerplant cooling water should come from the following sources in this order of
Such
22
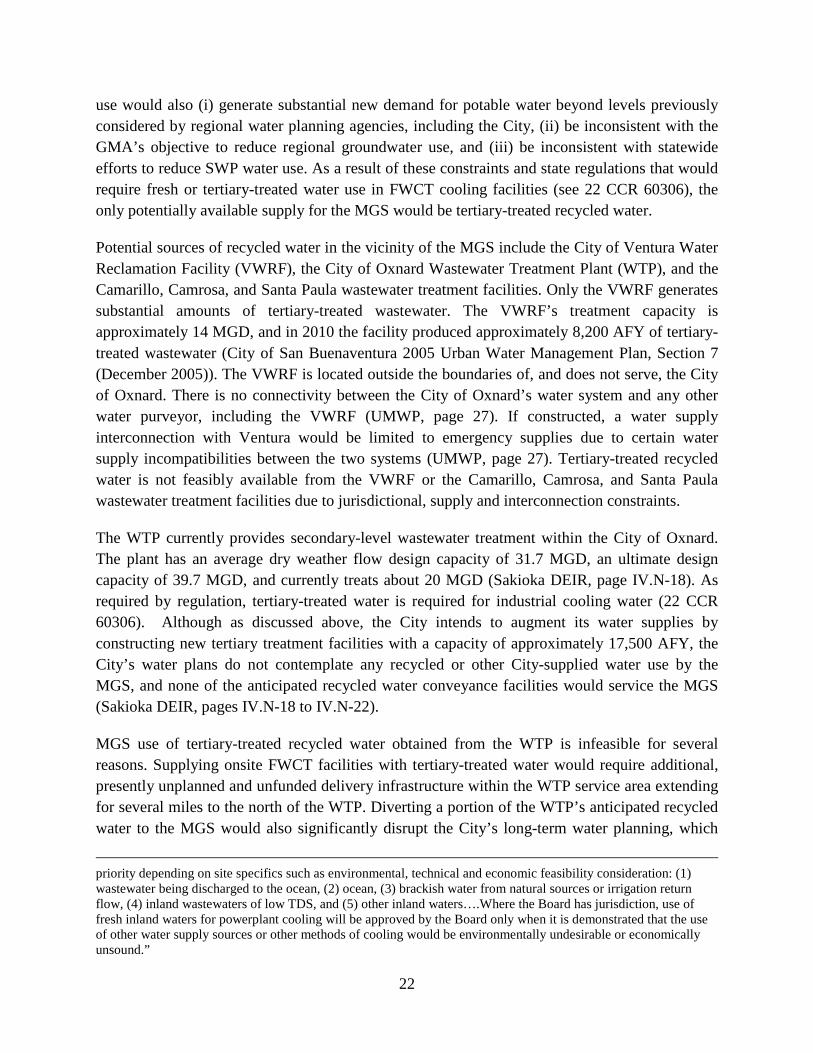
use would also (i) generate substantial new demand for potable water beyond levels previously considered by regional water planning agencies, including the City, (ii) be inconsistent with the GMA’s objective to reduce regional groundwater use, and (iii) be inconsistent with statewide efforts to reduce SWP water use. As a result of these constraints and state regulations that would require fresh or tertiary-treated water use in FWCT cooling facilities (see 22 CCR 60306), the only potentially available supply for the MGS would be tertiary-treated recycled water.
Potential sources of recycled water in the vicinity of the MGS include the City of Ventura Water Reclamation Facility (VWRF), the City of Oxnard Wastewater Treatment Plant (WTP), and the Camarillo, Camrosa, and Santa Paula wastewater treatment facilities. Only the VWRF generates substantial amounts of tertiary-treated wastewater. The VWRF’s treatment capacity is approximately 14 MGD, and in 2010 the facility produced approximately 8,200 AFY of tertiary-treated wastewater (City of San Buenaventura 2005 Urban Water Management Plan, Section 7 (December 2005)). The VWRF is located outside the boundaries of, and does not serve, the City of Oxnard. There is no connectivity between the City of Oxnard’s water system and any other water purveyor, including the VWRF (UMWP, page 27). If constructed, a water supply interconnection with Ventura would be limited to emergency supplies due to certain water supply incompatibilities between the two systems (UMWP, page 27). Tertiary-treated recycled water is not feasibly available from the VWRF or the Camarillo, Camrosa, and Santa Paula wastewater treatment facilities due to jurisdictional, supply and interconnection constraints.
The WTP currently provides secondary-level wastewater treatment within the City of Oxnard. The plant has an average dry weather flow design capacity of 31.7 MGD, an ultimate design capacity of 39.7 MGD, and currently treats about 20 MGD (Sakioka DEIR, page IV.N-18). As required by regulation, tertiary-treated water is required for industrial cooling water (22 CCR 60306). Although as discussed above, the City intends to augment its water supplies by constructing new tertiary treatment facilities with a capacity of approximately 17,500 AFY, the City’s water plans do not contemplate any recycled or other City-supplied water use by the MGS, and none of the anticipated recycled water conveyance facilities would service the MGS (Sakioka DEIR, pages IV.N-18 to IV.N-22).
MGS use of tertiary-treated recycled water obtained from the WTP is infeasible for several reasons. Supplying onsite FWCT facilities with tertiary-treated water would require additional, presently unplanned and unfunded delivery infrastructure within the WTP service area extending for several miles to the north of the WTP. Diverting a portion of the WTP’s anticipated recycled water to the MGS would also significantly disrupt the City’s long-term water planning, which
priority depending on site specifics such as environmental, technical and economic feasibility consideration: (1) wastewater being discharged to the ocean, (2) ocean, (3) brackish water from natural sources or irrigation return flow, (4) inland wastewaters of low TDS, and (5) other inland waters….Where the Board has jurisdiction, use of fresh inland waters for powerplant cooling will be approved by the Board only when it is demonstrated that the use of other water supply sources or other methods of cooling would be environmentally undesirable or economically unsound.”

23
depends on generating proportional groundwater offsets and credits from tertiary-treated water. The MGS does not use potable supplies that would be eligible for the offsets and credits the City desires to obtain. Consequently, additional and currently unanticipated potable water demand of at least 2,164 AFY, or the amount of make-up water that the FWCT facilities would consume, would be generated by MGS recycled water use. Based on the UWMP and recent City projections, no additional and reliable potable groundwater or imported water resources of this magnitude are currently available to meet future water needs in the region. Finally, at peak operation FWCT facilities would require approximately 5.4 MGD of make-up water. This level of use would be approximately 27% of the WTP’s current daily capacity (20 MGD) and 17% of the WTP’s design capacity (31.7 MGD). The WTP was not designed to and could not feasibly accommodate peak recycled water demands of this magnitude.
Accordingly, based on currently available information, existing and potential future reclaimed water supplies are not available and insufficient to meet the demand of an MGS FWCT. The unavailability of these resources render FWCTs at MGS infeasible.
ii. SWCT
The primary environmental impact distinguishing SWCTs from FWCTs is the emission of particulate matter (PM) due to the high level of total dissolved solids (TDS) in saltwater, resulting in several severe logistical constraints. PM emissions trigger various air quality permitting requirements. The MGS is under the jurisdiction of the Ventura County Air Pollution Control District (VCAPCD). Section B of VCAPCD Regulation II, Rule 26 (New Source Review [NSR] Requirements) requires emission offsets for a new, replacement, modified or relocated emissions unit with an emission increase of 15 tons per year (tpy) or greater of PM less than 10 microns in diameter (PM10).
The salt content of the make-up water for a seawater cooling tower at the MGS was calculated based on results of salinity sampling conducted as part of GenOn’s 2006 impingement and entrainment studies. The highest mean salinity concentration at the MGS cooling water intake structure of 30.67 ppt was used in emissions estimates pertaining to the use of seawater at the MGS. Salinity levels in the Edison Canal, through which an SWCT would continue to withdraw cooling water at the MGS, would vary depending on flood and ebb conditions, occasional dredging activities, and runoff from parcels adjacent to the canal.
Based on this salinity concentration, and using U.S. EPA’s guidance on emission factors for wet cooling towers (U.S. EPA, AP 42, Section 13.4), GenOn estimated PM emissions for SWCTs at the MGS would be 40.0 tons per year, conservatively using the high end of recent representative operating years. Note, however, that these emission levels are based on actual operations. For permitting purposes, GenOn would need to obtain authorization for emissions up to the facility’s full potential to emit (PTE), which would be much higher than these calculated levels. Even

24
assuming these actual levels, however, PM emissions from an MGS SWCT would exceed the NSR threshold of 15 tpy and require the provision of offsets under VCAPCD rules.
GenOn conducted an assessment of the VCAPCD PM10 emission reduction credit (ERC) market to determine whether sufficient ERCs would be available to meet the offset requirements of the VCAPCD’s NSR requirements based on projected SWCT emissions at the MGS. The results of this assessment are summarized below:
• As noted above, the working estimate for projected PM10 emissions in an MGS SWCT is 40.0 tpy. Under applicable VCAPCD rules, GenOn would be required to offset these emissions at a rate of 1.1 to 1.0, which would require 44 tons of ERCs. (See VCAPCD Rule 26.2(c)).
• The existing inventory of PM10 ERCs in the VCAPCD emissions bank is 42.4 tons.
• The entire stationary source inventory in the VCAPCD is approximately 263 tpy.
• The 44.0 ton ERC demand for an MGS SWCT therefore represents:
o more than 100% of the existing inventory of PM10 ERCs in the VCAPCD’s emissions bank, and
o more than 16% of the entire stationary source inventory in the VCAPCD.
• Therefore, to procure sufficient ERCs based on the existing inventory in the VCAPCD, GenOn would have to procure more than the entire inventory in the bank. It is extremely unlikely that the owners of existing ERCs would be willing to sell the entire existing bank inventory, and therefore even after obtaining all available ERCs from willing sellers, there would likely be a substantial gap to fill to reach the requisite 44 tons.
• To fill this gap, GenOn would either have to (1) secure the retirement of a sufficient amount of PM10 emissions within the VCAPCD to create more ERCs, (2) attempt to create ERCs using interpollutant trading, and/or (3) securing ERCs from other districts. The latter two approaches, however, have rarely been used and are generally disfavored, and in any case the supply of ERCs of PM10 precursors in the VCAPCD, as well as PM10 ERCs in neighboring districts, is similarly constrained.

25
• Therefore, GenOn’s analysis indicates that it would not be feasible to procure sufficient ERCs to offset the emissions associated with a SWCT under applicable air quality regulations.
In addition to the challenges associated with obtaining sufficient ERCs, the exceedance of the 15 tpy threshold also has much broader implications under the Clean Air Act and other federal laws. The installation of SWCTs with incremental emissions exceeding the 15 tpy threshold would be considered a “major modification of a major facility” for NSR purposes and would therefore require a Prevention of Significant Deterioration (PSD) Permit from the U.S. EPA. As a federal action, PSD permit issuance also triggers compliance with the National Environmental Policy Act (NEPA), as well as requiring consultation with the National Marine Fisheries Service and/or the U.S. Fish and Wildlife Service under the federal Endangered Species Act. Thus, a PSD permit would add numerous permitting hurdles, likely extending and complicating the permitting timeline, if not completely precluding SWCTs.
In sum, the unavailability of sufficient ERCs, in addition to the federal permitting complications due to PM emissions associated with saltwater, render SWCTs infeasible.
c. Market-Based Constraints
Notwithstanding the feasibility factors discussed above regarding cooling towers at the MGS, as explained above in Section III(e), a fundamental hurdle to any major capital improvement project is the facility’s ability to fund the project. This hurdle is much more significant for a project on the scale of cooling towers, which would require significant revenue certainty over many years. The market-based constraints described in Section III(e) and in Exhibit F would preclude the installation of cooling towers at the time even if they were otherwise feasible.
d. Cooling Tower Conclusions
Both of the potential cooling tower configurations at the MGS, whether an FWCT or SWCT, face insurmountable hurdles that render them infeasible. The foregoing discussion of feasibility factors focuses only on the most prominent issues. There are numerous other potential environmental impacts associated with cooling towers, such as those related to noise, water quality or greenhouse gas emissions, that would additionally impair their feasibility at the MGS. Therefore, compliance under Track 1 of the Policy is not feasible for the MGS. Moreover, even if all of the technical, environmental and permitting hurdles could be cleared to theoretically construct a FWCT or SWCT, as a practical matter GenOn would not be able to actually commence engineering and construction without financing, which could not be secured without sufficient net revenue certainty. Accordingly, even if Track 1 compliance were otherwise feasible, GenOn could not commit to installing cooling towers at this time.

26
V. COMPLIANCE WITH INTERIM REQUIREMENTS
a. Offshore Intake Screening
The MGS does not have an “offshore intake” for the purposes of the Policy, so Section 2(C)(1) of the Policy is inapplicable.
b. Curtailment of Intake Flows
Section 2(C)(2) of the Policy requires an existing power plant unit that is subject to the Policy to cease intake flows when not engaging in power-generating activities, or critical system maintenance, unless a reduced minimum flow is necessary for operations. The November 30, 2010 Implementation Plan Requirements letter requested “information regarding when it is likely that each unit in your facility may not be generating power, or when you are not performing critical system maintenance, that would result in the cessation of flows.” As illustrated in the graph below, MGS flows (and corresponding operations) are typically concentrated in the hottest summer months, when demand for generation is highest. However, the MGS may be dispatched at any time, and there has not been a single month in the last five years where there have been no power generation-related flows, and consumption during the same month varies considerably from year to year. Accordingly, while a discussion of monthly generation trends can indicate when flows are more or less likely to occur during the year based on likely electrical demand, they are only illustrative, and GenOn cannot guarantee that the annual generation profile in a given year will look exactly the same as another year.
MGS Total Plant Flow
0
1,000
2,000
3,000
4,000
5,000
6,000
7,000
Jan Feb Mar Apr May Jun Jul Aug Sep Oct Nov Dec
Flow
(Mill
ions
of G
allo
ns)
20062007200820092010

27
MGS operating procedures will be modified prior to October 1, 2011 to specifically require CWPs to be removed from service whenever the units are not directly engaged in power-generating activities or critical system maintenance, as such terms are defined in the Policy. The MGS has certain essential equipment that is directly related to power generation, such as air compressors, that continue to operate even if the units are offline, and a low-volume stream bearing cooling water continues to be required to service this equipment. As noted in Section II, the low capacity saltwater pump at MGS will continue to operate for three to four hours once or twice per day to perform this service. In addition, MGS discharges its circulating water to the ocean via a rock lined swale that runs across the beach. When the units have been shut down for an extended period of time, it is necessary to place a circulator in service for a short period of time to prevent sand buildup in this swale that would impair operations. These low-volume flows are directly related to power generation and critical system maintenance.
c. Interim Mitigation
Section 2(C)(3) of the Policy requires facilities that have not achieved final compliance by October 1, 2015 to provide for interim mitigation of impingement and entrainment impacts from that date until final compliance is achieved. Based on the implementing schedule set forth in Section III(d) of this Plan, GenOn does not anticipate that the MGS will have achieved final compliance by October 1, 2015, so GenOn proposes to provide for interim mitigation as discussed below.
1. Existing Mitigation Efforts
GenOn is committed to supporting projects that preserve and protect the natural resources in the City of Oxnard and the surrounding areas and has engaged in numerous restoration and mitigation efforts that it believes should be credited against the Policy’s mitigation requirements. During the last decade, the MGS and GenOn’s nearby Ormond Beach Generating Station have been actively involved in projects that benefit the marine environment. Throughout Ventura County, and with an emphasis on programs in the City of Oxnard, the stations have invested more than $250,000 – and thousands of employee volunteer hours – in support of vital habitat restoration, environmental education, and threatened and endangered species protection projects. In addition to actively supporting the Channel Islands Marine Resource Institute and its marine habitat enhancement and marine educational programs and providing funding and volunteer support to local marine mammal stranding efforts in Ventura County, GenOn’s City of Oxnard facilities have provided funds to (a) assist with restoration efforts in the Ormond Beach Wetlands, and (b) support multiple Nature Conservancy projects aimed at enhancing sensitive fish and wildlife habitats.
In conjunction with the proposed interim mitigation described below, GenOn will work on quantifying the value of the existing mitigation programs that restore and/or enhance coastal

28
marine or estuarine habitat and provide protection of marine life as described above for potential credit against the interim mitigation requirements in the Policy.
2. Proposed Interim Mitigation
Assuming that the existing mitigation measures described above are not sufficient to meet the interim mitigation requirements, GenOn proposes additional interim mitigation as follows to make up the difference. The State Board has identified the preferred mitigation method as providing funding to the California Coastal Conservancy that will ultimately be used “for mitigation projects directed toward increases in marine life associated with the State’s Marine Protected Areas in the geographic region of the facility.” The California Coastal Conservancy has identified several restoration projects in the South Coast region that, when implemented, would provide increases in habitat and production of marine life.
GenOn proposes to provide funding to the Coastal Conservancy for the implementation of projects in the vicinity of the MGS that would provide increases in the habitat and production of marine life, as interim mitigation from October 1, 2015 and continuing up to and until the MGS achieves final compliance with the Policy. For reference, GenOn Delta notes that on December 14, 2010, the State Board proposed amendments to its Policy that included additional language to Policy Section 3(A)(1)(c). That additional language would have clarified compliance with Section 2(C)(3)(a)-(c) and (e) by establishing a $3 per million gallons fee payable annually for the purposes of meeting the mitigation requirements set forth in those subsections. GenOn believes the $3/million gallons mitigation approach provides a reasonable and practicable method for meeting the Policy’s requirements. Accordingly, GenOn proposes to provide $3/million gallons of actual flows withdrawn by each unit. The amount provided would be based on the actual cooling water intake flow of each unit during each calendar year (January 1 through December 31), or prorated year depending on when final compliance is achieved and interim mitigation is no longer required. Discharge data submitted to the Los Angeles Regional Water Quality Control Board would be used for the volume calculations. The calculations would be performed by the MGS for the prior year, and the funds would be submitted to the Coastal Conservancy by February 1 of each calendar year.
This approach would allow for the consistent, equitable implementation of the Policy among all the plants that are required to conduct interim mitigation; it would provide a predictable and easily quantifiable rate of mitigation; and it would provide meaningful, reliable funding for coastal restoration projects. By providing funding on an annual basis it would also address uncertainties related to the volume of cooling water necessary to support operations at the MGS. This approach avoids the complexity and difficulty of attempting to quantify in monetary terms the extent of mitigation or restoration that should correspond to a given level of entrainment and impingement. It also avoids the uncertainties that are associated with the implementation of any restoration project and the difficulties in determining the appropriate level of funding for projects

29
that might continue to require funding and provide benefits well beyond the date when final compliance is achieved.

Exhibit A

ESLO2011-009.3
Summary of IM&E Studies – Mandalay GS 1
Summary of IM&E Studies at Mandalay Generating Station
March 18, 2010
Prepared by:
Tenera Environmental 141 Suburban Rd., Suite A2 San Luis Obispo, CA 93401 805.541.0310
Mandalay Generating Station
This section describes previous impingement mortality and entrainment (IM&E) sampling done
at the MGS, including comprehensive studies conducted from January 2006 through January
2007 (2006 Study) following the publication of the EPA 316(b) Phase II Rule in February 2004.
Historical Studies Impingement sampling was done at the MGS as part of the original 316(b) compliance
demonstration in the late 1970s and early 1980s, and as part of receiving water monitoring
required under the facility’s NPDES permit in the 1990s and from 2000 to the present. No
entrainment sampling was conducted at the plant prior to the 2006 Study. The entrainment data
included in the original 316(b) compliance demonstration were collected at another power plant.
The historical impingement studies are briefly described below and are followed by a description
of the sampling done for the 2006 Study.
1978–1980 316(b) Compliance Demonstration Impingement Impingement monitoring was conducted between October 1978 and September 1980.
Monitoring was conducted twice per week between August 1979 and July 1980 and once per
week during the remainder of the period. No heat treatments were conducted during the period
and were not necessary due to the configuration of the CWIS at that time. Species were grouped
into algal, invertebrate, and fish categories. The following data were recorded for all individuals
collected from the screen/trash basket washings during normal operations: (1) number of species;
(2) number of individuals per species; and (3) total weight per species. Fifteen species of fish
were targeted for further analysis, including shiner surfperch queenfish, anchovy, white
surfperch, walleye surfperch, white croaker, Pacific butterfish, kelp bass, barred sand bass, sargo,
spotfin croaker, bocaccio, black surfperch, yellowfin croaker, and black croaker. The standard

Mandalay Historical Studies
ESLO2011-009.3
Summary of IM&E Studies – Mandalay GS 2
length to the nearest millimeter (mm) was measured for up to 200 individuals of the target
species and up to 50 individuals were sexed. Non-target species found in large numbers were
also counted and sexed. The total estimated impingement was calculated by averaging the daily
impingement rate across the 154 samples collected during the study. The average impingement
rate was estimated at 225 fishes per day. The fifteen target species comprised 63.6 percent of the
total daily impingement during the two-year period; of these, 41.2 percent were shiner surfperch;
7.2 percent queenfish; 6.8 percent anchovy; and 3.2 percent white surfperch.
NPDES Impingement Monitoring The NPDES permit for the MGS required impingement sampling during representative periods
of normal operation and during all heat treatment operations starting in 2001. A normal operation
survey was defined as a sample of all fish and macroinvertebrates impinged onto sliding screens
during a 24-hour period with all circulating pumps operating, if possible. The yearly abundance
and biomass of impinged species under normal operation were estimated by multiplying the
daily mean catch per unit effort by the annual total cooling water flow. During heat treatments,
impinged fish and macroinvertebrates were collected, sorted by species, counted and weighed.
Data were combined with the estimated normal operation data to determine the total
impingement losses for the year.
Sampling was conducted at approximately monthly intervals throughout the year to provide
some indication of impingement abundance and biomass during normal operations. Impingement
sampling included the characterization, enumeration, and weighing of all fish,
macroinvertebrates, and plants entrained in the seawater cooling system and impinged on the
MGS traveling screens during a 24-hour period. Information on the number of seawater
circulation pumps in operation, the seawater flow direction, water temperature, and weather was
also collected. At least one of the four seawater circulation pumps had to be in operation to
conduct a fish count.
For both the 24-hour and heat treatment counts, fish, invertebrates, and plants were separated
from debris and sorted by species. The standard lengths of all bony teleost fish (subclass
Osteichthyes) and the total lengths of all cartilaginous fish (subclass Chondrichthyes) were
recorded as was their abundance and biomass in kilograms (kg). Aggregate weights of both fish
and invertebrate species were recorded.
The estimates of annual impingement varied considerably among years due to differences in
plant and pump operation, the timing of plant operation with changes in fish abundance, and the
numbers of samples collected (Table 1). For example, the estimates of annual impingement for
2001–2010, ranged from a low of 186 fish in 2001 to a high of 136,749 fish in 2002, and were
based on four and five normal operation surveys, respectively, with two heat treatment surveys in
each of the years (Table 2).

Mandalay Historical Studies
ESLO2011-009.3
Summary of IM&E Studies – Mandalay GS 3
Table 1. Numbers of normal operations and heat treatment impingement samples at the
Mandalay Generating Station from 2001 through 2010. The large number of samples in
2006 include the period of sampling for the IM&E Characterization Study when samples
were collected four times each 24 hours from late January through December 2006 for a
total of 92 samples. Sampling for the study continued through early January 2007 when
four additional samples for the study were collected.
Year 2001 2002 2003 2004 2005 2006 2007 2008 2009 2010
Heat Treatment 2 2 1 2 1 1 1 1 1 0
Normal Operations 4 5 5 4 9 92 9 7 6 5
Table 2. Total estimated annual impingement including heat treatments at the Mandalay
Generating Station from 2001 through 2010 for NPDES reporting period of October 1 through
September 30 each year.
Year 2001 2002 2003 2004 2005 2006 2007 2008 2009 2010
Numbers of Fishes 186 136,749 7,424 23,053 53,598 115,829 5,270 10,754 11,525 4,314
Numbers of Taxa 6 20 11 13 20 28 26 19 14 15
2006–2007 316(b) IM&E Study
Impingement The impingement sampling for the 2006 Study was planned to occur on a bi-weekly basis when
the facility was generating power, or on the next day of normal facility operation in the event that
it was not operating on the scheduled sampling date. A total of 24 sampling events during normal
operation occurred during the study. Each sampling event was conducted over 24-hours and
included four samples taken every six hours at approximately 06:00 (morning), 12:00 (noon),
18:00 (evening), and 00:00 (midnight) hours in order to evaluate diel variation. Impingement
sampling was also conducted during the one heat treatment completed during the study period.
The processing of the samples for the study was identical to the processing for the NPDES
sampling.
Entrainment
Entrainment sampling was completed on a bi-weekly basis from January 2006 through January
2007 (24 sampling events) in the Edison Canal, adjacent to the MGS intake structure.
Ichthyoplankton samples were collected monthly from two additional locations (Edison Canal
and Channel Islands Harbor) from June 2006 through November 2006 (6 sampling events). The
locations of the three sampling stations were as follows:

Mandalay Historical Studies
ESLO2011-009.3
Summary of IM&E Studies – Mandalay GS 4
1. Mandalay Generating Station – In the Edison Canal, adjacent to the generating station;
2. Edison Canal – In the Edison Canal, upstream of the barrier between the Edison Canal
and the Channel Islands Harbor; and
3. Channel Islands Harbor – At the mouth of the Channel Islands Harbor, behind the
breakwater.
Sampling was conducted using a 333 micrometer (µm) plankton net with a 1.6 ft (0.5 m)
diameter mouth. Nets were deployed adjacent to the sliding screens. Samples were collected four
times per 24-hour period, at approximately 06:00 (morning), 12:00 (noon), 18:00 (evening), and
00:00 (midnight) hours in order to evaluate diel variation. Duplicate samples were collected at
each time frame. The net was equipped with a passive impeller to record the volume of water
filtered by the net. The target filtered volume was 26,400 gal (100 m3). Actual sampled volume
as well as the plant cooling water flow rate was recorded. Upon retrieval of the net, the net was
rinsed to transfer organisms that may be attached to the net into the end of the net (codend). The
codend was then removed and the contents carefully poured into a sample container. Following
this initial step, the codend was inverted over the sample container and gently rinsed with a
squirt bottle containing filtered seawater to ensure that all contents had been transferred. Samples
were initially preserved in 10% formalin solution with Rose Bengal stain. An appropriate amount
of seawater was added to the container in the field prior to adding the collected sample. After 48
hours all liquid was decanted and 40-percent isopropyl alcohol or 70-percent ethanol was added
to the collection container for permanent preservation.
All samples were transferred to a laboratory for processing where they were logged, sorted by
date and type, and stored for processing. When a sample contained a large number of organisms,
a Folsom plankton splitter was used to split the sample. The number of times each sample was
split was recorded to allow for extrapolation of data from the split sample to the original sample
composition. The samples were processed by transferring the whole or split samples to counting
trays for examination under a dissecting microscope. All larval fishes, fish eggs, and larval
shellfishes were identified to the lowest practicable taxon. Measurements appropriate for the life
stage were recorded as well as physical characteristics relevant to life stage (oil drop present, size
of oil drop, pigmentation, ocular development, presence of byssal threads, etc). Appropriate
reference literature and electronic databases were used to assist in taxonomic determinations and
a quality assurance program was used to evaluate the quality of the processing.
The results of the entrainment sampling included the following:
Annual entrainment at Mandalay extrapolated to full design flow was approximately 228
million planktonic fishes and shellfishes (13.5 million fish eggs, 142 million fish larvae,
151,000 post-larval fish, and 73.1 million shellfish larvae).
Annual entrainment at Mandalay extrapolated to 2006 actual flow was approximately
54.4 million planktonic fishes and shellfishes (5.2 million fish eggs, 33.4 million fish
larvae, 31,500 post-larval fish, and 15.7 million shellfish larvae).

Mandalay Historical Studies
ESLO2011-009.3
Summary of IM&E Studies – Mandalay GS 5
The average concentrations of ichthyoplankton (larvae and eggs) was much higher at the
Channel Islands Harbor station (1.69 fish per m3) compared to the average entrainment at
the MGS intake (0.19 fish per m3) for the six monthly surveys when samples were
collected at all three stations.
Summary GenOn is proposing that IM&E monitoring be conducted at the MGS due to potential
deficiencies with the data collected during the 2006 Study, especially in regards to the
entrainment sampling. . While impingement data collected at MGS during the most recent 2006-
07 study included 24 sampling days and 96 sampling points, providing one sufficient year of
data, data are much more limited for other years, as historic NPDES sampling was limited due to
the scheduling of sampling around the operations of the plant. The low number of impingement
sampling events from 2001-2005 resulted in a highly variable range of impingement estimates
during that period. It is difficult to accurately extrapolate such a limited data set as the rate at
which organisms are impinged is dependent upon many factors in addition to plant flow. In order
to obtain an accurate estimate, several robust sampling years like 2006-2007 would be required,
with a large number of samples collected regularly and covering numerous operational and
environmental conditions over all seasons.
GenOn proposes to conduct new impingement sampling that will provide the data necessary to
accurately estimate annual losses at the plant. If the sampling is still limited over the proposed
three year sampling period, data from previous IM sampling could be incorporated into a larger
meta-analysis to provide a broader database for characterizing impingement.
Similarly, recent entrainment data are limited to a single year (2006-2007), and the reliability of
these data is questionable due to the unusually low ichthyoplankton concentrations. The analysis
indicated that there were no problems with the actual sampling procedures. The most likely
source of the seemingly low numbers was the unique habitat in the intake bay at MGS. Unless
the plant was operating during the sampling, the large numbers of larvae that likely were present
in the Channel Islands Harbor would not be drawn into the intake bay. The number of pumps
operating during the entrainment sampling in the intake bay was examined and showed that 25
percent of the samples were collected when no pumps were operating, and 77 percent of the
samples were collected when two or fewer pumps were operating. Only 17 percent of the
samples were collected when all four pumps were operating. When the plant is not operating or
operating at very low flows, tidal exchange will tend to transport larvae out of the intake bay,
which has no other connection with the harbor or ocean. This is indicated by the larger average
concentration of ichthyoplankton at the Channel Islands Harbor station (1.69 fish per m3) relative
to the intake bay station (0.20 fish per m3) for the six months when both stations were sampled.
The average concentration for the Channel Islands Harbor station is within the range of
concentrations that would be expected for ichthyoplankton from other similar locations in CA
especially since the period of sampling (June–November) did not include the spring months
when fish larvae are typically most abundant.

Mandalay Historical Studies
ESLO2011-009.3
Summary of IM&E Studies – Mandalay GS 6
Larvae originating in the Channel Islands Harbor are drawn into the MGS intake bay through the
Edison Canal when the plant CWIS is operating. As a result, the most appropriate location for
the entrainment sampling is at the mouth of the Edison Canal, which is technically the location
of the intake in the NPDES permit for the plant. Therefore, the new entrainment sampling
proposed for MGS to comply with the OTC Policy will occur at the mouth of the Edison Canal,
although other locations may also be sampled to verify the effectiveness of technologies used for
reducing entrainment.

Exhibit B

ESLO2011-007.3
GenOn West, L.P. Mandalay Generating Station
IImmppiinnggeemmeenntt MMoorrttaalliittyy aanndd EEnnttrraaiinnmmeenntt MMoonniittoorriinngg PPllaann
March 16, 2011
Submitted to:
Mr. Rick Eckersley GenOn Energy, Inc. 1000 Main St. Houston, TX 77253
Prepared by:
141 Suburban Rd., Suite A2, San Luis Obispo, CA 93401 (805) 541-0310, FAX (805) 541-0421
Environmental

1.0 Introduction
ESLO2011-007.3 GenOn Energy Mandalay GS IM&E Monitoring Plan 1
1.0 Introduction
This study plan presents the rationale and protocol for conducting sampling to monitor levels of
impingement mortality and entrainment (IM&E) at the GenOn West, L.P. Mandalay Generating
Station (MGS) in Oxnard, California. The plan is designed to enable MGS to comply with the
Statewide Water Quality Control Policy on the Use of Coastal and Estuarine Waters for Power
Plant Cooling (Policy) adopted by the California State Water Resources Control Board
(SWRCB) in May 2010, which became effective on October 1, 2010. The requirements for
IM&E monitoring for plants pursuing compliance under Track 2 of the Policy are provided in
Section 4: Track 2 Monitoring Provisions (Section 4.A.(1) for impingement and Section 4.B.(1)
for entrainment).
1.1 Study Plan Rationale This plan is only for the monitoring provisions of the Policy and does not cover any additional
studies that might be required under Sections 4.A.(2) and 4.B.(2) of the Policy to confirm the
effectiveness of Track 2 controls in reducing the levels of impingement and entrainment,
respectively. Although the Policy requires that these additional studies are consistent with the
monitoring in Sections 4.A.(1) and 4.B.(1), the sampling and design of these studies will be
different from the sampling done for the monitoring. Data collected during the monitoring phase
would be of limited use to confirm the effectiveness of IM&E reduction technologies because
such studies would be designed to provide statistically valid estimates of IM&E reductions and
therefore require a study approach focused on that goal alone. The purpose of the monitoring
data is entirely different and is required in the Policy to characterize the composition and
abundance of the biological organisms impinged and entrained by the MGS, and their seasonal
and diel variation.
The Policy provides specific guidelines for the design of the monitoring studies. For
impingement these are listed in Sections 4.(A).1.a–d, and include the following:
a) a study period of 36 months;
b) collection of sampling during different seasons and for 24-hour periods;
c) when applicable, collection of samples under different plant operating conditions; and
d) that the study not result in any additional mortality above typical operating conditions.
The requirements for entrainment are listed in Sections 4.(B).1.ab, and include the following:
a) that the study sample all species of ichthyoplankton and invertebrate meroplankton, and
that identification be done to the lowest taxonomic level practicable, and if practicable,
that genetic identification be used to assist in the identification; and

1.0 Introduction
ESLO2011-007.3 GenOn Energy Mandalay GS IM&E Monitoring Plan 2
b) that the study be conducted for 36 months over different seasons, and that sampling
account for variation in oceanographic conditions.
The details of the IM&E Monitoring Plan provided in the following sections meet the
requirements in the Policy listed above. This plan was designed based on IM&E studies that have
been conducted at coastal power plants throughout California over the past several years. The
designs of many of these studies have been reviewed by independent scientists from academic
institutions and are largely consistent with the concepts provided in a report on the design of
power plant impact assessments prepared for the California Energy Commission (Steinbeck et al.
2007). This report, authored by scientists from academic institutions and industry, has been used
in the design of many of the power plant studies.
As a threshold matter, this plan addresses the practical challenges of sampling ichthyoplankton.
The Policy states in Section 2.A.(2).b.(ii) that compliance with entrainment under the policy will
be determined based on sampling of ichthyoplankton, and megalops and phyllosoma larval
stages of crustaceans (crabs and lobster), and squid paralarvae fractions of meroplankton. The
policy defines ichthyoplankton as “..the planktonic early life stages of fish (i.e., the pelagic eggs
and larval forms of fishes).” The processing of the monitoring samples will extract and identify
all of the fish larvae and invertebrate larval stages specified in the Policy, but will not include the
processing of fish eggs. There are several reasons for not processing fish eggs:
a) It is very difficult or impossible without considerable additional analysis to determine if
all of the collected eggs are fertilized and viable. Many of the eggs released by female
fishes into the water column during spawning are never fertilized. The chance of
fertilization depends on many factors such as the proximity and abundances of males, and
ocean conditions. The entrainment of unfertilized eggs has no effect on these fish
populations and should not be included in the sample processing and analysis.
b) Positive identification of a majority of fish eggs to lower taxonomic levels is not possible.
Many species within a family or order of fishes have eggs of similar sizes and
morphological characteristics, especially at very early developmental stages.
c) The majority of the fish larvae entrained at MGS are from fishes that do not have a
planktonic egg stage. The goby and blenny larvae that dominate the ichthyoplankton in
coastal embayments in California such as Channel Islands Harbor are hatched from nests
where the eggs are attached to various substrates or protected in burrows.
d) Finally, there are numerous modeling approaches for estimating the levels of egg
entrainment for fish larvae with planktonic egg stages that may be collected during the
entrainment sampling. While there are levels of uncertainty associated with these
modeling techniques the uncertainty is usually quantifiable, which is not the case with
determining the percentage of unfertilized eggs that cannot be sourced to a specific
species of fish.
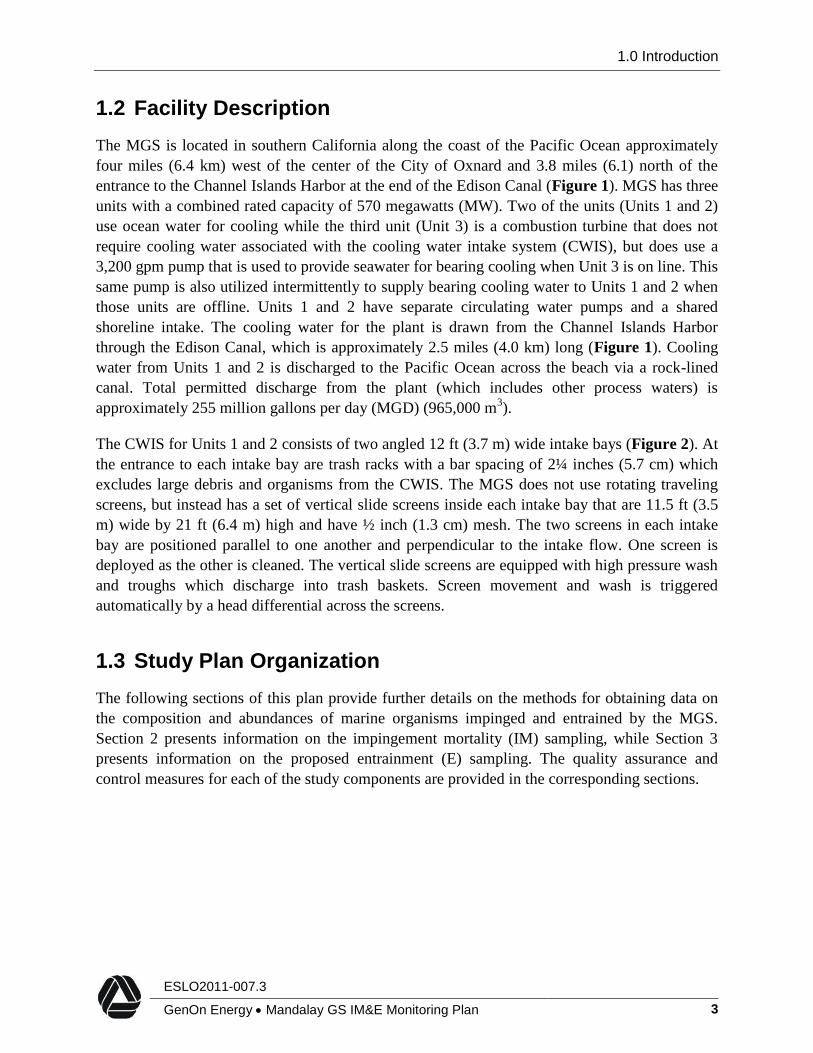
1.0 Introduction
ESLO2011-007.3 GenOn Energy Mandalay GS IM&E Monitoring Plan 3
1.2 Facility Description The MGS is located in southern California along the coast of the Pacific Ocean approximately
four miles (6.4 km) west of the center of the City of Oxnard and 3.8 miles (6.1) north of the
entrance to the Channel Islands Harbor at the end of the Edison Canal (Figure 1). MGS has three
units with a combined rated capacity of 570 megawatts (MW). Two of the units (Units 1 and 2)
use ocean water for cooling while the third unit (Unit 3) is a combustion turbine that does not
require cooling water associated with the cooling water intake system (CWIS), but does use a
3,200 gpm pump that is used to provide seawater for bearing cooling when Unit 3 is on line. This
same pump is also utilized intermittently to supply bearing cooling water to Units 1 and 2 when
those units are offline. Units 1 and 2 have separate circulating water pumps and a shared
shoreline intake. The cooling water for the plant is drawn from the Channel Islands Harbor
through the Edison Canal, which is approximately 2.5 miles (4.0 km) long (Figure 1). Cooling
water from Units 1 and 2 is discharged to the Pacific Ocean across the beach via a rock-lined
canal. Total permitted discharge from the plant (which includes other process waters) is
approximately 255 million gallons per day (MGD) (965,000 m3).
The CWIS for Units 1 and 2 consists of two angled 12 ft (3.7 m) wide intake bays (Figure 2). At
the entrance to each intake bay are trash racks with a bar spacing of 2¼ inches (5.7 cm) which
excludes large debris and organisms from the CWIS. The MGS does not use rotating traveling
screens, but instead has a set of vertical slide screens inside each intake bay that are 11.5 ft (3.5
m) wide by 21 ft (6.4 m) high and have ½ inch (1.3 cm) mesh. The two screens in each intake
bay are positioned parallel to one another and perpendicular to the intake flow. One screen is
deployed as the other is cleaned. The vertical slide screens are equipped with high pressure wash
and troughs which discharge into trash baskets. Screen movement and wash is triggered
automatically by a head differential across the screens.
1.3 Study Plan Organization The following sections of this plan provide further details on the methods for obtaining data on
the composition and abundances of marine organisms impinged and entrained by the MGS.
Section 2 presents information on the impingement mortality (IM) sampling, while Section 3
presents information on the proposed entrainment (E) sampling. The quality assurance and
control measures for each of the study components are provided in the corresponding sections.

1.0 Introduction
ESLO2011-007.3 GenOn Energy Mandalay GS IM&E Monitoring Plan 4
Figure 1. Mandalay Generating Station source water area based on NOAA, USACE, and GIS
data and proposed entrainment sampling location.
EEnnttrraaiinnmmeenntt SSaammpplliinngg LLooccaattiioonn

1.0 Introduction
ESLO2011-007.3 GenOn Energy Mandalay GS IM&E Monitoring Plan 5
Figure 2. Mandalay Generating Station plant site and intake area.
IInnttaakkee SSttrruuccttuurree
EEddiissoonn CCaannaall
MMGGSS DDiisscchhaarrggee

2.0 Impingement Mortality
ESLO2011-007.3 GenOn Energy Mandalay GS IM&E Monitoring Plan 6
2.0 Impingement Mortality Sampling
The purpose of the impingement sampling is to provide data for estimating the composition and
abundance of juvenile and adult fishes and shellfishes (e.g., rock crabs, lobsters, and squid)
impinged by the MGS CWIS traveling screens. The sampling is designed to provide estimates of
the abundance, biomass, taxonomic composition, diel periodicity, and seasonality of organisms
impinged at the MGS in compliance with the guidelines for the design of impingement
monitoring provided in Sections 4.(A).1.ad of the policy. The data from the sampling will be
used to estimate impingement rates (i.e., number and biomass of organisms per water volume
flowing per time into the plant) for the various species of fishes and shellfishes impinged. The
impingement rate is subject to tidal and seasonal influences that vary on several temporal scales
(e.g., hourly, daily, and monthly), while the rate of cooling water flow varies with power plant
operations and can change at any time.
2.1 Impingement Sample Collection In compliance with guidelines in the Policy, the sampling would be conducted for a period of 36
months, with sampling occurring four times over a 24-hour period one day per month to assess
both seasonal and diel variation. Before each sampling effort, the vertical screens will be sprayed
clean of all impinged debris and organisms. The troughs and collection baskets will also be
cleaned before the start of each sampling effort. The operating status of the circulating water
pumps on an hourly basis will be recorded during the collection period. Each 24-hour sampling
period will be divided into four 6-hour cycles. The vertical screens will remain stationary for a
period of 5.75 hours then they will be exchanged and washed for 15 minutes. The impinged
material from the screen will be rinsed into the collection baskets associated with each set of
screens. If during the 24-hour sampling an extreme event occurs resulting in the impingement of
a large number of fishes, sampling may continue for an additional 24 or 48 hours to obtain a
more representative estimate of the impingement rate for the sampling period. Based on
historical impingement data, an extreme impingement event during normal operation
impingement sampling would be defined as a sample comprised of greater than 200 fishes and/or
200 shellfishes impinged in a 24-hour normal operation survey. Large numbers of organisms in
the samples could potentially result from the impingement of a school of fish (such as anchovies
or sardines) that would not necessarily reflect normal conditions for the sampling period. The
data from the additional sampling would be averaged to provide an estimate that is more
representative of normal conditions. As required under the Policy, the sampling will not result in
any additional mortality than would already have occurred under normal operating conditions.
If it is necessary to exchange and clean the vertical screens more frequently than the 6-hour
sampling cycle due to high debris loading or other factors, then sampling will either be curtailed
or coordinated with the intake crew so samples can be collected safely. A log containing hourly
observations of the operating status (on or off) of the circulating water pumps for the entire study

2.0 Impingement Mortality
ESLO2011-007.3 GenOn Energy Mandalay GS IM&E Monitoring Plan 7
period will be obtained from the power plant operation staff. This will provide a record of the
amount of cooling water pumped by the plant, which will then be used to calculate impingement
rates.
Impingement sampling will also be conducted during any heat treatment operations at MGS.
Procedures for heat treatment will involve clearing and rinsing the vertical screens prior to the
start of the heat treatment procedure. At the end of the heat treatment procedure normal pump
operation will be resumed and the screens rinsed until no more dead fish are collected on the
screens. Processing of the samples will occur using the same procedures used for normal
impingement sampling.
Depending on the number of individuals of a given target species present in the sample, one of
two specific procedures will be used, as described below. Each of these procedures involves the
following measurements and observations:
1. The appropriate linear measurement for individual fish and shellfish will be determined
and recorded. These measurements will be recorded to the nearest 1 mm (0.04 in). The
following standard linear measurements are used for the animal groups indicated:
Fishes - Total body length for sharks and rays and standard lengths for bony fishes.
Crabs - Maximum carapace width.
Shrimps & Lobsters - Carapace length, measured from the anterior margin of
carapace between the eyes to the posterior margin of the carapace.
Octopus - Maximum “tentacle” spread, measured from the tip of one tentacle to the
tip of the opposite tentacle.
Squid – Dorsal mantle length, measured from the edge of the mantle to the posterior
end of the body.
2. The wet body weight of individual animals will be determined after shaking loose water
from the body. Total weight of all individuals combined will be determined in the same
manner. All weights will be recorded to the nearest gram (0.035 ounce).
3. The qualitative body condition of individual fishes and shellfishes will be determined and
recorded, using codes for decomposition and physical damage.
4. Other shellfishes not listed above, and other macroinvertebrates will be identified to
species and their presence recorded, but will not be measured or weighed. Rare
occurrences of other impinged animals, such as dead marine birds, will also be recorded.
5. The amount and type of debris (e.g., mussel shell fragments, wood fragments, eelgrass,
etc.) and any unusual operating conditions in the screen well system will be noted by
writing specific comments in the “Notes” section of the data sheet. Information on
weather, tide and sea conditions will also be recorded during each collection.
The following specific procedures will be used for processing fishes and shellfishes when the
number of individuals per species in the sample or subsample is ≤ 30:
2.0 Impingement Mortality
ESLO2011-007.3 GenOn Energy Mandalay GS IM&E Monitoring Plan 8
For each individual of a given species the linear measurement, weight, and body
condition codes are determined and recorded.
The following specific subsampling procedures will be used for fishes and shellfishes when the
number of individuals per species is >30:
The linear measurement, individual weight, and body condition codes for a random
subsample of 30 individuals will be recorded individually on the data sheet. The
individuals selected for measurement will be selected after spreading out all of the
individuals in a sorting container, making sure that they are well mixed and not
segregated into size groups. Individuals with missing heads or other major body parts will
be eliminated from consideration, since their linear measurements are not representative.
The total number and total weight of all the remaining individuals combined will be
determined and recorded separately.
2.2 Quality Control Program A quality control (QC) program will be implemented to ensure that all of the organisms are
removed from the debris and that the correct identification, enumeration, length and weight
measurements of the organisms are recorded on the data sheets. Random cycles will be chosen
for QC re-sorting to verify that all the collected organisms were removed from the impinged
material. Quality control surveys will be done 1 to 2 times per year or on a more frequent basis if
necessary during the study. If the count, length measurement or weight of any of the individual
taxon made during the QC survey varies by more than 5 percent (or one if the total number of
individuals is less than 20) from the count recorded by the observer then the rest of the sampling
cycles for that set of observers during that survey will be checked.
The survey procedures will also be reviewed with all personnel prior to the start of the study and
all personnel will be given printed copies of the procedures that will also be included with the
final IM&E study report. Procedures will also be reviewed with survey personnel on a quarterly
basis and with any new personnel starting work on the project.

3.0 Entrainment
ESLO2011-007.3 GenOn Energy Mandalay GS IM&E Monitoring Plan 9
3.0 Entrainment Sampling
The purpose of the entrainment study is to provide data for estimating the composition and
abundance of ichthyoplankton and invertebrate meroplankton entrained by the MGS. The
sampling is designed to provide estimates of the abundance, biomass, taxonomic composition,
diel periodicity, and seasonality of organisms entrained through the ½ inch (1.27 cm) mesh
vertical screens at the MGS intake in compliance with the guidelines for the design of
entrainment monitoring provided in Section 4.(B).1.a) and 4.(B).1.b) of the policy. The data from
the sampling will be used to estimate the concentration of the organisms entrained which can
then be extrapolated to estimate the numbers of organisms entrained based on actual, design, or
projected cooling water volumes. The concentrations of organisms in the source water subject to
entrainment vary on several temporal scales (e.g., hourly, daily, and monthly), and due to ocean
conditions, while the rate of cooling water flow varies with power plant operations and can
change at any time.
3.1 Entrainment Sample Collection In compliance with guidelines in the Policy, the sampling will be conducted for a period of 36
months, with sampling occurring four times over a 24-hour period one day per month to assess
both seasonal and diel variation. The sampling will be conducted at the entrance to the intake,
which at MGS is defined to be the entrance to the Edison Canal (Figure 1). One sample will be
collected every six hours using 335-micron mesh plankton nets, the mesh size specified in the
Policy, fixed to a bongo frame that allows collection of samples in both nets during a tow. This
size mesh is designed to collect ichthyoplankton, and the megalops and phyllosoma larval stages
of crustaceans (crabs and lobster), and squid paralarvae. These are the fractions of the
meroplankton that will be used in determining compliance with the entrainment reductions in the
Policy as specified in Section 2.A.(2).b.(ii). The frame and nets will be towed through the entire
water column from the surface to near the bottom. A calibrated flowmeter will be attached at the
opening of each net to record the volume of water filtered. Prior to and after each tow, the
flowmeter counter values will be recorded on a sequenced waterproof datasheet to allow a
calculation of the volume of water filtered during each sample, with a target volume of 20-30 m3
(5,300–8,000 gallons) per net. The nets will be moved up and down through the water column
until the target volume has been filtered. After the nets are retrieved, the readings from the
flowmeters will be recorded and the contents of each net will be washed down into the collection
bucket (codend) at the end of the net by gently spraying from the outside of the net to insure that
any organisms in the spray do not enter the net. The contents from the codends will then be
decanted into pre-labeled sample containers and preserved with alcohol or buffered formalin-
seawater solution. The contents of both nets will be preserved together as in a single sample. The
date, time, flowmeter readings, sampling personnel and sampling conditions (ocean and weather
conditions) will be recorded on a sequenced waterproof datasheet along with a unique code that
will be used to identify and track the sample in the laboratory and the data management systems.

3.0 Entrainment
ESLO2011-007.3 GenOn Energy Mandalay GS IM&E Monitoring Plan 10
All samples will be recorded on a sample chain of custody form and delivered to the laboratory
for recording and processing.
Sampling will also be done to comply with the requirement in the Policy (Section 4.B.(1)) that
“..additional samples shall also be collected using a 200-micron mesh to provide a broader
characterization of other meroplankton entrained.” One meroplankton sample will be collected
during one of the nighttime six-hour sample cycles by towing a frame with a single 200-micron
mesh net towed in the same fashion as the bongo frame and nets. Calibrated flowmeters will be
attached at the mouth of the net to record the volume of ocean water filtered. The target volume
for each sample will be 10–20 m3 (2,600–5,300 gallons). The contents from the codend will then
be decanted into a pre-labeled sample container and preserved with alcohol or buffered formalin-
seawater solution. The date, time, flowmeter readings, sampling personnel and sampling
conditions (ocean and weather conditions) will be recorded on a sequenced waterproof datasheet
along with a unique code that will be used to identify and track the sample in the laboratory and
the data management systems. All samples will be recorded on a sample chain of custody form
and delivered to the laboratory for recording and processing.
3.2 Entrainment Sample Processing The 335-micron and 200-micron mesh samples will be returned to the laboratory, and after
approximately 72 hours any of the samples preserved in the formalin-seawater solution will be
transferred into 70–80% ethanol. Processing of the 335-micron mesh samples will consist of
examining the collected material under a dissecting microscope, and removing and counting
larval fishes, megalopal stages of cancrid crabs, spiny lobster phyllosome larvae, and squid
paralarvae. These organisms will be placed in labeled vials and then identified to the lowest
taxonomic level possible. In addition, the developmental stage of fish larvae (yolk-sac,
preflexion, flexion, postflexion, transformation) will be recorded on the data sheet. The entire
volume of filtered material from the sample will be sorted unless the plankton volume is very
high, in which case the sample may be subdivided and a subsample processed. The estimated
concentration of organisms from these samples will be adjusted to account for the volume sorted.
Many larval fish cannot be identified to the species level; these fish will be identified to the
lowest taxonomic classification possible (e.g., genus and species are lower orders of
classification than order or family). Overall body shape, myomere count, and pigmentation
patterns are used to identify many species; however, this can be problematic for some species.
For example, different species members of one common group of fishes, gobies (Family
Gobiidae), share similar characteristics during early life stages, making visual identification of
the separate species difficult (Moser 1996). In these cases the unidentified species will be
grouped into higher taxonomic categories.
The 200-micron mesh meroplankton sample will be poured into a glass beaker to a known
volume and the sample mixed so that all organisms are distributed randomly in the sample

3.0 Entrainment
ESLO2011-007.3 GenOn Energy Mandalay GS IM&E Monitoring Plan 11
volume. Approximately 15 percent of the original sample volume will be analyzed for
meroplankton identification. For example, with a 400 ml sample, four 15 ml aliquots will be
withdrawn using with a Hensen-Stempel pipette and placed in a Ward plankton wheel.
Depending on the organism concentration, the samples may be split first using a Folsom
plankton-splitter. The organisms in the sample will be examined and compared against a list of
broad categories of larval stages and taxonomic groups. The items on the list that are found in the
sample will be recorded as percent.
3.3 Data Management, and Quality Assurance/Quality Control Field and laboratory data will be recorded on preprinted data sheets formatted for entry into a
computer database for analysis and archiving. All field and laboratory data recorded on
sequenced datasheets will be entered into an Access® computer database that will be verified for
accuracy against the original data sheets.
A QA/QC program will be implemented for the field and laboratory components of the study.
The field survey procedures will be reviewed with all personnel prior to the start of the study and
all personnel will be given printed copies of the procedures that will be included with the final
study report. In addition to ongoing training and periodic review of sampling procedures, quality
control assessments will be completed once or twice during each year of the study to ensure that
the field sampling continues to be conducted properly.
A detailed QA/QC program will also be applied to all laboratory processing. The laboratory
procedures will be reviewed with all personnel prior to the start of the study and all personnel
will be given printed copies of the procedures that will be included with the final study report.
The first ten samples sorted by an individual will be re-sorted by a designated quality control
(QC) sorter. A sorter is allowed to miss a maximum of one fish larva when the total number of
larvae in the sample is less than 20. For samples with 20 or more larvae the sorter must maintain
a sorting accuracy of 90 percent. After a sorter has sorted ten consecutive samples with greater
than 90 percent accuracy, the sorter will have one of their next ten samples randomly selected for
a QA/QC check. If the sorter fails to achieve an accuracy level of 90 percent, their next ten
samples will be re-sorted by the QC sorter until they meet the required level of accuracy. If the
sorter maintains the required level of accuracy, one of their next ten samples will be re-sorted by
QC personnel.
A QA/QC program will be conducted for the taxonomists identifying the samples. After a
taxonomist has identified the larvae from 10 samples, one sample is randomly chosen and the
larvae are re-identified and counted by a second taxonomist. The taxonomic results are compared
between the two taxonomists by comparing the number of identification and count agreements
between the two taxonomist, and then calculating a percent taxonomic disagreement (PTD). The
error rate is quantified as the proportion of individual specimens in the sample identified or
counted differently by the two taxonomists. A PTD goal of ≤10 percent is targeted. If the PTD

3.0 Entrainment
ESLO2011-007.3 GenOn Energy Mandalay GS IM&E Monitoring Plan 12
goal of 10 percent is not attained, taxonomist interaction is used to determine problem areas,
identify consistent disagreements, and define corrective actions. If the first taxonomist maintains
a PTD goal of ≤10 percent then they will continue to have one of each of their next ten samples
checked by a second taxonomist. If they fall below this level, then the next ten consecutive
samples they have identified will be checked for accuracy by a second taxonomist.
Identifications will be verified with taxonomic voucher collections maintained by Tenera.

4.0 Literature Cited
ESLO2011-007.3 GenOn Energy Mandalay GS IM&E Monitoring Plan 13
4.0 Literature Cited
Moser, H.G., ed. 1996. The early stages of fishes in the California Current Region. CalCOFI
Atlas No. 33. Allen Press, Inc., Lawrence, KS. 1,505 p.
Steinbeck, J. R., J. Hedgepeth, P. Raimondi, G. Cailliet, and D. L. Mayer. 2007. Assessing
power plant cooling water intake system entrainment impacts. Report to California Energy
Commission. CEC-700-2007-010. 105 pp plus appendices.

Exhibit C

Alternative Flow Reduction Technology Evaluation for GenOn’s Mandalay Generating Station and Ormond Beach Generating Station
Page 1 of 1
Technology1 Design Concept Description Design and Operation IM&E Reduction Information Used to Determine
Performance Potential Application
at GenOn Stations
1. Variable Frequency Drives- (VFD)s
Install variable frequency drives on existing circulating water pumps.
Drives allow the operation of circulating water pumps at less than 100% speed, which results in a reduction in flow at less than 100% plant load.
Entrainment is assumed to be reduced in proportion to any reduction in the required quantity of cooling water. Reduction in impingement is also likely to occur.
Vendor information, Operational experience
Yes – technology selected for supplemental evaluation
2. Variable-speed Fluid Turbo Couplings
Install variable-speed fluid turbo couplings on existing circulating water pumps.
Speed control offers higher efficiency compared to throttle control during plant part-load operation.
Coupling acts to vary the speed of cooling water pumps to selectively reduce the usage of cooling water.
Entrainment is assumed to be reduced in proportion to any reduction in the required quantity of cooling water. Reduction in impingement is also likely to occur.
Vendor information
No, similar to VFDs, but VFD preferred based on more operating experience
3. Two-speed Pumps Two -speed pumps allow for two withdrawal rates, which will offer reduced flow during partial load operation.
Similar concept to variable-speed fluid turbo couplings and VFDs, however less flexibility in withdrawal rates; only two flow rate options.
Entrainment is assumed to be reduced in proportion to any reduction in the required quantity of cooling water. Reduction in impingement is also likely to occur.
Vendor information, Operational experience
No, VFDs provide more flexibility
4. Circulating Water Pump Recirculation
Redirection of flow from the circulating water pump discharge back to the intake.
This will result in less ocean water withdrawal.
Recirculation of a portion of the intake water reduces ocean water withdrawal. This alternative will not increase the temperature of the intake water.
Assumed reduction in E is proportional to the reduction in ocean water used Theoretical
Yes, this approach was studied and found to be potentially effective
5. Condenser Cooling Water Recirculation
Redirection of flow from condenser discharge back to the intake.
This will result in less ocean water withdrawal.
Cooling water temperature will increase, possibly affecting generating capacity. Reduction in flow limited by permitted outfall temperature.
Assumed reduction in E is proportional to the reduction in ocean water used Operational experience
No, circ water pump recirculation would be a superior choice.
Notes: CWIS = cooling water intake structure E = Entrainment fps = feet per second I = Impingement IM = Impingement Mortality O & M = Operation and Maintenance
1 Or combination of these technologies

Exhibit D

Screening and Other Aquatic Impact Reduction Technology Evaluation for GenOn’s Mandalay Generating Station and Ormond Beach Generating Station
Page 1 of 5
Technology1 Design Concept Description Design and Operation IM&E Reduction Information Used to
Determine Performance
Potential Application at GenOn Stations
1. Ristroph-type Traveling Screens (finer-mesh)
Ristroph-type vertical traveling screens with smooth finer-mesh wire, low-pressure fish spray header, and fish return system
Designed to exclude smaller organisms. Fish return is required. Susceptible to clogging and fouling. Through-screen velocity and head loss may significantly increase. Increase in O & M costs. Screens as fine as 0.5 mm are operating successfully.
Reduces E by increasing I. May improve I survival by limiting physical damage to organisms during I. Survival of organisms may be an issue for very early lifestages and fragile species.
USEPA, EPRI,
Vendor information,
Operational experience
Retrofit into existing intake structure would be difficult at both stations; required fish return system is a significant design issue at both stations,
2. Modified Ristroph-type Dual Flow Traveling Screen
Traveling water screens oriented perpendicular to the flow of water into the screenhouse. May increase screening area compared to through-flow screens. Eliminates carry over.
Designed to exclude smaller organisms. Larger traveling screens may require additional water and electric power supply for operation and control and modification to the screen house. Fish return is required. Screens as fine as 0.5 mm are operating successfully.
Increased screen area will reduce through-screen velocity. Modifications with finer mesh and fish handling features can decrease E and IM.
Survival of organisms may be an issue for very early lifestages and fragile species.
USEPA, EPRI,
Vendor information,
Operational experience
Retrofit into existing intake structure may be more difficult at both stations than Ristroph screen depending on the screen width selected; required fish return system is a significant design issue at both stations
3. Modified Ristroph-type Traveling Screen with Finer-Mesh Overlays or Interchangeable Panels
Ristroph-type vertical traveling screens with interchangeable smooth standard mesh and finer-mesh wire, low-pressure fish spray header, and fish return system. Potentially allows for seasonal use of finer-mesh during periods of high E.
Designed to exclude smaller organisms. Fish return is required. Susceptible to clogging and fouling. Through-screen velocity and head loss may significantly increase. Increased O & M costs. These issues are partially mitigated by seasonal use.
Dual flow screen arrangement may mitigate through-screen velocity and head loss issues. Screens as fine as 0.5 mm are operating successfully
Will reduce E but may cause additional I; survival of organisms may be an issue for very early lifestages and fragile species.
USEPA, EPRI,
Vendor information,
Operational experience
Retrofit into existing intake structure would be difficult at both stations; required fish return system is a significant design issue at both stations
4. Finer-mesh Drum Screens
Redesign existing CWIS with partially submerged drum-shaped screens; filter drum rotating around a central horizontal axis in a completely redesigned CWIS.
Capable of reducing IM and E as physical barriers excluding fish or other organisms from the circulating water flow. No operating experience with finer-mesh design at a large power plant. Will need to combined with method to control CWIS fouling, such as special coatings or materials to minimize biological growth, as conventional heat treatment would not be possible.
Biological effectiveness is contingent on screen orientation and availability of a suitable bypass and fish return system.
Fine screen mesh must be used to reduce E. Survival of organisms may be an issue for very early lifestages and fragile species.
Vendor information, Operational experience overseas and US hydroelectric facilities
Insufficient operating experience to consider for application at this time. Retrofit into existing intake structure would be difficult at both stations; required fish return system is a significant design issue at both stations.
5. Cylindrical Wedgewire Screens
An array of wedgewire screens installed on the sea floor, on other in-water structures, or from a new bulkhead in front of the existing CWIS. Sized to maintain a <0.5 fps through-slot velocity for optimum performance.
These screens using wide slots are currently used at both large and small power plants with good to excellent biological effectiveness related to IM. No narrow-slot installation at large power facilities.
Uses both physical and hydrodynamic exclusion. A sweeping flow past the screens is important to carry aquatic organisms and debris past the screens. The current velocity can be provided by fish pumps or ocean currents. Cost savings for mechanical equipment and maintenance costs. Biofouling and clogging may be a problem; a debris back flushing system may be needed. Will need to combined with method to control CWIS fouling, such as special coatings or materials to minimize biological growth, as conventional heat treatment would not be possible.
Screen approach velocity exerts only a very short zone of influence moving away from the screens, which reduces I.
The screen incorporates flow-shaping internals which maintain a fairly uniform velocity across the screen surface, eliminating concentrated high velocity areas.
Wide-slot screens eliminate IM with low through-slot velocity. Fine slots reduces E.
USEPA, EPRI,
Vendor information,
Operational experience, pilot studies
Yes- technology selected for further evaluation. Most practical technology for retrofit to existing intake structures; ensuring sufficient sweeping flow not a significant issue at OBGS, but could present challenges at Mandalay due to installation at the end of a canal. May have application at the entrance to the Mandalay canal.
1 Or combination of these technologies

Screening and Other Aquatic Impact Reduction Technology Evaluation for GenOn’s Mandalay Generating Station and Ormond Beach Generating Station
Page 2 of 5
Technology1 Design Concept Description Design and Operation IM&E Reduction Information Used to
Determine Performance
Potential Application at GenOn Stations
6. Stationary Angled Flat-panel Finer-mesh Screens (Woven Mesh or Wedgewire Screens)
Install angled flat-panel finer-mesh screens or wedgewire screens to guide fish and debris into a bypass.
Cost savings for mechanical equipment. Maintenance costs will increase. Limited use for US power plant intakes.
Angled screens divert fish from intake. Fish pumps and bypass flow would be required. Biofouling and clogging may be a problem; cleaning system would be needed.
Relies on the swimming ability of fish to guide into fish bypass to avoid IM. Finer-mesh screens would likely reduce E by acting as a physical barrier that excludes most life stages of fish and shellfish. However, IM of larvae may increase. More surface area than cylindrical wedgewire arrangement will result in lower through-screen velocity.
Operational experience
Retrofit into existing intake structure would be difficult at both stations; required fish return system is a significant design issue at both stationsf
7. Geiger Multi-Disc™ Screening System (Geiger Screens)
Install finer-mesh Geiger screens with fish collection system. The system is comprised of sickle-shaped panels rotating in a single plane. May provide an O&M benefit by eliminating debris carryover and reduced head loss.
Fish return is required.
Capable of higher travel speed than conventional screens. Improved debris handling. Could be installed in combination with cylindrical wedgewire at Ormond Beach to address debris issues from sloughing of fouling organisms inside intake tunnels. In this application no fish return would be necessary since IM&E addressed at intake with wedgewire screens.
A comparison of preliminary data on the survival of most of the fish impinged by the Geiger screen showed similar results to the modified Ristroph screens and therefore it is assumed that the biological efficacy is similar. Survival of organisms may be an issue for very early lifestages and fragile species, unless used specifically for debris handling.
EPRI, Vendor information, Operational experience
Retrofit into existing intake structure would be difficult at both stations; if system is used for IM&E purposes, required fish return system is a significant design issue at both stations
8. HydroloxTM Install finer-mesh HydroloxTM screens with fish return system. Similar to traditional traveling screens.
Available in a variety of mesh sizes.
Installed similarly to other traveling screens, but made of a lighter weight polymer. This material is not as strong as other screening material and may fail due to debris and head loss
May travel faster than a traditional screen, , which may result in other O&M issues due to increased fouling on screens that are always wet or submerged..
Effectiveness varies with species of fish, screen travel speed, through-screen velocity, fouling and debris, and maintenance of the system. Testing showed similar results to the modified Ristroph screens. Survival of organisms may be an issue for very early lifestages and fragile species.
Pilot study, Operational experience at a small facility
Insufficient operating experience to consider for application at this time. Retrofit into existing intake structure would be difficult at both stations; required fish return system is a significant design issue at both stations
9. Beaudrey Water Intake Protection (WIP) System
Install finer-mesh submersed Beaudrey WIP System with fish collection system.
Similar to Geiger screens, this technology eliminates debris carryover. This screen relies on a fish pump to remove fish and debris from the face of a circular screen.
Effectiveness varies with species of fish, screen travel speed, through-screen velocity, fouling and debris, and maintenance of the system.
Requires E survival study for fish pumps.
Ongoing studies at a power plant’s intake
Insufficient operating experience to consider for application at this time. Retrofit into existing intake structure would be difficult at both stations; required fish return system is a significant design issue at both stations
10. Aquatic Filter Barrier (AFB)
Barrier placed across the intake.
May be deployed for seasonal use.
Uses filter fabric to exclude aquatic organisms. May be floating, flexible, or fixed. Gunderboom MLES is one example.
Large area and bypass flow required.
Biofouling and clogging can be significant; may be controlled with an air purge system if adequate current flushing available.
High O&M.
Very low velocities protect organisms.
Little damage to fish eggs and larvae if drawn up against fabric.
Predators rapidly utilize fabric.
Still considered experimental; only full-scale use was at one river power plant (Gunderboom MLES has been tested at Unit 3 of Lovett Station, NY which is now decommissioned).
Removed at Bethlehem Energy Center in Albany NY due to failures.
No, lack of space and significant biofouling issues

Screening and Other Aquatic Impact Reduction Technology Evaluation for GenOn’s Mandalay Generating Station and Ormond Beach Generating Station
Page 3 of 5
Technology1 Design Concept Description Design and Operation IM&E Reduction Information Used to
Determine Performance
Potential Application at GenOn Stations
11. Seasonal Barrier Net or Screens
Net or screens placed across the intake.
May be deployed for seasonal use.
Finer-mesh nets must be used for additional E reduction.
Need large area for deployment.
Biofouling and clogging can be significant.
High O&M.
Physical exclusion depends of mesh size.
Finer-mesh design is an experimental technology.
Failed during a pilot test.
No, unproven E control
12. Substratum Intake Structure
An array of perforated intake piping buried below the seafloor; cooling water drawn and filtered through the substrate.
A porous stratum with high water conductance is needed. Large bottom area required to maintain low velocity. An engineering pilot test would be required.
Clogging of system may be an issue.
Very low velocity and fine pores reduces I & E. Experimental design. Unknown operation and I & E efficacy.
Vendor information
No, experimental; no operating experience; unproven E control; ability to apply this technology with volumes of water required is highly questionable.
13. Porous Dike (Rock Structure)
Also known as leaky dams or dikes. This is a filter surrounding the cooling water intake with a core consisting of cobble or gravel, allowing water to pass through. The dike acts as both a physical and behavioral barrier.
Biological effectiveness is life-stage-specific.
Lower design velocity requires larger dike area.
Can become clogged and backflushing is not feasible with porous dikes.
May provide habitat that would increase presence of certain fish species in the intake.
Biological effectiveness is life-stage-specific.
Predation of screened organisms may offset benefits.
Biological effectiveness and engineering practicability currently under study: resultshave been positive in the Great Lakes.
No, Very large structure required in order to minimize headloss and through-pore velocity. Unproven E control.
;
14. Filtrex Filter System (FFS)
Filtrex filters are columns of (typically) thermoplastic filter material with a variety of pore sizes available. Each column is relatively small, and a large array would be required for large withdrawal rates.
An array of Filtrex filters installed on the sea floor, or from a new bulkhead in front of the existing CWIS.
New technology which is still considered experimental and has not been deployed in the marine environment. Clogging may an issue.
Critical design parameters include flow requirements, available space, type and amount of debris, fouling, and effectiveness of the cleaning systems.
Large number of units needed to maintain low velocity.
High O & M predicted.
Very low through-filter velocity reduces IM.
Small openings to reduce E.
Although survival of impinged organisms has been shown to be low, there are significant overall reductions in I & E
Lab and limited field studies.
Untested at power plant intakes.
No, experimental; no operating experience
15. Eicher Screens (Vertically Angled Screens)
A complete redesign of the intakes with flat-panel wedgewire screens set at an angle to divert organisms to a fish pump system. The Eicher screen is a passive-pressure screen that is effective for diverting fish in hydroelectric penstocks, but was not designed for use at steam electric station cooling water intakes.
Designed for high velocities.
Fish pumps and bypass flow would be required.
Sweeps fish towards a bypass using higher flow velocities. Theoretically may be designed with finer slots to reduce E.
EPRI, Pilot study, Operational experience in hydroelectric penstocks
Insufficient operating experience to consider for application at this time. Retrofit into existing intake structure would be difficult at both stations; required fish return system is a significant design issue at both stations.
16. Modular Inclined Screens (MIS)
Redesign intake with surface MIS with a fish bypass. The MIS is designed to divert fish and debris at water velocities ranging from 2.0 to 10.0 fps.
Critical design parameters include flow requirements, available space, type and amount of debris, and fish diversion.
Fish pumps and bypass flow would be required.
Effectiveness depends on responsiveness of important fish species and the ability to survive the fish pump. Experimentally, juvenile fresh water fish were diverted.
Theoretically may be designed with finer slots to reduce E.
Although this technology has undergone lab and pilot testing, there are no full-scale MIS facilities in operation.
Insufficient operating experience to consider for application at this time. Retrofit into existing intake structure would be difficult at both stations; required fish return system is a significant design issue at both stations

Screening and Other Aquatic Impact Reduction Technology Evaluation for GenOn’s Mandalay Generating Station and Ormond Beach Generating Station
Page 4 of 5
Technology1 Design Concept Description Design and Operation IM&E Reduction Information Used to
Determine Performance
Potential Application at GenOn Stations
17. Other Media Filters
This group includes perforated pipes, artificial filter beds, and radial wells. Water is often drawn through filter media such as sand and stone.
Critical design parameters include flow requirements, available space, type and amount of debris, and fouling,
Clogging may be an issue.
Water flow requirements may limit application of some of these technologies.
Low O & M costs.
Fish pumps and bypass flow would be required.
Can be designed for very low inlet velocities. Very low velocity and fine pores reduces I & E.
A stone filter has been in used at a large power plant.
Radial wells have been reliably used for many years for obtaining highly filtered industrial and municipal water, but not for once-through cooling at power plants.
Perforated Pipes: Used by nine steam electric units in the US. Each unit uses closed-cycle cooling systems with low make-up intake flow ranging from 7 to 36 MGD.
Retrofit into existing intake structure would be difficult at both stations; required fish return system is a significant design issue at both stations
18. Bed-level Intake
Construct an off-shore bed-level intake opening.
A conglomerate of structurally independent pre-cast, reinforced concrete units, namely: centre-piece, non-porous modules, non-porous modules with a removable hatch, porous modules, peripheral porous modules, and peripheral corner porous modules.
The velocity of water through the slots near the centre piece would be between 0.5 and 1.5 fps. This velocity is <0.1 fps towards the perimeter of the intake structure.
Critical design parameters include: type of marine habitat and substrate encountered along pipeline route, flow requirements, type and amount of debris, cross currents, effectiveness of the cleaning systems, and fouling controls.
Low through-slot velocity reduces IM.
Reduction in E primarily achieved by moving intake away from high densities of susceptible organisms.
Operational experience
No, primarily relies on decreased numbers of organisms offshore to decrease E which is unlikely in this application
19. Louver System Install a system of vertical slats (louvers) that help direct organisms away from the intake to a fish pump system.
Critical design parameters include: flow requirements, type and amount of debris, cross currents, and the swimming ability of fish to avoid IM or E. Debris removal system may also need to be installed.
Fish pumps and bypass flow would be required.
This technology does not reduce larval E, may reduce juvenile E depending on the swimming ability of fish.
EPRI, Operational experience
No, not an effective E control. Retrofit into existing intake structure would be difficult at both stations; required fish return system is a significant design issue at both stations
20. Flow Velocity Enhancement System [FVES]
Install water jets to direct debris and organisms away from an intake structure to a bypass.
High velocity water creates a behavioral or diversion barrier that elicits an avoidance response.
Proven effective for debris. Testing needed as a fish deterrent system.
May induce fish to bypass intake.
Potential to move eggs/larvae off wedgewire or other screens to a bypass system.
Vendor information and some pilot testing
Insufficient operating experience. Not considered a primary control system; may potentially be applied with wedgewire or other stationary screens
21. Behavioral Barriers
Install behavioral barriers in front of the intake or intake canal, such as: light systems, air bubble curtains, acoustic barriers (sound), darkness/shading of intake, and light/sound hybrid barriers.
Behavioral barrier systems installed in front of the intake to induce an avoidance response to prevent fish from entering the intake or directing them to a bypass. Critical design parameters include: the swimming ability of fish and the behavioral response to the barrier.
May induce fish with swimming ability to avoid the intake. I control only; not used to reduce E. Some fish species are unresponsive or attracted to the barrier.
EPRI,
Pilot study, Operational experience
No. will not reduce E; testing at SONGS demonstrated most technologies were not effective.
22. Offshore Intake (Mandalay only)
Relocate CWIS offshore. Low intake velocity reduces IM. Reduction in E achieved by moving intake away from high densities of organisms. May be combined with wedgewire screens or velocity cap.
Critical design parameters include: type of marine habitat and substrate encountered along pipeline route, flow requirements, type and amount of debris, cross currents, effectiveness of the cleaning systems, distribution of organisms and fouling controls.
Eliminate IM with low velocity, Reduction in E primarily achieved by moving intake away from high densities of susceptible organisms.
USEPA, EPRI,
Vendor information,
Operational experience
No, primarily relies on decreased numbers of organisms offshore to decrease E which is unlikely in this application; approval for installation of offshore intake unlikely
Notes:

Screening and Other Aquatic Impact Reduction Technology Evaluation for GenOn’s Mandalay Generating Station and Ormond Beach Generating Station
Page 5 of 5
CWIS = cooling water intake structure E = Entrainment fps = feet per second I = Impingement IM = Impingement Mortality O & M = Operation and Maintenance

Exhibit E

OBGS and MGS Entrainment Estimates
ESLO2010-038.1
GenOn OBGS and MGS Entrainment Estimates 1
Entrainment Estimates for GenOn Ormond Beach and Mandalay Generating Stations
December 29, 2010
Prepared for: Prepared by:
Mr. Rick Eckersley Tenera Environmental GenOn 141 Suburban Rd., Suite A2 Houston, TX 77253 San Luis Obispo, CA 93401 805.541.0310
Introduction and Methods
The entrainment data on larval fishes collected during the February 2006–January 2007 studies
at the Ormond Beach (OBGS) and Mandalay (MGS) Generating Stations were used to calculate
hourly estimates of larval fish concentration for each of the taxonomic categories of fishes (taxa)
collected as well as the total for all fish larvae. Estimates of entrainment for each taxa at each
plant were calculated by multiplying the larval concentrations for each hour during the calendar
year by the actual flow volume for the corresponding hours for each day during 2006–2009.
Entrainment estimates using the hourly concentrations were also calculated for design flows and
the estimated flows for 2006–2009 if variable speed drive (VSD) circulators were in use. The
design flows for each circulating water pump at OBGS and MGS used in the calculations were
113,500 and 41,500 gpm, respectively. These values are less than the design flows of 119,000
and 44,000 gpm for OBGS and MGS, respectively, used in the entrainment estimates in the
ENSR reports. Therefore, the estimates of annual entrainment for design flow are less in this
report than the estimates reported by ENSR.
The daily estimates calculated using the various flows were summed for each month and over an
entire calendar year to allow comparison among the various estimates. The potential reductions
from both actual and design flow with the use of VSD circulators for 2006–2009 in absolute
entrainment and on a percentage basis were also calculated.
Results and Conclusions
The monthly and total annual entrainment estimates for the two plants for the most abundant fish
taxa and all larval fish combined using the different sources of flow data are provided in the
attached tables. The data for the total of all larval fish are provided in Tables 1 and 2.

OBGS and MGS Entrainment Estimates
ESLO2010-038.1
GenOn OBGS and MGS Entrainment Estimates 2
The differences in the entrainment estimates using actual flow for 2006–2009 reflect the
differences in flow among those years both in volume and in the periods of time the circulators
were in operation since the same larval concentrations were used in calculating the estimates for
all four years.
The entrainment estimates for all larval fishes combined for OBGS in Table 1 show that plant
cooling water flow was lower in 2009 than in the other three years. The actual entrainment
estimates for all four years were considerably less than the entrainment estimate calculated using
design flows. As a result, the reduction in the entrainment estimates using the VSD circulator
flows was considerably greater when compared to the design flow estimates and averaged over
92%.
The entrainment estimates for all larval fishes combined for MGS in Table 2 show that plant
cooling water flow was lower in 2006 and 2007 than in 2008 and 2009. The actual entrainment
estimates for all four years were all less than the entrainment estimate calculated using design
flows. As a result, the reduction in the entrainment estimates using the VSD circulator flows was
considerably greater when compared to the design flow estimates and averaged almost 90%.
The results show the large potential reductions in entrainment available through the use of VSD
circulators. The use of design flow as the baseline for compliance with the new state OTC Policy
requires that the VSDs be used in combination with an additional screening technology, but as
the results indicate, the performance of the screening technology may only have to provide
minimal levels of reduction since the use of VSDs alone meet the required levels of reduction
under the Track 2 compliance pathway. This will allow for much greater flexibility in achieving
compliance under the new Policy.

OBGS and MGS Entrainment Estimates
ESLO2010-038.1
GenOn OBGS and MGS Entrainment Estimates 3
Table 1. Monthly and total annual estimates of entrainment calculated using various flow data for Ormond Beach Generating Station
for all larval fishes combined. Below the entrainment estimates are the reductions in entrainment and the corresponding percentages
using the projected flow data for 2006–2009 that would occur if the plant was using variable speed drive circulators.
Month Actual Flow 2006 Actual Flow 2007 Actual Flow 2008 Actual Flow 2009
Average Actual
Flow 2006-2009 Design Flow
Projected VSD
Flow 2006
Projected VSD
Flow 2007
Projected VSD
Flow 2008
Projected VSD
Flow 2009
Jan 3,271 3,919 55,740 9,005 17,984 1,114,020 1,441 1,726 26,300 3,967
Feb 5,770 9,607 47,859 224,250 71,872 738,612 2,542 4,232 12,512 66,653
Mar 170,106 21,214 992,217 85,635 317,293 4,956,358 74,937 9,346 328,925 37,725
Apr 1,339,881 2,321,950 2,814,897 1,784,796 2,065,381 10,603,157 430,288 562,716 921,252 495,509
May 1,179,235 80,702 108,285 106,130 368,588 4,666,598 381,074 35,552 34,027 36,702
Jun 1,603,279 1,341,000 1,067,272 22,554 1,008,526 4,506,745 574,295 525,545 465,305 9,936
Jul 1,413,483 1,849,261 638,426 290,219 1,047,847 2,213,842 512,373 857,968 260,565 91,889
Aug 722,027 2,253,599 2,276,748 328,368 1,395,185 3,220,330 224,023 979,238 803,026 126,871
Sep 691,684 1,679,070 1,396,304 1,402,521 1,292,395 2,450,067 364,294 801,503 548,910 409,831
Oct 41,936 392,177 239,855 189,965 215,983 1,080,127 18,474 124,292 83,010 59,528
Nov 36,600 324,329 360,592 4,237 181,440 1,388,332 16,123 122,459 118,039 1,867
Dec 6,106 244,638 270,970 2,977 131,173 1,526,067 2,690 107,385 99,782 1,312
Total 7,213,376 10,521,466 10,269,163 4,450,658 8,113,666 38,464,252 2,602,554 4,131,962 3,701,653 1,341,790
VSD Reductions in Entrainment from Actual Flows
VSD Reduction 2006 4,610,822
% Reduction 2006 63.92%
VSD Reduction 2007 6,389,504
% Reduction 2007 60.73%
VSD Reduction 2008 6,567,510
% Reduction 2008 63.95%
VSD Reduction 2009 3,108,868
% Reduction 2009 69.85%
Average Reduction 64.61%
VSD Reductions in Entrainment from Design Flows
VSD Reduction 2006 35,861,698
% Reduction 2006 93.23%
VSD Reduction 2007 34,332,291
% Reduction 2007 89.26%
VSD Reduction 2008 34,762,599
% Reduction 2008 90.38%
VSD Reduction 2009 37,122,462
% Reduction 2009 96.51%
Average Reduction 92.34%

OBGS and MGS Entrainment Estimates
ESLO2010-038.1
GenOn OBGS and MGS Entrainment Estimates 4
Table 2. Monthly and total annual estimates of entrainment calculated using various flow data for Mandalay Generating Station for all
larval fishes combined. Below the entrainment estimates are the reductions in entrainment and the corresponding percentages using
using the projected flow data for 2006–2009 that would occur if the plant was using variable speed drive circulators.
Month Actual Flow 2006 Actual Flow 2007 Actual Flow 2008 Actual Flow 2009
Average Actual
Flow 2006-2009 Design Flow
Projected VSD
Flow 2006
Projected VSD
Flow 2007
Projected VSD
Flow 2008
Projected VSD
Flow 2009
Jan 353,104 881,802 2,679,650 4,276,023 2,047,645 6,731,911 81,635 313,176 1,127,734 1,492,177
Feb 3,075,835 430,188 6,153,840 11,893,115 5,388,245 32,645,222 970,629 155,490 1,790,618 4,186,040
Mar 1,299,988 1,290,813 3,467,361 5,849,182 2,976,836 12,873,889 490,697 477,493 1,362,641 2,083,258
Apr 952,147 1,006,554 4,503,758 3,627,060 2,522,379 15,660,213 307,215 366,776 1,698,642 1,308,845
May 5,317,127 5,292,954 2,749,458 5,552,478 4,728,004 11,781,286 2,024,108 1,860,760 965,199 2,025,277
Jun 1,008,185 1,248,012 982,113 64,326 825,659 2,495,792 384,656 424,212 274,725 22,170
Jul 3,282,943 2,716,356 1,986,566 2,525,384 2,627,812 4,555,247 1,298,070 953,278 776,414 987,018
Aug 5,336,603 7,421,263 7,488,839 1,437,082 5,420,947 11,488,592 1,811,643 2,345,138 2,240,672 486,938
Sep 3,290,539 2,583,067 5,011,187 6,397,313 4,320,527 9,649,061 1,160,113 878,600 1,525,961 2,616,434
Oct 28,349 3,451,525 4,667,585 3,049,089 2,799,137 7,370,265 10,247 1,172,880 1,591,846 976,406
Nov 2,615,680 1,736,798 6,686,469 1,887,744 3,231,673 8,544,839 999,145 606,352 2,306,869 602,916
Dec 2,497,043 2,610,567 3,796,615 3,227,538 3,032,941 9,292,499 934,935 1,041,138 1,257,989 1,020,184
Total 29,057,544 30,669,899 50,173,441 49,786,334 39,921,805 133,088,817 10,473,093 10,595,291 16,919,308 17,807,664
VSD Reductions in Entrainment from Actual Flows
VSD Reduction 2006 18,584,451
% Reduction 2006 63.96%
VSD Reduction 2007 20,074,608
% Reduction 2007 65.45%
VSD Reduction 2008 33,254,134
% Reduction 2008 66.28%
VSD Reduction 2009 31,978,670
% Reduction 2009 64.23%
Average Reduction 64.98%
VSD Reductions in Entrainment from Design Flows
VSD Reduction 2006 122,615,724
% Reduction 2006 92.13%
VSD Reduction 2007 122,493,526
% Reduction 2007 92.04%
VSD Reduction 2008 116,169,509
% Reduction 2008 87.29%
VSD Reduction 2009 115,281,153
% Reduction 2009 86.62%
Average Reduction 89.52%

OBGS and MGS Entrainment Estimates
ESLO2010-038.1
GenOn OBGS and MGS Entrainment Estimates 5
Monthly and total annual estimates of entrainment calculated using various flow data
for Ormond Beach and Mandalay Generating Station for most abundant taxonomic
categories of larval fish and all larval fishes combined based on actual flows during
2006–2009, design flow, and projected flows for the same years if the plant was using
variable speed drive circulators.

OBGS Entrainment Estimates and Projected VSD Reductions for Total Fish Larvae and Top Ten Fishes Entrained
anchovies white croaker
northern
lampfish blennies
California
smoothtongue diamond turbot queenfish sanddabs
California
halibut gobies
Month
Total Fish
Larvae Engraulidae
Genyonemus
lineatus
Stenobrachius
leucopsarus
Hypsoblennius
spp
Leuroglossus
stilbius
Hypsopsetta
guttulata
Seriphus
politus
Citharichthys
spp
Paralichthys
spp CIQ gobies
Actual Flow 2006
Jan 3,271 256 256 237 0 0 105 0 617 711 609
Feb 5,770 109 1,193 1,790 0 0 0 0 0 0 0
Mar 170,106 0 43,492 119 0 21,726 13,647 0 11,238 0 7,267
Apr 1,339,881 321,576 429,340 147,341 9,266 23,445 22,049 7,940 6,199 19,027 6,402
May 1,179,235 962,502 0 99,287 2,190 0 0 0 10,196 33,234 0
Jun 1,603,279 1,243,833 0 40,874 152,203 0 0 0 0 0 15,350
Jul 1,413,483 929,438 0 44,188 118,109 0 0 14,339 0 124,290 63,549
Aug 722,027 166,842 0 93,302 88,233 0 0 314,659 918 514 14,859
Sep 691,684 108,508 0 62,931 78,461 0 0 24,590 86,370 36,485 31,481
Oct 41,936 0 1,113 0 0 0 1,134 0 16,404 0 2,945
Nov 36,600 3,196 4,833 0 0 0 18,510 0 651 0 1,717
Dec 6,106 365 0 0 0 0 638 0 0 0 1,000
Total 7,213,376 3,736,625 480,227 490,069 448,462 45,171 56,083 361,528 132,592 214,261 145,178
Page 1 of 11

OBGS Entrainment Estimates and Projected VSD Reductions for Total Fish Larvae and Top Ten Fishes Entrained
anchovies white croaker
northern
lampfish blennies
California
smoothtongue diamond turbot queenfish sanddabs
California
halibut gobies
Month
Total Fish
Larvae Engraulidae
Genyonemus
lineatus
Stenobrachius
leucopsarus
Hypsoblennius
spp
Leuroglossus
stilbius
Hypsopsetta
guttulata
Seriphus
politus
Citharichthys
spp
Paralichthys
spp CIQ gobies
Actual Flow 2007
Jan 3,919 0 331 712 0 0 535 0 123 580 353
Feb 9,607 545 1,988 2,983 0 0 0 0 0 0 0
Mar 21,214 0 4,501 358 0 8,517 339 0 261 0 935
Apr 2,321,950 1,546,720 313,663 170,601 0 40,147 19,726 0 13,948 33,929 11,468
May 80,702 59,422 0 3,564 1,138 0 0 0 4,776 5,731 0
Jun 1,341,000 997,516 0 29,616 154,565 0 0 0 0 0 16,095
Jul 1,849,261 1,262,976 0 62,519 122,899 0 0 26,850 0 114,307 85,911
Aug 2,253,599 575,788 0 247,274 254,997 0 0 645,613 88,143 36,999 52,143
Sep 1,679,070 283,558 0 169,329 208,129 0 0 64,665 232,359 101,747 3,148
Oct 392,177 14,519 114,745 0 0 0 75,201 0 4,557 0 42,690
Nov 324,329 33,346 33,831 0 0 0 167,817 0 10,303 0 12,017
Dec 244,638 17,369 8,384 0 0 0 765 0 0 0 34,698
Total 10,521,466 4,791,758 477,443 686,955 741,727 48,664 264,383 737,128 354,470 293,293 259,458
Page 2 of 11

OBGS Entrainment Estimates and Projected VSD Reductions for Total Fish Larvae and Top Ten Fishes Entrained
anchovies white croaker
northern
lampfish blennies
California
smoothtongue diamond turbot queenfish sanddabs
California
halibut gobies
Month
Total Fish
Larvae Engraulidae
Genyonemus
lineatus
Stenobrachius
leucopsarus
Hypsoblennius
spp
Leuroglossus
stilbius
Hypsopsetta
guttulata
Seriphus
politus
Citharichthys
spp
Paralichthys
spp CIQ gobies
Actual Flow 2008
Jan 55,740 2,303 5,941 3,083 0 0 2,521 0 1,603 7,344 12,207
Feb 47,859 4,142 8,948 13,421 0 0 0 0 0 0 0
Mar 992,217 8,237 180,189 10,379 13,431 238,593 21,846 0 14,635 0 153,201
Apr 2,814,897 662,305 806,755 350,815 23,597 20,652 32,313 21,212 5,941 47,941 5,771
May 108,285 72,696 0 1,053 702 0 0 0 11,100 10,408 0
Jun 1,067,272 967,763 0 42,544 9,634 0 0 0 0 0 298
Jul 638,426 405,850 0 16,825 68,219 0 0 843 0 81,862 23,954
Aug 2,276,748 581,712 0 254,556 260,729 0 0 735,310 69,434 31,346 52,296
Sep 1,396,304 231,887 0 135,876 166,980 0 0 53,345 189,342 77,081 20,257
Oct 239,855 6,908 27,479 0 0 0 24,255 0 49,211 0 37,309
Nov 360,592 39,217 0 0 0 0 243,865 0 18,546 0 0
Dec 270,970 15,795 8,754 0 0 0 13,165 0 0 0 49,138
Total 10,269,163 2,998,815 1,038,066 828,552 543,291 259,245 337,965 810,710 359,812 255,982 354,431
Page 3 of 11

OBGS Entrainment Estimates and Projected VSD Reductions for Total Fish Larvae and Top Ten Fishes Entrained
anchovies white croaker
northern
lampfish blennies
California
smoothtongue diamond turbot queenfish sanddabs
California
halibut gobies
Month
Total Fish
Larvae Engraulidae
Genyonemus
lineatus
Stenobrachius
leucopsarus
Hypsoblennius
spp
Leuroglossus
stilbius
Hypsopsetta
guttulata
Seriphus
politus
Citharichthys
spp
Paralichthys
spp CIQ gobies
Actual Flow 2009
Jan 9,005 640 970 949 0 0 114 0 247 816 2,394
Feb 224,250 22,997 39,966 59,949 0 0 0 0 0 0 0
Mar 85,635 0 18,869 597 420 10,814 6,262 0 4,182 0 7,071
Apr 1,784,796 456,225 817,166 70,212 0 105,095 58,038 0 30,995 2,989 29,012
May 106,130 73,011 0 5,346 1,489 0 0 0 7,873 8,878 0
Jun 22,554 12,292 0 277 6,828 0 0 0 0 0 149
Jul 290,219 81,982 0 5,275 63,476 0 0 4,499 0 69,383 28,043
Aug 328,368 71,441 0 35,730 40,661 0 0 17,985 34,116 14,388 3,272
Sep 1,402,521 226,784 0 136,188 166,069 0 0 52,668 188,263 81,192 26,143
Oct 189,965 0 42,952 0 0 0 19,740 0 15,492 0 30,598
Nov 4,237 335 0 0 0 0 3,235 0 108 0 0
Dec 2,977 0 740 0 0 0 0 0 0 0 1,480
Total 4,450,658 945,707 920,663 314,522 278,942 115,909 87,389 75,151 281,276 177,647 128,161
Page 4 of 11

OBGS Entrainment Estimates and Projected VSD Reductions for Total Fish Larvae and Top Ten Fishes Entrained
anchovies white croaker
northern
lampfish blennies
California
smoothtongue diamond turbot queenfish sanddabs
California
halibut gobies
Month
Total Fish
Larvae Engraulidae
Genyonemus
lineatus
Stenobrachius
leucopsarus
Hypsoblennius
spp
Leuroglossus
stilbius
Hypsopsetta
guttulata
Seriphus
politus
Citharichthys
spp
Paralichthys
spp CIQ gobies
Average Actual Flow 2006-2009
Jan 17,984 800 1,875 1,245 0 0 819 0 647 2,363 3,891
Feb 71,872 6,948 13,024 19,536 0 0 0 0 0 0 0
Mar 317,293 2,059 61,763 2,863 3,463 69,913 10,523 0 7,579 0 42,119
Apr 2,065,381 746,707 591,731 184,742 8,216 47,335 33,031 7,288 14,270 25,972 13,164
May 368,588 291,908 0 27,312 1,380 0 0 0 8,486 14,563 0
Jun 1,008,526 805,351 0 28,328 80,807 0 0 0 0 0 7,973
Jul 1,047,847 670,062 0 32,202 93,176 0 0 11,633 0 97,460 50,364
Aug 1,395,185 348,946 0 157,716 161,155 0 0 428,392 48,153 20,812 30,642
Sep 1,292,395 212,684 0 126,081 154,910 0 0 48,817 174,084 74,126 20,257
Oct 215,983 5,357 46,572 0 0 0 30,082 0 21,416 0 28,385
Nov 181,440 19,023 9,666 0 0 0 108,357 0 7,402 0 3,433
Dec 131,173 8,382 4,470 0 0 0 3,642 0 0 0 21,579
Total 8,113,666 3,118,226 729,100 580,025 503,106 117,247 186,455 496,130 282,037 235,296 221,807
Page 5 of 11
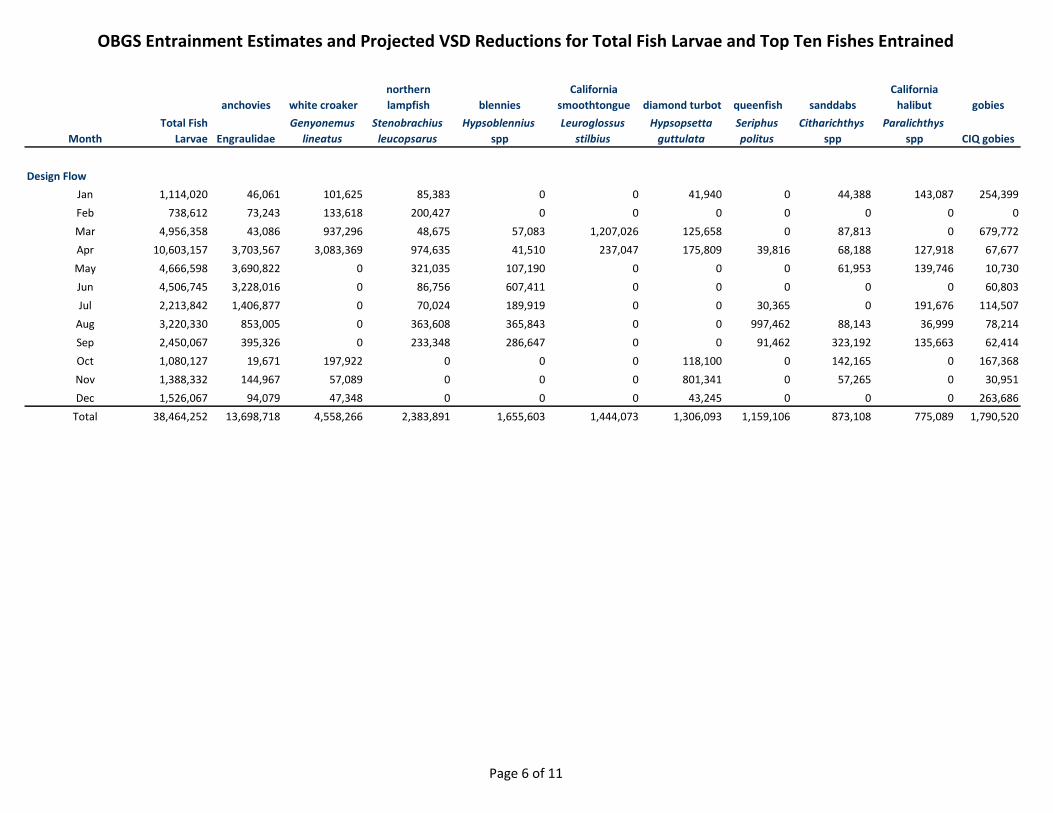
OBGS Entrainment Estimates and Projected VSD Reductions for Total Fish Larvae and Top Ten Fishes Entrained
anchovies white croaker
northern
lampfish blennies
California
smoothtongue diamond turbot queenfish sanddabs
California
halibut gobies
Month
Total Fish
Larvae Engraulidae
Genyonemus
lineatus
Stenobrachius
leucopsarus
Hypsoblennius
spp
Leuroglossus
stilbius
Hypsopsetta
guttulata
Seriphus
politus
Citharichthys
spp
Paralichthys
spp CIQ gobies
Design Flow
Jan 1,114,020 46,061 101,625 85,383 0 0 41,940 0 44,388 143,087 254,399
Feb 738,612 73,243 133,618 200,427 0 0 0 0 0 0 0
Mar 4,956,358 43,086 937,296 48,675 57,083 1,207,026 125,658 0 87,813 0 679,772
Apr 10,603,157 3,703,567 3,083,369 974,635 41,510 237,047 175,809 39,816 68,188 127,918 67,677
May 4,666,598 3,690,822 0 321,035 107,190 0 0 0 61,953 139,746 10,730
Jun 4,506,745 3,228,016 0 86,756 607,411 0 0 0 0 0 60,803
Jul 2,213,842 1,406,877 0 70,024 189,919 0 0 30,365 0 191,676 114,507
Aug 3,220,330 853,005 0 363,608 365,843 0 0 997,462 88,143 36,999 78,214
Sep 2,450,067 395,326 0 233,348 286,647 0 0 91,462 323,192 135,663 62,414
Oct 1,080,127 19,671 197,922 0 0 0 118,100 0 142,165 0 167,368
Nov 1,388,332 144,967 57,089 0 0 0 801,341 0 57,265 0 30,951
Dec 1,526,067 94,079 47,348 0 0 0 43,245 0 0 0 263,686
Total 38,464,252 13,698,718 4,558,266 2,383,891 1,655,603 1,444,073 1,306,093 1,159,106 873,108 775,089 1,790,520
Page 6 of 11

OBGS Entrainment Estimates and Projected VSD Reductions for Total Fish Larvae and Top Ten Fishes Entrained
anchovies white croaker
northern
lampfish blennies
California
smoothtongue diamond turbot queenfish sanddabs
California
halibut gobies
Month
Total Fish
Larvae Engraulidae
Genyonemus
lineatus
Stenobrachius
leucopsarus
Hypsoblennius
spp
Leuroglossus
stilbius
Hypsopsetta
guttulata
Seriphus
politus
Citharichthys
spp
Paralichthys
spp CIQ gobies
Projected VSD Flow 2006
Jan 1,441 113 113 104 0 0 46 0 272 313 268
Feb 2,542 48 526 788 0 0 0 0 0 0 0
Mar 74,937 0 19,159 53 0 9,571 6,012 0 4,951 0 3,201
Apr 430,288 106,347 136,260 45,450 2,937 7,413 6,650 2,667 2,069 6,093 1,965
May 381,074 311,402 0 31,457 965 0 0 0 2,913 11,453 0
Jun 574,295 451,181 0 13,862 52,018 0 0 0 0 0 5,317
Jul 512,373 319,166 0 11,780 48,520 0 0 7,516 0 57,884 25,819
Aug 224,023 50,133 0 27,650 26,625 0 0 97,982 404 226 6,120
Sep 364,294 66,777 0 31,755 42,814 0 0 15,821 45,233 11,991 12,781
Oct 18,474 0 490 0 0 0 500 0 7,226 0 1,297
Nov 16,123 1,408 2,129 0 0 0 8,154 0 287 0 756
Dec 2,690 161 0 0 0 0 281 0 0 0 440
Total 2,602,554 1,306,736 158,677 162,900 173,879 16,984 21,643 123,985 63,353 87,961 57,966
Page 7 of 11

OBGS Entrainment Estimates and Projected VSD Reductions for Total Fish Larvae and Top Ten Fishes Entrained
anchovies white croaker
northern
lampfish blennies
California
smoothtongue diamond turbot queenfish sanddabs
California
halibut gobies
Month
Total Fish
Larvae Engraulidae
Genyonemus
lineatus
Stenobrachius
leucopsarus
Hypsoblennius
spp
Leuroglossus
stilbius
Hypsopsetta
guttulata
Seriphus
politus
Citharichthys
spp
Paralichthys
spp CIQ gobies
Projected VSD Flow 2007
Jan 1,726 0 146 313 0 0 236 0 54 256 156
Feb 4,232 240 876 1,314 0 0 0 0 0 0 0
Mar 9,346 0 1,983 158 0 3,752 149 0 115 0 412
Apr 562,716 354,524 91,804 39,758 0 11,738 5,828 0 3,998 7,528 3,270
May 35,552 26,177 0 1,570 501 0 0 0 2,104 2,525 0
Jun 525,545 416,322 0 12,610 45,152 0 0 0 0 0 4,579
Jul 857,968 623,462 0 22,707 44,513 0 0 14,529 0 50,853 37,357
Aug 979,238 262,812 0 89,602 104,415 0 0 232,645 50,016 9,716 30,211
Sep 801,503 154,927 0 73,354 98,205 0 0 38,717 105,545 26,833 1,387
Oct 124,292 4,591 37,594 0 0 0 22,503 0 2,007 0 13,110
Nov 122,459 12,324 10,381 0 0 0 66,003 0 4,707 0 3,687
Dec 107,385 7,443 4,884 0 0 0 337 0 0 0 17,480
Total 4,131,962 1,862,822 147,668 241,385 292,787 15,490 95,057 285,891 168,546 97,711 111,649
Page 8 of 11
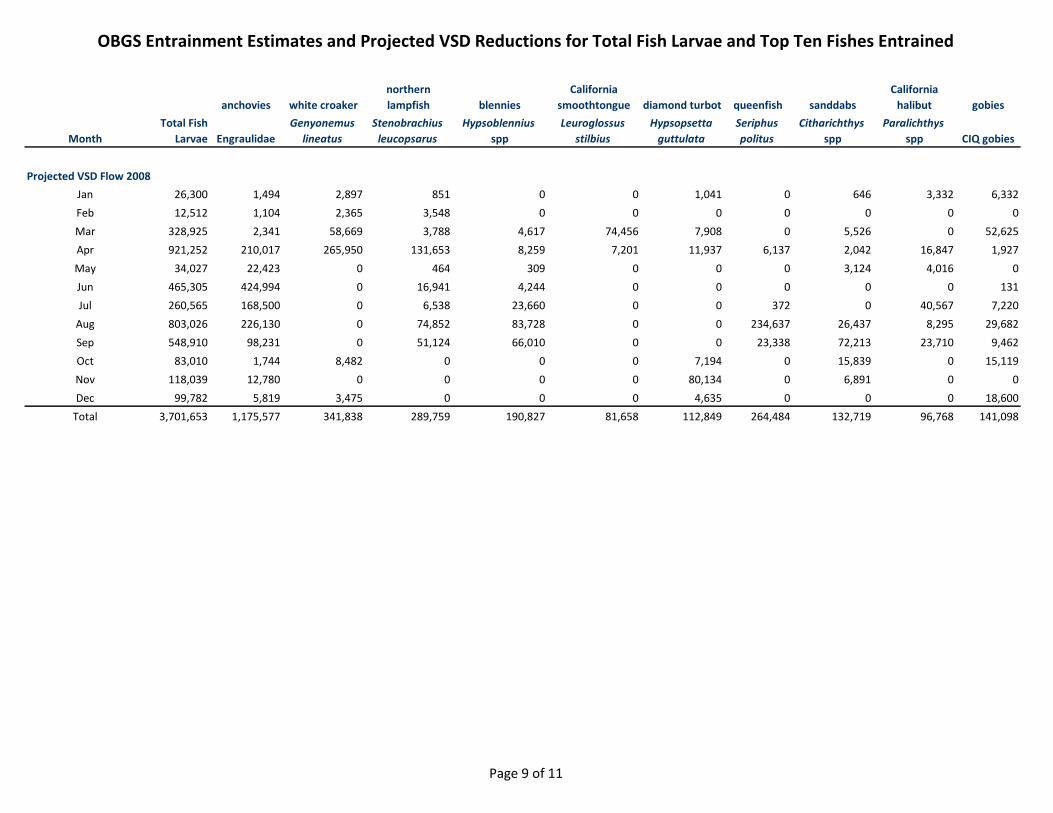
OBGS Entrainment Estimates and Projected VSD Reductions for Total Fish Larvae and Top Ten Fishes Entrained
anchovies white croaker
northern
lampfish blennies
California
smoothtongue diamond turbot queenfish sanddabs
California
halibut gobies
Month
Total Fish
Larvae Engraulidae
Genyonemus
lineatus
Stenobrachius
leucopsarus
Hypsoblennius
spp
Leuroglossus
stilbius
Hypsopsetta
guttulata
Seriphus
politus
Citharichthys
spp
Paralichthys
spp CIQ gobies
Projected VSD Flow 2008
Jan 26,300 1,494 2,897 851 0 0 1,041 0 646 3,332 6,332
Feb 12,512 1,104 2,365 3,548 0 0 0 0 0 0 0
Mar 328,925 2,341 58,669 3,788 4,617 74,456 7,908 0 5,526 0 52,625
Apr 921,252 210,017 265,950 131,653 8,259 7,201 11,937 6,137 2,042 16,847 1,927
May 34,027 22,423 0 464 309 0 0 0 3,124 4,016 0
Jun 465,305 424,994 0 16,941 4,244 0 0 0 0 0 131
Jul 260,565 168,500 0 6,538 23,660 0 0 372 0 40,567 7,220
Aug 803,026 226,130 0 74,852 83,728 0 0 234,637 26,437 8,295 29,682
Sep 548,910 98,231 0 51,124 66,010 0 0 23,338 72,213 23,710 9,462
Oct 83,010 1,744 8,482 0 0 0 7,194 0 15,839 0 15,119
Nov 118,039 12,780 0 0 0 0 80,134 0 6,891 0 0
Dec 99,782 5,819 3,475 0 0 0 4,635 0 0 0 18,600
Total 3,701,653 1,175,577 341,838 289,759 190,827 81,658 112,849 264,484 132,719 96,768 141,098
Page 9 of 11

OBGS Entrainment Estimates and Projected VSD Reductions for Total Fish Larvae and Top Ten Fishes Entrained
anchovies white croaker
northern
lampfish blennies
California
smoothtongue diamond turbot queenfish sanddabs
California
halibut gobies
Month
Total Fish
Larvae Engraulidae
Genyonemus
lineatus
Stenobrachius
leucopsarus
Hypsoblennius
spp
Leuroglossus
stilbius
Hypsopsetta
guttulata
Seriphus
politus
Citharichthys
spp
Paralichthys
spp CIQ gobies
Projected VSD Flow 2009
Jan 3,967 282 428 418 0 0 50 0 109 360 1,055
Feb 66,653 6,564 11,518 17,276 0 0 0 0 0 0 0
Mar 37,725 0 8,312 263 185 4,764 2,759 0 1,842 0 3,115
Apr 495,509 127,457 224,870 21,329 0 28,748 15,779 0 8,651 880 7,943
May 36,702 25,190 0 2,355 656 0 0 0 2,512 2,762 0
Jun 9,936 5,415 0 122 3,008 0 0 0 0 0 66
Jul 91,889 27,360 0 1,961 18,533 0 0 1,638 0 22,900 8,117
Aug 126,871 28,161 0 12,983 15,331 0 0 7,746 13,392 4,586 1,441
Sep 409,831 69,587 0 38,723 48,352 0 0 17,089 54,438 20,307 7,211
Oct 59,528 0 12,719 0 0 0 5,085 0 6,825 0 10,007
Nov 1,867 147 0 0 0 0 1,425 0 48 0 0
Dec 1,312 0 326 0 0 0 0 0 0 0 652
Total 1,341,790 290,164 258,172 95,429 86,065 33,512 25,098 26,474 87,817 51,794 39,606
Page 10 of 11

OBGS Entrainment Estimates and Projected VSD Reductions for Total Fish Larvae and Top Ten Fishes Entrained
anchovies white croaker
northern
lampfish blennies
California
smoothtongue diamond turbot queenfish sanddabs
California
halibut gobies
Month
Total Fish
Larvae Engraulidae
Genyonemus
lineatus
Stenobrachius
leucopsarus
Hypsoblennius
spp
Leuroglossus
stilbius
Hypsopsetta
guttulata
Seriphus
politus
Citharichthys
spp
Paralichthys
spp CIQ gobies
Average Actual '06-'09 8,113,666 3,118,226 729,100 580,025 503,106 117,247 186,455 496,130 282,037 235,296 221,807
Range (max-min) 6,070,808 3,846,051 560,623 514,031 462,786 214,074 281,882 735,559 227,220 115,646 226,270
VSD Reductions in Entrainment from Actual Flows
VSD Reduction 2006 4,610,822 2,429,890 321,550 327,170 274,584 28,187 34,439 237,543 69,239 126,300 87,212
% Reduction 2006 63.92% 65.03% 66.96% 66.76% 61.23% 62.40% 61.41% 65.71% 52.22% 58.95% 60.07%
VSD Reduction 2007 6,389,504 2,928,936 329,776 445,570 448,940 33,173 169,327 451,238 185,923 195,582 147,809
% Reduction 2007 60.73% 61.12% 69.07% 64.86% 60.53% 68.17% 64.05% 61.22% 52.45% 66.68% 56.97%
VSD Reduction 2008 6,567,510 1,823,237 696,228 538,794 352,465 177,587 225,116 546,227 227,093 159,214 213,333
% Reduction 2008 63.95% 60.80% 67.07% 65.03% 64.88% 68.50% 66.61% 67.38% 63.11% 62.20% 60.19%
VSD Reduction 2009 3,108,868 655,544 662,491 219,092 192,877 82,397 62,291 48,678 193,459 125,853 88,555
% Reduction 2009 69.85% 69.32% 71.96% 69.66% 69.15% 71.09% 71.28% 64.77% 68.78% 70.84% 69.10%
Average Reduction 64.61% 64.07% 68.76% 66.58% 63.94% 67.54% 65.84% 64.77% 59.14% 64.67% 61.58%
Design Flow Totals 38,464,252 13,698,718 4,558,266 2,383,891 1,655,603 1,444,073 1,306,093 1,159,106 873,108 775,089 1,790,520
VSD Reductions in Entrainment from Design Flows
VSD Reduction 2006 35,861,698 12,391,982 4,399,589 2,220,992 1,481,725 1,427,089 1,284,450 1,035,121 809,755 687,128 1,732,554
% Reduction 2006 93.23% 90.46% 96.52% 93.17% 89.50% 98.82% 98.34% 89.30% 92.74% 88.65% 96.76%
VSD Reduction 2007 34,332,291 11,835,895 4,410,598 2,142,506 1,362,816 1,428,583 1,211,036 873,215 704,562 677,378 1,678,871
% Reduction 2007 89.26% 86.40% 96.76% 89.87% 82.32% 98.93% 92.72% 75.34% 80.70% 87.39% 93.76%
VSD Reduction 2008 34,762,599 12,523,141 4,216,428 2,094,133 1,464,776 1,362,416 1,193,244 894,622 740,389 678,321 1,649,421
% Reduction 2008 90.38% 91.42% 92.50% 87.85% 88.47% 94.35% 91.36% 77.18% 84.80% 87.52% 92.12%
VSD Reduction 2009 37,122,462 13,408,554 4,300,094 2,288,462 1,569,538 1,410,561 1,280,995 1,132,632 785,292 723,295 1,750,913
% Reduction 2009 96.51% 97.88% 94.34% 96.00% 94.80% 97.68% 98.08% 97.72% 89.94% 93.32% 97.79%
Average Reduction 92.34% 91.54% 95.03% 91.72% 88.77% 97.44% 95.13% 84.88% 87.05% 89.22% 95.11%
Page 11 of 11

MGS Entrainment Estimates and Projected VSD Reductions for Total Fish Larvae and Top Ten Fishes Entrained
yellowfin goby gobies blennies clingfish
longjaw
mudsucker anchovies
Total Fish
Larvae
Acanthogobius
flavimanus CIQ gobies
Hypsoblennius
spp
Gobiesox
rhessodon
Gillichthys
mirabilis
Engraulis
mordax
Actual Flow 2006
Jan 353,104 0 304,628 0 7,806 24,282 0
Feb 3,075,835 2,047,050 943,279 5,411 0 26,715 0
Mar 1,299,988 806,321 289,215 3,391 4,263 10,927 0
Apr 952,147 546,849 210,011 13,322 17,592 10,497 714
May 5,317,127 79,241 795,603 3,134,352 140,380 198,233 12,546
Jun 1,008,185 12,480 334,148 191,062 57,437 6,030 0
Jul 3,282,943 0 1,823,444 497,975 155,945 17,553 2,523
Aug 5,336,603 0 4,700,869 316,644 21,375 0 19,853
Sep 3,290,539 0 2,922,797 117,438 122,018 0 0
Oct 28,349 0 24,316 1,479 0 2,553 0
Nov 2,615,680 0 2,402,826 100,399 2,144 42,804 0
Dec 2,497,043 0 2,034,577 178,503 10,467 24,548 0
Total 29,057,544 3,491,941 16,785,712 4,559,975 539,427 364,142 35,635
1 of 11

MGS Entrainment Estimates and Projected VSD Reductions for Total Fish Larvae and Top Ten Fishes Entrained
yellowfin goby gobies blennies clingfish
longjaw
mudsucker anchovies
Total Fish
Larvae
Acanthogobius
flavimanus CIQ gobies
Hypsoblennius
spp
Gobiesox
rhessodon
Gillichthys
mirabilis
Engraulis
mordax
Actual Flow 2007
Jan 881,802 0 773,296 0 14,974 13,687 0
Feb 430,188 286,452 132,275 601 0 3,678 0
Mar 1,290,813 799,822 254,330 3,017 2,174 8,171 0
Apr 1,006,554 346,644 218,659 248,108 50,970 18,682 1,523
May 5,292,954 66,847 757,600 3,269,808 156,164 167,207 9,385
Jun 1,248,012 15,659 379,364 211,021 65,921 7,549 0
Jul 2,716,356 0 1,696,375 355,095 107,290 11,702 3,665
Aug 7,421,263 0 6,493,923 449,129 30,875 0 25,271
Sep 2,583,067 0 2,171,090 128,201 100,472 0 0
Oct 3,451,525 0 3,279,602 58,832 22,523 32,186 0
Nov 1,736,798 0 1,604,734 59,196 1,429 33,120 0
Dec 2,610,567 0 2,143,336 183,372 10,537 24,758 0
Total 30,669,899 1,515,423 19,904,584 4,966,381 563,328 320,740 39,844
2 of 11

MGS Entrainment Estimates and Projected VSD Reductions for Total Fish Larvae and Top Ten Fishes Entrained
yellowfin goby gobies blennies clingfish
longjaw
mudsucker anchovies
Total Fish
Larvae
Acanthogobius
flavimanus CIQ gobies
Hypsoblennius
spp
Gobiesox
rhessodon
Gillichthys
mirabilis
Engraulis
mordax
Actual Flow 2008
Jan 2,679,650 0 2,348,720 0 43,486 58,804 0
Feb 6,153,840 4,097,205 1,883,563 11,605 0 54,111 0
Mar 3,467,361 2,343,213 724,153 3,865 10,961 29,438 0
Apr 4,503,758 2,236,570 940,211 494,490 118,553 51,778 3,568
May 2,749,458 33,226 392,622 1,723,104 97,128 78,043 3,793
Jun 982,113 7,165 306,419 109,335 47,000 3,561 0
Jul 1,986,566 0 1,048,312 317,445 101,794 11,191 1,047
Aug 7,488,839 0 6,665,623 404,869 31,825 0 26,748
Sep 5,011,187 0 4,549,616 184,535 144,315 0 0
Oct 4,667,585 0 4,382,234 141,280 52,884 30,582 0
Nov 6,686,469 0 6,197,366 212,186 5,193 105,966 0
Dec 3,796,615 0 3,101,205 257,039 16,909 35,676 0
Total 50,173,441 8,717,379 32,540,045 3,859,754 670,049 459,150 35,157
3 of 11

MGS Entrainment Estimates and Projected VSD Reductions for Total Fish Larvae and Top Ten Fishes Entrained
yellowfin goby gobies blennies clingfish
longjaw
mudsucker anchovies
Total Fish
Larvae
Acanthogobius
flavimanus CIQ gobies
Hypsoblennius
spp
Gobiesox
rhessodon
Gillichthys
mirabilis
Engraulis
mordax
Actual Flow 2009
Jan 4,276,023 0 3,756,182 0 68,677 100,205 0
Feb 11,893,115 8,754,419 2,841,568 29,849 0 148,497 0
Mar 5,849,182 4,060,227 1,372,877 4,317 30,796 66,616 0
Apr 3,627,060 1,076,500 858,429 978,387 238,168 78,705 7,850
May 5,552,478 72,110 797,933 3,421,313 184,391 175,783 9,483
Jun 64,326 0 23,404 4,742 3,432 0 0
Jul 2,525,384 0 1,449,935 370,201 112,956 12,956 2,380
Aug 1,437,082 0 1,117,326 147,535 4,560 0 3,903
Sep 6,397,313 0 5,705,011 275,266 180,351 0 0
Oct 3,049,089 0 2,871,298 78,045 31,379 19,600 0
Nov 1,887,744 0 1,784,834 34,210 0 36,856 0
Dec 3,227,538 0 2,663,166 196,083 14,467 31,446 0
Total 49,786,334 13,963,255 25,241,964 5,539,946 869,177 670,663 23,616
4 of 11

MGS Entrainment Estimates and Projected VSD Reductions for Total Fish Larvae and Top Ten Fishes Entrained
yellowfin goby gobies blennies clingfish
longjaw
mudsucker anchovies
Total Fish
Larvae
Acanthogobius
flavimanus CIQ gobies
Hypsoblennius
spp
Gobiesox
rhessodon
Gillichthys
mirabilis
Engraulis
mordax
Average Actual Flow 2006-2009
Jan 2,047,645 0 1,795,706 0 33,736 49,245 0
Feb 5,388,245 3,796,282 1,450,171 11,866 0 58,250 0
Mar 2,976,836 2,002,396 660,144 3,648 12,048 28,788 0
Apr 2,522,379 1,051,641 556,827 433,577 106,321 39,916 3,414
May 4,728,004 62,856 685,939 2,887,144 144,516 154,817 8,802
Jun 825,659 8,826 260,834 129,040 43,448 4,285 0
Jul 2,627,812 0 1,504,517 385,179 119,496 13,351 2,404
Aug 5,420,947 0 4,744,435 329,544 22,159 0 18,944
Sep 4,320,527 0 3,837,128 176,360 136,789 0 0
Oct 2,799,137 0 2,639,363 69,909 26,697 21,230 0
Nov 3,231,673 0 2,997,440 101,498 2,192 54,686 0
Dec 3,032,941 0 2,485,571 203,749 13,095 29,107 0
Total 39,921,805 6,921,999 23,618,076 4,731,514 660,495 453,674 33,563
5 of 11
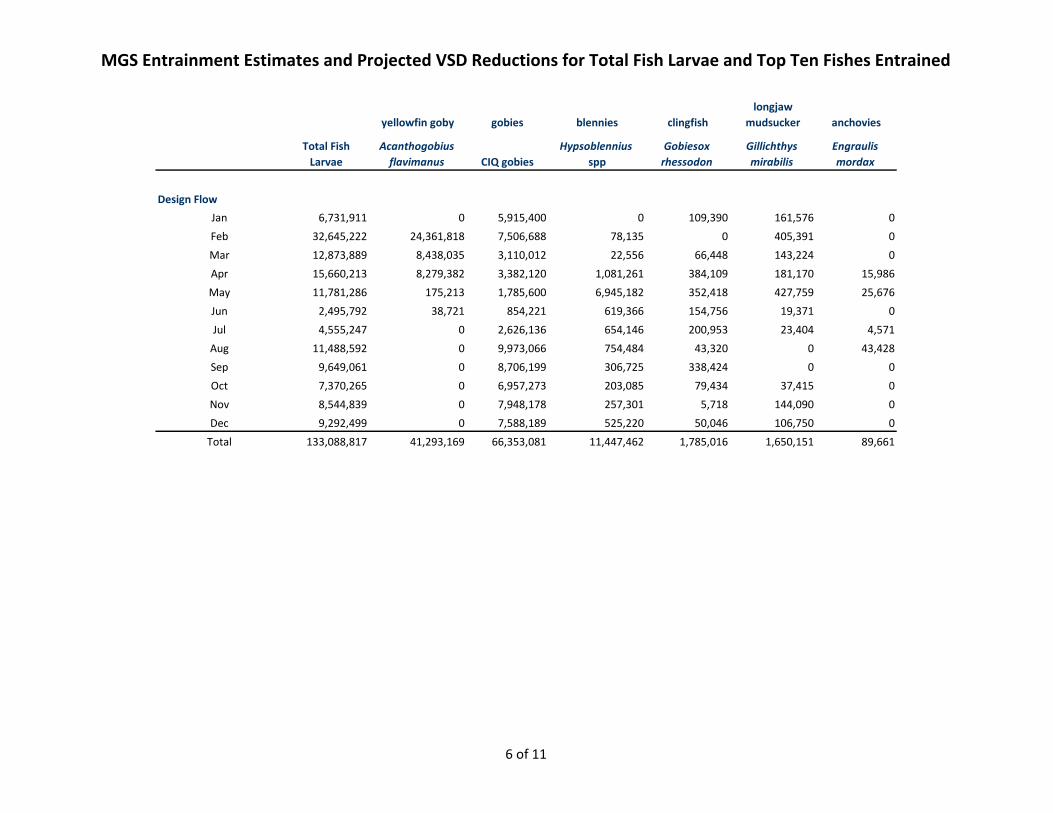
MGS Entrainment Estimates and Projected VSD Reductions for Total Fish Larvae and Top Ten Fishes Entrained
yellowfin goby gobies blennies clingfish
longjaw
mudsucker anchovies
Total Fish
Larvae
Acanthogobius
flavimanus CIQ gobies
Hypsoblennius
spp
Gobiesox
rhessodon
Gillichthys
mirabilis
Engraulis
mordax
Design Flow
Jan 6,731,911 0 5,915,400 0 109,390 161,576 0
Feb 32,645,222 24,361,818 7,506,688 78,135 0 405,391 0
Mar 12,873,889 8,438,035 3,110,012 22,556 66,448 143,224 0
Apr 15,660,213 8,279,382 3,382,120 1,081,261 384,109 181,170 15,986
May 11,781,286 175,213 1,785,600 6,945,182 352,418 427,759 25,676
Jun 2,495,792 38,721 854,221 619,366 154,756 19,371 0
Jul 4,555,247 0 2,626,136 654,146 200,953 23,404 4,571
Aug 11,488,592 0 9,973,066 754,484 43,320 0 43,428
Sep 9,649,061 0 8,706,199 306,725 338,424 0 0
Oct 7,370,265 0 6,957,273 203,085 79,434 37,415 0
Nov 8,544,839 0 7,948,178 257,301 5,718 144,090 0
Dec 9,292,499 0 7,588,189 525,220 50,046 106,750 0
Total 133,088,817 41,293,169 66,353,081 11,447,462 1,785,016 1,650,151 89,661
6 of 11

MGS Entrainment Estimates and Projected VSD Reductions for Total Fish Larvae and Top Ten Fishes Entrained
yellowfin goby gobies blennies clingfish
longjaw
mudsucker anchovies
Total Fish
Larvae
Acanthogobius
flavimanus CIQ gobies
Hypsoblennius
spp
Gobiesox
rhessodon
Gillichthys
mirabilis
Engraulis
mordax
Projected VSD Flow 2006
Jan 81,635 0 70,784 0 1,666 4,746 0
Feb 970,629 643,909 299,320 1,794 0 8,535 0
Mar 490,697 301,652 109,080 1,244 1,629 4,034 0
Apr 307,215 173,849 72,276 4,830 6,399 3,635 256
May 2,024,108 30,614 302,306 1,191,195 54,656 76,042 4,831
Jun 384,656 4,756 127,421 70,040 21,927 2,051 0
Jul 1,298,070 0 714,736 204,064 63,856 6,868 955
Aug 1,811,643 0 1,585,706 111,818 7,218 0 6,583
Sep 1,160,113 0 1,016,037 47,653 44,605 0 0
Oct 10,247 0 8,789 535 0 923 0
Nov 999,145 0 915,921 38,059 940 16,855 0
Dec 934,935 0 767,002 65,508 3,971 8,870 0
Total 10,473,093 1,154,781 5,989,379 1,736,739 206,867 132,558 12,624
7 of 11

MGS Entrainment Estimates and Projected VSD Reductions for Total Fish Larvae and Top Ten Fishes Entrained
yellowfin goby gobies blennies clingfish
longjaw
mudsucker anchovies
Total Fish
Larvae
Acanthogobius
flavimanus CIQ gobies
Hypsoblennius
spp
Gobiesox
rhessodon
Gillichthys
mirabilis
Engraulis
mordax
Projected VSD Flow 2007
Jan 313,176 0 274,866 0 5,401 4,751 0
Feb 155,490 103,537 47,810 217 0 1,329 0
Mar 477,493 296,899 93,468 1,142 661 2,822 0
Apr 366,776 125,361 79,883 90,684 19,305 6,967 550
May 1,860,760 22,763 258,376 1,167,017 57,459 55,982 3,099
Jun 424,212 6,390 134,315 83,781 24,166 2,866 0
Jul 953,278 0 567,005 136,152 41,482 4,412 1,023
Aug 2,345,138 0 2,022,870 158,265 9,071 0 8,055
Sep 878,600 0 725,574 50,111 34,363 0 0
Oct 1,172,880 0 1,109,679 22,068 7,756 15,204 0
Nov 606,352 0 558,593 21,291 517 12,305 0
Dec 1,041,138 0 863,402 70,277 3,939 9,497 0
Total 10,595,291 554,950 6,735,841 1,801,004 204,121 116,135 12,728
8 of 11

MGS Entrainment Estimates and Projected VSD Reductions for Total Fish Larvae and Top Ten Fishes Entrained
yellowfin goby gobies blennies clingfish
longjaw
mudsucker anchovies
Total Fish
Larvae
Acanthogobius
flavimanus CIQ gobies
Hypsoblennius
spp
Gobiesox
rhessodon
Gillichthys
mirabilis
Engraulis
mordax
Projected VSD Flow 2008
Jan 1,127,734 0 987,052 0 18,435 21,134 0
Feb 1,790,618 1,187,108 552,786 3,374 0 15,904 0
Mar 1,362,641 924,194 278,857 1,433 3,811 11,001 0
Apr 1,698,642 833,963 348,038 195,267 42,778 19,047 1,402
May 965,199 11,916 141,093 597,004 30,106 28,341 1,501
Jun 274,725 3,067 86,199 38,424 14,147 1,246 0
Jul 776,414 0 401,804 127,300 40,464 4,509 339
Aug 2,240,672 0 1,974,111 131,077 8,942 0 8,123
Sep 1,525,961 0 1,365,652 64,380 49,077 0 0
Oct 1,591,846 0 1,477,904 52,358 18,138 17,221 0
Nov 2,306,869 0 2,142,756 70,987 1,788 38,125 0
Dec 1,257,989 0 1,018,361 88,120 6,480 11,581 0
Total 16,919,308 2,960,248 10,774,614 1,369,725 234,166 168,110 11,365
9 of 11

MGS Entrainment Estimates and Projected VSD Reductions for Total Fish Larvae and Top Ten Fishes Entrained
yellowfin goby gobies blennies clingfish
longjaw
mudsucker anchovies
Total Fish
Larvae
Acanthogobius
flavimanus CIQ gobies
Hypsoblennius
spp
Gobiesox
rhessodon
Gillichthys
mirabilis
Engraulis
mordax
Projected VSD Flow 2009
Jan 1,492,177 0 1,319,431 0 22,614 30,695 0
Feb 4,186,040 3,131,298 957,098 9,324 0 50,801 0
Mar 2,083,258 1,444,710 490,661 1,824 10,818 21,481 0
Apr 1,308,845 401,410 325,346 332,315 80,024 29,122 3,201
May 2,025,277 26,700 295,386 1,237,903 66,283 65,326 3,561
Jun 22,170 0 7,756 1,881 1,100 0 0
Jul 987,018 0 551,428 149,274 45,942 5,320 814
Aug 486,938 0 361,930 57,439 1,393 0 1,180
Sep 2,616,434 0 2,328,350 115,778 72,519 0 0
Oct 976,406 0 919,608 25,251 10,288 4,473 0
Nov 602,916 0 571,707 10,417 0 10,314 0
Dec 1,020,184 0 847,378 62,919 4,457 9,609 0
Total 17,807,664 5,004,117 8,976,077 2,004,326 315,437 227,141 8,755
10 of 11

MGS Entrainment Estimates and Projected VSD Reductions for Total Fish Larvae and Top Ten Fishes Entrained
yellowfin goby gobies blennies clingfish
longjaw
mudsucker anchovies
Total Fish
Larvae
Acanthogobius
flavimanus CIQ gobies
Hypsoblennius
spp
Gobiesox
rhessodon
Gillichthys
mirabilis
Engraulis
mordax
Average Actual '06-'09 39,921,805 6,921,999 23,618,076 4,731,514 660,495 453,674 33,563
Range (max-min) 21,115,897 12,447,832 15,754,332 1,680,192 329,750 349,924 16,228
VSD Reductions in Entrainment from Actual Flows
VSD Reduction 2006 18,584,451 2,337,160 10,796,334 2,823,235 332,560 231,584 23,011
% Reduction 2006 63.96% 66.93% 64.32% 61.91% 61.65% 63.60% 64.57%
VSD Reduction 2007 20,074,608 960,473 13,168,743 3,165,377 359,207 204,604 27,116
% Reduction 2007 65.45% 63.38% 66.16% 63.74% 63.77% 63.79% 68.06%
VSD Reduction 2008 33,254,134 5,757,132 21,765,430 2,490,029 435,883 291,040 23,792
% Reduction 2008 66.28% 66.04% 66.89% 64.51% 65.05% 63.39% 67.67%
VSD Reduction 2009 31,978,670 8,959,137 16,265,887 3,535,620 553,740 443,523 14,861
% Reduction 2009 64.23% 64.16% 64.44% 63.82% 63.71% 66.13% 62.93%
Average Reduction 64.98% 65.13% 65.45% 63.50% 63.54% 64.23% 65.81%
Design Flow Totals 133,088,817 41,293,169 66,353,081 11,447,462 1,785,016 1,650,151 89,661
VSD Reductions in Entrainment from Design Flows
VSD Reduction 2006 122,615,724 40,138,388 60,363,703 9,710,722 1,578,149 1,517,593 77,037
% Reduction 2006 92.13% 97.20% 90.97% 84.83% 88.41% 91.97% 85.92%
VSD Reduction 2007 122,493,526 40,738,220 59,617,240 9,646,458 1,580,896 1,534,016 76,934
% Reduction 2007 92.04% 98.66% 89.85% 84.27% 88.56% 92.96% 85.80%
VSD Reduction 2008 116,169,509 38,332,922 55,578,467 10,077,737 1,550,850 1,482,041 78,296
% Reduction 2008 87.29% 92.83% 83.76% 88.03% 86.88% 89.81% 87.32%
VSD Reduction 2009 115,281,153 36,289,052 57,377,004 9,443,136 1,469,579 1,423,010 80,906
% Reduction 2009 86.62% 87.88% 86.47% 82.49% 82.33% 86.24% 90.24%
Average Reduction 89.52% 94.14% 87.76% 84.91% 86.55% 90.24% 87.32%
11 of 11

Exhibit F

DISCUSSION OF MARKET AND CONTRACTING FACTORS RELATED TO INVESTMENT IN
COMPLIANCE MEASURES FOR THE ONCE-THROUGH COOLING POLICY
AT
GENON’S MANDALAY, ORMOND BEACH & PITTSBURG
GENERATING STATIONS
Page 2 of 22 March 31, 2010
ORGANIZATION 1. INVESTMENT CRITERIA ............................................................................................................... 4 2. OPERATING CHARACTERISTICS AND AVAILABLE SERVICES ........................................ 4
A. OPERATING CHARACTERISTICS ......................................................................................................... 4 B. AVAILABLE SERVICES ....................................................................................................................... 5
1. Resource Adequacy (RA) Capacity .............................................................................................. 5 2. Local Emergency Capacity .......................................................................................................... 6 3. Energy ......................................................................................................................................... 6 4. Regulation ................................................................................................................................... 6 5. Spinning Reserve ......................................................................................................................... 7 6. Frequency Response .................................................................................................................... 7 7. Voltage Support ........................................................................................................................... 7 8. Inertia .......................................................................................................................................... 7
3. CALIFORNIA ELECTRIC MARKET STRUCTURE OVERVIEW ........................................... 7 A. RA PROGRAM ................................................................................................................................... 8
1. Demand Forecasts ....................................................................................................................... 8 2. Local Capacity Technical Studies ............................................................................................... 8 3. Local and System Resource Adequacy Obligations ..................................................................... 9 4. Standard Capacity Product ........................................................................................................10
B. ENERGY AND ANCILLARY SERVICES MARKETS ...............................................................................10 C. EXCEPTIONAL DISPATCH .................................................................................................................10 D. RELIABILITY MUST RUN ..................................................................................................................11 E. CAPACITY PROCUREMENT MECHANISM ..........................................................................................11 F. RENEWABLE INTEGRATION AND NEW PRODUCTS ............................................................................11 G. OTHER WESTERN MARKETS ............................................................................................................13 H. PROCUREMENT BACKGROUND .........................................................................................................13
1. CPUC Long Term Procurement Planning Process ....................................................................13 2. Utility and ESP Procurement Practices .....................................................................................14 3. Once Through Cooling Capacity Replacement ..........................................................................14
4. SOURCES OF UNCERTAINTY .....................................................................................................16 A. ECONOMIC OUTLOOK ......................................................................................................................16 B. ENVIRONMENTAL MITIGATION COSTS .............................................................................................17 C. ONGOING CAPITAL EXPENDITURES..................................................................................................17 D. RENEWABLE INTEGRATION ..............................................................................................................17 E. RA RULES ........................................................................................................................................18 F. CAISO MARKET RULES ..................................................................................................................18 G. INFRASTRUCTURE REQUIREMENTS ..................................................................................................19 H. DEMAND SIDE MANAGEMENT AND ENERGY EFFICIENCY ................................................................19 I. TECHNOLOGICAL INNOVATIONS ......................................................................................................20 J. REGULATORY POLICY ......................................................................................................................20
1. Climate Change Policy and Implementation ..............................................................................20 2. Technology Set-Aside Policy ......................................................................................................20
5. AVAILABILITY OF FUNDING FOR COMPLIANCE MEASURES .........................................21

Page 3 of 22 March 31, 2010
DISCUSSION OF MARKET AND CONTRACTING
FACTORS RELATED TO INVESTMENT IN COMPLIANCE MEASURES
GenOn West, L.P. has prepared Implementation Plans for the Mandalay Generating Station (MGS) and the Ormond Beach Generating Station (OBGS), and GenOn Delta, LLC has prepared an Implementation Plan for the Pittsburg Generating Station (PGS) to comply with the State Water Resources Control Board’s (State Board) “Statewide Water Quality Control Policy on the Use of Coastal and Estuarine Waters for Power Plant Cooling” (Policy).1 GenOn has a viable Track 1 compliance plan for the PGS, and viable Track 2 compliance plans for the MGS and OBGS. Even though GenOn has viable compliance plans for each station, GenOn is unable at this time to make an unqualified commitment to the significant investment necessary to comply with Track 1 of the Policy at PGS, nor is GenOn necessarily able to commit to the investment required for compliance under Track 2 at the MGS and OBGS in light of significant market-based uncertainties facing independent power producers in California.2
The purpose of this exhibit is to provide background and explain the market-based constraints that prevent GenOn from making an unqualified commitment to the significant capital investment required to undertake compliance with the Policy. If GenOn cannot secure the funding necessary to make the investment necessary to implement the identified Track 1 and Track 2 compliance measures, then GenOn would likely be forced to retire or repower its effected units.
This Exhibit first provides an overview of the criteria by which GenOn must evaluate incremental investment decisions, and then describes the reliability services that GenOn’s once through cooled generating units are capable of providing. An overview of the contracting and market opportunities through which GenOn is compensated for providing reliability services is then presented, followed by a discussion of the external factors that contribute to the uncertainty GenOn faces in forecasting the future net revenues from the sale of these reliability services. This exhibit concludes with a summary of why, as of April 1, 2011, these uncertainties prevent GenOn from making an unqualified commitment to the investment required for the compliance measures described in the Implementation Plans for the PGS, MGS and OBGS.
1 Hereafter, GenOnWest, L.P. and GenOnDelta, LLC, either individually or collectively, are referred to as “GenOn.” This Exhibit is common to the each of the Implementation Plans submitted by GenOn for the PGS, MGS and OBGS, 2 For the PGS, Track 1 compliance would involve retirement of PGS Unit 7 and conversion of that unit’s cooling towers for use by PGS Units 5 and 6. Track 1 compliance at the MGS and OBGS would require investment in new cooling towers, if feasible, while Track 2 would require the implementation of one or more technological measures to reduce impingement mortality and entrainment and may involve operating restrictions that could have a significant impact on revenues.

Page 4 of 22 March 31, 2010
1. Investment Criteria GenOn is a competitive energy company that produces and sells electricity in the United States. GenOn is focused on the operational performance of our generating facilities, and prudent growth of our business. GenOn makes major investments in environmental controls, and also employs a targeted maintenance program to ensure long-term availability of our generating stations. GenOn must factor in appropriate return for shareholders when deciding which investments to make, and must also comply with all covenants and restrictions associated with any project financing used to fund major capital projects. GenOn sells capacity, energy and ancillary services on a short-term basis or through power sales agreements. GenOn is not guaranteed recovery of our costs or any return on our capital investments through regulated rates. Whether an appropriate return can be earned for investors depends on the sufficiency and the certainty of net revenues after meeting all operation and maintenance expenses, ordinary capital expenditures and payment obligations on any project financing. Operating revenue depends on market and competitive forces that are beyond GenOn’s control. Retrofit to closed-cycle cooling to comply with Track 1, or implementation of a combination of measures to meet Track 2 would require a significant investment as explained in each Implementation Plan. Given the uncertainty regarding the fixed and annual costs of compliance with the Policy, as well as significant uncertainty regarding revenues, GenOn cannot reasonably assure that it will recover the investment required for cooling towers, or any other combination of technologies and operating restrictions that might allow the generating units to comply with the Policy, and is therefore unable at this time to commit without qualification to those investments. These factors are discussed in more detail below.
2. Operating Characteristics and Available Services The following describes the existing operating characteristics and capabilities of the MGS, OBGS and PGS. When matched with the contracting and market opportunities discussed later, these capabilities define the potential revenues that must support any capital investment at those plants.
A. Operating Characteristics The operating characteristics of the PGS, MGS and OBGS allow these plants to play a key role in supporting reliable operation of the electric grid. An important characteristic of each station is its location. The California Independent System Operator (CAISO) relies on the PGS, MGS and OBGS units to support local and system reliability during maintenance of the high voltage grid. Both the MGS and OBGS are in the Big Creek Ventura Area, and are used by the CAISO to assure that load in Ventura and Santa Barbara Counties can be served when the transmission lines providing imports to the local area are threatened, particularly by fires or other natural disasters.

Page 5 of 22 March 31, 2010
The MGS and OBGS turbines also provide rotating mass that contributes inertia required to support imports into Southern California. The PGS is located in the Pittsburg sub-area of the Greater Bay Area. The PGS supports grid operations in the Greater Bay Area and provides support for the transmission system in the North Bay Area as well. This support not only protects the local grid but enables imports into the load centers located in the Bay Area from the bulk transmission system connecting the Bay Area with northern California and the Northwest. The MGS units have relatively quick start-up times, particularly when the units are hot and start times are less than two hours. This allows the CAISO to cycle these units daily. The minimum load of each unit is 20 MW, which is less than 10% of the peak capability. The OBGS and PGS units have wide operating ranges and fast ramp rates which are important characteristics for reliability purposes.3
While the OBGS ramp rates are already high (e.g. up to 12 MW/Min), there is on-going analysis to increase OBGS ramp rates to even higher levels in response to forecasted flexibility needs. Both OBGS units have also been tested to operate at reduced minimum loads.
While there are some key differences among the PGS, MGS and OBGS stations, each station plays an important role in supporting electric system reliability and integrating intermittent renewable resources. The services available from these facilities are described in more detail below.
B. Available Services The CAISO presently relies on several services provided by the PGS, MGS and OBGS. Some of these services are defined as market products that are procured in advance of the operating day, and for which there is some degree of fungibility so that the products can be competitively procured and priced. The services available from each unit represent the potential sources of revenue. Contracting and market mechanisms to compensate suppliers for providing these services are discussed later.
1. Resource Adequacy (RA) Capacity The CAISO performs technical studies to establish minimum capacity requirements for each of several “local reliability areas” to assure that load in those areas can be reliably served. All load-serving entities (LSEs) are then required to demonstrate that they have procured sufficient “net qualifying capacity” to serve their peak load, plus a planning reserve margin of 15% to 17%. The net qualifying capacity of each resource is determined by the CAISO based on testing, verification, applicable performance criteria and deliverability for the purpose of meeting peak demands, based on rules for determining the qualifying capacity of each resource type as established by the California Public Utilities Commission (CPUC). According to this process, the MGS, PGS and OBGS have net qualifying capacity equal to the maximum output of each unit, as shown below: 3 An operating range is the difference between a unit’s Net Qualifying Capacity and its Pmin. In the case of OBGS Unit 2, the operating range is 725 MW (NQC of 775 MW minus Pmin of 50 MW).

Page 6 of 22 March 31, 2010
Unit Net Qualifying Capacity (MW)
PGS 5 312 PGS 6 317 PGS 7 682 MGS 1 215 MGS 2 215 OBGS 1 741 OBGS 2 775
As explained in more detail below, the CAISO performs technical studies to establish minimum capacity requirements for each identified local reliability area to assure that load in those areas can be served without violating transmission constraints. Some portion of the total capacity required to serve load in each of these local reliability areas is then required to be located within the local reliability area (i.e., that portion of the capacity requirement cannot be provided by resources external to the local reliability area). RA capacity is obligated to be available and capable of being committed and dispatched. Since the CAISO could call on these units at any time, the PGS, MGS and OBGS units support reliability of the grid even when the units are off-line and not producing energy. The RA capacity value of these units helps assure the long term reliability of the grid, and that value is independent of how much energy they actually produce.
2. Local Emergency Capacity During certain conditions that have occurred recently, the CAISO has relied upon the MGS and OBGS to assure reliable electric service to the local reliability area. For example, due to wildfires in September 2009 that were threatening the transmission lines across which energy is imported to Santa Barbara and Ventura Counties, the CAISO relied upon the MGS and OBGS units to assure that load in these two counties could be served without interruption.
3. Energy When committed and dispatched to minimum load or greater, the PGS, MGS and OBGS units provide energy that helps the CAISO perform its obligation to continuously balance loads and resources within the CAISO Balancing Authority Area, while respecting all transmission limits. Energy bids are submitted to the CAISO for use in the day-ahead and real-time markets, and the CAISO commits and dispatches resources to economically serve load and relieve any transmission congestion that might arise.
4. Regulation Regulation is generally regarded as the highest value Ancillary Service that the CAISO procures to assure the reliable operation of the grid. Regulation requires a unit to change output in response to signals provided by the CAISO’s energy management system every four seconds through automatic generation control. Each of the MGS and OBGS units,
Page 7 of 22 March 31, 2010
and PGS Unit 5, are certified to provide regulation. The CAISO competitively procures Regulation through its markets.
5. Spinning Reserve The CAISO is required to maintain sufficient spinning reserve, which is synchronized and available to immediately respond when dispatched. This capacity service is required so that the CAISO is able to respond when a contingency occurs, such as the loss of a major transmission line or generating unit, assuring that applicable reliability criteria are met. The CAISO competitively procures Spinning Reserve through its markets.
6. Frequency Response Conventional generating units are synchronous machines that are electrically coupled to the grid. All of the PGS, MGS and OBGS units meet applicable WECC criteria for frequency response, and when operating and synchronized these units respond immediately and automatically in proportion to frequency deviations through the action of a governor set according to the minimum governor performance standards defined by the CAISO (i.e., 5 percent droop and +/- 0.036 Hz deadband). There is currently no CAISO market for frequency response.
7. Voltage Support The PGS, MGS and OBGS units are operated to follow voltage schedules established by the CAISO by producing or consuming “Mvars” which is a measure of reactive power. Reactive power is necessary to maintain system voltage in an alternating current system. Synchronous generators such as the PGS, MGS and OBGS units represent one of the most flexible and effective sources of reactive power available to the grid, and play a key role in assuring the voltage stability of the grid. There is currently no CAISO market for voltage support.
8. Inertia The MGS and OBGS play a key role in supporting energy imports to Southern California. The stability of the grid depends on assuring a balance between imports across these paths, and the amount of inertia, or rotating mass available in southern California. The PGS provides the same function for Northern California and specifically the Greater Bay Area load center, which depends on significant imported energy over several paths. There is currently no CAISO market for inertia.
3. California Electric Market Structure Overview The purpose of this section is to explain the existing wholesale electric market design in California. This understanding is essential background to an assessment of the financial feasibility of the capital investments required to comply with the Policy. There are two principal categories of customers – the LSEs who must purchase RA capacity (e.g. PG&E, SCE, SDG&E, energy service providers (ESPs) and local publicly-owned utilities) and the CAISO, which acts as an intermediary between suppliers and loads by operating day ahead and real time markets for energy and ancillary services. GenOn sells RA capacity from the MGS and OBGS and bids those units into the CAISO

Page 8 of 22 March 31, 2010
markets. For the PGS, GenOn has entered a “tolling” agreement under which PG&E has acquired the rights to all the RA capacity, energy and Ancillary Services through 2013, with an option to extend this agreement through 2015. PG&E has the right to all the PGS RA capacity, and is responsible for bidding and scheduling those units in the CAISO markets.
A. RA Program The RA program is an existing bilateral framework administered by the CPUC, the California Energy Commission (CEC) and the CAISO. The CPUC establishes resource adequacy requirements for all LSEs in its jurisdiction, which include the three major investor-owned utilities (IOUs) serving bundled customers, and the energy service providers (ESPs) who serve load under California’s rules for retail competition. Each LSE is required to maintain physical generating capacity that is both adequate to meet its load requirements (including peak demand and planning and operating reserves) and deliverable to load. The capacity procured must be sufficient to meet the planning reserve and reliability criteria established by the Western Electricity Coordinating Council.4
The local publicly-owned utilities in California are not under the jurisdiction of the CPUC, but are required to prudently plan for and procure resources that are adequate to meet peak demand and provide the reserves necessary to provide reliable electric service to its customers. The CEC has authority to oversee the resource adequacy programs of the local publicly-owned utilities.5
1. Demand Forecasts
An initial step in the annual RA process is the preparation of demand forecasts for the coming year. Each May of the year preceding the RA compliance year, LSEs regulated by the CPUC submit demand forecasts for the RA compliance year to the CEC. CEC staff review the forecasts and make adjustments as needed so that the sum of the adjusted forecasts is within one percent of the adopted CEC forecast for each distribution service area. The CEC then transmits the demand forecasts to the CPUC, which in turn transmits them to LSE’s, usually in the July prior to the RA compliance year.
2. Local Capacity Technical Studies Each year the CAISO conducts a Local Capacity Area Technical Study (referred to as the Local Capacity Requirements or LCR Study) to identify the minimum capacity required in each local capacity area defined by the CAISO. In October 2010, the CAISO began the process to define local capacity requirements for 2012 by publishing a draft manual on the criteria, method and assumptions to be used in the LCR Study. The CAISO adopted a final manual in December 2010, presented draft results in March 2011, and will publish its final LCR report for 2012 by the end of April. The CPUC will then review the conclusions of the CAISO LCR Study in its annual resource adequacy proceeding. The CPUC adopts local capacity requirements by the end of June so that LSEs are able to procure local RA capacity for the following year in accordance with the requirements adopted by the CPUC. 4 Section 380 of the California Public Utilities Code. 5 Section 9620 of the California Public Utilities Code.

Page 9 of 22 March 31, 2010
The CAISO Tariff provides that in conducting the LCR Study, the CAISO will identify and resolve contingencies based on performance levels specified in North American Electric Reliability Corporation (NERC) Reliability Standards, as supplemented by CAISO reliability criteria. While the studies are carefully performed to meet the NERC standards, they are also designed to maximize the import capability in each local area and minimize the local generation required to meet reliability requirements. The CAISO identifies the most stringent contingencies based on NERC criteria, and then loads the limiting element to 100% of its applicable rating for constraints that result from equipment loading limits, while targeting the minimum allowable voltage and/or reactive margin after the most restrictive contingencies are taken.6
The LCR Study defines the portion of the total capacity required to serve load in each of these local reliability areas that is required to be located within the local reliability area (i.e., that portion of the capacity requirement cannot be provided by resources external to the local reliability area). The results of the LCR Study may show a surplus in a local area, but that does not necessarily mean that generation equal to that surplus can be retired. The CAISO acknowledges that not all capacity in a local area is equally effective in solving local constraints.7
3. Local and System Resource Adequacy Obligations
The PGS, MGS and OBGS all have high effectiveness factors. The CAISO may also require generation in local areas for other purposes that are not considered in the LCR Study. For example, additional generation in a local area may be required to allow maintenance to the high voltage transmission grid, or to provide inertia to support transmission limits and the stability of the grid.
Based on the minimum local requirements identified in the CAISO’s annual LCR Study, the CPUC adopts local capacity requirements, which are assigned to LSEs based on what share of load they serve in that local area. Each July the CPUC staff provides each LSE with load forecasts and local obligations. Each September, LSEs must demonstrate they have procured 100% of their share of the local capacity requirement for the coming year. The difference between an LSE’s share of the capacity requirement for the local capacity area, and the total capacity required to serve that LSE customers in the local area, can be procured from the net qualifying capacity of any local or system resource. As explained above, the PGS is in the Greater Bay Area, and the MGS and OBGS are in the Big Creek / Ventura Area, meaning that each station is eligible to meet the local capacity obligations of LSEs under the RA program. Each October, LSEs must demonstrate procurement of 90% of system obligations, with demonstration of remaining system obligations due on a month-ahead basis during the compliance year. The timing of these obligations defines the opportunities for marketing RA capacity from the MGS and OBGS currently, and for the PGS after the tolling agreement with PG&E expires.
6 California ISO, Final Manual - 2012 Local Capacity Area Technical Study, December 2010, page 7. (available at: http://www.caiso.com/2867/286794795d0b0.pdf ) 7 Id.
Page 10 of 22 March 31, 2010
4. Standard Capacity Product Operators of units with RA commitments are subject to must-offer obligations in the CAISO markets, and also are subject to availability charges and bonuses based on the extent of unplanned outages that render the resource adequacy resource unavailable for commitment and dispatch by the CAISO. The risk of non-availability charges and possible opportunity to earn availability bonuses must be taken into account during operations, and in planning outages to maintain and replace equipment.
B. Energy and Ancillary Services Markets The CAISO provides open and non-discriminatory access to the high voltage transmission network under its operational control, operates Day Ahead markets for energy and ancillary services, and establishes schedules for energy and load that are consistent with applicable constraints on transmission facilities and other elements of the grid. In operating the day ahead market, the CAISO first assesses market power, determines what bids need to be mitigated, and then determines what reliability must-run units must be committed to meet reliability requirements. It then operates an integrated forward market to schedule resources and set prices. The integrated forward market uses a security constrained unit commitment optimization to determine the commitment and dispatch of resources to jointly minimize the cost of required locational energy, and all ancillary services forecast to be required to meet reliability criteria each hour of the next operating day, while respecting all applicable transmission constraints. Hourly locational prices are set for energy and ancillary services. The ancillary services procured include regulation up, regulation down, spinning reserve and non-spinning reserve. To the extent that the demand scheduled in the integrated forward market falls short of the CAISO forecast, then a residual unit commitment market is run to commit additional capacity to meet the difference in forecast and scheduled demand. A real-time unit commitment tool is used in both the hour ahead scheduling process and the real time markets to adjust energy schedules and to procure any additional ancillary services required due to changed conditions. The real-time unit commitment process is run every 15 minutes, and the CAISO dispatches energy based on bid prices to set locational marginal prices every 5 minutes to balance the system, with regulation used to provide moment to moment balancing and maintain system frequency.
C. Exceptional Dispatch If the CAISO market models fail to reflect all applicable constraints, or do not specify all the products that the CAISO requires to reliably operate the system, then the CAISO may rely on an out-of market process referred to as “exceptional dispatch” to commit and dispatch resources based on their locational and operating characteristics. Units that are exceptionally dispatched are compensated based on mitigated bids if the exceptional dispatch is needed to relieve a non-competitive transmission constraint.

Page 11 of 22 March 31, 2010
D. Reliability Must Run The CAISO has the authority to procure uneconomic capacity that it determines to be essential to local reliability through a cost-of-service mechanism provided by reliability must-run (RMR) contracts. The CAISO makes the determination of whether a generator is required for reliability based on the LCR Study, or other technical analysis that the CAISO conducts. The RMR contract gives the CAISO the right to call on energy, or to require the supplier to provide ancillary services. When designated for RMR, a generating unit that might otherwise retire is obligated to provide the CAISO with proposed rates for reliability must-run services, which are then filed with the Federal Energy Regulatory Commission (FERC). The RMR contract is a year-to year contracting mechanism that requires the generator to develop comprehensive cost exhibits supporting its proposed rates. Under the CAISO tariff, the RMR contract is designed for addressing local reliability, black start services, voltage support and non-competitive constraints, and does not allow the CAISO to procure or dispatch such capacity for broader system reliability purposes that might be fulfilled by other generating units.
E. Capacity Procurement Mechanism The CAISO tariff allows the CAISO to procure capacity from resources without a resource adequacy contract under the CAISO’s “interim capacity procurement mechanism” which expired March 31, 2011. The CAISO has proposed a permanent backstop capacity procurement mechanism (CPM) that would compensate resources based on their “going forward” costs. The new CPM became effective April 1, 2011. Features of the CAISO’s permanent CPM mechanism include expanded authority to designate resources without RA contracts for a CPM contract. This authority includes designations for units at risk of retirement that the CAISO determines are needed for reliability. Parties protested the CAISO’s proposal at FERC, seeking changes in the purpose, pricing, term and amount of capacity that the CAISO is authorized to procure under CPM. In a March 17, 2011 decision adopting most of the CAISO’s proposed design details, FERC concluded that the CAISO’s proposal to pay going forward costs “may create the potential for distorted pricing signals and deny resources a reasonable opportunity to recover fixed costs,” and directed FERC staff to schedule a technical conference to explore CPM pricing.8
F. Renewable Integration and New Products
The ability to recover fixed costs is an essential prerequisite for GenOn to fund Track 1 or Track 2 measures required to comply with the Policy.
The CAISO forecasts substantial reductions in revenues to the existing thermal fleet as renewable resource penetration increases, and energy generated by thermal resources is displaced by renewable energy. Specifically, the CAISO recently concluded that:
8 Federal Energy Regulatory Commission, Order on Tariff Revisions, Docket No. ER11-2256-000 Order 134 FERC ¶ 61,211, paragraph 57.

Page 12 of 22 March 31, 2010
“The combination of increased production of wind and solar energy will lead to displacement of energy from thermal (gas-fired) generation in both the daily off-peak and on-peak hours. Due to this displacement and to simultaneous reduction in market clearing prices, there may be significant reductions in energy market revenues to thermal generation across the operating day in all seasons.”9
The revenue impact of this displacement of energy by renewable resources will depend on many factors as discussed herein, but certainly inhibits investments such as those required to comply with the Policy. While energy revenues to thermal power plants are projected to decrease, the CAISO will have significantly greater need for many of the services these resources provide. In operating a power system, it is vital that sufficient generation resources are available to allow hourly and real-time deviations between forecasted load and supply to be balanced by the grid operator. These deviations can take place in the upward or downward direction and have historically have been caused by changes in load. With increasing reliance on intermittent renewable resources, which are characterized by deviations in output that can be large and difficult to predict, the root cause of the CAISO’s need for resources to balance the system is evolving. Intermittent renewable resources contribute significant variability in hour-to-hour and intra-hour output, as well as significant uncertainty in forecasting that output, and generally do not contribute the same benefits of frequency response and inertia that are essential to assuring the security of the grid. As more renewable resources are added, the CAISO’s need for additional regulation, ramping, reserves and on-line capacity is likely to materially increase. For these reasons, it is critical that the CAISO has enough dispatchable resources and other reliability services under its control. The CAISO is performing extensive analysis of the impact of California’s renewable portfolio standard (RPS) on reliable operation of the CAISO balancing area, and has concluded that substantially more ancillary service capacity will be required to integrate renewable resources.10 At a recent symposium, the CAISO’s CEO spoke about the operational challenges in integrating renewables, and estimated that procurement of some ancillary service products will need to double or triple.11
To assure that the CAISO is procuring the required capability from the existing fleet of generators, the CAISO has developed a flexible ramping constraint which is incorporated into the market optimization software. By using this constraint, the CAISO can impose a minimum ramping capability across a specified period of time, which may result in
9 Integration of Renewable Resources - Operational Requirements and Generation Fleet Capability at 20% RPS, CAISO (Aug. 31, 2010), p. v. This report is available at the following link: http://www.caiso.com/2804/2804d036401f0.pdf. 10 Id. 11 Yakout Mansour, ISO Symposium Keynote Speech, October 19, 2010, available at: http://www.caiso.com/2836/2836f22a24980.pdf

Page 13 of 22 March 31, 2010
changes in the commitment and dispatch of resources if this constraint is binding. The use of such a constraint is not fully transparent and does not properly value the capacity services that are thereby made available to the CAISO. Recognizing that new products may be required, the CAISO is initiating a process in April 2012 to examine its requirements and to consider defining new ancillary service products to facilitate the integration of intermittent renewable resources.
G. Other Western Markets NERC is the national entity responsible for developing reliability standards, which are the planning and operating rules that assure that each operating entity supports system reliability. The Western Electricity Coordinating Council (WECC) is the regional entity responsible for coordinating reliability of the bulk electric system in the western interconnection, which includes 14 western states, two Canadian provinces, and part of Mexico. The CAISO is obligated to comply with the planning and operating standards administered by WECC and NERC, and to procure the required ancillary services to assure the reliable operation of the CAISO’s balancing area. The CAISO is the only centrally administered day-ahead and real-time market in the western states. WECC members are considering the establishment of an imbalance energy market as part of the “efficient dispatch toolkit.” Such a mechanism has the potential to increase liquidity, transparency and reliability of the western interconnection.
H. Procurement Background
1. CPUC Long Term Procurement Planning (LTPP) Process The LTPP Rulemaking provides a biennial review of the IOUs’ procurement process, established pursuant to AB57. The IOUs submit LTPPs that serve as the basis for utility procurement and comprehensively integrate Commission decisions from all procurement related proceedings. By approving ten-year procurement plans in advance, the CPUC provides up-front standards for procurement which eliminates the need for after-the-fact reasonableness review by the CPUC of the specific resource procurement decisions each IOU pursues in implementing the approved procurement plan. Independent power producers engage in the LTPP process to better understand the energy and capacity needs of the IOUs. As stated in a recent assigned commissioner ruling issued in the CPUC’s current LTPP process:
“Track I will identify California Public Utilities Commission (CPUC)-jurisdictional needs for new resources to meet system or local resource adequacy and to consider authorization of IOU procurement to meet that need, including issues related to long-term renewables planning and need for replacement generation infrastructure to eliminate reliance on power plants using once-through- cooling (OTC).”12
12 Order Instituting Rulemaking to Integrate and Refine Procurement Policies and Consider Long-Term Procurement Plans, R.10-05-006, Assigned Commissioner and Administrative Law Judge's Joint Scoping Memo and Ruling (December 3, 2010), Attachment 2 (Standardized Planning Assumptions (Part 2 –

Page 14 of 22 March 31, 2010
As an independent power producer in California with both existing assets and a new project in development,13
2. Utility and ESP Procurement Practices
GenOn participates in each LTPP process to understand how all of our current assets and future developments may play a role in meeting the aforementioned Track I needs.
Traditionally, California’s IOUs have procured capacity, energy, and ancillary products from existing assets through short-term (up to five years out) Request-For-Offer (RFO) processes. GenOn, and its predecessor companies, have always participated in these processes and it is the primary means for securing contracts for capacity, energy, and ancillary products. California’s IOUs have historically purchased bundled capacity and energy products from new facilities through long-term (generally 10 years) RFO’s designed specifically for new facilities. Existing assets are not eligible to participate in these “new-build” RFOs. California’s Energy Service Providers (ESPs) have a much shorter term business model and they tend to just purchase capacity and energy products a year in advance. Most of this contracting takes place bi-laterally. The net result of the IOU and ESP purchasing practices is that there is little financial certainty beyond 2-3 years in terms of contracted revenues. Accordingly, it becomes very difficult to forecast revenues beyond this window. In addition, while market participants such as GenOn have access to forward supply and demand forecasts from various California agencies, there is very little information provided in terms of what specific generating assets will be needed in the future. Independent power producers like GenOn face substantial uncertainty in interpreting available data, forecasting future demand for services from each plant, and estimating future revenues from the sale of such services. This uncertain environment and short horizon for procurement by our customers may lead to suboptimal decisions for the broader market as capital intensive businesses such as power plant development and operation have longer term planning horizons for capital expenditures.
3. Once-Through Cooling Capacity Replacement As stated in the “State Water Resources Control Board Resolution No. 2010-0020”:
The State Water Board staff formed an Interagency Working Group (IAWG) that met regularly to develop realistic implementation plans and schedules for this Policy that will ensure that the beneficial uses of the State’s coastal and estuarine waters are protected while also ensuring that the electrical power needs essential for the welfare of the citizens of the State are met. The IAWG included representatives from the California Air Resources Board, the California Coastal
Renewables) for System Resource Plans), p. 6. A copy of Attachment 2 is available at the following link: http://docs.cpuc.ca.gov/efile/RULC/127544.pdf. 13 The Marsh Landing Generating Station, owned by GenOn Marsh Landing, LLC, an affiliate of GenOn Delta, LLC and Genon West, L.P., is currently under construction.

Page 15 of 22 March 31, 2010
Commission, the California Energy Commission (CEC), the California Public Utilities Commission (CPUC), the California State Lands Commission, the California Independent System Operator (CAISO), and the State Water Board.
The compliance dates for the Policy were developed in consideration of a report produced by the energy agencies, titled “Implementation of OTC Mitigation Through Energy Infrastructure Planning and Procurement Changes.”14
The key milestones in planning for the PGS, MGS and OBGS compliance dates are set forth below:
Infrastructure Replacement
Milestone Description
PGS Date
MGS OBGS Date
CAISO Enhanced LCR Study
CAISO completes an enhanced Local Capacity Requirement (LCR) study identifying the impacts of specific OTC retirements or transmission developments on the local area’s LCR projections 10 years out.
Q4 2009
Q4 2010
Infrastructure Replacement Plan
The CAISO, CEC, and the CPUC complete Infrastructure Replacement Plan identify the complete set of infrastructure needed to make OTC plants/units redundant for grid reliability. It would advise the SWRCB about the reliability designations of specific power plants.15
Q1
2010 Q2
2011
CAISO Annual Transmission Plan
Transmission solutions (upgrade and/or new addition) that would make specified OTC system redundant would be analyzed in the California ISO Annual Transmission Plan. The California ISO will consider SWRCB directives and schedules limiting or canceling water permits required to operate OTC plants/units in the 2011 and subsequent annual Transmission Planning Process (TPP). The California ISO will conduct analysis as part of its TPP reflecting projected OTC plant/unit retirements as a result of SWRCB directives and schedules, which shall be incorporated in to the California ISO’s annual Transmission Plan that serves as the basis for further transmission upgrades or additions.
2011 2012
LTPP Approval CPUC modifies LTPP proceeding and procurement processes to require the IOUs to assess replacement infrastructure needs, conduct targeted RFOs to acquire replacement or repowered generation capacity, and order the IOUs to procure new (or repowered) fossil generation for system reliability.
2011 2013
Generation Project Approval
Once authorized to procure by a CPUC LTPP decision, it takes 18 months for the IOUs to issue an RFO for generation (new or repowered), sign contracts and submit applications to the CPUC for approval. Approval by the CPUC takes 9 months.
2013 2015
CPUC Transmission Permitting
Proposed transmission facilities to meet needs identified in the California ISO Annual Transmission Plan to replace OTC plants/units would be brought to the CPUC for approval.
2015 2016
14 California Energy Commission, California Public Utilities Commission, California Independent System Operator, Implementation of Once-Through Cooling Mitigation Through Energy Infrastructure Planning and Procurement, Appendix B, July 2009, available at: http://www.energy.ca.gov/2009publications/CEC-200-2009-013/CEC-200-2009-013-SD.PDF 15 No “Infrastructure Replacement Plan” that identifies the complete set of infrastructure needed to make OTC plants/units redundant for grid reliability has been published on the CEC, CPUC or CAISO web sites as of March 31, 2011.

Page 16 of 22 March 31, 2010
Infrastructure Replacement
Milestone Description
PGS Date
MGS OBGS Date
Unspecified Replacement Infrastructure Operational
These compliance dates may change subject to the California ISO-Energy Commission-CPUC Infrastructure Replacement Plan produced in Q1 2010 and updated periodically. All dates assume a generation solution that requires an Energy Commission permit. If a permit has been acquired prior to CPUC contract approval, then an earlier on line date is possible. If transmission solutions are selected, then longer time lines would be expected.
2017 2020
The energy agencies worked diligently to develop the schedule outlined above, and it is instructive to consider the performance to that schedule over the 18 months since it was published. In developing the Policy, the State Board recognized that the compliance dates in this Policy may need to be revised based on the reliability needs of the electric system as determined by the energy agencies included in the Statewide Advisory Committee on Cooling Water Intake Structures (SACCWIS). Among the responsibilities of the SACCWIS is the review of generator implementation plans to consider whether or not local and system reliability has been considered. One task planned by the energy agencies in the above schedule to support planning for the potential retirements that may arise due to the Policy is the development of “infrastructure replacement plans” in the first quarter of 2010 and 2011 that would identify the “complete set” of infrastructure needed to make OTC plants/units “redundant for grid reliability.” Although the CAISO and other agencies have performed substantial analysis and planning for OTC retirements and the impacts of building out renewable resources to serve 20% to 33% of energy serving load in California, no infrastructure replacement plans have been developed, demonstrating the significant complexity of planning for the implementation of the Policy.
4. Sources of Uncertainty The purpose of this section is to further describe several of the important uncertainties regarding costs and revenues that GenOn faces, and to then explain how these uncertainties leave GenOn with insufficient confidence in the adequacy of net revenues to recover the cost of the substantial investment required to comply with the Policy given the current market and contracting structures, thereby preventing an unqualified commitment to such investment at this time.
A. Economic Outlook A major source of uncertainty facing any company evaluating the merits of a major investment to comply with a regulatory policy is the economic outlook in California. The recent recession has depressed the demand for electricity. A CEC report issued in March 2011 shows reductions in forecasted peak demand for 2011 and 2012 ranging from 2.9% to 4.7% below what had previously been forecasted in 2009 for the same period.16
16 See Miguel Garcia-Cerrutti, Tom Gorin. Chris Kavalec. Lynn Marshall. Committee Final Report: Revised Short-Term (2011-2012) Peak Demand Forecast. California Energy Commission, Electricity
In

Page 17 of 22 March 31, 2010
other words, in a relatively short period of time, demand forecasts show significant fluctuation due to the recession. As these reductions in the demand forecasts suggest, the overall demand for electricity is less than what is was before the recession. Given the reduced demand for electricity and uncertain economic outlook, there is significant uncertainty about the volume or price of energy sales from GenOn’s generating stations.
B. Environmental Mitigation Costs Among the requirements of the Policy is the development of interim mitigation measures that must be in place by October 1, 2015. The mitigation plan may include existing mitigation efforts, or a California Coastal Conservancy project funded by GenOn, and will be overseen by a panel of experts. There is substantial uncertainty regarding the cost of this program. As explained in the OBGS and MGS Implementation Plans, GenOn will also examine operating restrictions as a potential flow-based compliance measure to reduce impingement and entrainment. Such measures could limit the availability of these stations to provide energy and related services, potentially reducing revenues to a degree that compliance with the Policy, if dependent on such operating restrictions, is uneconomic.
C. Ongoing Capital Expenditures GenOn employs a condition-based maintenance program to ensure that we meet reliability standards for each of our units. A condition-based maintenance program is a program in which ongoing capital expenditures are valued by the economic return of restoring equipment life and/or improving functionality. This is largely dependent on the remaining economic life of the plant over which the investment is recouped. Availability standards are typically discussed in terms of a target for NERC Generating Availability Data System (GADS) Equivalent Forced Outage Rate for Demand (EFORd), but other factors such as contractual availability rebates and CAISO Standard Capacity Product charges also play a key role in the development of GenOn’s operations and maintenance program. GenOn sets an aggressive EFORd target for our California assets, but that target is set based on GenOn’s expectation that net revenues from operations will support the capital investment required to maintain this level of reliable performance. Both the amount of capital expenditures and the adequacy of net revenues to support such investment are uncertain.
D. Renewable Integration There is significant uncertainty regarding the extent of renewable development, the amount by which energy revenues to thermal resources are reduced, the future requirements for operating flexibility from renewable resources, and the market revenues from existing or new ancillary services procured to support renewable integration.
Supply Analysis Division. CEC-200-2011-002-CTF. This report is available at the following link: http://www.energy.ca.gov/2011publications/CEC-200-2011-002/CEC-200-2011-002-CTF.PDF .

Page 18 of 22 March 31, 2010
One key challenge in forecasting the role GenOn’s units would play in renewable integration is estimating the pace of renewable development and the operating characteristics of renewable projects. It is not clear as to which types of renewable projects will get fully developed, permitted and eventually built. Policy makers, regulators, and market participants are all grappling with various RPS build-out scenarios as the mix of renewable technologies (e.g. wind vs. solar), location and dispatchability can have vastly different implications in terms of reserve capacity and ancillary services required for integration. There is also significant uncertainty about how the intermittency of renewable resources will be addressed. If the CAISO relies on operating constraints such as the flexible ramping constraint discussed above, rather than competitively procured and priced market products, then revenues to suppliers like GenOn will be negatively affected, increasing uncertainty and reducing net revenues.
E. RA Rules As currently constructed, the RA rules only require a year-ahead demonstration by an LSE that it has procured sufficient capacity to serve its needs. As a result, existing generation only has access to relatively short term capacity contracts. This short timeframe of current year-ahead process does not support investment in new generating capacity, which also means there is little to no supply flexibility. For the magnitude of the investment likely required to comply with the Policy, it may not be possible to structure a capacity offer that is both competitively structured, and of sufficient value (based on MW, price and duration) to compensate investors or support debt financing. The current bilateral contracting framework does not recognize the full value of capacity, does not provide transparent prices, significantly increases transaction costs, and fails to provide an integrated, durable backstop procurement mechanism. Efforts to improve the forward capacity contracting process through the creation of a centralized capacity market have not yet succeeded.17
F. CAISO Market Rules
The uncertainty surrounding the creation of a centralized capacity market adds to the difficulty of knowing whether market revenues will be sufficient to support the investment necessary to comply with the Policy. Finally, possible changes to the planning reserve margin and related RA reliability metrics further complicate any projection of what revenues might be available to recover the investment required to comply with the Policy.
Evolving CAISO market rules create additional uncertainty. For example, in April 2011, FERC staff is expected to conduct a technical conference to explore what changes in 17 “Valuing capacity products in the state is still far from market basis. But the only way to reflect a market value of a product is to have a market and the stakeholders are split on whether to have one. In the meantime, our only available approach is the regulated, largely cost based approach. Believe me, we don’t dislike it any less than the generator community does and we see no way around creating a capacity products market for this purpose and equally important opening a wider door for demand response. We will have to reopen the debate again, hopefully this time in a conclusive consensus when guided by the recent findings.” See Yakout Mansour’s keynote address from the 2010 Stakeholder Symposium at http://www.caiso.com/2836/2836f22a24980.pdf .
Page 19 of 22 March 31, 2010
pricing are necessary to assure that the CPM, described above in Section 3(E), is just and reasonable, and allows generators an opportunity to recover fixed costs. Another important initiative discussed above is the CAISO’s consideration of new products required to integrate renewable resources. It is unclear whether the CAISO will ultimately decide to establish new products, or simply use tools such as the flexible ramping constraint to obtain the services required. The outcome could have significant implications for revenues available to capacity resources. These uncertainties make it difficult to project future net revenues to support additional investment.
G. Infrastructure Requirements There are substantial uncertainties about the nature, cost and timing of the transmission system improvements required to support integration of renewable resources, uncertainty about the availability of emission reduction credits necessary to build new thermal generation or repower existing project, and uncertainty about which OTC generators will be required beyond their compliance deadlines to provide inertia and other ancillary services in support of reliable system operation.
H. Demand Side Management and Energy Efficiency Demand-side management and energy efficiency play a key role today in California’s energy markets and will be important resources that California will depend upon to meet AB 32’s greenhouse gas reduction objectives. According to the 2010 CPUC LTPP Load and Resource Tables, demand-side management will account for approximately 9% of the peak demand starting in 2013 for the period through 2020.18 From the same tables, incremental uncommitted energy efficiency will grow from 1.5% of the peak demand in 2013 to 10% in 2020. These are impressive forecasts, but some of this technology and many of the new programs are untested, making it difficult to forecast their impact, and some of these forecasts have been challenged by consumer advocates.19
GenOn believes that there is significant uncertainty regarding the actual results of these programs, and whether or not more conservative estimates of their impacts will be adopted. Such a step may be prudent until there is a proven track record with regard to specific technologies, program participation, and reliability of estimated savings. The growth of these demand-side resources and intermittent renewable resources creates a market in 2020 where approximately 30% of the capacity is coming from non-
18 Order Instituting Rulemaking to Integrate and Refine Procurement Policies and Consider Long-Term Procurement Plans, R.10-05-006, Assigned Commissioner and Administrative Law Judge's Joint Scoping Memo and Ruling (December 3, 2010), Attachment 1 (Standardized Planning Assumptions (Part 1) for System Resources). A copy of Attachment 1 is available at the following link: http://docs.cpuc.ca.gov/efile/RULC/127543.pdf. 19 “TURN takes the position that the settlement agreement business case overstates the likely benefits of a Peak-Time Rebate (PTR) program, and the assumptions underlying the analysis of PTR should be adjusted to reflect lower expected benefits.” Source: DECISION APPROVING SETTLEMENT ON SOUTHERN CALIFORNIA EDISON COMPANY ADVANCED METERING INFRASTRUCTURE DEPLOYMENT - Decision 08-09-039 September 18, 2008

Page 20 of 22 March 31, 2010
conventional resources (e.g. renewables, demand response, energy efficiency and combined heat and power). Accordingly, reserve margins may be over-estimated, leading to the erroneous conclusion that some existing generating units are no longer needed. This uncertainty inhibits investment in existing thermal resources that may prove to be needed beyond their currently assumed retirement dates.
I. Technological Innovations California is aggressively pursuing modernization of its electric grid into a smart grid. The “smart grid” encompasses several technological enhancements, from the tools and data available to system operators to monitor every important element of the transmission network with perfect synchronization, to the use of smart meters to control appliances and give customers more information that will help them lower their electric bills by reducing or shifting electric consumption. A smart grid will also take advantage of distributed generation resources, which lower transmission losses and the need for new transmission lines, and energy storage resources, which adapt energy production to energy consumption. Like demand-side management and efficiency programs, these innovations also hold a lot of promise and in some cases can be considered to be transformative. As such, they will require an unprecedented level of coordination and communication between all market participants and policy makers. The cost and scale of these technologies create uncertainty regarding the extent to which they will be adopted, and how that adoption will affect market opportunities for existing resources relying on conventional technology. This uncertainty can inhibit investment necessary to comply with the Policy.
J. Regulatory Policy General regulatory uncertainty further clouds the availability of future revenues for gas-fired generation, adding to the difficulty of preparing a compliance plan for the Policy. A description of some of the areas of regulatory policy impacting the operation of the plants follows.
1. Climate Change Policy and Implementation While the California Air Resources Board (ARB) has indicated it will implement a cap-and-trade program for greenhouse gas (GHG) emissions effective as of January 1, 2012, ARB has yet to adopt final details related to how that cap-and-trade program will actually work. What is known is that GenOn will have to purchase credits to cover its GHG emissions. ARB has specified a floor price for those credits at $10 per ton but has not established a hard cap on the cost of those credits. At this point, GenOn cannot predict the cost to procure the requisite GHG credits to cover its operations or whether the application of a carbon fee will allow its plant to remain competitive. A recent court ruling found deficiencies in the ARB’s environmental review, adding additional uncertainty to the timing and cost of a final policy.
2. Technology Set-Aside Policy California’s demand for technology set-asides in the context of serving the electrical grid adds to regulatory uncertainty and whether there will be sufficient revenues to cover

Page 21 of 22 March 31, 2010
significant infrastructure investment. Current law requires IOUs to meet a 20% renewable portfolio standard by 2010.20 In 2008, Governor Schwarzenegger adopted an Executive Order establishing a 33% renewable electricity standard.21 Legislation has been passed by the California Legislature to place into statute the 33% requirement established by executive order.22
As noted earlier, the displacement of thermal energy from conventional power plants will cause significant reductions in revenues to those resources – the same resources that provide the ramping and reserves necessary to reliably integrate intermittent renewable resources. The prospect of lower revenues reduces the ability of independent power producers to commit to incremental investments.
Pursuant to a directive issued by AB 2514,23
5. Availability of Funding for Compliance Measures
the CPUC recently initiated a rulemaking to examine the role that storage will play, and one possible result could be the creation of a storage portfolio standard. All such technology set-asides increase uncertainty about the availability of future revenues that are necessary to finance the investment to comply with the Policy.
As explained in the Implementation Plans for the PGS, MGS and OBGS, GenOn has completed significant engineering and environmental work to evaluate compliance alternatives and develop reasonable programs for additional studies necessary to define final compliance plans. GenOn has identified preliminary Track 2 compliance plans at the MGS and OBGS and a viable Track 1 plan for the PGS, but GenOn cannot determine whether any of the compliance plans is financially feasible as of April 1, 2011. GenOn will seek to reduce the multiple sources of uncertainty that prevent a reasonable forecast of compliance costs, future revenues, and the sufficiency and certainty of net revenues to support funding the final plans over the next several years. GenOn first must be able to reasonably estimate the final cost of the compliance plans, including any negative impact on revenues resulting from operating restrictions necessary for the MGS and OBGS to meet the Track 2 requirements for reduced impingement and entrainment. When costs and any operating restrictions are reasonably defined, GenOn can evaluate the amount, duration and certainty of available revenues from RA contracts, tolling contracts or other contracting or market mechanisms. Only then can a reasonable assessment of the sufficiency of net revenues, including expected value, term and security of net revenues be assessed against the capital requirements of each compliance plan. In each Implementation Plan, GenOn has proposed a schedule for conducting additional studies and other work necessary to finalize the compliance alternative for each unit in time to allow a decision on whether to pursue the compliance investments for each facility sufficiently in advance of the prescribed compliance deadlines in the Policy (December 31, 2017 for the PGS, and December 31, 2020 for the MGS and OBGS). 20 SB 1078 (Stats. 2002, Ch. 516). 21 Executive Order S-14-08 (Nov. 17, 2008). 22 S.B. No. 2 (1st Extraordinary Session), sponsored by Senators Simitian, Kehoe and Steinberg. 23 Stats. 2010, Ch. 469.

Page 22 of 22 March 31, 2010
GenOn will also endeavor to secure the multi-year forward commitments to buy capacity, energy and and/or ancillary services from each unit that will be necessary to commit to investing in compliance with the policy. GenOn will seek such commitments with sufficient lead time to allow engineering and construction to be completed so that the units at each station can be taken out of service at a time and on a schedule acceptable to the CAISO, and compliance measures are fully implemented and operational as of the compliance deadlines specified in the Policy. However, as explained above, there are many sources of uncertainty beyond GenOn’s control that may make it impossible for GenOn to commit to funding compliance investments in time to meet the Policy’s deadlines. If GenOn ultimately determines that investment in compliance measures is uneconomic for any unit, GenOn will work with the CAISO and the SACCWIS to consider extending the compliance deadline, or pursue other options for the assets which may include repowering or retirement.