gerda - max planck society · gerda progress report to the lngs scientific committee (appendix)...
TRANSCRIPT

Gerda
Progress report to the LNGS scientific committee
(Appendix)
LNGS-EXP 33/05 add. 6/08
The format of this Gerda progress report differs from our earlier ones to facilitateboth fast and in-depth reading. A short write-up (http://www.mpi-hd.mpg.de/GERDA/reportsLNGS/gerda-lngsSC-shwup-apr08.pdf) summarizes concisely the achievementsduring the last six months and highlights important issues. An appendix to the report(http://www.mpi-hd.mpg.de/GERDA/reportsLNGS/gerda-lngsSC-appdx-apr08.pdf)provides additional technical and experimental details for follow-up reading.
April 2008

A.M. Bakalyarov h, M. Balata a, I. Barabanov f , L. Baudis m, C. Bauer c, E. Bellotti e,S. Belogurov f,g, S. T. Belyaev h, M. Barnabe-Heider c, A. Bettini j, L. Bezrukov f ,
V. Brudanin b, R. Brugnera j, D. Budjas c, A. Caldwell i, C. Cattadori a,e, O. Chkvorets c,E. V. Demidova g, A. Di Vacri a, A. D’Androgora a, V. Egorov b, A. Ferella m,F. Froborg m, N. Fodyma d, A. Garfagnini j, A. Gangapshev f , J. Gasparro l,
S. Gazzana c, P. Grabmayr k, G. Y. Grigoriev h, K. N. Gusev h, V. Gurentsov f ,W. Hampel c, M. Heisel c, G. Heusser c, W. Hofmann c, M. Hult l, L.V. Inzhechik h,
J. Janicsko i, M. Jelen i, J. Jochum k, M. Junker a, S. Katulina b, J. Kiko c,I.V. Kirpichnikov g, A. Klimenko b,f , M. Knapp k, K.T. Knoepfle c, O. Kochetov b,
V.N. Kornoukhov f,g, K. Kroeninger i, V. Kusminov f , M. Laubenstein a,e, V.I. Lebedev h,D. Lenz i, M. Lindner c, J. Liu i, X. Liu i, B. Majorovits i, G. Marissens l, I. Nemchenok b,
L. Niedermeier k, J. Oehm c, L. Pandola a, K. Pelczar d, P. Peiffer c, A. Pullia e,F. Ritter k, C. Rossi Alvarez j, V. Sandukovsky b, S. Schoenert c, J. Schreiner c,J. Schubert i, U. Schwan c, B. Schwingenheuer c, M. Shirchenko h, H. Simgen c,
N. Smale c, A. Smolnikov b,f , F. Stelzer i, L. Stanco j, A.V. Tikhomirov h, U. Trunk c,C.A. Ur j, A.A. Vasenko g, S.Vasiliev b,f , M. Wojcik d, E. Yanovich f , J. Yurkowski b,
S.V. Zhukov h, E. Zocca e, G. Zuzelc
a INFN Laboratori Nazionali del Gran Sasso, Assergi, Italyb Joint Institute for Nuclear Research, Dubna, Russia
c Max-Planck-Institut fur Kernphysik, Heidelberg, Germanyd Institute of Physics, Jagellonian University, Cracow, Polande Universita di Milano Bicocca e INFN Milano, Milano, Italy
f Institute for Nuclear Research of the Russian Academy of Sciences, Moscow, Russiag Institute for Theoretical and Experimental Physics, Moscow, Russia
h Russian Research Center Kurchatov Institute, Moscow, Russiai Max-Planck-Institut fur Physik, Munchen, Germany
j Dipartimento di Fisica dell’Universita di Padova e INFN Padova, Padova, Italyk Physikalisches Institut, Universitat Tubingen, Germany
l Institute for Reference Materials and Measurements, Geel, Belgiumm Physik Institut der Universitat Zurich, Zurich, Switzerland
Spokesperson: S. Schonert,( [email protected] )
Co-Spokesperson: C. Cattadori( [email protected] )
Technical Coordinator: K.T. Knopfle([email protected] )
URL: http://www.mpi-hd.mpg.de/GERDA/reportsLNGS/gerda-lngsSC-appdx-apr08.pdf
2

Contents
1 Phase I detectors 51.1 Gamma radiation induced leakage current . . . . . . . . . . . . . . . . . . 51.2 Processing of Phase I detectors . . . . . . . . . . . . . . . . . . . . . . . . 61.3 Low-background test stand LArGe . . . . . . . . . . . . . . . . . . . . . . 61.4 Background identification by pulse shape analysis of LAr scintillation . . . 8
2 Phase II detectors 82.1 Prototype testing . . . . . . . . . . . . . . . . . . . . . . . . . . . . . . . . 82.2 Production of Phase II detectors . . . . . . . . . . . . . . . . . . . . . . . . 82.3 Crystal characterization . . . . . . . . . . . . . . . . . . . . . . . . . . . . 92.4 Status of the Czochralski puller . . . . . . . . . . . . . . . . . . . . . . . . 11
3 Cryogenic vessel and infrastructure 11
4 Water tank and water drainage 15
5 Clean Room and Lock System 175.1 The Clean Room . . . . . . . . . . . . . . . . . . . . . . . . . . . . . . . . 175.2 The Lock system . . . . . . . . . . . . . . . . . . . . . . . . . . . . . . . . 175.3 The Cable Tree . . . . . . . . . . . . . . . . . . . . . . . . . . . . . . . . . 17
6 Front End electronics 19
7 DAQ electronics and online software 21
8 Muon veto 228.1 Plastic veto . . . . . . . . . . . . . . . . . . . . . . . . . . . . . . . . . . . 228.2 Cherenkov veto . . . . . . . . . . . . . . . . . . . . . . . . . . . . . . . . . 22
9 Monte Carlo simulations and background studies 239.1 Improvements in MaGe . . . . . . . . . . . . . . . . . . . . . . . . . . . . . 239.2 Estimate of tolerable material contamination . . . . . . . . . . . . . . . . . 249.3 Pulse shape analysis . . . . . . . . . . . . . . . . . . . . . . . . . . . . . . 27
10 Material screening 2810.1 Radon measurements . . . . . . . . . . . . . . . . . . . . . . . . . . . . . . 28
10.1.1 Emanation measurements of small components . . . . . . . . . . . . 2810.1.2 Emanation measurements of the cryostat . . . . . . . . . . . . . . . 2810.1.3 Behavior of radon in liquid nitrogen . . . . . . . . . . . . . . . . . . 29
10.2 Gamma ray screening . . . . . . . . . . . . . . . . . . . . . . . . . . . . . . 3010.3 Low-level instrumentation . . . . . . . . . . . . . . . . . . . . . . . . . . . 31
10.3.1 Gas counting setup . . . . . . . . . . . . . . . . . . . . . . . . . . . 31
3

10.3.2 Germanium spectrometers . . . . . . . . . . . . . . . . . . . . . . . 32
4

1 Phase I detectors
In total 17.9 kg of enriched and 15 kg of non-enriched high-purity germanium detectors,which were used in the past in the HdM and Igex experiments and in the Genius TestFacility (GTF), will be operated in Phase I of Gerda. As described in earlier reports, thepreparation of Phase I detectors has been broken down into five distinct work packages(WP). The main activities during the last six months concerned WP3 (testing of Phase Iprototype detector assemblies) with emphasis on the study of gamma radiation inducedleakage currents (LC), and WP5 (construction of the low-background test stand LArGe)including studies for background identification by pulse shape analysis of LAr scintillation.The completion of WP4 (processing of enriched and non-enriched detectors) is pendingupon the results of WP3.
Figure 1: Comparison of leakage current changes under gamma irradiation for three de-tectors with different passivation layer configurations operated in liquid argon. Reducingthe size of the passivation layer to the groove area (detector 2/GTF-42) strongly reducesthe increase of LC under gamma radiation. No LC increase is observed for the detectorwithout passivation layer in LAr (detector 3/GTF-44) and similar, for detector 1 in liquidnitrogen. All leakage current increases were found to be fully reversible.
1.1 Gamma radiation induced leakage current
Operations with Phase I prototype detector assemblies continued in the Underground De-tector Laboratory (Gdl) at Lngs. A second test stand for long-term measurements andirradiation tests is now operational. Thus two prototype detectors can be operated si-multaneously. Two additional non-enriched crystals (GTF-42 and GTF-44) with modified
5

passivation layer geometries have been prepared in October 2007 by Canberra, Olen inorder to study its impact on the gamma induced LC. In total, there are now three Phase Iprototype detectors under investigation with different passivation layer geometries. Thepassivation layer of the first prototype detector (GS935) covers quasi the full front face ofthe crystal. For the crystal GTF-42 it has been limited to the area of the groove whilefor GTF-44 no passivation layer has been applied. The measured energy resolution of theGTF-42 using standard FE electronics with about 1 m cables between crystal and FET is3.0 keV (FWHM) at 1.3 MeV.
Fig. 1 shows the increase of LC under identical gamma radiation and bias voltage con-ditions for the different detector configurations. A 44 kBq 60Co is located at approximately20 cm distance irradiating mainly the signal contact side. The experimental observationthat the reduction in area of the passivation layer reduces the LC increase under gammaradiation, corroborates our hypothesis that charge collection on the surface of the insulat-ing passivation layer is the origin of the (reversible) LC increase. Moreover, no radiationinduced LC increase has been observed when operating GS935 in liquid nitrogen.
The measurements with GTF-42 and GTF-44 in LAr are ongoing and the LC valuesare stable at 10 pA and 5 pA respectively. A periodic 10 minutes irradiation of GTF-42with a 60Co gamma source is carried out once per week in order to simulate the energycalibration in Gerda, while monitoring the leakage curent stability with high accuracy.
1.2 Processing of Phase I detectors
Based on the results summarized in the previous section, it is planned to implement apassivation layer which is limited to the groove area only. Despite the fact that the crys-tal without passivation layer shows the best behavior with respect to LC increase undergamma irradiation, it is less favored for technical and handling reasons. The time period tocomplete the detector processing is under discussion with the manufacturer. In the meantime the crystals are stored underground to avoid cosmogenic activations.
1.3 Low-background test stand LArGe
The assembly of the cryostat was carried out at the manufacturer and the inner vesselwith the integrated heat-exchanger and thermal shield was delivered to MPIK. Despitean earlier successful He-leak test, the heat exchanger showed leaks at the weld joining theheat-exchanger and the thermal shield. The vessels were returned to the manufacturerand extensive repair work carried out. Helium leak tests were carried after completionof the repair work prior and after the first liquid nitrogen cooling of the heat-exchanger,thermal shield and inner vessel (Fig. 2). The inner vessel assembly returned to MPIK inthe last February week to complete the mounting of the IR-reflection shields and of theouter vessel. The cryostat will be installed in the Gdl after completion of the cryogenictests.
6

Figure 2: Left: Mounting of the thermal shield of the LArGe cryostat. Right: firstcool-down of the integrated heat-exchanger after completion of the welding to the innervessel and thermal shield.
Figure 3: Left: Distribution of the LAr scintillation pulse shape discrimination parameterin an energy range of 40 keV to 80 keV from an internal 241Am gamma source and froman external AmBe neutron/gamma source. Right: Scatter plot with alpha (blue) andgamma (red) events from 214Bi–214Po decays.
7

1.4 Background identification by pulse shape analysis of LArscintillation
Laboratory work on background identification using the pulse shape of liquid argon scintil-lation has been further pursued. Fig. 3 displays the pulse shape discrimination parameterfor low-energy gamma and neutron interactions (left canvas) and high-energy beta/gammaand alpha energy depositions (right canvas). In the framework of the R&D of instrument-ing the liquid argon, it is planned not only to use the liquid argon scintillation light asa veto signal, but to exploit the pulse shape information of the liquid argon scintillationsignal to identify the origin of background events. Examples are the identification anddiscrimination of radon decays in the liquid argon using the BiPo-214 time correlationtogether with the pulse shape information, and of the 77Ge production and decay usingthe pulse shape of the neutron–argon scattering followed by the prompt gammas of theneutron capture in 76Ge.
2 Phase II detectors
2.1 Prototype testing
Since the last report the construction of the prototype of the cryostat which will be usedfor crystal tests in the Gerda cleanroom was finished. It was installed in a clean room atthe MPI in Munich and became operational (Gerdalinchen II, c.f. Fig.4). At the momentof writing we are running tests with germanium detectors and soon an 18 fold segmentedprototype detector will be tested. The new cryostat can hold up to three crystals, has aninfrared shield and offers better control of temperature and humidity during cool-down andwarm-up cycles. With the possibility to introduce a radioactive source inside the cryostat,we will be able to measure the properties of our detector with better spatial resolution.
2.2 Production of Phase II detectors
After the first successful test of the purification of GeO2 at PPM Pure Metal, reportedin the previous Progress Report, a second test was performed. The goal of the secondtest was to increase the yield of the 6N material and to define a procedure for minimizingcosmic exposure. No mass spectrometry measurements were done at this time.
As in the previous test, the depleted GeO2 (<1 % 76Ge) is reduced to metallic Ge in areduction furnace, and then zone refined. After zone refinement a resistivity measurementis performed. The part of the ingot with less than 50 Ωcm is cut off and reprocessed. Inthe first test, after two iterations of zone-refinement a yield of 77% was achieved. Thistime after three runs of zone-refinement the total yield achieved was around 90%. Thisexcellent result means that most of the enriched material can be used to pull crystals.
The second goal of the test was to reduce the exposure of the germanium to the cosmicradiation. The material was temporarily stored underground in a nearby mining museum.
8

Figure 4: A germanium detector being lowered in the test cryostat
The test proved that transporting the material back and forth to the underground storageis feasible and the time above ground for the purification should not exceed two-three days.
2.3 Crystal characterization
It is forseen to pull the crystals necessary for Ge detectors at the Institut fur Kristallzuchtung(IKZ) in Berlin. Producing detector grade material is not possible without the adequatemeasurement techniques. In order to measure such a low level of impurities, IKZ set up aHall-effect measurement and a PTIS (Photo-Thermal Ionization Spectroscopy) setup. Thefirst tests are already completed. In Fig. 5 we can see the net concentration of the chargecarriers versus 1/T. The measurement is done down to 15 K on a sample crystal purchasedby MPI from Canberra for this particular purpose. We can clearly see the transition fromintrinsic conductivity to extrinsic. After the freeze-out of the intrinsic charge carriers, thenet concentration of charge carriers is in the order of magnitude of 1010/cm3. This is thepurity level that should be achieved in the crystals in order to produce large detectors.
In order to continuously monitor the purity of the material, pulling small test crystalswill be regularly needed. IKZ already pulled a small crystal from the zone-refined materialproduced during the first purification test at PPM. The first (preliminary) Hall-effectmeasurement suggest that the concentration of impurities in the zone-refined materialis between 1012 and 1011/cm3. This numbers are consistent with the one deduced fromresistivity measurement mentioned in the previous Progress Report and they are far betterthan expected, since this Ge is rated as 6N material.
9

Figure 5: Hall-effect measurement of charge carrier concentration on a detector gradegermanium crystal.
Another important measurement technique is the Photo-Thermal Ionization Spectroscopy.This is a qualitative method that reveals the chemical composition of the impurities presentin the crystal. It is complementary to the Hall-effect measurement, which is a quantitativetest. IKZ completed their setup based on a standard Fourier transform infrared spectrom-eter. They proved the correct functioning with a Si sample and they already measured theCanberra sample crystal. The spectra can be seen in Fig. 6.
First crystals from a dedicated Czochralski puller will be produced in March 2008 andanalyzed to determine whether further purification at PPM is necessary. First detectorgrade crystals are expected by the end of the year.
Figure 6: PTIS spectrum of silicon(left) and detector grade germanium (right)
10

2.4 Status of the Czochralski puller
Refurbishing of the Czochralski puller was finished recently. In order to reduce the con-tamination from the equipment, copper parts were removed and replaced with silver, thegraphite susceptor crucible was replaced with molybdenum and all internal parts are sup-ported by high purity quartz holders. High purity quartz crucibles are being purchased tohold the germanium melt. The puller is already set up to produce 2“ crystals, and largercrystals will be made once the larger crucible is available. First crystals pulled of natural(6N) germanium are expected at the time of writing.
3 Cryogenic vessel and infrastructure
On 6 March 2008, the cryostat was delivered to LNGS and placed at the foreseen locationin Hall A. Compared to its ’quasi-final’ schedule, Rev. 5 of 21 September 2007, the deliverywas delayed by 3 weeks.1 The commissioning of the cryostat in Hall A is proceeding fasterthan originally scheduled (see below) so that the water tank construction is expected tostart in the week of 21 April. This corresponds to a delay of 3 months with respect to theGerda schedule presented in April 2007.
Table 1 provides a chronological list of some final acceptance tests of the cryostat. Thepressure tests for the inner and outer vessel under the inspection of TUV have been the finaltests according to the German pressure vessel code AD2000. Once the documentation isfinalized and checked both vessels will receive CE certificates according to PED 97/23/EC.
The helium leak tests yielded the requested vacuum performance. Also the pump-downtime for the insulation vacuum of about 2 weeks turned out to be fully acceptable; this isgratifying since the inner vessel carries not only the multi layer insulation but also in itscylindrical part a 6 mm thick Makrolon layer as additional passive insulation in case ofleakage of the outer vessel (Fig. 7).
The inner vessel rests on 8 support pads. To ensure that all pads carry equal loadwhen the cryostat is filled, a non-standard test (Fig. 8) was carried out: when the (empty)inner vessel was inserted into the outer one, load cells measured the weight on each of thepads. Since each pad rests on a Belleville spring with known spring constant the differencesbetween the loads can be transformed to length differences of less than 0.1 mm. Thus allpads will carry about equal load once the cryostat is filled.
The evaporation test (Fig. 9) showed that the heat input to the cryostat is lower thanspecified.
The Rn emanation rate of the cryostat is a crucial value since Monte Carlo studiesindicate that a homogeneous distribution of 8 mBq of 222Rn would add 10−4 cts/(keV·kg·y)to the background index.2 Two measurements after a first cleaning cycle of pickling,
1The cryostat could have been delivered almost in-time if the final pressure test of the outer vessel hadtaken place as scheduled. Due to a discrepancy between an actual weld and its specification in the weldmap this test was canceled twice.
2Anti-coincidences between diodes and/or segments are not taken into account in this number. Ifthese are applied for the phase II setup then the allowed activity is 14 mBq for a background index of
11

Figure 7: Mounting of the Makrolon sheets onto the outer surface of the inner vessel (left),and insertion of the inner vessel (covered by the multilayer insulation) into the outer vessel.
passivation and rinsing with de-ionized water yielded values which differed by almost afactor of two: 16.9 ± 1.6 mBq for the first and 29.8 ± 2.4 mBq for the second extraction.A possible explanation is a fractioning of Rn inside the cryostat: the heavier radon isconcentrated at the bottom. Due to the measurement procedure the radon concentrationis then enhanced in the second sample. A visual inspection showed that the inner surfacewas not metallic bright after the first cleaning. Thus, mechanical grinding of areas withe.g. tape remnants and another cleaning cycle was done. The efficiency of this cycle wasreduced due to a low steel temperature of 2 C.
The subsequent emanation measurement at LNGS yielded two consistent values withan average of 13.7±1.9 mBq. In this case, the gas inside the cryostat was mixed before thesamples were extracted. Scaled for the cryostat’s size these results compare favorably withvalues measured for other vessels. Thus, without another cleaning cycle, the installation ofthe internal copper shield started. Further tests scheduled after Easter are a He leak testand another evaporation test in order to verify that the cryostat has not been damagedduring transportation. Afterwards another emanation test will take place and its outcomewill influence the final cleaning procedure.
The cryostat’s cryogenic infrastructure has been tendered European wide based on
10−4 cts/(keV·kg·y).
12

Table 1: List of some of the recent activities and of the acceptance tests the cryostat haspassed. Tests until February 27 have been done at the manufacturer SIMIC, the test atMarch 11 after delivery to Hall A of LNGS.
Date test specification / result12 Nov 07 pressure test of inner vessel 3.6 barg water26 Nov 07 He leak test of inner vessel < 5 · 10−9 mbar ` / s05 Dec 07 Rn-222 emanation test, 1st extraction (23 m3) 17 mBq06 Dec 07 Rn-222 emanation test, 2nd extraction (30 m3) 30 mBq12 Dec 07 load test of support pads of inner vessel passed15 Jan 08 He leak test of outer vessel < 10−7 mbar ` / s28 Jan 08 LN2 evaporation test of completely filled < 4 Nm3/h, or < 300 W04 Feb 08 2nd pickling & passivation cycle of inner vessel at (low) 2 C27 Feb 08 pressure test of outer vessel 1.85 barg N211 Mar 08 Rn-222 emanation test, 2 extractions (44/40 m3) 13.6/13.7 mBq18 Mar 08 internal copper shield installed
detailed technical specifications. The respective TED document 2008-27384 was publishedon 31 January 2008 and the time limit for submission was 17 March. Unfortunately, wereceived no adequate offer. Negotiations with some selected companies have started.
The last item to be tendered is the heater for the Ar exhaust gas. The final decisionon its dimension and type is pending.
13

Figure 8: The 8 load cells arranged on the support pads at the bottom of the outer vessel(left), and the measured loads (in kg) on the individual pads after the inner vessel hasbeen lowered onto the pads. The stiffness of the Belleville spring below each pad is 59kN / mm.
Figure 9: Set up for the evaporation test at SIMIC (left), and the measured evaporationrate during the settling time of the cryostat after being completely filled with liquidnitrogen.
14

4 Water tank and water drainage
The steel of the water tank (WT), the flanges, PMs anchorages etc., are all available atthe company site, waiting to be mounted at LNGS around the cryogenic vessel (week 17).The company charged with the WT installation has provided to the collaboration and toLNGS SPP the detailed plans for the construction procedures, which have been reviewedand approved by the latter. The WT mounting procedure is illustrated by Fig. 10. Acircular corona of the roof will be put together at floor level, then lifted up and the firstring of the WT mantle will be welded (2 m height), then everything will be lifted up, thesecond ring will be mounted at floor level, then welded at the first one, then lifted up andso on. Finally the inner part of the WT roof will be welded to the roof circular corona.
A fast drainage of the water is needed in case of serious lost of thermal insulation ofthe cryostat. Discharging proceeds via two pipes. One DN250 pipe was put below theTIR tunnel during the recent civil works. It has a maximum flow rate 56 l/s of which 46l/s are available for Gerda. A second DN150 pipe with 16 l/s leads to the Hall A pitswhich are devoted to collect any fluid accidentally discharged by experimental activities.Finally, as ultima ratio, water will be discharged also on the floor of the TIR tunnel incase of emergency. All options should allow to drain the complete water (650 m3) within2 hours. Details of the water discharging procedures are not yet completely defined andapproved by the LNGS technical staff. Moreover, procedures and hardware to dischargethe water are also related to the cryogenic gas heater type and dimension; the latter hasnot yet been accepted/defined by LNGS.
The pure water will be produced by the Borexino water plant. It will be recirculatedby a closed circuit equipped with an Ultra-Q unit to keep the water clean for Cerenkovlight detection.
15

Figure 10: The WT mounting procedure.
16

5 Clean Room and Lock System
5.1 The Clean Room
Detectors will be prepared for installation into the cryostat inside the clean room. Stringswith three detectors will be preinstalled underneath flow boxes of class 100 before they areinserted to the lock system.
The design of the clean room is finished. The technical specifications are defined in atendering document. Fig. 11 shows a 3D model of the clean room.
The limited invitation to tender has been closed and three companies are identified.The contract with the winning company is scheduled to be signed by calendar week 20.The installation of the clean room could start beginning of October 2008.
5.2 The Lock system
The strings with the detectors will be lowered to the cryostat through the lock system.Boundary conditions require the lock to be a vacuum tight pressure vessel. It will beproduced out of stainless steel. The lock cylinder will rest on a support structure that isbolted to the HEB700 superstructure beams resting on damping feet which decouple thelock from high frequency vibrations of the superstructure. Strings with up to five detectorscan be inserted to their final array position within the cylinder by a rail system. A linearpulley system lowers the detector strings to the cryostat.
The design of the complete lock structure is almost finished. Production of the firstcomponents has commenced. The complete lock system will be preinstalled at the MPI inMunich in the course of 2008. The transport of the fully installed system is scheduled forearly 2009.
The PLC system for control of the motors running the linear pulleys has been designedand is currently being equipped and tested at the MPI in Munich.
5.3 The Cable Tree
The cable guide on which the strings are lowered and the cables and string contact matrixconnecting the detectors to the power supply and the DAQ outside the lock have beendefined in cooperation with TG3 for phase I. They are already in production. Electricaltests have been carried out with a full phase I cable tree inside liquid nitrogen and includingthe connecting matrix using HPGe detectors. It could be demonstrated that no significantdeterioration of the pulses occur and that cross talk is tolerable (≤3 per mill). The energyresolution of a HPGe detector with 2.2 keV at 1460 keV was shown to be unaltered byconnecting the cable tree between preamplifier and DAQ system. Thus an increase of theFWHM by more than 0.8 keV due to the cable tree can be excluded.
17

Figure 11: 3D Model of the Gerda clean room on the superstructure platform underneaththe crane bow.
18

6 Front End electronics
Activities for the development of front end electronics concentrated on two points duringthe last months:
• Development of ASIC CMOS Charge Sensitive Amplifiers (CSA): In Novem-ber 2007 a new version of the PZ0 and PZ1 chips have been submitted to the foundry.Improvements include an increase in the number of channels per chip from one tothree and further integration of external components on PZ1. The chips have beenreceived in February 2008 and their characterization will commence soon.
• Test of FE circuits with detector: The test of the CSA candidate IPA4 tobe adopted in Gerda Phase I with a detector in liquid nitrogen/argon has beenpostponed since the available detectors have been used for stability investigations.For this reason two test assembly equipped each with a crystal have been built.They are the SUB and the Gerdella assembly. The SUB is shown in Fig. 12: Ap-type detector is enclosed in a sealed vacuum container while the FE circuit undertest is located outside. The entire setup is then submerged in a cryogenic liquid.Comparative tests with CSA amplifier mounted to the SUB have started and firstresults with the PZ0 (CSA77) gave a resolution of 2.6 (3.0) (FWHM) for 1.3 MeV60Co. The next CSA under test will be the IPA4 and PZ1.
The second test bench Gerdella is illustrated in Fig. 13. An n-type detector isencapsulated in a vacuum sealed special aluminum can and it is cooled down byslowly immersing it and the FE CSA in the cryogenic fluid. The detector is one fromthe former EUROBALL experiment. The best resolution obtained until now withthe Gerdella test bench is 5.1 keV, limited both by low frequency (LF) and HFnoise coming from pick-up of glitches from switching units and boiling off of cryogenicliquid. Once the two test benches exhibit a better noise performance they will beused for cold FE CSA tests. An intense campaign of measurements is planned forthe near future.
19

Figure 12: The SUB detector assembly.
Figure 13: The IPA4 circuit connected to the EUROBALL detector and mounted inGerdella.
20

7 DAQ electronics and online software
The DAQ electronics for the readout of the diodes of phase I is ready and the setup willbe tested in the LArGe facility.
During the last months the strengthened group in Padova has started to build up theslow control of the experiment based on their expertise with a similar system for the Operaexperiment [1].
Gerda will be equipped with a slow control system with responsibility for:
• low and high voltage power supplies control and monitor;
• monitoring of parameters characterizing the status of the sub-systems, like temper-ature, pressure, detector currents, etc.;
• readout of several sub-component parameters and storage in a database for laterretrieval;
• alarm handling;
• providing a graphical user interface (GUI) for sub-systems breakdown;
• producing online histograms for the relevant parameters;
• reliable remote monitoring of the whole experiment.
Its main building blocks are listed below:
• A database is the heart of the system; it stores both the slow control data and theslow control configurations. We have selected PostgreSQL [2] as relational database.Due to the possible high number of records in the data tables, the database will besplitted in two: the so-called online database where all data are stored frequently,and the historical database where older data are copied regularly after having appliedsome data reduction algorithms.
• The acquisition task will be performed by a pool of clients, each serving a dedicatedhardware sub-component. The clients will store the acquired data in the Slow Controldatabase.
• A supervisor process, the alarm manager, retrieves data from the database and isable to generate warnings or error messages in case of detector malfunctioning.
• The system will be completed by useful tools for the data taking, like a histogramviewer and an alarm viewer.
• Safety relevant alarms generated autonomously by some components will go directlyto the LNGS safety system and to the Gerda on-call experts, while the slow controlsystem will record the event into the database for future analysis.
Since the system is largely a copy of the Opera slow control its implementation canbe done with a relatively small effort.
21

8 Muon veto
8.1 Plastic veto
A batch of 10 plastic scintillators with dimensions of 200×50×3 cm3 has been assembledat Dubna and first tests have been performed at Dubna, Heidelberg, Tubingen and LNGS.
The tests showed that the concept works, but more wavelength shifting fibers and green-extended H6780-20 phototubes are desirable for improved performance. The backgrounddue to gammas inside the LNGS tunnel is lower by a factor 2 than outside. The gammasand muons give distinct signals.
Figure 14: Response of a plastic scintillator panel to gammas and muons. The spectrahave been accumulated for the integral of the FADC pulse (left) and the maximum pulseheight (right).
8.2 Cherenkov veto
The preproduction assembly has been performed by building five complete PMT capsulesand it revealed a few minor problems which have been solved meanwhile. Tightness aroundthe flange is achieved by additional glueing of the PET window. Furthermore, as the actualsize of the PMTs varies widely, more time is needed to fit the PMT properly into its capsule.
In parallel, work on the LED flashing and monitoring system is performed as well ason digitization.
According to recent tests the water resistance of the VM2000 foil is good enough toallow the glue to remain on the backside of this reflector foil. Presently we are investigatingto use this adhesive to fix the foil directly onto the walls of the water tank and the outerwall of the cryostat. Still, the foreseen studs will be used to secure the VM2000 foil thusreducing the risk that the foil tears off the wall during fast water drainage and subsequentlyclogs the water pipe. The present mounting will increase safety in a double way:
22
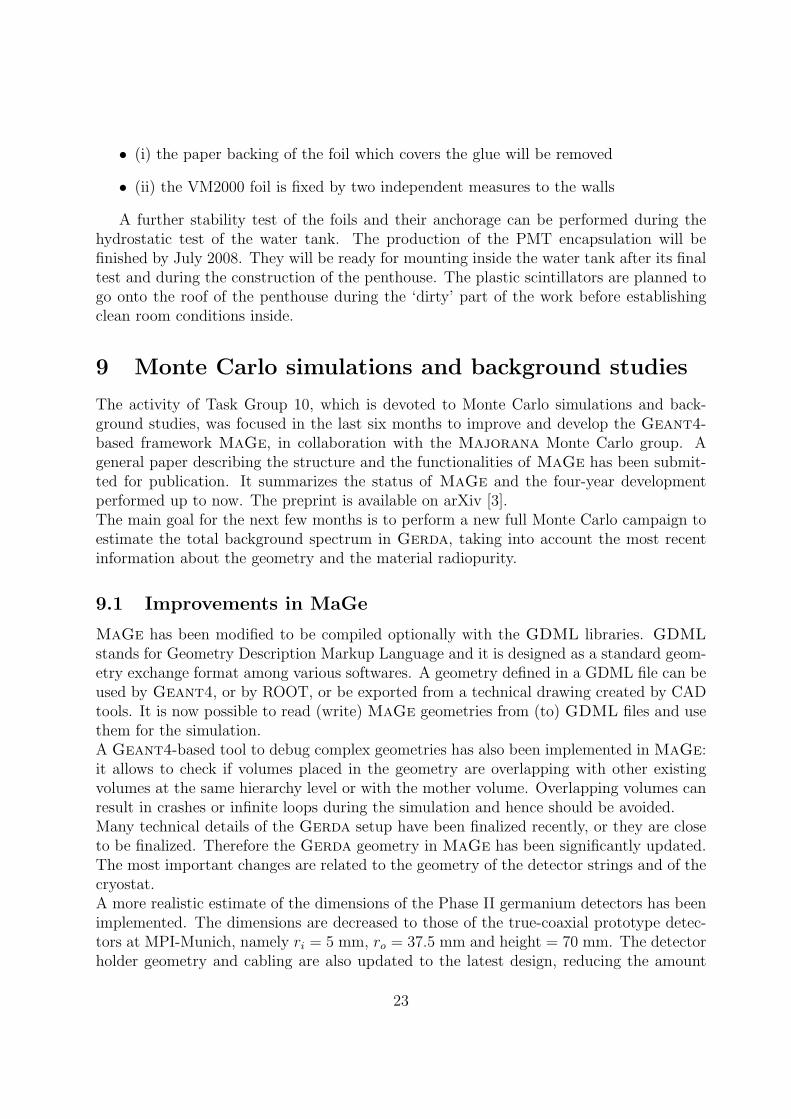
• (i) the paper backing of the foil which covers the glue will be removed
• (ii) the VM2000 foil is fixed by two independent measures to the walls
A further stability test of the foils and their anchorage can be performed during thehydrostatic test of the water tank. The production of the PMT encapsulation will befinished by July 2008. They will be ready for mounting inside the water tank after its finaltest and during the construction of the penthouse. The plastic scintillators are planned togo onto the roof of the penthouse during the ‘dirty’ part of the work before establishingclean room conditions inside.
9 Monte Carlo simulations and background studies
The activity of Task Group 10, which is devoted to Monte Carlo simulations and back-ground studies, was focused in the last six months to improve and develop the Geant4-based framework MaGe, in collaboration with the Majorana Monte Carlo group. Ageneral paper describing the structure and the functionalities of MaGe has been submit-ted for publication. It summarizes the status of MaGe and the four-year developmentperformed up to now. The preprint is available on arXiv [3].The main goal for the next few months is to perform a new full Monte Carlo campaign toestimate the total background spectrum in Gerda, taking into account the most recentinformation about the geometry and the material radiopurity.
9.1 Improvements in MaGe
MaGe has been modified to be compiled optionally with the GDML libraries. GDMLstands for Geometry Description Markup Language and it is designed as a standard geom-etry exchange format among various softwares. A geometry defined in a GDML file can beused by Geant4, or by ROOT, or be exported from a technical drawing created by CADtools. It is now possible to read (write) MaGe geometries from (to) GDML files and usethem for the simulation.A Geant4-based tool to debug complex geometries has also been implemented in MaGe:it allows to check if volumes placed in the geometry are overlapping with other existingvolumes at the same hierarchy level or with the mother volume. Overlapping volumes canresult in crashes or infinite loops during the simulation and hence should be avoided.Many technical details of the Gerda setup have been finalized recently, or they are closeto be finalized. Therefore the Gerda geometry in MaGe has been significantly updated.The most important changes are related to the geometry of the detector strings and of thecryostat.A more realistic estimate of the dimensions of the Phase II germanium detectors has beenimplemented. The dimensions are decreased to those of the true-coaxial prototype detec-tors at MPI-Munich, namely ri = 5 mm, ro = 37.5 mm and height = 70 mm. The detectorholder geometry and cabling are also updated to the latest design, reducing the amount
23

Figure 15: View of the detector array string (Phase II) as modeled in MaGe.
of material close to the detector. For the first time, a complete and realistic geometry ofthe whole Phase II holder and cabling above the crystal was implemented into MaGe (seeFig. 15). An update of the Phase I string in MaGe has begun.The newly implemented model of the cryostat is shown in Fig. 16. Now, shape and pa-rameters of the copper shield have been updated, the Makrolon layer on the inner wall ofthe cryostat and the Torlon pads in the insulation gap have been added.New computing resources are accessible for the MPI-Munich group. The farm is based onIntel Xeon processors running 64-bit Linux systems. In total there are 56 3.2 GHz CPUsand 168 3.06 GHz CPUs. Approximately 10 TB of storage space is available.
9.2 Estimate of tolerable material contamination
Monte Carlo simulations have been used in order to derive the maximum tolerable radioac-tive contamination for specific materials or detector parts.A full MaGe-based simulation has been performed to evaluate the maximum tolerable232Th activity in the water buffer, the stainless-steel of the cryostat and the internal cop-per lining. Results are summarized in Table 2. The screening results are all well below thelisted values, e.g. the steel activity is typically 1 mBq/kg.
24

Figure 16: The cryostat inside the water tank as modeled in MaGe.
The maximum tolerable 222Rn emanation rate inside the cryostat was estimated. Decaysfrom 214Bi, which is the only unstable isotope in the 222Rn chain emitting γ-rays abovethe Qββ-value of 76Ge, have been generated uniformly distributed inside the cryogenic liq-uid.3 The crystal array is assumed to be composed by 24 detectors, 15 segmented and
3 It is unclear whether this assumption is correct. On one hand it is conservative, because it is likelythat the activity is larger close to the walls of the cryostat, where 222Rn is mostly emanated. On the otherhand convection or electrical fields might transport the Rn close to the detectors.
Material No cut Crystal Segmentanti-coincidence anti-coincidence
Water 42 mBq/kg 74 mBq/kg 105 mBq/kgStainless steel 26 mBq/kg 46 mBq/kg 64 mBq/kgCopper lining 110 µBq/kg 190 µBq/kg 270 µBq/kg
Table 2: Allowable 228Th specific activity for individual background contributions below10−4 cts/(keV·kg·y), with different conditions of background rejection. The crystal arrayis assumed to be composed by 24 detectors, 15 segmented and 9 unsegmented.
25

Front End Electronics
Junction Board
Junction Sled
Pogo Pin Matrices Pogo Pin Matrices
Cables
Junction Board
High Voltage Cables
Signal Cables
High Voltage Cables
Signal Cables
Figure 17: Schematic drawing of the junction sledge in side (left) and top view (right) asit was used in the estimate of the background contribution of connectors and cables. Thedesign has been revised afterwards.
9 unsegmented. The maximum allowable 222Rn total emanation rate for a backgroundcontribution below 10−4 cts/(keV·kg·y) is found to be between 8 mBq (without any cut forbackground suppression) and 14 mBq (with segment anti-coincidence). Results obtainedwith MaGe have been cross-checked using an independent stand-alone Monte Carlo sim-ulation developed by the Russian groups of Gerda.Also the background contribution of the cable connectors (pogo pins) and the cables con-necting the detectors to the cleanroom was estimated using MaGe. The simulated setupconsists of seven detector strings, each containing three 18-fold segmented detectors. Thepogo pins are located 36 cm above the upside of the uppermost detectors, inside the pogopins matrix. Each string has 120 pogo pins. The lower ends of the cables are located 38.5 cmabove the uppermost detectors. Twelve signal cables and four high voltage cables have beensimulated. A schematic drawing of the interim design as used in the simulation is shown inFig. 17. The background contribution due to 228Th in the cable connectors was evaluatedusing the crystal anti-coincidence and segment anti-coincidence cuts: the allowed 228Thcontamination resulting in a background index of 10−4 cts/(keV·kg·y) is about 17 mBq/kgand 60 mBq/kg for crystal anti-coincidence and segment anti-coincidence, respectively.The background contribution of the cables due to 228Th resulting in a background index of10−4 cts/(keV·kg·y) is about 1.9 mBq/kg and 8.0 mBq/kg using crystal anti-coincidenceand segment anti-coincidence cut, respectively.
26

Figure 18: Electric potential calculated using the “method of successive over-relaxation”for a true-coaxial prototype detector for Phase II (ri = 5 mm, ro = 37.5 mm and height =70 mm). A voltage of -3500 V is applied at the core. No space charge is assumed.
9.3 Pulse shape analysis
The pulse shape simulation is under development: the main aim is to provide a full-chainsimulation of the data that will be available in Gerda, to be used to tune and benchmarkthe reconstruction and data analysis algorithms. The collaboration with the MajoranaMonte Carlo group is going on also in this sector, with the joint development of commoninterfaces, called MGDO (Majorana-GERDA Data Object), to be used for data analysisand pulse shape simulation.The important steps toward a full pulse shape simulation are:
• simulation of energy deposition in the detectors;
• calculation of the electric and weighting fields;
• drift of the charge carriers through the crystal;
• model of the preamplifier and DAQ properties.
The simulation of the energy deposition in the crystal is done using the MaGe framework.A framework for the pulse shape simulation including interface classes to MaGe was setup. The electric field was calculated using the “method of successive over-relaxation” andfirst results are available (see Fig. 18). The implementation of the charge carrier drift inthe crystal is ongoing.
27

10 Material screening
10.1 Radon measurements
10.1.1 Emanation measurements of small components
Material screening by means of the 222Rn emanation technique is continuously ongoing.Samples tested in the last months were
• WTA valve: The cast-housing was identified as source of the previously reportedhigh emanation rate of ∼ 2mBq. After etching the value was reduced by a factor of10. Further investigations are ongoing.
• HV feed-through from Padova: An upper limit of 50 µBq/piece was found.
• solder: For some tens of grams < 40 µBq could be derived.
• induction sensors: They showed a rate of (16± 3) µBq/piece.
• cables: A coaxial signal cable (Habia, Teflon coated) and a HV (Teledyne Reynolds,Teflon coated) cable emanate with (0.50 ± 0.14) µBq/m and (1.8 ± 0.5) µBq/m,respectively.
• TIG welding: 12 mm thick samples of 2.5 m total weld length gave (0.36 ± 0.04)mBq/m. For the total cryostat weld length of ∼ 100 m this corresponds to ∼ 18mBq for the inner surfaces of the welds. After pickling and passivation a fractionof the samples the rate was reduced to < 0.04 mBq/m (∼ 2 mBq for the cryostatwelds) and after electro-polishing a different fraction we found (0.10± 0.04) mBq/m.The higher value of the latter might be due to re-contamination after the polishing.
10.1.2 Emanation measurements of the cryostat
After the inner vessel of the cryostat was welded and pickled a first 222Rn emanation testwas performed. The inner vessel was closed with a carbon steel flange sealed by a He-licoflex gasket. In order to remove residual air the vessel was evacuated and filled twicewith 222Rn-free nitrogen. The 222Rn purification was done using the activated carbon trapsof the Mobile Radon Extraction Unit (MoREx). Then the vessel was pressurized up to1.6 barg and closed to accumulate the emanated 222Rn. After six days, samples of 23 m3
(STP) and 45 m3 (STP) were extracted and saturation emanation rates of (16.9±1.6) mBqand (29.8±2.4) mBq, respectively, were measured. Since the results do not agree withinthe statistical uncertainties, systematic effects must be present. In the extraction, gas istaken from the top. Therefore a non-homogeneous distribution of radon inside the vesselcould explain the difference.Since the second value was quite large, another pickling was performed and another mea-surement prepared. Now, only a small overpressure of 0.4 bar was used during the 222Rnaccumulation time and just before extraction the vessel was pressurized to 1.8 barg with
28

(cold) 222Rn-free nitrogen, i.e. a ”mixing step” was introduced. The following two extrac-tions gave consistent results of (13.6 ± 2.5) mBq and (13.7 ± 2.8) mBq.Previous measurements of pure stainless steel samples gave 5 µBq/m2 corresponding to only0.4 mBq for the cryostat’s surface area. Emanations from welds are therefore expected todominate. The obtained result is higher than the extrapolation from the emanation of thepickled welding samples (∼ 2 mBq). However, large-scale pickling of the cryostat mightnot be as effective as small-scale pickling in the laboratory and some dust and remnantsfrom markers and tape are still present in the cryostat.
10.1.3 Behavior of radon in liquid nitrogen
For the Gerda experiment the behavior of 222Rn and its daughters in cryogenic liquids(LN2, LAr) is of great importance. The electric field created by the high voltage (HV)applied to the detectors and possible convection movements of the cryo-liquid can lead tothe migration of radioactive isotopes and their possible accumulation close to the diodes.Decaying there they would significantly contribute to the background of the experiment. Aspecial programm to carefully investigate that problem has been established. For measure-ments an experimental setup consisting of a 32-liter dewar, an evaporator, a scintillationchamber (to measure the Rn concentration in gases), a gas flow meter and a data acquisi-tion system was used.
First the radon partition coefficient between the liquid and gas phase of nitrogen wasmeasured. After dissolving 222Rn in LN2 (contained in the 32-l dewar) the concentrationsin the boil-off and in the gas evaporated directly from the liquid phase were investigated.For the free evaporation we got a ratio of 16.3 ± 1.7 (liquid/gas, concentrations determinedalways at STP). Further tests showed that this factor depends on the evaporation rate:the faster the evaporation is, the higher is the 222Rn content in the boil-off N2.
To investigate the behavior of radon in the liquid nitrogen, stainless steel discs (25 mmin diamater) were used. The 222Rn decay products (mainly polonium isotopes) plate-outon their surfaces and can then be counted using an alpha spectrometer. In this way, af-ter dissolving radon in the liquid nitrogen, it was possible to monitor its concentrationsat different positions in the dewar and also under various conditions like: exposure time(from 3 h to several days), electric field strength (HV applied to the disc), gaseous or liquidenvironment. Obtained results show that deposited Po isotopes were not in radioactiveequilibrium even for exposure longer than 3 hours. In addition a rapid increase of thenumber of Po atoms deposited on the steel surface was observed after applying HV to thediscs (up to 2.5 kV, see Fig. 19). For +2 kV the activity of accumulated 214Po was about12 times higher than that obtained without HV. This effect was even stronger for negativevoltages: at -2 kV the mentioned above ratio was about 36. Measured Po activities as afunction of the ”storage” time (time elapsed since 222Rn dissolving, no mixing in between)indicate that some kind of 222Rn-’cloud’ has formed close to the steel discs.
As it can be seen in Fig. 20 the amount of Po accumulated on a disc placed always in the
29

Figure 19: Activity of 214Po and 218Po plated-out on a disc on negative high voltage.
same position in the dewar rises with the time elapsed since the moment of 222Rn dissolving(interpreted as a slow cloud formation). After mixing of the LN2 (last measurement point)the cloud disappears and the amount of plated-out polonium drops down to the initialvalue.
The discovered effect may suggest that 222Rn atoms ’feel’ an electric field what maycause their local accumulations. This phenomena may be problematic for the Gerdaexperiment and needs good understanding. Next tests with a germanium disc and LAr areplanned.
10.2 Gamma ray screening
In the last months the main focus in gamma ray screening was put on electronics compo-nents, parts for the Ge-diodes suspension system, and for LArGe. Samples were measuredin the Germanium spectrometers of IRMM/Hades, Gran Sasso and Baksan. The results forthe electronics components are summarized in Table 3. As usually they are relatively highin U/Th/K (activities in the range of Bq/kg). As a result of the screening measurementssome of the components for the LArGe setup had to be replaced.
Table 4 summarizes the results for further samples measured during the last 6 months.Another batch of stainless steel plates with 226Ra/228Th activities below 1 mBq/kg wasidentified, which can be used for cable chains. Also stainless steel ropes for the suspension
30

Figure 20: 214Po activity as a function of the time elapsed since radon dissolving in thedewar. -2 kV applied to the discs.
system were measured. Since initial results were very high a cleaning procedure by ultra-sonic soap cleaning and subsequent 2-propanol rinsing was performed. All contaminantsexcept 60Co (which is likely a bulk contamination) were reduced significantly (factor 400for 40K).
10.3 Low-level instrumentation
10.3.1 Gas counting setup
During the installation phase of Gerda on-site 222Rn-measurements with proportionalcounters will become more important. Therefore, a dedicated sample preparation and222Rn-counting system close to the Gerda site is required. We plan to re-use the ultra-lowbackground counting setup of the former Gallex/GNO experiments. For this purpose agas handling and counter filling line was built in Heidelberg. Commissioning of the line willstart in April and after a short phase of thorough testing it is supposed to move to GranSasso in summer 2008. It features not only the required equipment for 222Rn-counting,but also for the analysis of other radioactive noble gases like 39Ar, 85Kr and 133Xe, whichmight be interesting for further applications within Gerda and beyond. Also a dedicatedVME-based DAQ system was developed in Heidelberg and is ready to be used at GranSasso.
31

specific activities [Bq/kg]
Sample 228Ra 228Th 238U 226Ra 40K
Suhner HV feedthr. — 0.23± 0.02 0.51± 0.04 35.7± 0.4
Suhner signal feedthr. — 0.04± 0.01 0.07± 0.02 6.2± 0.2
Capacitors 8200 pF 1.3± 0.1 1.0± 0.1 0.4± 0.1 5.2± 0.3∗) 2.5± 0.25.7± 0.4∗∗)
Capacitors 4700 pF 1.3± 0.1 0.9± 0.1 2.2± 0.3 11.6± 0.6∗) 0.8± 0.214.1± 0.9∗∗)
Resistors 470 kΩ 0.13± 0.03 0.20± 0.02 0.4± 0.2 0.28± 0.03∗) 0.2± 0.10.6± 0.1∗∗)
∗) From 222Rn-daughters / Some 222Rn may have escaped. ∗∗) From the 186 keV line of 226Ra.
Table 3: Summary of gamma ray screening results of electronics components for Gerda.
10.3.2 Germanium spectrometers
An new ultra-low background HPGe detector (Gator) which will be shared between theXenon and the Gerda experiments has been installed in the Gran Sasso undergroundlaboratory. It is a 2.2 kg crystal with 100 % relative efficiency and a shield made out of5 cm copper and 20 cm lead. The whole setup is in an air tight box which is continuouslyflushed with nitrogen to remove atmospheric radon. The first background spectrum showsa rate significantly less than 1 count/(kg·keV·day) above 40 keV. Since Gator featuresalso a large sample chamber it will be a valuable new spectrometer for ultra-sensitive mea-surements.After the end of the renovation work in the Heidelberg shallow depth underground lab-oratory the re-commissioning of the spectrometers has started. Bruno and Corrado arerunning again, whereas Dario does not work properly. Meanwhile it was removed fromits shield to check the reason for its failure. Also another detector, Adam, which was notoperated for several years, is now running again. Adam is a bore-hole detector surroundedby a lead shield and muon veto proportional counters. First background measurementsand tests of the veto system will start soon.
32
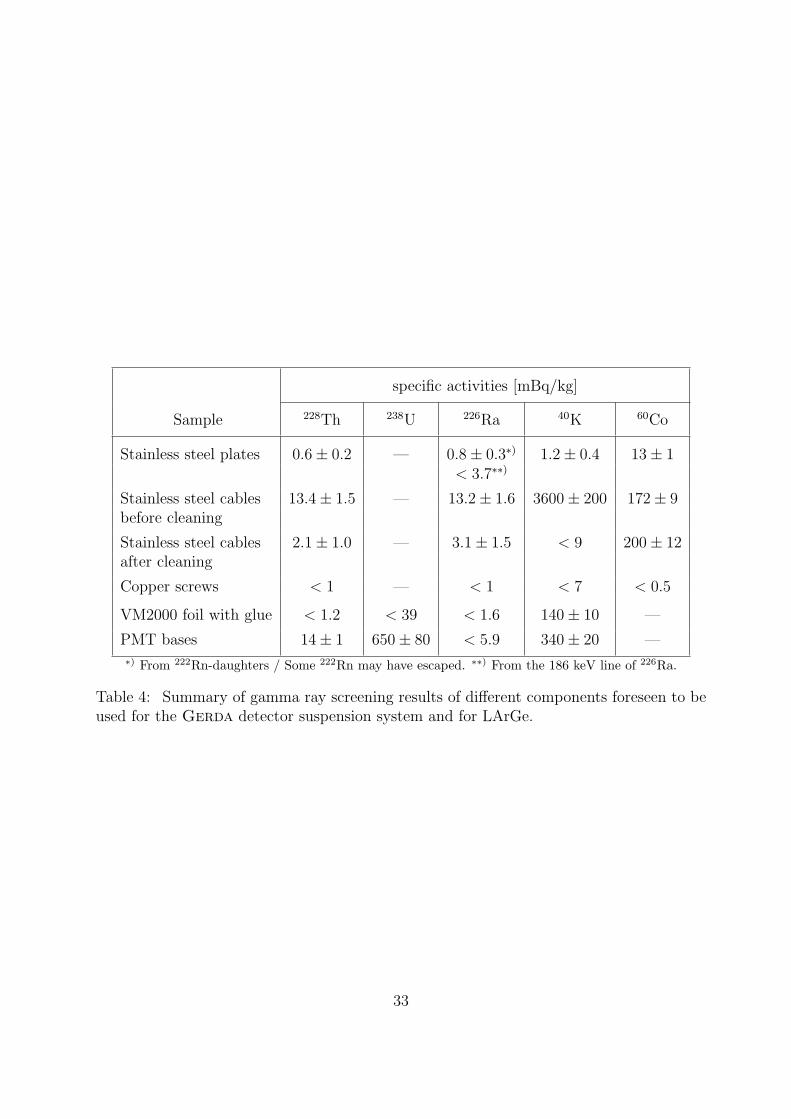
specific activities [mBq/kg]
Sample 228Th 238U 226Ra 40K 60Co
Stainless steel plates 0.6± 0.2 — 0.8± 0.3∗) 1.2± 0.4 13± 1< 3.7∗∗)
Stainless steel cables 13.4± 1.5 — 13.2± 1.6 3600± 200 172± 9before cleaning
Stainless steel cables 2.1± 1.0 — 3.1± 1.5 < 9 200± 12after cleaning
Copper screws < 1 — < 1 < 7 < 0.5
VM2000 foil with glue < 1.2 < 39 < 1.6 140± 10 —
PMT bases 14± 1 650± 80 < 5.9 340± 20 —
∗) From 222Rn-daughters / Some 222Rn may have escaped. ∗∗) From the 186 keV line of 226Ra.
Table 4: Summary of gamma ray screening results of different components foreseen to beused for the Gerda detector suspension system and for LArGe.
33

References
[1] A. Bergnoli et al., The OPERA spectrometer slow control system, IEEETrans.Nucl.Sci. 55 (2008) 349-355.
[2] The PostgreSQL database, http://www.postgresql.org/.
[3] Y.D. Chan et al., MaGe - a Geant4-based Monte Carlo framework for low-backgroundexperiments , submitted to IEEE Trans. Nucl. Scie., preprint arXiv:0802.0860v1 (2008)
34