icarus report to the lngs sc closed...
TRANSCRIPT

ICARUS Report to the LNGS SC
CLOSED SESSION
LNGS, 18/04/2011
The ICARUS Collaboration
Slide: 2
M. Antonelloa, P. Aprilia, B. Baibussinovb, M. Baldo Ceolinb,, P. Benettic, E. Calligarichc, N. Cancia, S. Centrob, A. Cesanaf, K. Cieslikg, D. B. Clineh,
A.G. Coccod, A. Dabrowskag, D. Dequalb, A. Dermenevi, R. Dolfinic, C. Farneseb, A. Favab, A. Ferrarij, G. Fiorillod, D. Gibinb, A. Gigli Berzolaric,, S. Gninenkoi,
A. Guglielmib, M. Haranczykg, J. Holeczekl, A. Ivashkini, J. Kisiell, I. Kochanekl, J. Lagodam, S. Manial, G. Mannocchin, A. Menegollic, G. Mengb, C. Montanaric, S. Otwinowskih, L. Perialen, A. Piazzolic, P. Picchin, F. Pietropaolob, P. Plonskio,
A. Rappoldic, G.L. Rasellic, M. Rossellac, C. Rubbiaa,j, P. Salaf, E. Scantamburloe, A. Scaramellif, E. Segretoa, F. Sergiampietrip, D. Stefana, J. Stepaniakm, R. Sulejm,a, M. Szarskag, M. Terranif, F. Varaninib, S. Venturab, C. Vignolia,
H. Wangh, X. Yangh, A. Zalewskag, K. Zarembao.
a Laboratori Nazionali del Gran Sasso dell'INFN, Assergi (AQ), Italy b Dipartimento di Fisica e INFN, Università di Padova, Via Marzolo 8, I-35131 Padova, Italy c Dipartimento di Fisica Nucleare e Teorica e INFN, Università di Pavia, Via Bassi 6, I-27100 Pavia, Italy d Dipartimento di Scienze Fisiche, INFN e Università Federico II, Napoli, Italy e Dipartimento di Fisica, Università di L'Aquila, via Vetoio Località Coppito, I-67100 L'Aquila, Italy f INFN, Sezione di Milano e Politecnico, Via Celoria 16, I-20133 Milano, Italy g Henryk Niewodniczanski Institute of Nuclear Physics, Polish Academy of Science, Krakow, Poland h Department of Physics and Astronomy, University of California, Los Angeles, USA i INR RAS, prospekt 60-letiya Oktyabrya 7a, Moscow 117312, Russia j CERN, CH-1211 Geneve 23, Switzerland k Institute of Theoretical Physics, Wroclaw University, Wroclaw, Poland l Institute of Physics, University of Silesia, 4 Uniwersytecka st., 40-007 Katowice, Poland m National Centre for Nuclear Research, A. Soltana 7, 05-400 Otwock/Swierk, Poland n Laboratori Nazionali di Frascati (INFN), Via Fermi 40, I-00044 Frascati, Italy o Institute of Radioelectronics, Warsaw University of Technology, Nowowiejska, 00665 Warsaw, Poland p INFN, Sezione di Pisa. Largo B. Pontecorvo, 3, I-56127 Pisa, Italy

The ICARUS T600 detector
Two identical modules
3.6 x 3.9 x 19.6 ≈ 275 m3 each Liquid Ar active mass: ≈ 476 t
Drift length = 1.5 m (1 ms)
HV = -75 kV E = 0.5 kV/cm
v-drift = 1.55 mm/μs
4 wire chambers:
2 chambers per module
3 readout wire planes per chamber, wires at 0, ±60°
≈ 54000 wires, 3 mm pitch, 3 mm plane spacing
20+54 PMTs , 8” Ø, for scintillation light:
VUV sensitive (128nm) with wave shifter (TPB)
Key feature: LAr purity from electro-negative molecules (O2, H2O,C02). Now: 0.06 ppb (O2 equivalent) -> 5 ms lifetime. Slide: 3

Cryogenics
Two-years safe and efficient operation without dead time on the T600 detector data taking!
Recent upgrades to guarantee proper cryostats LN2 cooling even under severe emergency conditions:
Control system upgrade to automatic restart the LN2 cooling pumps in case of accidental stop/fault
Upgrades required to cooling system to operate in gravity-driven mode (thermosiphon):
New GAr re-condensation system suitable to be operated in gravity-driven mode, to maintain Ar pressure stability
Automatic start of thermosiphon mode by control system
Fully pneumatic manual control system (fed by GN2 bottles) to operate valves in case of LNGS total lack of power
Slide: 4

LAr purification
Ar continuously filtered, e- life-time measured by charge on cosmic m track
tele > 5ms ( ~60 ppt [O2]eq) corresponding to a maximum charge attenuation of 17% at 1.5m
LAr recirculation system upgrade:
poor reliability of motor-immersed cryogenic pumps 10 faults up to now due to bearing damage
new Barber Nichols pump with non-immersed motor already ordered. Similar pumps operating from 2010 on LN2 systems without any stop
Slide 5
LAr pump faults
Light detection system upgrades
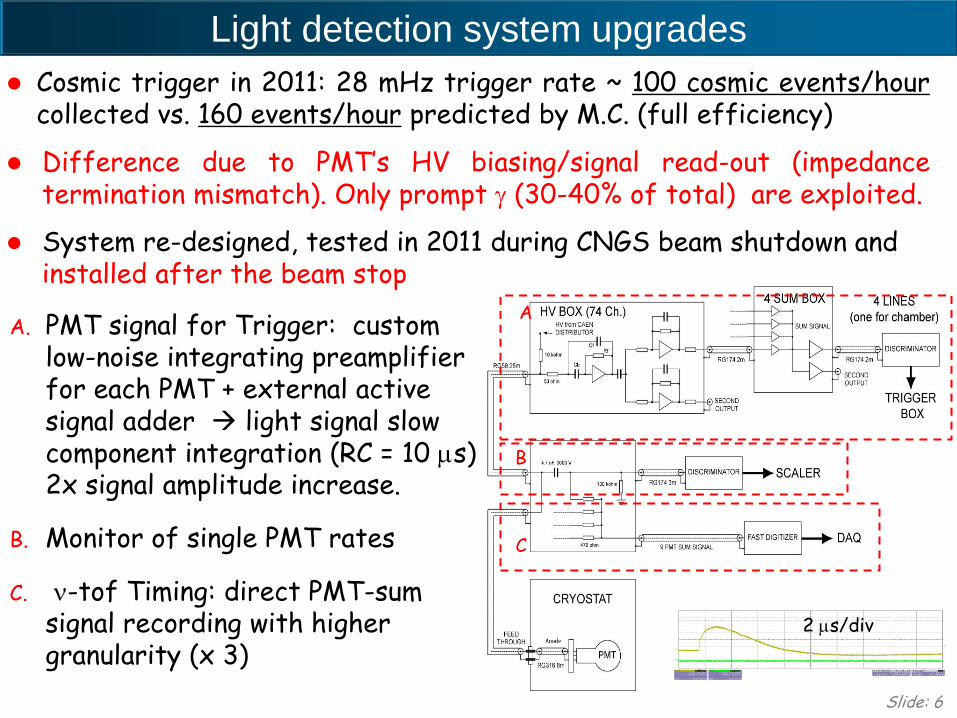
Cosmic trigger in 2011: 28 mHz trigger rate ~ 100 cosmic events/hour collected vs. 160 events/hour predicted by M.C. (full efficiency)
Difference due to PMT’s HV biasing/signal read-out (impedance termination mismatch). Only prompt g (30-40% of total) are exploited.
System re-designed, tested in 2011 during CNGS beam shutdown and installed after the beam stop
Slide: 6
2 ms/div
A
B
C
A. PMT signal for Trigger: custom low-noise integrating preamplifier for each PMT + external active signal adder light signal slow component integration (RC = 10 ms) 2x signal amplitude increase.
B. Monitor of single PMT rates
C. n-tof Timing: direct PMT-sum signal recording with higher granularity (x 3)

C-ray spectrum
Slide: 7
Increase of c-ray rate at low energy especially in EAST module, where a good agreement of energy spectrum with MC expect. is found.
globally 35 mHz trigger rate achieved: ~130 cosmic events/h: (58/h WEST + 72/h EAST)
WEST
EAST

DR-slw algorithm implemented in new SuperDaedalus chip (FPGA) to trigger charge deposition on TPC wires [B. Baibussinov et al., JInst5:P12006]
On each channel a “Peak signal” generated if S(t) over threshold
GTO trigger signal fired if a
predefined peak’s majority /16 ch is satisfied
Peak stretching (25125 ms) to guarantee high efficiency for inclined tracks
Q8(t) =1
8Q(t - i)
i= 0
8
å
Q128(t) =1
128Q(t - i)
i= 0
128
å
S(t)=Q8(t)-Q128(t)
Triggering on local charge deposition
Slide: 8
DISCRIMINATOR
RAW
Low /high frequency noise washed out
Q8
Q128
S(t)
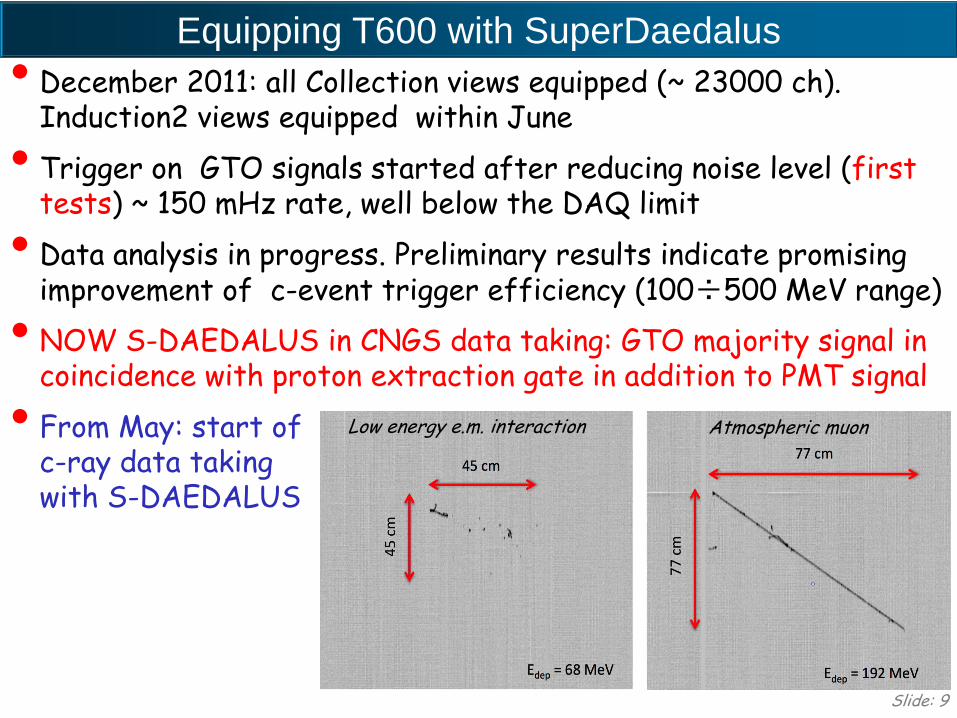
• December 2011: all Collection views equipped (~ 23000 ch). Induction2 views equipped within June
• Trigger on GTO signals started after reducing noise level (first tests) ~ 150 mHz rate, well below the DAQ limit
• Data analysis in progress. Preliminary results indicate promising improvement of c-event trigger efficiency (100÷500 MeV range)
• NOW S-DAEDALUS in CNGS data taking: GTO majority signal in coincidence with proton extraction gate in addition to PMT signal
• From May: start of c-ray data taking with S-DAEDALUS
Equipping T600 with SuperDaedalus
Slide: 9
Low energy e.m. interaction Atmospheric muon

DAQ status
DAQ system didn’t show any specific criticality in almost 2 years of continuous data taking
Trigger system recent improvements required a rework of the architecture to eventually stand higher DAQ rates:
Network infrastructure doubled ( + 4 switches and optical fibers from detector top to control room) increased parallelism build time reduced to 54%
new storage element (50 TB) underground buffer enhancement; high bandwidth space for prompt data backup
4 new pc’s for event building farm enhanced redundancy
Currently supported DAQ rate: 800 mHz. Further optimization in progress (traffic shaping, interference with downstream data flow… )
Slide: 10

CNGS neutrino run in 2011
2011 CNGS run: March 19th to November 14th
• 4.44 x 10¹⁹ pot collected over the 4.78 x 10¹⁹ pot delivered
• 93% detector live-time
• Expected 1200 CC and 390 NC events
CNGS beam-spill-triggered events processed online by DR-slw filter to separate genuine CNGS evts/ identify events that may escape PMT based trigger
Cosmic PMT-triggered empty events are filtered out online (validation through visual scanning: efficiency 99% - rejection power 10-3)
Slide 11 March 23rd 2012 detector started to collect new CNGS events.
Reconstruction software and analysis
The analysis of CNGS neutrino events is ongoing. Results will be presented when final.
First step on C-ray analysis: automathic reconstr. of deposited energy well in agreement with expextations (see Light detection upgrade)
In parallel: performance / calibration/ reconstruction checks
Progresses in 3D reconstruction, leading to better performances especially for horizontal tracks
Progresses in the Particle Identification Algorithm
Steps toward automatic reconstruction: vertex finding, clustering, track finding
Development on tools for calorimetric reconstruction
Slide: 12

Single 3D PLA-fit optimized to all available hits in Coll, Ind2, Ind1 views at once:
• minimize dist2D(hit to fit-projection)2 + penalty(segment 3D angle) + new factor
• new factors: dist3D(reference points to fit)2; relative dQ/dx of one seg seen by diff. views
• full available information combined • accurate information on the common sequence of 2D hits in all views • NO NEED TO MATCH 2D HITS by their drift coordinate – which was usual
approach in LArTPC • much more resistant to missing parts, sophisticated shapes, tracks
parallel to wire planes Collection wires
Induction2 wires
Ind
uct
ion
1 w
ires
New method of 3D track reconstruction

Collection
Induction2
Induction1

Induction1
Induction2
Collection
Muon track reconstructed from Coll and Ind2 views, seen in Ind1 projection

P. Identification: dE/dx + E decay prod
Slide: 16
• perform classification on track segments
• sum log P(PID | x=[dEq/dx; range])
• re-normalize probability
• calculate P(PID | Edecay_prod)
• multiplie by the output from „dEq/dx” classification
• re-normalize probability
1)
2)
If energy of decay products is reconstructed

P. Identification: dE/dx + E decay prod
Slide: 17
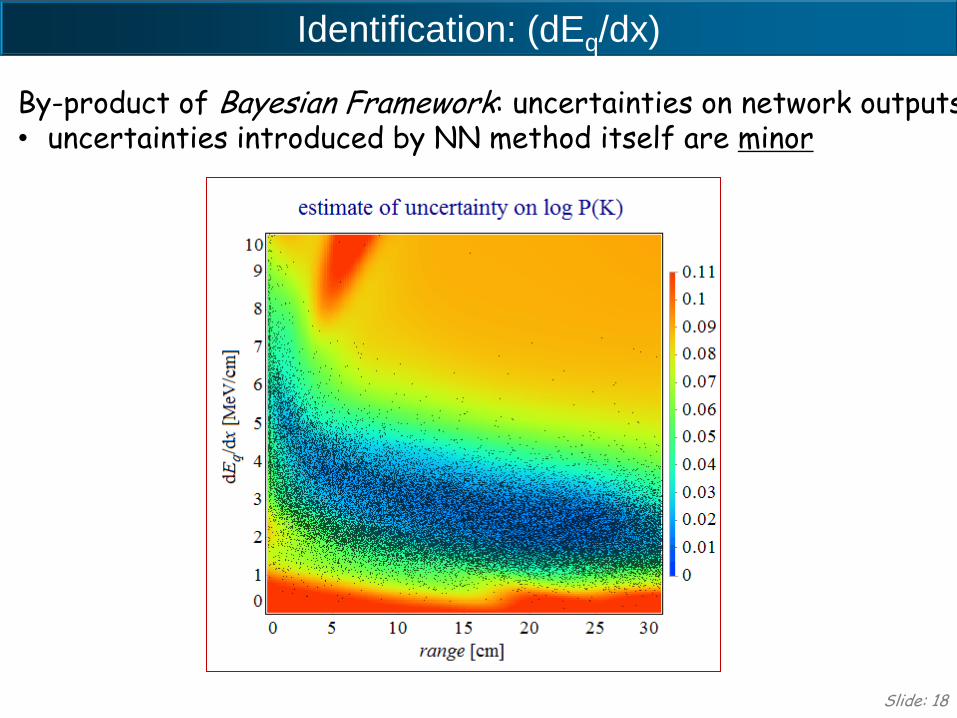
Identification: (dEq/dx)
Slide: 18
By-product of Bayesian Framework: uncertainties on network outputs • uncertainties introduced by NN method itself are minor

Calibration from CNGS muons
Tracks reconstructed in 3D. Delta rays and showers excluded.
Same reconstruction on MC muons with CNGS spectrum.
Very nice agreement (~ 2-3%) – still possible small different conditions of data and MC (noise patterns and their effects on d ray selection )
Calibration with CNGS muons
dE/dx distribution For real and MC muon tracks from CNGS events
Slide: 19
MC: m=2.37; s=1.37 Data: m=2.32; s=1.31

Data : 198 stopping particle tracks visually selected :
• no decay products
• increasing ionization density at the end
• at least 5 hits in Collection
• clean view in Collection
This sample contains both protons and pions (or even muons): stopping - and μ- can be absorbed by Ar nuclei, with sizeable probability of emitting only photons and neutrons.
PID: works on the behavior of dE/dx versus residual range
•segment length obtained from 3D track reconstruction
•deposited charge evaluated from collection wire signals without corrections for quenching effects
Points from real tracks are compared to the MC predictions for different particle species
Calibration with stopping protons : data sample
Slide: 20

Calibration with stopping protons : examples
Slide: 21
PId: proton
PId: not-stopping
PId: pion
• Deposited dE/dx vs residual range • No quenching corr. • Black dots: not consistent with any pattern, most probably protons interacting at very low energy with emission of ns, g
Methods for identification of non-stopping particles are under development
Slide: 22
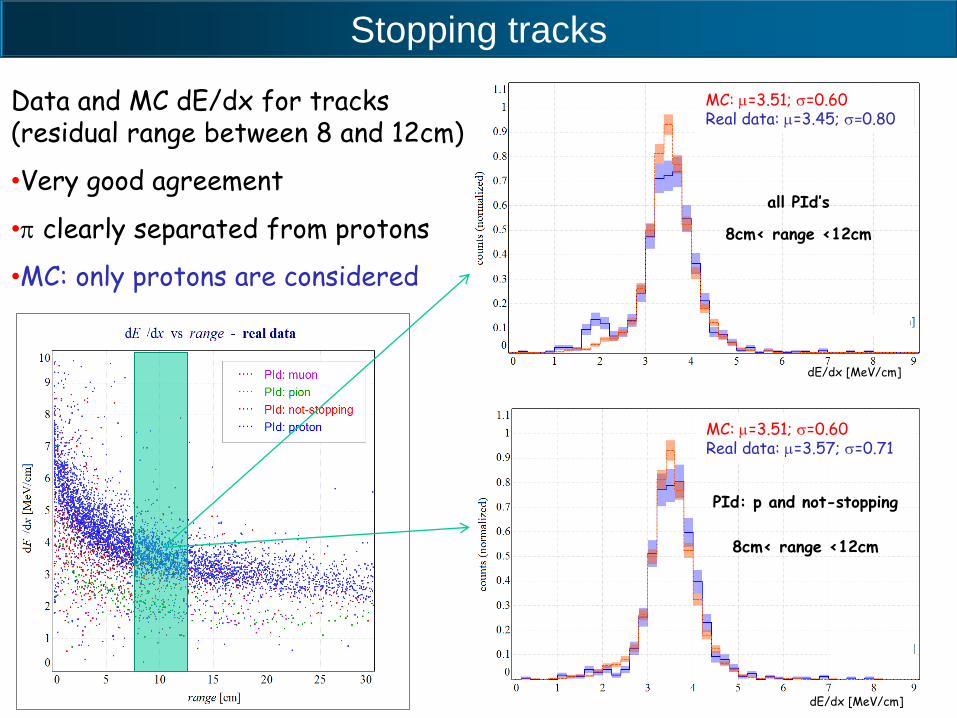
Data and MC dE/dx for tracks (residual range between 8 and 12cm)
•Very good agreement
• clearly separated from protons
•MC: only protons are considered
all PId’s
8cm< range <12cm
dE/dx [MeV/cm]
MC: m=3.51; s=0.60 Real data: m=3.45; s=0.80
PId: p and not-stopping
8cm< range <12cm
dE/dx [MeV/cm]
MC: m=3.51; s=0.60 Real data: m=3.57; s=0.71
Stopping tracks
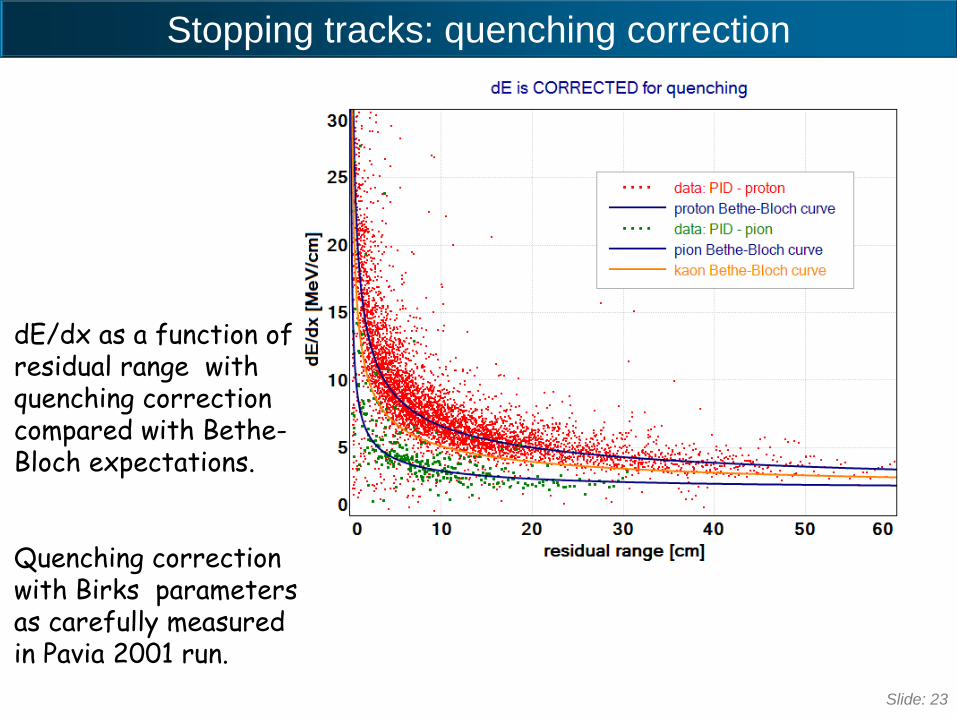
Slide: 23
dE/dx as a function of residual range with quenching correction compared with Bethe-Bloch expectations.
Quenching correction with Birks parameters as carefully measured in Pavia 2001 run.
Stopping tracks: quenching correction

Total energy deposition in CNGS n events
Comparison of the predicted ( full MC) and detected deposited energy spectrum from NC and CC events on 2010 statistics and a subset of the 2011 statistics
Used for the “superluminal” neutrino searches
nμ CC n NC
Slide: 24

A search for the analogue to Cherenkov radiation by high energy neutrinos at superluminal speeds in ICARUS.
ICARUS Coll. and A. Cohen (Boston Univ.), article in press.
Physics Letters B, Available online 11 April 2012, ISSN 0370-269, http://dx.doi.org/10.1016/j.physletb.2012.04.014
Measurement of the neutrino time-of-flight with the ICARUS detector at the CNGS beam.
ICARUS Coll. and P. Alvarez Sanchez, J. Serrano (CERN).
arXiv:1203.3433 (submitted to Physics Letters B)
Slide: 25
ICARUS contribution to the
superluminal neutrino problem

Search for superluminal
n’s radiative processes in ICARUS
Cohen and Glashow [Phys. Rev. Lett., 107 (2011) 181803] argued that superluminal n should loose energy mainly via e+e- brehmstrahlung
on average 0.78•En energy loss/emission
Full FLUKA simulation of the process kinematics, folded in the CNGS beam, studied as a function of δ
For d = 5 10-5 (OPERA first claim):
• full n event suppression for E > 30 GeV
• ~107 e+e- pairs /1019 pot/kt isolated e.m. shower (Edep > 200 MeV) within 150 mrad from CNGS beam axis with no hadronic activity
Effects searched in 6.7 1018 pot·kt ICARUS exposure (2010/11) toCNGS
• No spectrum suppression found in both NC , CC data (~ 400 events)
• No e+e- pair brehmstrahlung event candidate found Slide: 26
G =2
35
GF2
192p 3 n5E
3d
dE
dx=
5
112
GF2
192p 3 n6E
3d
G: Emission rate δ = (v
2–c2)/c2

ICARUS result on superluminal d parameter
The lack of pair in CNGS ICARUS 2010/2011 data, sets the limit:
δ =(vn2–c2)/c2 < 2.5 10−8 90% CL
- comparable to the SuperK limit δ < 1.4 10−8 from the lack of depletion of atmospheric n’s,
- somewhat larger than the lower energy velocity constraint δ < 4 10−9 from SN1987A.
Remaining ICARUS 2011 events (3 x more statistics) and 2012 data will be available but, due to δ3 dependence of pair bremsstrahlung cross section, no major improvement on δ sensitivity is expected.
ICARUS limit
CC evts (nm + anti-nm E > 60 GeV)
CC evts (full spectrum)
pair production
Slide: 27
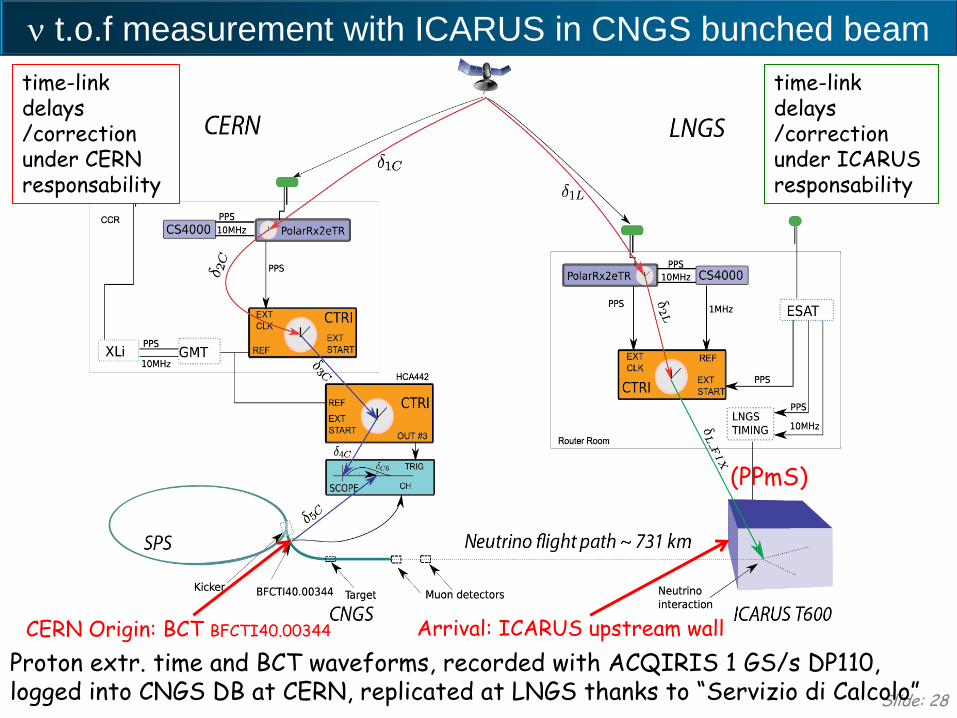
n t.o.f measurement with ICARUS in CNGS bunched beam
Slide: 28
Proton extr. time and BCT waveforms, recorded with ACQIRIS 1 GS/s DP110, logged into CNGS DB at CERN, replicated at LNGS thanks to “Servizio di Calcolo”
CERN Origin: BCT BFCTI40.00344 Arrival: ICARUS upstream wall
time-link delays /correction under CERN responsability
time-link delays /correction under ICARUS responsability
(PPmS)

PMT-DAQ for timing measurement
ICARUS PMT readout equipped with an independent DAQ system derived from the WArP experiment: three “2-channel, 8-bit, 1-GHz ACQIRIS AC240” digitizer boards, channels sync. at 10 ps.
The 4 PMT-Sum signals, integrated with a fast CANBERRA 2005 preamplifier, recorded together with the absolute time signal distributed by LNGS (PPmS).
The PMT-DAQ is triggered by the ICARUS-CNGS trigger (PMT sum signal in coincidence with CNGS beam spill).
Slide: 29
LNGS timing signal
4 PMT sum signals
trigger box
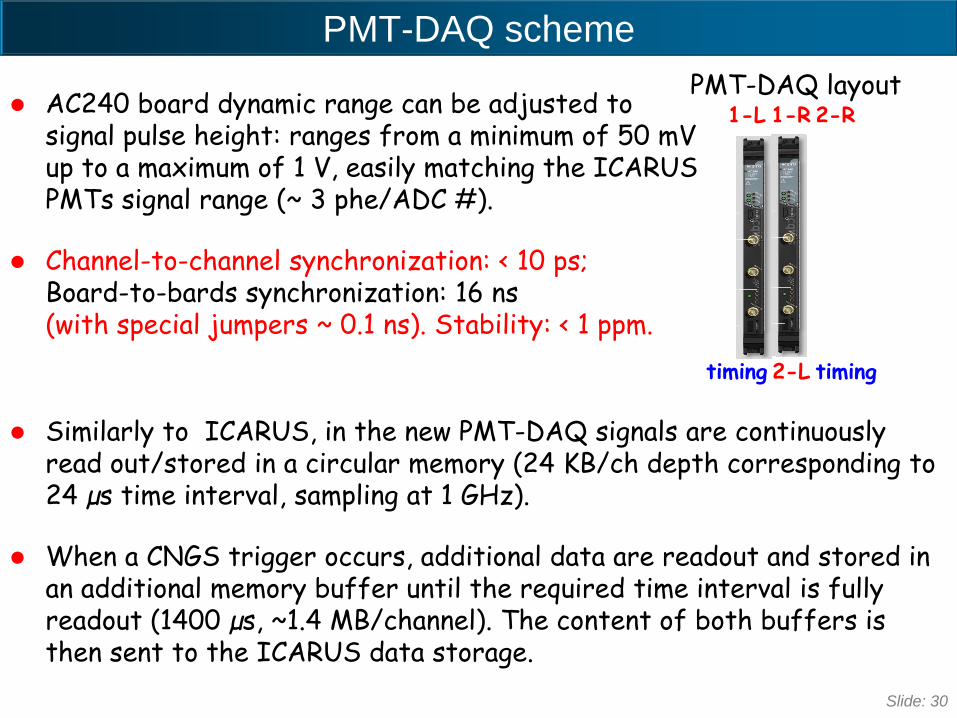
PMT-DAQ scheme
Similarly to ICARUS, in the new PMT-DAQ signals are continuously read out/stored in a circular memory (24 KB/ch depth corresponding to 24 µs time interval, sampling at 1 GHz).
When a CNGS trigger occurs, additional data are readout and stored in an additional memory buffer until the required time interval is fully readout (1400 µs, ~1.4 MB/channel). The content of both buffers is then sent to the ICARUS data storage.
1-L 1-R
2-L
2-R
timing timing
AC240 board dynamic range can be adjusted to signal pulse height: ranges from a minimum of 50 mV up to a maximum of 1 V, easily matching the ICARUS PMTs signal range (~ 3 phe/ADC #).
Channel-to-channel synchronization: < 10 ps; Board-to-bards synchronization: 16 ns (with special jumpers ~ 0.1 ns). Stability: < 1 ppm.
PMT-DAQ layout
Slide: 30

ICARUS PMT signal timing
PMT & timing signals recorded on same AC240 boards: absolute PMT signal timing obtained from time interval between the 2 signals (few ns precision)
LNGS timing signal (PPmS) with coded info on absolute time of the first edge, sent every ms to Hall B via ~ 8 km optical fiber: 42036.6±1.3 ns delay accurately calibrated in collaboration with the LNGS “Technical and Research divisions”
Propagation of PMT signals to DAQ (PMT ~75 ± 2 ns transit time and ~5ns CANBERRA) accurately calibrated: 299 (1L), 293 (1R) 295 (2L) 295 (2R) ± 5.5 ns (due to PMT transit time spread vs bias voltage).
Slide: 31
Sampling time (ns) Sampling time (ns)
PMT signal onset identifiable with ~ ns resolution
LNGS timing
PMT signal
(x 103)

2011 CNGS bunched beam Data
From October 31st to Nov. 5th ICARUS observed 7 bunched-beam-associated events, (~2.2 x 10¹⁶ pot collected): 2 CC νμ events, 1 NC ν event, 1 stopping + 3 crossing m’s from ν interaction in upstream rock.
Bunched beam: 4 bunches/spill, 3 ns FWHM, 524 ns separation
Due to 2 ms shift of Early Warning Signal w.r.t. actual CERN-SPS proton extract. time, ICARUS trigger gate was opened after n arrival, resulting in empty events. Problem settled on Oct. 31st.
Slide: 32
CC event NC event

Stopping and through-going muons
Slide: 33
n beam
~ 18.0 m
4.0 m
1.5
m
1.5
m
NOTE THE DIFFERENT ASPECT RATIOS

Neutrino arrival time
Reference point for neutrino timing: upstream wall position of ICARUS active volume -> some additional corrections needed:
the position of interaction vertex along 18 m of detector length
the distance of event vertex from closest PMT.
Both corrections precisely (~1ns) deduced from event topology in LAr-TPC through visual scanning. Events in standard TPC-DAQ and new PMT-DAQ associated through common acquisition time.
Slide: 34
Closest PMT’s
~ 13.1 m (~ 44 ns)
1.25 m (~5 ns)
ICARUS upstream wall
n beam

Blue LED’s immersed in LAr on top of Cathode
Measurement of individual PMT’s signals delay in agreement with measurement PMT-Sum with full cabling chain and measurement of each cable section with test pulse.
Residual delay fluctuation (±5.5 ns) compatible with variation of PMT transit time w.r.t biasing voltage.
Calibration of PMT’s signal propagation
Slide: 35
Single
PMT
benchmark

A
B C
D E
96.6m
40.6m
55.7m
ICARUS
Entry
wall
OPERA
Ref.
point
CERN-ICARUS baseline estimation
Rely on existing available
geodesy data (OPERA/LNGS)
Slide: 36
POINT Distance to
CERN (m)
A 730465.4
B 730575.2
C 730575.6
D 730575.2
E 730574.9
G. Brunetti, "Neutrino velocity
measurement with the OPERA
experiment in the CNGS beam”,
PhD Thesis (2011)
G. Colosimo et al.,
“Determination of the CNGS
global geodesy”, OPERA public
note 132 (2011)
Distance CERN-BCT to ICARUS upstream wall: 731222.3 ± 0.5 m Expected time of flight for (v = c) = 2439098 ± 1.7 ns (including 2.2 ns contribution due to earth rotation).
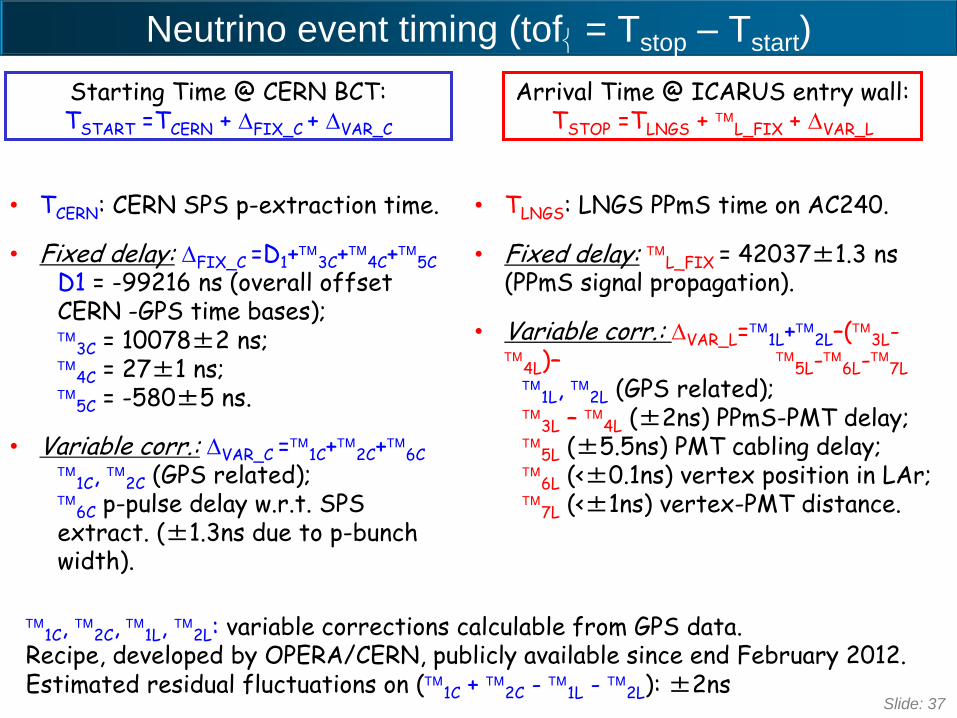
Neutrino event timing (tof = Tstop – Tstart)
Arrival Time @ ICARUS entry wall: TSTOP =TLNGS + L_FIX + DVAR_L
Starting Time @ CERN BCT: TSTART =TCERN + DFIX_C + DVAR_C
• TCERN: CERN SPS p-extraction time.
• Fixed delay: DFIX_C =D1+3C+4C+5C D1 = -99216 ns (overall offset CERN -GPS time bases); 3C = 10078±2 ns; 4C = 27±1 ns; 5C = -580±5 ns.
• Variable corr.: DVAR_C =1C+2C+6C 1C, 2C (GPS related); 6C p-pulse delay w.r.t. SPS extract. (±1.3ns due to p-bunch width).
• TLNGS: LNGS PPmS time on AC240.
• Fixed delay: L_FIX = 42037±1.3 ns (PPmS signal propagation).
• Variable corr.: DVAR_L=1L+2L–(3L- 4L)– 5L-6L-7L
1L, 2L (GPS related); 3L – 4L (±2ns) PPmS-PMT delay; 5L (±5.5ns) PMT cabling delay; 6L (<±0.1ns) vertex position in LAr; 7L (<±1ns) vertex-PMT distance.
1C, 2C, 1L, 2L: variable corrections calculable from GPS data. Recipe, developed by OPERA/CERN, publicly available since end February 2012. Estimated residual fluctuations on (1C + 2C - 1L - 2L): ±2ns
Slide: 37
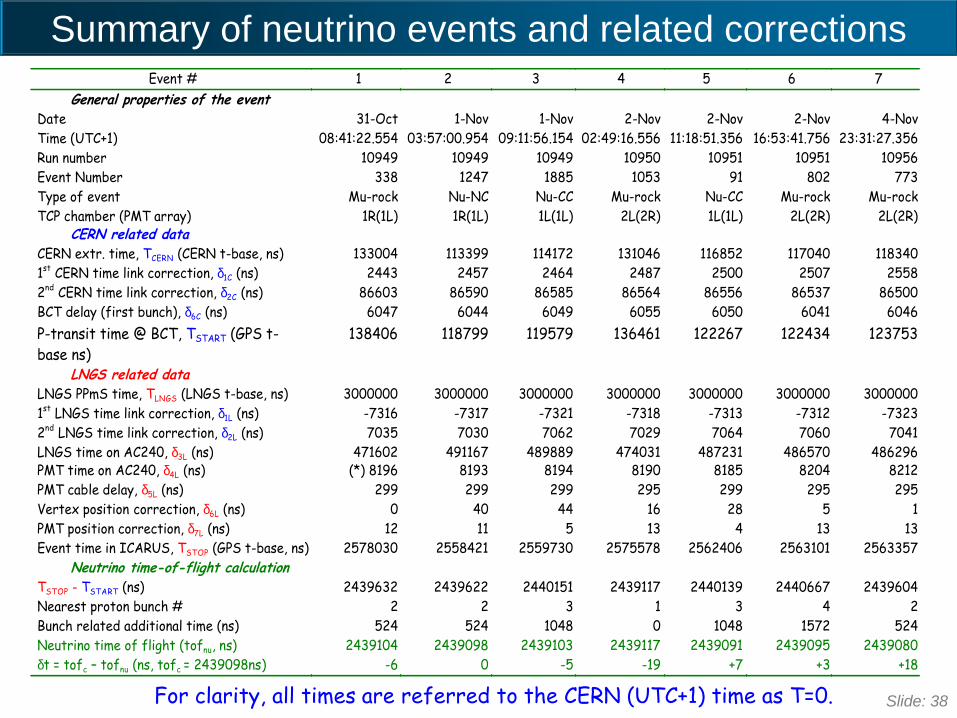
Summary of neutrino events and related corrections
Event # 1 2 3 4 5 6 7
General properties of the event Date 31-Oct 1-Nov 1-Nov 2-Nov 2-Nov 2-Nov 4-Nov
Time (UTC+1) 08:41:22.554 03:57:00.954 09:11:56.154 02:49:16.556 11:18:51.356 16:53:41.756 23:31:27.356
Run number 10949 10949 10949 10950 10951 10951 10956
Event Number 338 1247 1885 1053 91 802 773
Type of event Mu-rock Nu-NC Nu-CC Mu-rock Nu-CC Mu-rock Mu-rock
TCP chamber (PMT array) 1R(1L) 1R(1L) 1L(1L) 2L(2R) 1L(1L) 2L(2R) 2L(2R) CERN related data
CERN extr. time, TCERN (CERN t-base, ns) 133004 113399 114172 131046 116852 117040 118340
1st CERN time link correction, d1C (ns) 2443 2457 2464 2487 2500 2507 2558
2nd CERN time link correction, d2C (ns) 86603 86590 86585 86564 86556 86537 86500
BCT delay (first bunch), d6C (ns) 6047 6044 6049 6055 6050 6041 6046
P-transit time @ BCT, TSTART (GPS t-
base ns)
138406 118799 119579 136461 122267 122434 123753
LNGS related data
LNGS PPmS time, TLNGS (LNGS t-base, ns) 3000000 3000000 3000000 3000000 3000000 3000000 3000000
1st LNGS time link correction, d1L (ns) -7316 -7317 -7321 -7318 -7313 -7312 -7323
2nd LNGS time link correction, d2L (ns) 7035 7030 7062 7029 7064 7060 7041
LNGS time on AC240, d3L (ns) 471602 491167 489889 474031 487231 486570 486296 PMT time on AC240, d4L (ns) (*) 8196 8193 8194 8190 8185 8204 8212
PMT cable delay, d5L (ns) 299 299 299 295 299 295 295
Vertex position correction, d6L (ns) 0 40 44 16 28 5 1
PMT position correction, d7L (ns) 12 11 5 13 4 13 13
Event time in ICARUS, TSTOP (GPS t-base, ns) 2578030 2558421 2559730 2575578 2562406 2563101 2563357
Neutrino time-of-flight calculation TSTOP - TSTART (ns) 2439632 2439622 2440151 2439117 2440139 2440667 2439604
Nearest proton bunch # 2 2 3 1 3 4 2
Bunch related additional time (ns) 524 524 1048 0 1048 1572 524
Neutrino time of flight (tofnu, ns) 2439104 2439098 2439103 2439117 2439091 2439095 2439080
dt = tofc – tofnu (ns, tofc = 2439098ns) -6 0 -5 -19 +7 +3 +18
For clarity, all times are referred to the CERN (UTC+1) time as T=0. Slide: 38

The average dt = tofc– tofn of the 7 events is +0.3 ns with an r.m.s. of 10.5 ns and ~9 ns systematic error, obtained from combining in quadrature all quoted uncertainties.
The statistical error on the average (4.9 ns) is estimated from a Student distribution with 6 d.o.f.
n velocity compatible with speed of light
Neutrino time of flight result
Slide: 39
First claim
Perspectives for 2012 run
Participation in the new measurement campaign with the CNGS bunched beam in 2012
Three time distribution systems available in 2012:
• existing LNGS PPmS signal
• time stamping of ICARUS trigger signal with new independent clock synchronization system (by Borexino Collaboration at LNGS)
• timing distribution system over the “White Rabbit” protocol soon operational at LNGS under CERN responsibility: the provided time stamp PPmS signal will be recorded on PMT-DAQ
• ICARUS will contribute to the new geodetic measurement campaign with Borexino/LVD foreseen for next months.
Slide 40

Slide 41
BACK-UP

ICARUS CNGS trigger
CNGS “Early Warning” signal sent 80 ms before SPS proton extraction, containing the predicted extraction time of the 2 CNGS spills (10.5 μs).
Trigger: photomultiplier sum signal for each chamber within 60 μs wide beam gate, open in coincidence with SPS proton extraction.
80 events per day recorded with a trigger rate of about 1 mHz, with a time distribution in agreement with spill duration.
2.40 ms offset value in agreement with 2.44 ms ν-tof (~40 μs fiber transit time from external lab to Hall B).
Slide: 42