geothermal energy and its value imperial valley renewable...
TRANSCRIPT
Green energy you can rely on
Copyright © 2016 Ormat Technologies, Inc.
Heber Geothermal Complex, CA, USA
March 10, 2016Rahm OrensteinVP, Business Development
Geothermal Energy and its Value
Imperial Valley Renewable Energy Summit

Copyright © 2016 Ormat Technologies, Inc.
Disclaimer
Information provided during this presentation may contain statements relating to current expectations, estimates, forecasts and projections about futureevents that are forward-looking statements as defined in the Private Securities Litigation Reform Act of 1995.These forward-looking statements generally relate to the company’s plans, objectives and expectations for future operations, and are based onmanagement’s current estimates and projections of future results or trends. Actual future results may differ materially from those projected as a resultof certain risks and uncertainties.
For a discussion of such risks and uncertainties, please see risk factors as described in the Annual Report on Form 10-K filed with the securities andexchange commission on February 26, 2016.
In addition, during this presentation, statements may be made that include a financial measure defined as non-GAAP financial measures by theSecurities and Exchange Commission, such as EBITDA and adjusted EBITDA. These measures may be different from non-GAAP financial measuresused by other companies. The presentation of this financial information is not intended to be considered in isolation or as a substitute for the financialinformation prepared and presented in accordance with GAAP.
Management of Ormat Technologies believes that EBITDA and adjusted EBITDA may provide meaningful supplemental information regarding liquiditymeasurement that both management and investors benefit from referring to this non-GAAP financial measures in assessing Ormat Technologies’liquidity, and when planning and forecasting future periods. This non-GAAP financial measures may also facilitate management’s internal comparisonto the company’s historical liquidity.
EBITDA and Adjusted EBITDA are not a measurement of financial performance or liquidity under accounting principles generally accepted in the UnitedStates of America and should not be considered as an alternative to cash flow from operating activities or as a measure of liquidity or an alternative tonet earnings as indicators of our operating performance or any other measures of performance derived in accordance with accounting principlesgenerally accepted in the United States of America. EBITDA and Adjusted EBITDA are presented because we believe they are frequently used bysecurities analysts, investors and other interested parties in the evaluation of a company’s ability to service and/or incur debt. However, othercompanies in our industry may calculate EBITDA and Adjusted EBITDA differently than we do.
Copyright © 2016 Ormat Technologies, Inc. All Rights Reserved. This document contains information proprietary to Ormat Technologies, Inc.Reproduction in any form without prior written permission is strictly prohibited
2

Copyright © 2016 Ormat Technologies, Inc.
Introduction
3
Market leader with proven track record in the geothermal sector
Our mission is to become a leading global renewable energy provider
Own & Operate nearly
700MW
$million Revenue in 2015
595Years of
experience
50
Employees
1,060

Copyright © 2016 Ormat Technologies, Inc.
The only vertically integrated player with a balanced business model
Business Segment Overview
4
• Owns & operates 697 MW• Sells firm & flexible electricity• Fully contracted
• Technology leadership• Sells geothermal and REG2
power plants as well as other products to 3rd parties
• Provides EPC3 services
Revenue1
1 Five years average (2011-2015)2 REG - recovered energy generation3 EPC - engineering, procurement and construction
Products
Electricity
66%
34%
66%
34%
Copyright © 2016 Ormat Technologies, Inc.
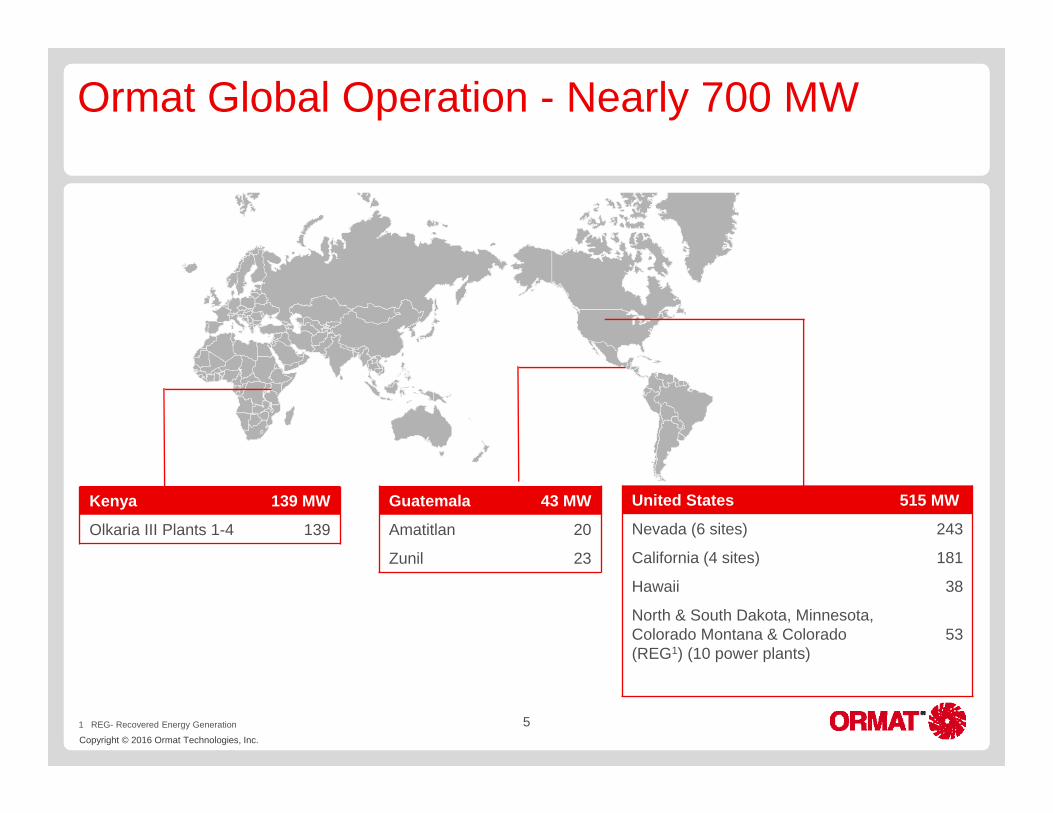
Ormat Global Operation - Nearly 700 MW
United States 515 MW
Nevada (6 sites) 243
California (4 sites) 181
Hawaii 38
North & South Dakota, Minnesota, Colorado Montana & Colorado (REG1) (10 power plants)
53
Guatemala 43 MW
Amatitlan 20
Zunil 23
Kenya 139 MW
Olkaria III Plants 1-4 139
1 REG- Recovered Energy Generation 5

Copyright © 2016 Ormat Technologies, Inc.
Ormat in the Imperial Valley
6
Ormesa Geothermal Complex, 42 MW

Copyright © 2016 Ormat Technologies, Inc.
Ormat in the Imperial Valley
7
Heber Geothermal Complex, 92 MW

Copyright © 2016 Ormat Technologies, Inc.
Ormat in the Imperial Valley
8
North Brawley, 18 MW

Copyright © 2016 Ormat Technologies, Inc.
Ormat in the Imperial Valley
9
Heber Solar, 10 MWAC

Copyright © 2016 Ormat Technologies, Inc.
Global Geothermal Potential (MW)
Areas with Potential Geothermal ResourcesInstalled Capacity 2014Hydrothermal Geothermal Resources Potential (139,555 MW)
Source: Hydrothermal Geothermal Resources Potential, EMERGING ENERGY RESEARCH, LLC. Global “Geothermal Markets and Strategies: 2009–2020”, May 2009. "Geothermal Power Generation in the World 2005–2010 Update Report" Ruggero Bertani Enel Green Power, via Dalmazia 15 – 00198 Roma (Italy) April 2010. 2015 Annual U.S. & Global Geothermal Power Production Report GEA Feb.2015.
Potential is over 10x the global installed capacity of 13GWPotential is over 10x the global installed capacity of 13GW
3,862
36,330
608
5,850
1,508
6,982 664
6,000
3,525
46,903
1,566
31,980
1,026
5,510
10

Copyright © 2016 Ormat Technologies, Inc.
Growth Initiatives - Organic Growth and M&A
• Expanding geographical footprint and diversifying technologies• Added 29 MW in January 2016• Expect to add between 160 and 190 MW by YE 2018• Extensive activities to support long term growth
11Business Development & Exploration Construction & Development
1 Ormat’s share (12.75% in Sarulla ; 51% in Menangai 85% in Bouillante) ;
M&A
Project ProjectedCapacity
Expected COD
Guadeloupe- Bouillante 7 MW1 H2 2016
Indonesia - Sarulla Project, Phase 1, (330 MW project)
14 MW1 YE 2016
Guadeloupe- Bouillante 4 MW1 2017
Honduras, Platanares 35 MW 2017
U.S. - Tungsten 25 MW-35 MW 2017
U.S. - Dixie Meadows 25 MW-35 MW 2018
Kenya, Menangai(35 MW project)
18 MW1 2018
Guadeloupe IndonesiaKenya
Chile
GuatemalaHonduras
U.S.
New Zealand
Ethiopia

Copyright © 2016 Ormat Technologies, Inc.
Intermittent Renewables Dominate the CA RPS
12
Source: CPUC, Q2 2015 RPS report
Renewable Resources Mix based on CA IOUs RPS Compliance Reports

Copyright © 2016 Ormat Technologies, Inc.
The Challenge of High Solar Penetration
13
Source: CAISO
Copyright © 2016 Ormat Technologies, Inc.
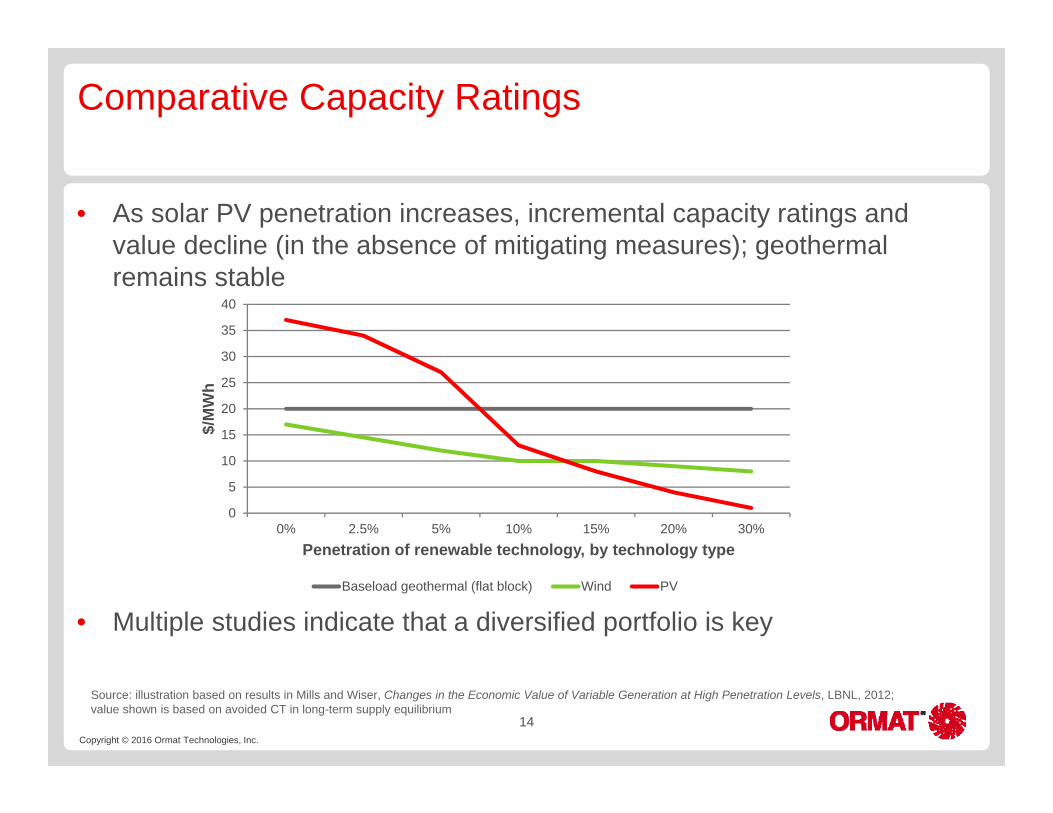
Comparative Capacity Ratings
• As solar PV penetration increases, incremental capacity ratings and value decline (in the absence of mitigating measures); geothermal remains stable
• Multiple studies indicate that a diversified portfolio is key
14
0
5
10
15
20
25
30
35
40
0% 2.5% 5% 10% 15% 20% 30%
$/M
Wh
Penetration of renewable technology, by technology type
Baseload geothermal (flat block) Wind PV
Source: illustration based on results in Mills and Wiser, Changes in the Economic Value of Variable Generation at High Penetration Levels, LBNL, 2012; value shown is based on avoided CT in long-term supply equilibrium
Copyright © 2016 Ormat Technologies, Inc.
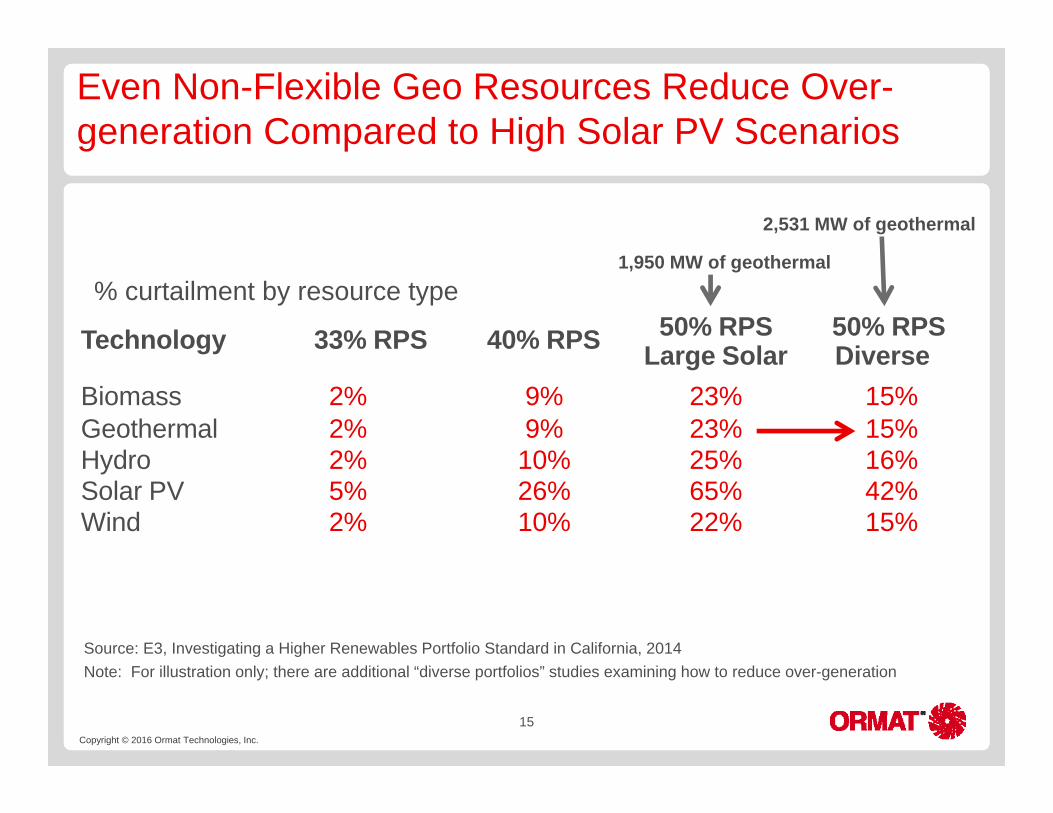
Even Non-Flexible Geo Resources Reduce Over-generation Compared to High Solar PV Scenarios
15
Technology 33% RPS 40% RPS 50% RPSLarge Solar
50% RPSDiverse
Biomass 2% 9% 23% 15%Geothermal 2% 9% 23% 15%Hydro 2% 10% 25% 16%Solar PV 5% 26% 65% 42%Wind 2% 10% 22% 15%
Source: E3, Investigating a Higher Renewables Portfolio Standard in California, 2014
2,531 MW of geothermal
1,950 MW of geothermal% curtailment by resource type
Note: For illustration only; there are additional “diverse portfolios” studies examining how to reduce over-generation
Copyright © 2016 Ormat Technologies, Inc.
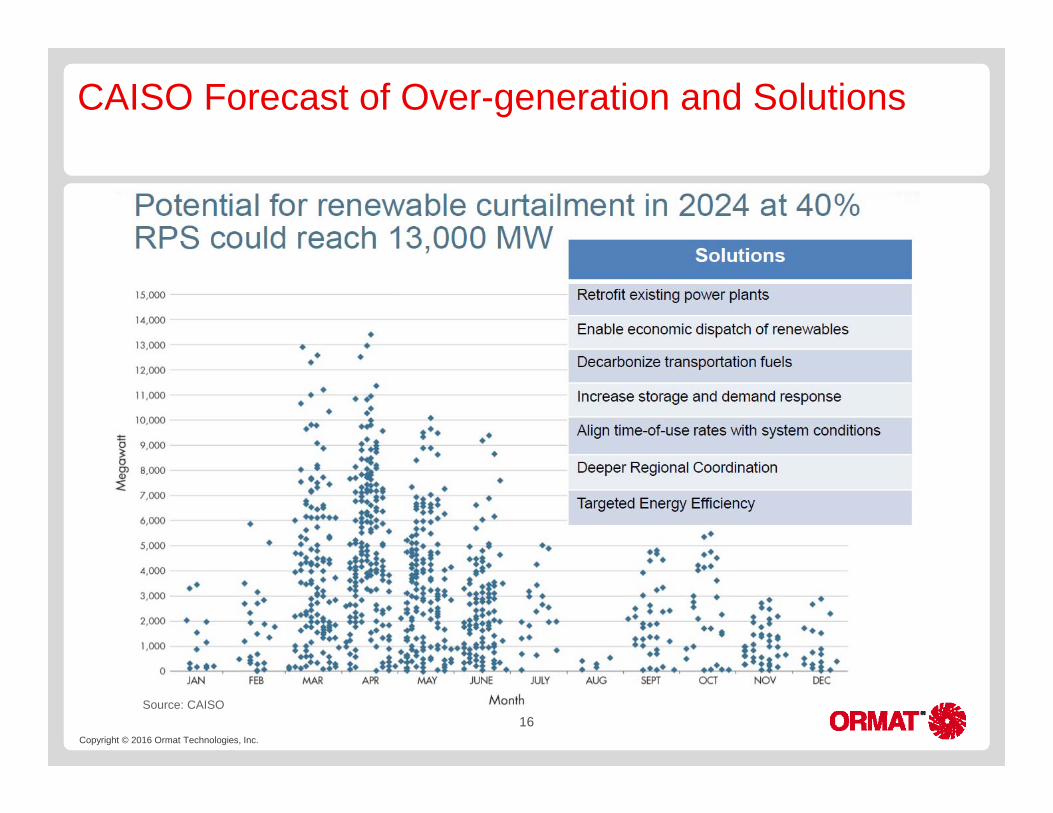
CAISO Forecast of Over-generation and Solutions
16Source: CAISO

Copyright © 2016 Ormat Technologies, Inc.
Dispatchable Geothermal: 38 MW Puna Geothermal Venture
• Big Island, Hawaii• Dispatchable energy• Automatic Generator Control
(AGC) remotely and automatically controlled by HELCO System Operator
• Dispatch: 22 ~ 38 MW• Ramp rate up or down: 2 MW
/ minute• Spinning reserve at all times:
3 MW
17
Copyright © 2016 Ormat Technologies, Inc.
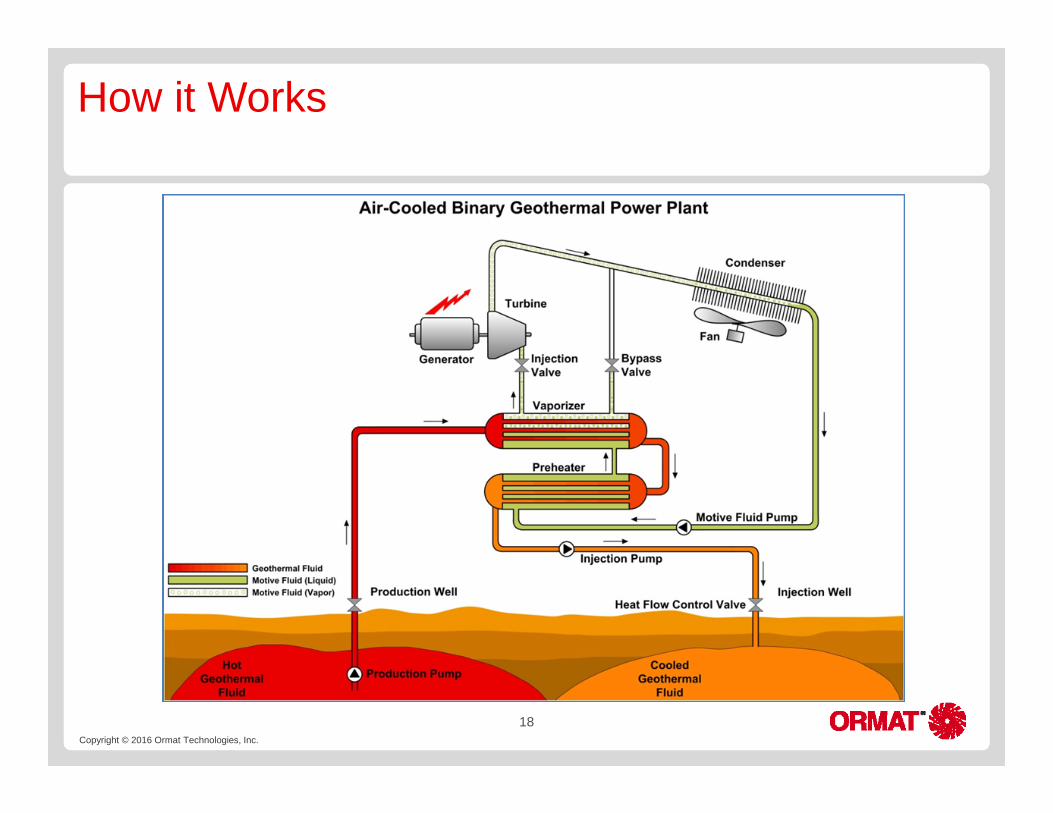
How it Works
18
Copyright © 2016 Ormat Technologies, Inc.
Geothermal Power in a High Intermittent Renewables Mix - Firm, Flexible and GHG-Free
• Diversity (base-load)• Flexibility and ancillary services
• Flexible capacity• Spinning reserve• Regulation up and down• Voltage regulation• Fast ramping
• Multiple cycles / day • 30% of nameplate / minute
19

Copyright © 2016 Ormat Technologies, Inc.
Geothermal Power in a High Intermittent Renewables Mix - Firm, Flexible and GHG-Free
20
• Cost effective. >20% cost reduction in recent years:• Better exploration• More efficient power plant design• Reduction in O&M costs
• Significant growth potential

Copyright © 2016 Ormat Technologies, Inc.
21
The Power of Experience
For further information: www.ormat.com / [email protected] you