georgina armstrong - data visualisations. making boring data exciting and empowering
TRANSCRIPT
Speaker 1 of 15
Followed by
Name Surname
Georgina Armstrong
Data Visualisation
Georgina Armstrong
Empowering Data Through Visualisation
FUTURES RE-IMAGINED Speaker 17 of 17
Followed by
After Party :)
H e l l o M Y N A M E I S GEORGINA AND I have been called many things: Data Analyst, data scientist, Business analyst, Data Ferret, data dweeb, that numbers lady, the one with the pivot tables, that Chick with all the excel, Head of analytics, head of data, chief accountability officer, Our numbers guru, head of optimise, person in charge of the numbers, our data geek. I’m a data artist at 22Seven.
Is Visualisation Important?
YES
Must every graphic be thrilling riot of colours
and shapes?
No
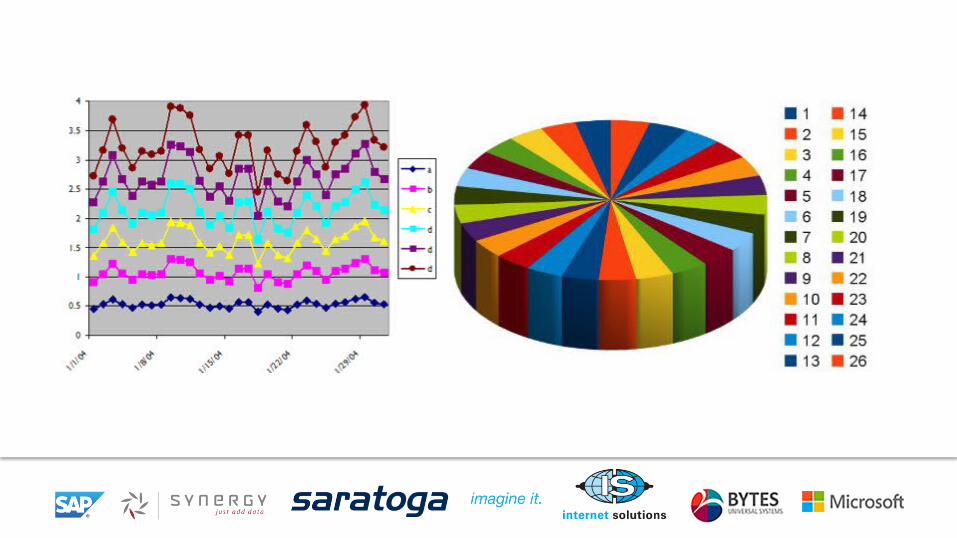
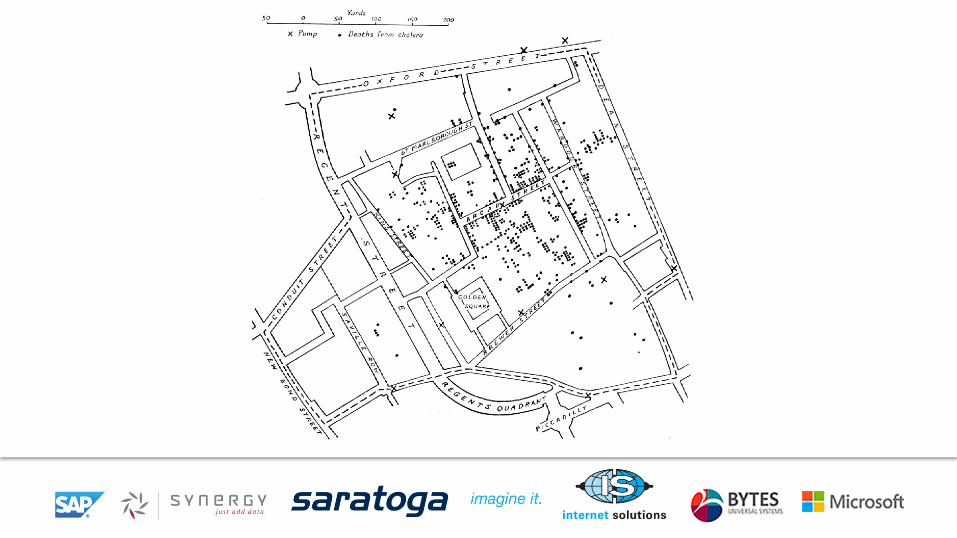
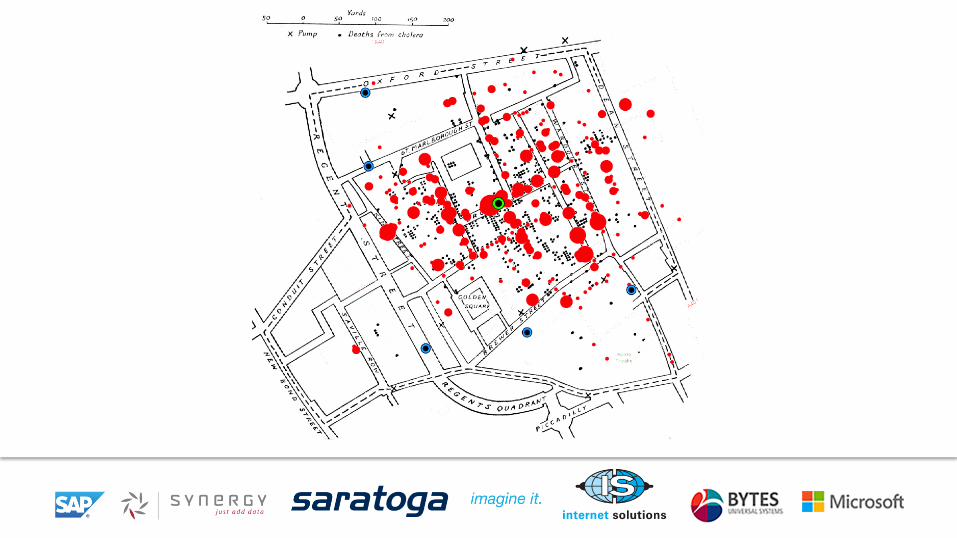
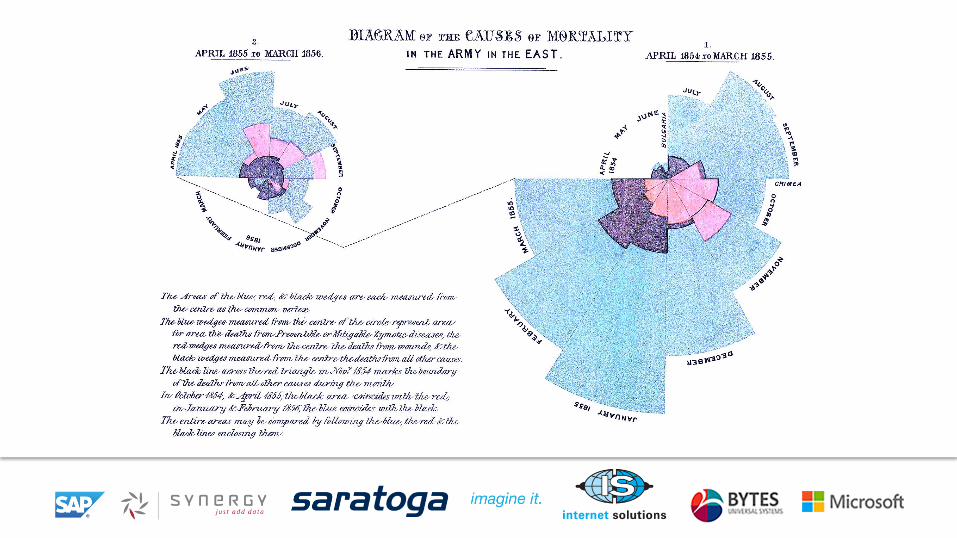
Graphics Reveal Data
- Edward R Tufte

We’re living in a data visualisation renaissance.
Enterprise Solutions
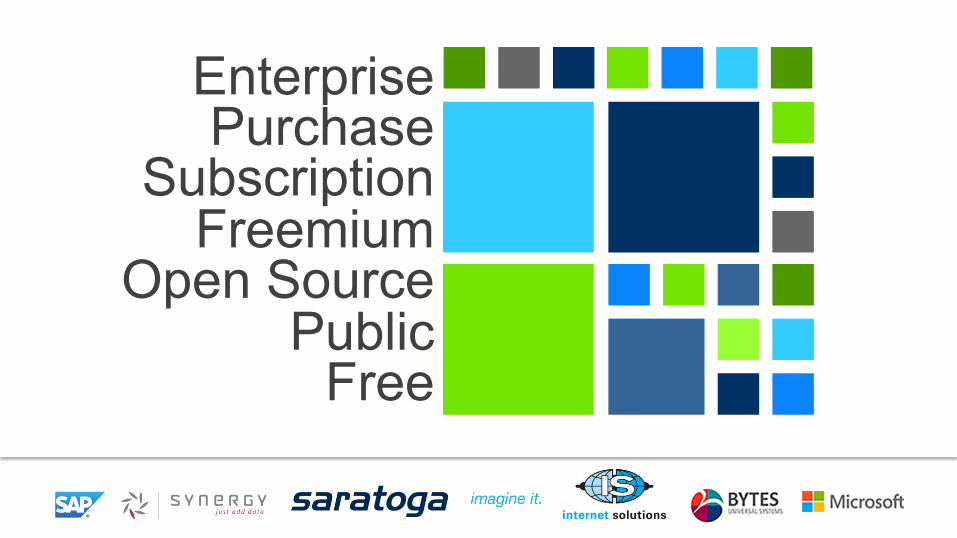
Enterprise Purchase
Subscription Freemium
Open Source Public
Free
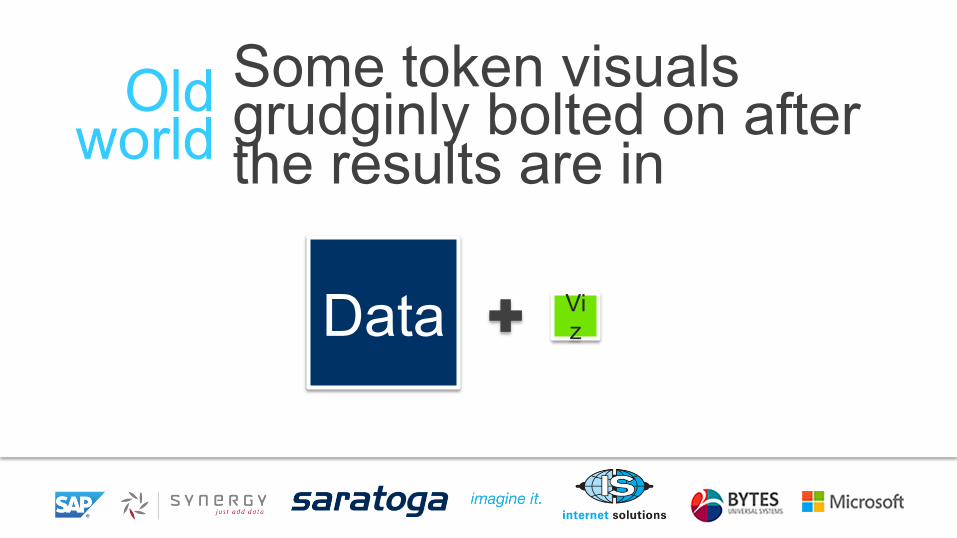
Data Viz
Some token visuals grudginly bolted on after the results are in
Old world
Data Data
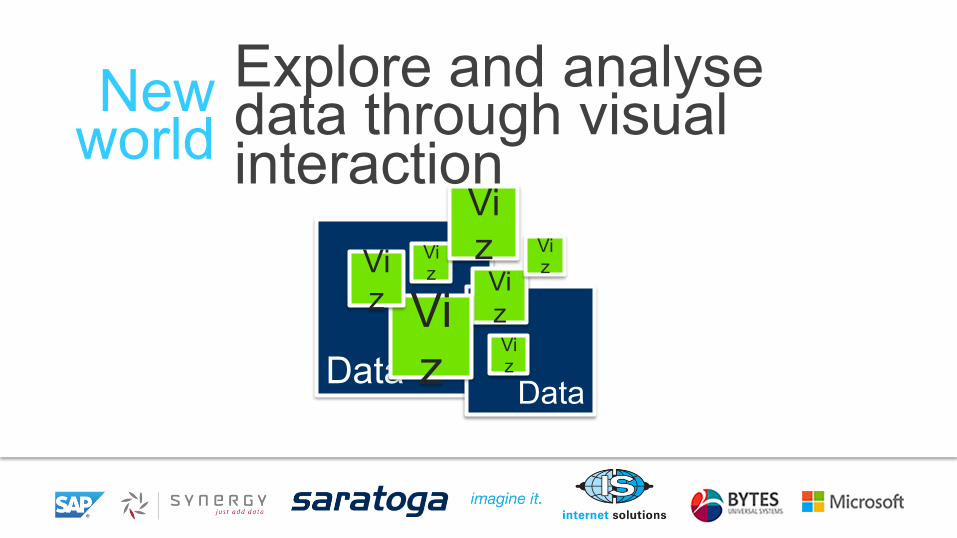
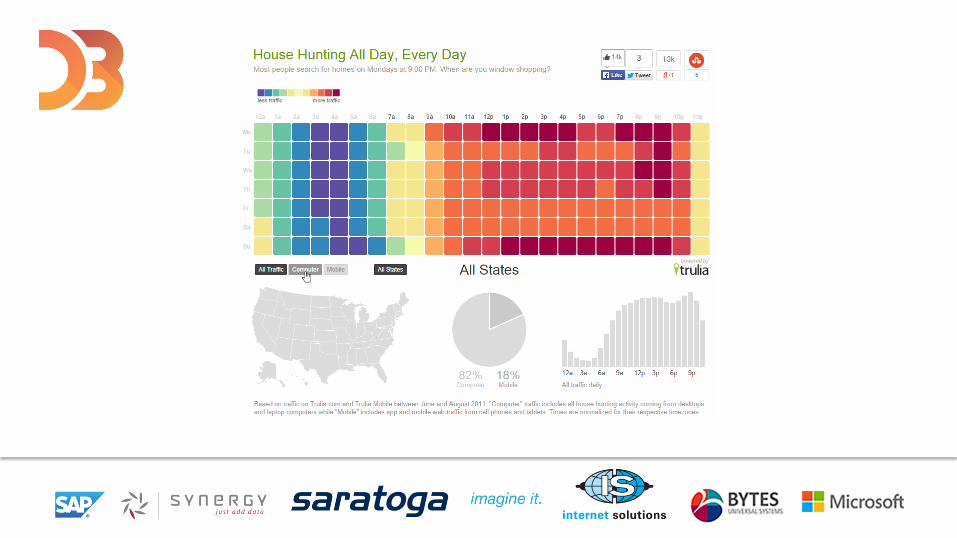
Explore and analyse data through visual interaction
Viz Vi
z Viz
Viz Vi
z Viz
Viz
New world
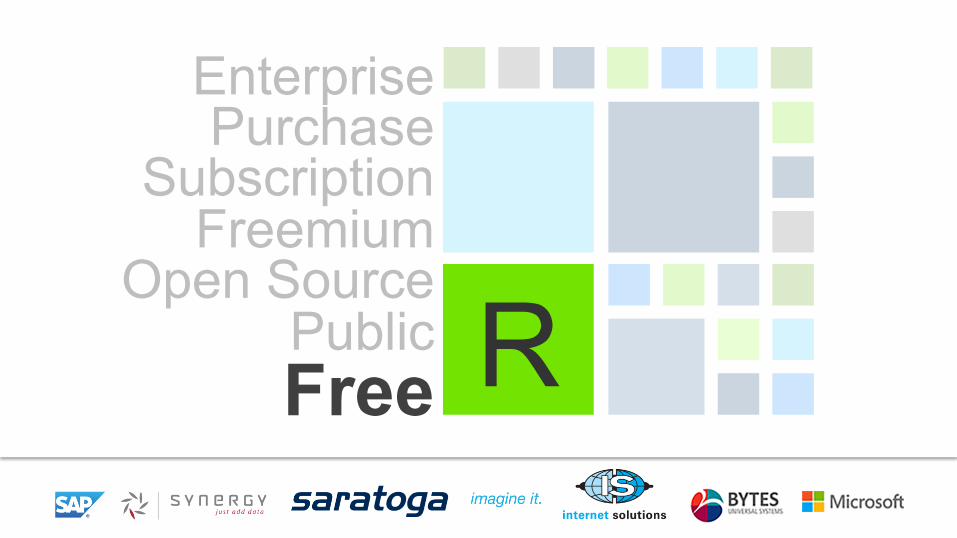
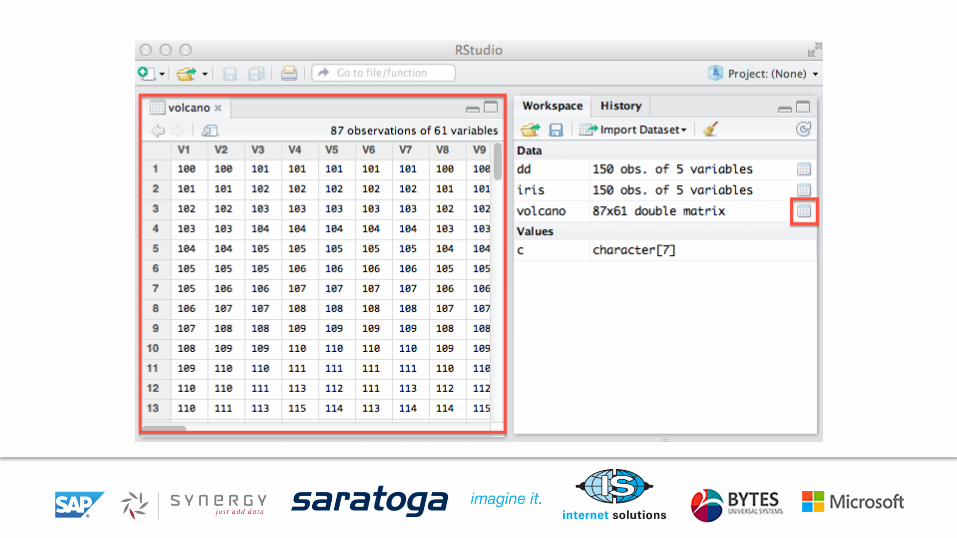
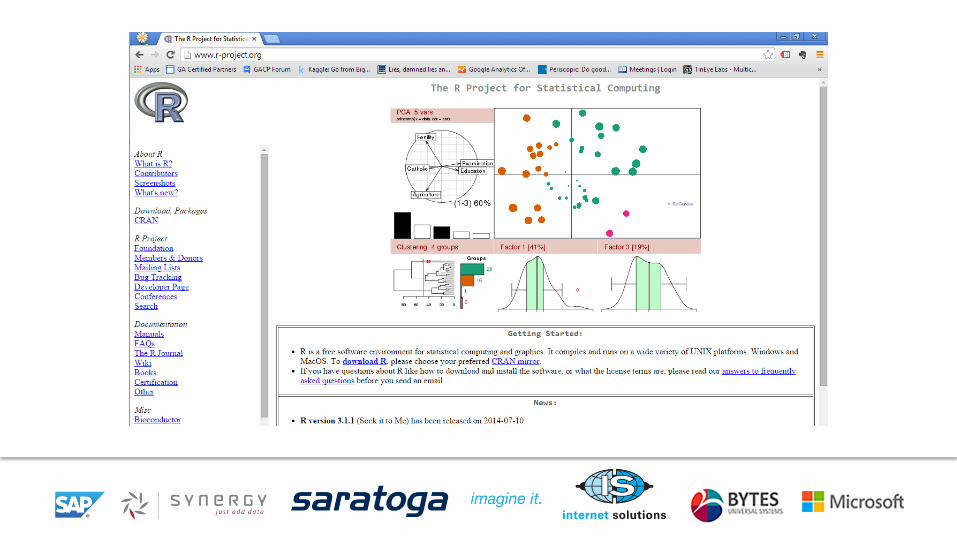
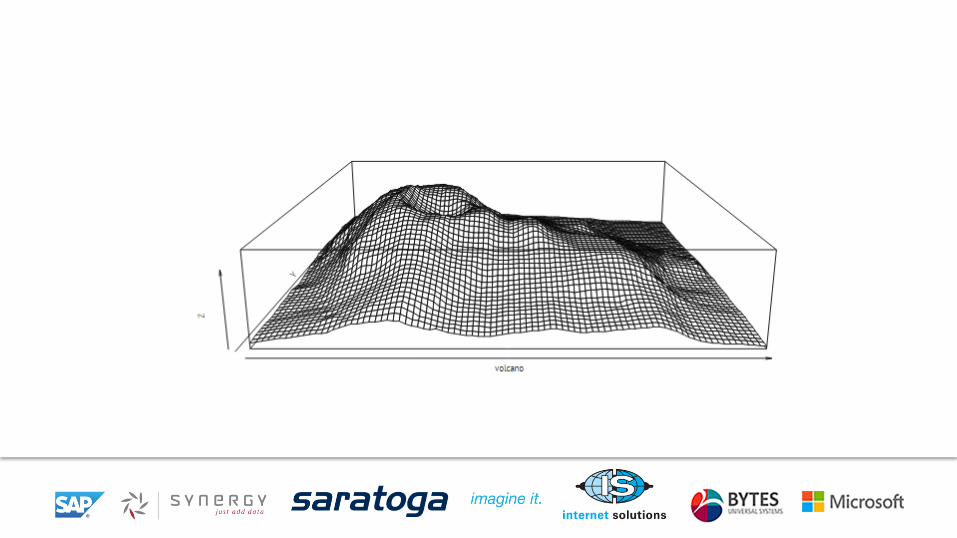
R
Enterprise Purchase
Subscription Freemium
Open Source Public Free
D3
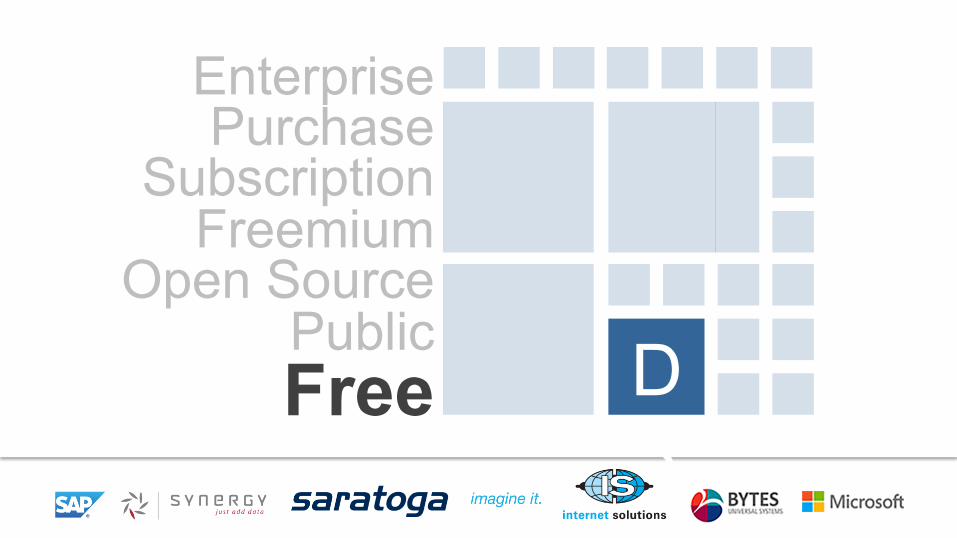
Enterprise Purchase
Subscription Freemium
Open Source Public Free
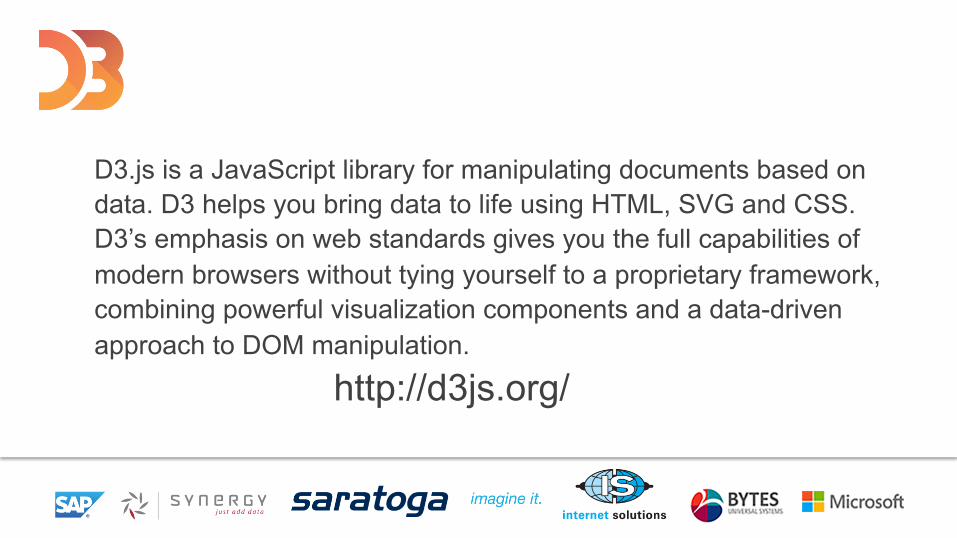
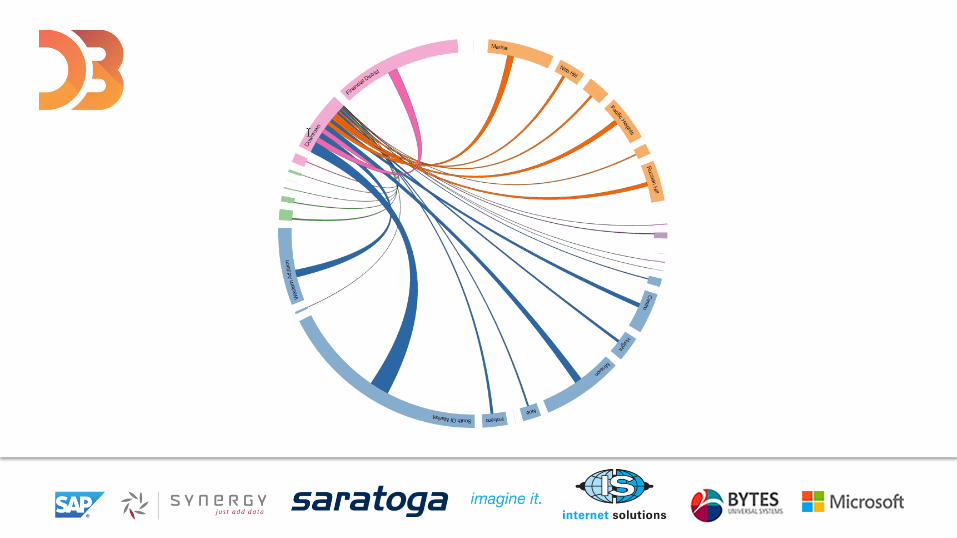
D3.js is a JavaScript library for manipulating documents based on data. D3 helps you bring data to life using HTML, SVG and CSS. D3’s emphasis on web standards gives you the full capabilities of modern browsers without tying yourself to a proprietary framework, combining powerful visualization components and a data-driven approach to DOM manipulation.
http://d3js.org/
Oh ****, am I obsolete?
Possibly yes
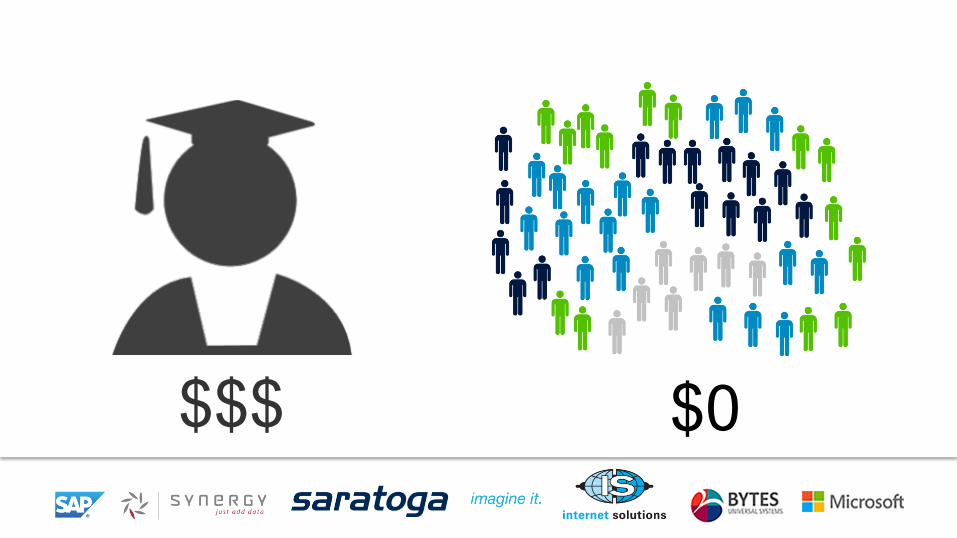
$$$ $0
It’s a renaissance.
THANK YOU
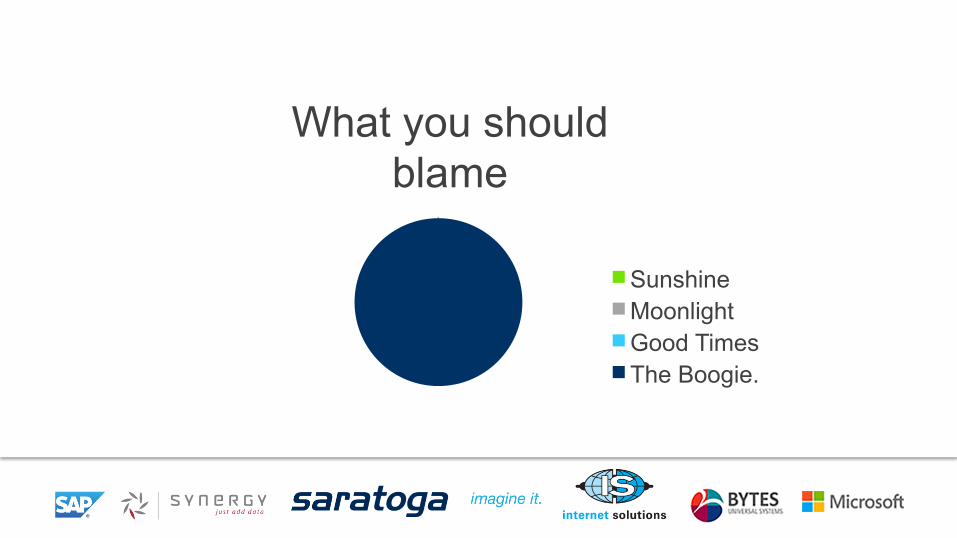
What you should blame
Sunshine Moonlight Good Times The Boogie.
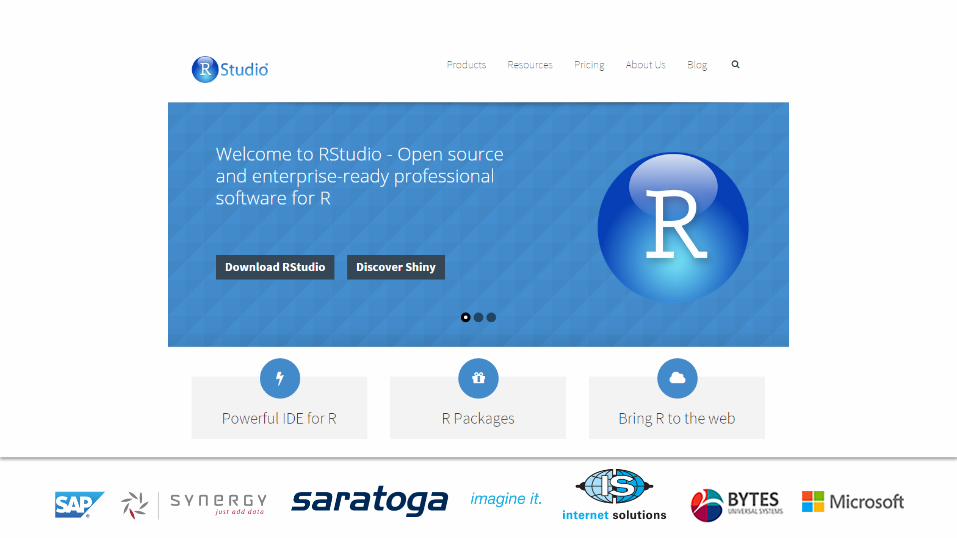
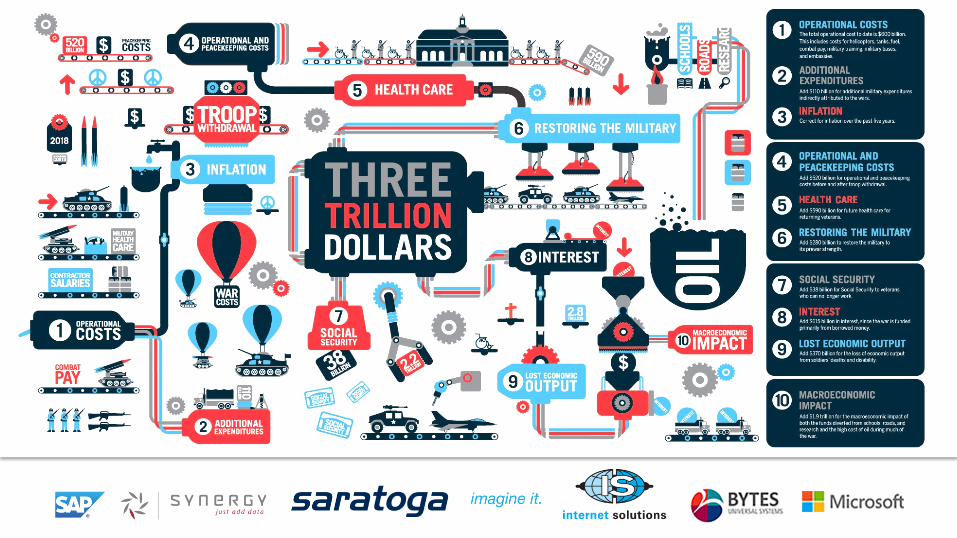
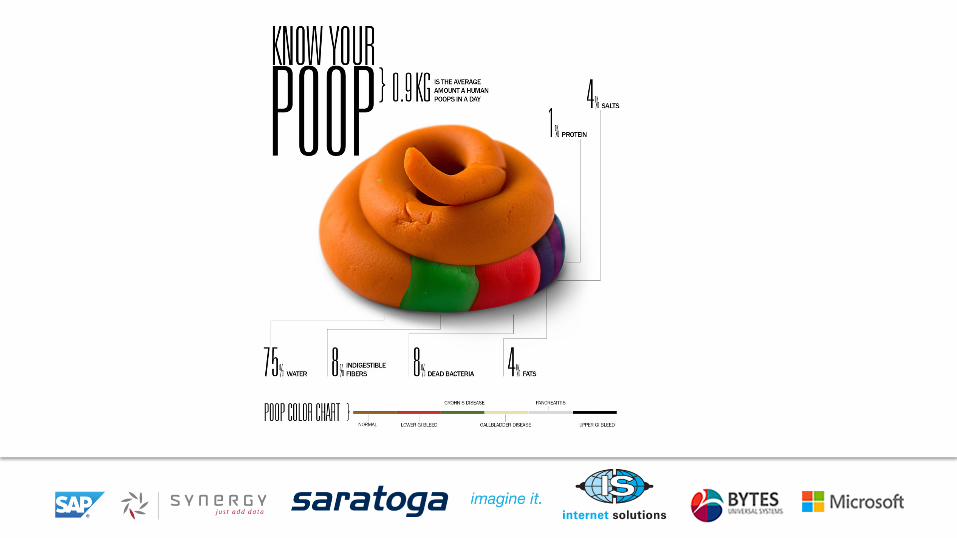
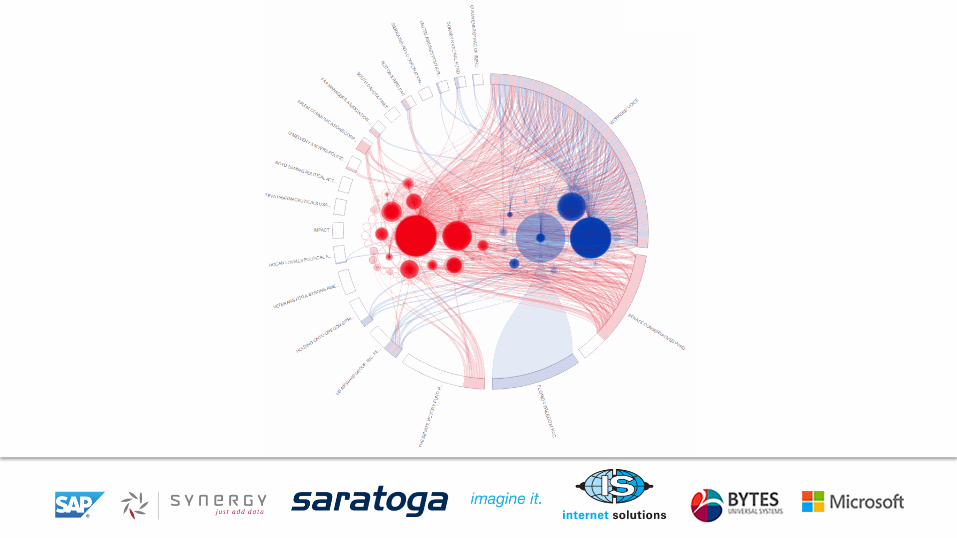
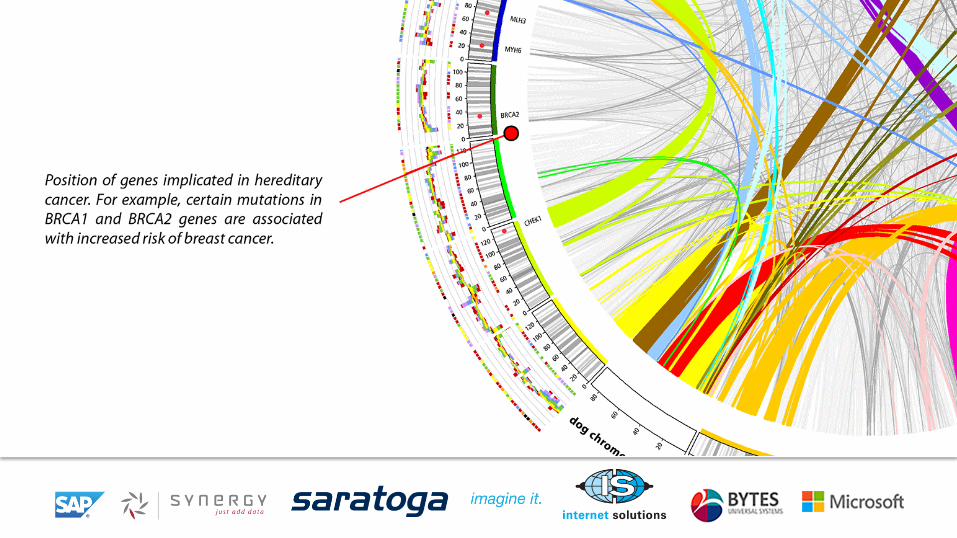
R and R Studio http://www.r-project.org/ http://www.rstudio.com/ Tools usage among data scientists survey http://www.rexeranalytics.com/Data-Miner-Survey-Results-2013.html Featured Data Visuals: http://en.wikipedia.org/wiki/Florence_Nightingale http://en.wikipedia.org/wiki/1854_Broad_Street_cholera_outbreak http://bost.ocks.org/mike/uberdata/ http://www.brightpointinc.com/interactive/ustrade/index.html?source=d3js http://www.trulia.com/trends/2011/09/house-hunter-by-day-not-so-much-after-midnight/ http://magazine.good.is/infographics/the-three-trillion-dollar-war-its-cost-in-ten-steps http://earthlymission.com/know-your-poop/ http://circos.ca/guide/genomic/ http://www.brightpointinc.com/interactive/political_influence/index.html?source=d3js
LINKS!