georgian economic trends -- 1998 no. 3 - georgian … · · 2013-08-05countries and the european...
TRANSCRIPT
GEORGIAN ECONOMIC TRENDS
GEORGIAN ECONOMIC TRENDS – 1998 NO.3 1
Contents
About Georgian Economic Trends 2 Introductory note 3 1. Summary and Short Economic Report 4 2. National Accounts and Economic Stability 9 3. Government Revenue and Expenditure 17 4. Money and Finance 32 5. Infrastructural Development and Regional News 39 6. International Trade 54 7. Privatisation and Production 67 8. Employment and Social Conditions 90 Calendar of Events 105 Statistical Appendix 113 Abbreviations 129
About Tacis and GEPLAC Georgian Economic Trends is a publication which is now funded by the Tacis Programme through the Georgian-European Policy and Legal Advice Centre. The Tacis Programme is a European Union Initiative for the New Independent States and Mongolia which fosters the development of harmonious and prosperous economic and political links between the European Union and these partner countries. Tacis does this by providing grant finance for know-how to support the process of transformation to market economies and democratic societies. Between 1991 and 1996 Tacis has committed more than ECU 2,807 million. Tacis works closely with its partner countries and provides know-how from a wide range of public and private organisations including advice and training, developing and reforming legal and regulatory frameworks, institutions and organisations, and setting up partnerships, networks, twinnings and pilot projects. Tacis also cultivates links and lasting relationships between organisations in the partner countries and the European Union to promote understanding of democracy and a market-oriented social and economic system. The Georgian-European Policy and Legal Advice Centre (GEPLAC) was established in 1998 by Tacis in order to support economic and legal reform in Georgia. Activities under GEPLAC’s programme include the production of Georgian Economic Trends and of the Georgian Legal Review, and the provision of economic policy and legal advice to the Georgian Government.
This publication is financed by the European Union’s Tacis Programme, which provides grants finance for know-how to foster the development of market economies and democratic societies in the New Independent States and Mongolia.
ABOUT GEORGIAN ECONOMIC TRENDS
2 GEORGIAN ECONOMIC TRENDS – 1998 No.3
This is the ninth quarterly edition of Georgian Economic Trends. GET was established in 1995 and is published in Georgian and English: it aims to provide all those interested in the progress of economic reform in Georgia with a review of developments. This and previous editions are available on the internet at:
www.sanet.ge/geplac/get This edition draws on information from a wide range of government and non-government sources including in particular the State Department for Statistics, the National Bank of Georgia, the United State Social Safety Fund, as well as other Government ministries and departments. Wherever possible every care is taken to ensure that data sources are fully acknowledged since without the full co-operation and support of information providers, including regular consultation, it would not be possible to produce this review. The purpose of GET is to offer an independent analytical account of economic trends drawing on information made publicly available. As part of this work, comments and advice are offered on policy and on the collection and dissemination of economic and other information. These are always intended to support the process of economic reform in Georgia and represent the view of the editors only and do not represent any official view of the European Commission, the Tacis Georgian-European Policy and Legal Advice Centre or the Government of Georgia. Readers may quote any information used provided it is properly acknowledged. For further information please contact Georgian Economic Trends at:
26, Gabriel Episkoposi Street, Tbilisi
Tel: Tbilisi (995 32) 93 91 61 / 77 67 64 Fax: Tbilisi (995 32) 93 91 60 / 77 65 14
e-mail: [email protected]
The following people worked on this edition: Mikheil Abramishvili, Andrew Barnard, Natalia Kakabadze, Daniel Linotte, Nikoloz Loladze, Veronica Schneider, Irakli Tsereteli. Printed by SMArt Ltd. 23, Bochorma St., Tbilisi, Georgia Tel: (995 32) 93 35 73 Mobile: 899 50 69 29 E-mail: [email protected]

INTRODUCTORY NOTE
GEORGIAN ECONOMIC TRENDS – 1998 No.3 3
Distribution policy for GET As a TACIS-funded publication whose purpose is technical assistance, Georgian Economic Trends is written primarily for Georgian policy-makers and international donors of assistance. There are two additional groups of readers: actual and potential investors in Georgia, and people with an academic or personal interest in the Georgian economy. Copies of GET are still distributed free-of-charge to selected Georgian policy-makers and international donors of assistance; this policy is not expected to change. However, financial constraints and increasing demand now prevent us from distributing free copies to other people who want to read GET: unfortunately over the last few quarters we have run so short of copies that with great regret we have had to reject some requests. Therefore we are addressing the problem by introducing charges for printed copies: the idea is that the additional revenue will finance the printing of enough copies for all potential readers. In addition GET will continue to be available free-of-charge via the internet (both as Word documents and in html form) which people can read and from which they are also welcome to print off their own copies. Following last quarter's re-organisation of the chapters, we are continuing to develop GET in response to the needs of all our readers. The main change that we have introduced in this issue concerns our treatment of news about events that affect the Georgian economy. The aim is not only to be a statistical review but also to provide a reasonably up-to-date picture of the Georgian economy at the time of going to press. Therefore the calendar in this issue covers both the 2nd and 3rd Quarters, and the specialist chapters include updates on key events during the 3rd Quarter. (After all, it would have been unsatisfactory to wait until January before discussing the impact on Georgia of the Russian financial crisis.) This change seems to be the best way of making GET reasonably up-to-date while also ensuring that the statistical and economic analysis is as complete as it needs to be.

CHAPTER ONE: SUMMARY AND ECONOMIC REPORT
4 GEORGIAN ECONOMIC TRENDS – 1998 No.3
SUMMARY
• Georgia is now clearly in its "second phase" of economic reform, where macroeconomic stability
has been achieved but structural, institutional and legislative reforms are needed in order to sustain dynamic growth and to underpin Georgia’s application to join the WTO.
• The Georgian economy is continuing to grow strongly (11 per cent real growth per annum since
1996) following the restoration in the mid-1990s of political stability, macroeconomic stabilisation and progressive economic reform. Prices and trade are now largely liberalised, the most significant exception being electricity prices, which were raised to 6 Tetris (about 4.5 US cents) per kWh in 1998 Q3 but which remain well below the level required to cover long-term costs. Georgia’s prospects of joining the WTO in late-1999 look good.
• However, in 1998 the Government has failed to fulfil a number of conditions attached to its
Enhanced Structural Adjustment Facility loan from the IMF: this has put it in a position where it needs to achieve a dramatic improvement in tax revenue collection in the final quarter of 1998 in order to avert a serious budget crisis in the short term.
• The 1998 Q2 fiscal data shows that the Ministry of Finance kept the budget deficit at a
manageably small level (around 2 per cent of GDP) by tying expenditure to revenue. However this was achieved largely by delaying the payments of public sector salaries – accumulating expenditure arrears, in violation of Georgia’s agreements with the IMF. In the longer term the fiscal position seems basically sound, as tax revenue (although well below target) still seems to be rising at a trend rate of 15-20 per cent in real terms.
• External support for stabilisation is still required in order to prevent a spiral of devaluation and
inflation and to enable Georgia to continue to service and reschedule its debts; Georgia's debt to Turkmenistan still needs to be rescheduled.
• Numerous laws have been passed in an effort to develop an effective legal framework, but lack of
transparency (and associated corruption) remains a major problem which is not being tackled effectively. The government is still failing to make the business environment attractive enough to entice many small-scale entrepreneurs out of the shadow economy, and this is continuing to retard the development of small and medium-sized enterprises as well as playing havoc with public finance.
• Nevertheless, the government’s willingness to take account of commercial interests has made the
environment for major foreign investors substantially better than that in most of the former Soviet Union. Although there are few new major investments, there is now evidence of heavy re-investment by companies that have already established commercial operations here.
SUMMARY AND ECONOMIC REPORT
GEORGIAN ECONOMIC TRENDS – 1998 No.3 5
SHORT ECONOMIC REPORT NATIONAL ACCOUNTS AND ECONOMIC STABILITY GDP: Economic growth remains strong, with the Government reporting real growth of 11.4 per cent and 11.3 per cent in 1996 and 1997 respectively. The Government's most recent statistical report puts the first half of 1998's GDP 8.9 per cent higher in real terms than in the first half of 19971. Nevertheless, the underlying trend does not seem to have fallen; the prospects for economic growth remain reasonably good as far as supply-side factors are concerned. TRADE BALANCE: The trade deficit is continuing to widen. According to the Government's recorded trade statistics (which, although far from perfect, seem to be the most accurate source), registered imports in 1997 were USD 931 million compared with only USD 227 million exports. Imports have been increasing at an underlying rate of around 25 per cent a year, whilst exports have shown practically no increase. The statistics for the first half of 1998 tell much the same story, with import growth possibly accelerating. However, the deficit is largely a reflection of the amount of foreign participation in the economy: as in any country, it is normal for foreign investors and visitors to bring in foreign currency which directly or indirectly finances imports. Therefore the performance of Georgia's exports should be of much greater concern than the trade deficit. FOREIGN DIRECT INVESTMENT: Foreign direct investment during 1997 was officially recorded as USD 242 million, which is in line with survey evidence. Whilst there are few new foreign investors in Georgia (only two were registered during the first quarter of 1998), the foreign companies that have already made the biggest investments in Georgia are re-investing heavily. This pattern is basically encouraging for the longer term outlook, as "success stories" are likely to be the most effective way of promoting Georgia as an investment location. In addition the first half of 1998 has seen several foreign companies participating in Georgia's privatisation programme and in several cases committing themselves to significant industrial investments. FOREIGN DEBT: Debt repayments to Turkmenistan remain in arrears, with Georgia unable to find the USD 20 million that Turkmenistan is demanding as quarterly payments. ECONOMIC STABILITY: In the short term, failure to raise enough government revenue could result in serious economic instability. In the longer term the government’s finances look fundamentally sound, as general tax revenue still seems to be increasing at twice the rate of expenditure. GOVERNMENT REVENUE AND EXPENDITURE REVENUE: Tax revenue was 18 per cent below target in 1998 H1 because of shortfalls in the collection of excise duty and VAT revenue. Reports from 1998 Q3 suggest no improvement, with January-August revenue 26 per cent below target. A dramatic increase in revenue collection is required in 1998 Q4, with a commission headed by State Minister Lortkipanidze meeting twice a week to direct efforts to achieve this. EXPENDITURE: As a result of the shortfall in revenue, expenditure plans had to be scaled back in 1998 H1. This was basically achieved through cutbacks in a few major areas: expenditures on administration, health-care and education were all cut (presumably by delaying the payment of public-
1 All these figures remain approximate because of continuing uncertainty about factors such as the quality of data collection and the assumptions about the shadow economy (still officially estimated to be around 40 per cent of GDP).

SUMMARY AND ECONOMIC REPORT
6 GEORGIAN ECONOMIC TRENDS – 1998 No.3
sector salaries). The need to clear the backlog has created major financial problems for the government in the second half of the year. MONEY AND FINANCE EXCHANGE RATE: From a rate of 1.30 GEL/USD in late 1997, the GEL depreciated steadily against the dollar to around 1.35 GEL/USD in June, and remained at that level for most of the summer. The fall in the GEL's value is now understood to reflect the Central Bank’s exchange rate policy of keeping the GEL in an unspecified target range rather than fixing the rate rigidly to the USD. As the GEL (in line with the dollar) has appreciated against most other currencies, the fall against the dollar itself is unlikely to lead to inflation – the world market price of most European and Asian imports has fallen slightly. In September a speculative weekend attack on the GEL pushed its value down to 1.80 per USD, but this was reversed when the financial markets reopened. At the start of October the GEL’s value stood at about 1.36 per USD. INFLATION: The annual inflation rate (CPI compared with 12 months earlier) has fallen back after its recent peak of 7.3 per cent (December 1997) falling to 2.8 per cent in June. Goods price inflation is low, reflecting the stability both of the exchange rate and of world market prices. Services price inflation is higher, reflecting the growth of the economy: it is normal for services to become more expensive when general living standards rise. Fundamentally, this picture is not expected to change significantly unless there is substantial devaluation of the GEL. INTEREST RATES: The Treasury Bills market, which was established in August 1997, continued to develop with Georgian and foreign banks participating in the auctions. The volume of liquidity supplied on the T-Bills market increased significantly thanks to the larger number of participants. However growing uncertainty in August (related to the Russian crisis and also to Georgia’s own fiscal problems) forced the government to scale back its issue of T-Bills; sales seem to have been effectively suspended since mid-September. BANKING: The NBG is continuing to tighten up its regulation of the commercial banks, although the number of banks seems to have stabilised at around 50. 1998 has seen the award of a licence to the Black Sea Bank (in which the EBRD and Bank of Greece both have stakes), and the Turkish bank Emlak Bankasi opened a branch in Tbilisi in March 1998. INFRASTRUCTURE AND REGIONAL DEVELOPMENT INFRASTRUCTURE: The most important event in recent months was the Traceca conference held in Baku in September. The key development was the signature by 12 south-east European and Caspian countries of agreements to develop transport infrastructure and to streamline rules and procedures affecting transit along the “Silk Road” route between Europe and Asia. REGIONAL DEVELOPMENT: Recent studies seem to confirm the impression that the strongest growth is in Tbilisi and the south-east, with the highest levels of registered unemployment in industrial regions. INTERNATIONAL TRADE WTO ACCESSION: In March the first meeting of the working group on Georgia's accession agreed a preliminary scheme of action under which it might be possible for Georgia to accede to the WTO in 1999. The second working group in October 1998 concluded negotiations over trade in services. However Georgia is still pushing for relatively high bound tariffs on a few agricultural products (notably wheat), and there is a small risk that negotiations over these could delay Georgia’s accession. In

SUMMARY AND ECONOMIC REPORT
GEORGIAN ECONOMIC TRENDS – 1998 No.3 7
addition the legislative framework still needs to be strengthened further, with particular regard to trademarks, the protection of intellectual property, and government procurement. EXPORTS: Most of Georgia’s exports still go to its neighbouring countries, indicating the importance of proximity and of good transport links to Georgian exporters. The recorded statistics indicate little or no increase in Georgia's volume of exports to these markets, but there is significant growth in exports to more distant markets (the EU, Switzerland and the USA). In terms of the product mix, Georgia's underlying export performance also seems to be improving as exports from growth industries such as drinks and transport engineering (where Georgia appears to enjoy comparative advantages) become more important, offsetting falls in the exports of declining industries (which in any case the state can not afford to subsidise). This healthier composition of exports should lead to steady export growth in the future. IMPORTS: Georgia is continuing to import heavily from a large number of countries. Neighbouring countries all have significant shares of the Georgian market, a considerable share of imports (nearly half in 1998 Q1) also comes from south-east Europe, the European Union, the United States and Switzerland. U.S. data indicates that most American exports to Georgia are of chemicals and related products (SITC5) and machinery and transport equipment (SITC7), although exports of food and live animals (SITC1) are still important. PRIVATISATION AND PRODUCTION PROGRESS ON PRIVATISATION: Privatisation has made real progress in 1998, with the state selling its majority shareholdings in several major enterprises. There are also good signs of progress towards privatisation of the electricity sector. Two major privatisations may need to be aborted and repeated because of problems in finalising the sales, but these are both fairly unusual cases. Privatisation receipts in 1997 H1 were twice as high as expected. CAVEATS CONCERNING PRIVATISATION: In some cases the "privatisation" of an enterprise represents only a temporary transfer of the shareholding (typically for a ten-year period) and what happens when temporary transfers expire is unclear. Many of the direct sales are also subject to various commercial conditions concerning the levels of investment and employment, most of which are unnecessarily prescriptive and reduce the commercial value of enterprises. Nevertheless, the conditions set have not prevented deals of this nature from being concluded. INVESTMENT AND PRODUCTION: Despite the strong recovery (real growth of about 11 per cent) in the last two and a half years, GDP is still only around a third of what it was in the mid-1980s. Considering that an officially-estimated 45 per cent of industrial enterprises were idle in March 1998, and that agricultural yields are still very low, there still seems to be enough slack in the economy sustain the present strong growth in production. There are plenty of signs that systematic improvements are leading to more effective use of existing resources: these include the progress being made in industrial restructuring and privatisation, the wider availability of credit (and technical assistance) to farmers, and growing domestic competition in transport and communications. As expected, industrial output - which was hit badly by fuel shortages in 1998 Q1 - seems to have been much stronger in subsequent months. BUSINESS CONDITIONS: Arguably the most serious constraint on long-term development is the administrative burden - in particular the implementation of the over-complicated tax system - on small-scale entrepreneurs. The introduction in 1997 of the new Tax Code did not make the system of tax
SUMMARY AND ECONOMIC REPORT
8 GEORGIAN ECONOMIC TRENDS – 1998 No.3
collection more user-friendly for ordinary people, and continuing fears of heavy-handed and officious administration by tax inspectors are continuing to deter many entrepreneurs from joining the formal economy. As a result, many small-scale entrepreneurs prefer to develop their businesses in the shadow economy (or to seek alternative employment). This leads not only to low tax revenues for the state, but also disqualifies small-scale entrepreneurs from the credit lines that donors are trying to make available to SMEs.

CHAPTER TWO: NATIONAL ACCOUNTS AND ECONOMIC STABILITY
GEORGIAN ECONOMIC TRENDS – 1998 No.3 9
This chapter reviews official estimates of Georgia’s key macroeconomic indicators (GDP growth, the current and capital accounts, inflation and employment, and debt) and then interprets them in relation to the stability of the Georgian economy. The underlying factors that determine the longer-term trend in the key variables are discussed in various other chapters of GET. KEY MACROECONOMIC INDICATORS Economic Growth The strong trend in economic growth seems to have continued in the first half of 1998. 1998 H1 GDP is recorded as being only 8.9 per cent higher in real terms than in 1997 H1. However, on balance the underlying trend in recorded real output seems likely to remain at around 11 per cent. Output in 1998 H1 is estimated to be GEL 2.92 billion – equivalent to monthly income of about USD 70 per capita.1 Officially-estimated real GDP growth in the first quarter was 11.2 per cent higher than in 1997 Q1, and the SDS’ end-June report states that output accelerated in the second quarter. Thus, although the headline real growth figure for 1998 H1 was only 8.9 per cent, this apparent decline in growth was due to a major (and unexplained) upward revision of 1997 H1’s output.2 The IMF’s estimates for Georgian growth are in the same range, with real growth projected to be 10 per cent in 1998. Table 2.1: GDP, GNP and National Income 1995-1997 (GEL millions, current prices)
1995 1996 1997 Gross Domestic Product 3,694 5,300 6,431 Revenues from property abroad 5 7 89 Revenues transferred abroad 81 96 65 Gross National Product 3,617 5,211 6,455 Depreciation 413 616 750 Net National Income 3,204 4,596 5,705 Current transfers received from abroad 147 106 138 Current transfers sent abroad 0 0 4 National Disposable Income 3,351 4,701 5,839
Source: State Department for Statistics3 Because of continuing uncertainty about the production data, these figures should be treated as indicative rather than actual. Other evidence, including some of the recorded physical output data, seems more useful for assessing the underlying changes in the Georgian economy: this is done in the Production section of Chapter 7.
1 For seasonal reasons, output in the second half of the year tends to be considerably higher. 2 The methodology that the SDS uses for its calculation of GDP growth is still very different from that used in OECD countries – the 1998 Q1 edition of GET provided a fairly detailed discussion of some of the differences. However, the figures that the SDS arrives at seem plausible. 3 As provided in various SDS reports. The SDS’ revisions to its estimates of past GDP are difficult to keep track of, and these may not be the most recent estimates.

NATIONAL ACCOUNTS AND ECONOMIC STABILITY
10 GEORGIAN ECONOMIC TRENDS – 1998 No.3
Current Account The preliminary official figures for the balance of payments in 1997 and 1998 Q1 show that the trade deficit is widening: the official trade statistics for 1998 Q2 seem to confirm this and indicate that the rate of growth of imports may even be increasing: Figure 2.1: Balance of Trade in Goods 1995 Q1 –1998 Q2 (USD thousand per quarter)
-
50,000
100,000
150,000
200,000
250,000
300,000
350,000
97Q1 97Q2 97Q3 97Q4 98Q1 98Q2
ImportsExportsDeficit
Source: State Department for Statistics The performance of Georgia's exports is of much greater concern than the trade deficit itself - see Chapter 6. Factor income from abroad, mostly earnings of short-term Georgian workers abroad, is estimated to be USD 189 million, whilst outgoings related to transportation services and travel are estimated to be USD 316 million. The share of services in total visible and invisible trade turnover increased from 15 per cent in 1996 to 25 per cent in 1997, with 1997’s registered factor payments turnover representing 10 per cent of all current transactions, compared with 5 per cent in 1996. Table 2.2: Current account in terms of GDP 1994-1997 (Per cent of GDP)
1995 1996 1997 Imports -24.8 -15.1 -21.4 Exports 10.1 8.2 7.7 Trade Balance -14.7 -6.9 -13.7 Factor Services -2.1 -1.6 2.6 Non-factor Services 0.2 0.1 -3.0 Transfers 4.0 1.9 4.0 Current Account -12.7 -6.5 -10.1
Source: State Department for Statistics - 1998 Q1 data. Capital and Financial Accounts The SDS now records estimates of portfolio investment in the Balance of Payments: USD 2.4 million of T-bills were held by foreigners at the end of 1997, with interest payments on T-bills included in the factor services account.

NATIONAL ACCOUNTS AND ECONOMIC STABILITY
GEORGIAN ECONOMIC TRENDS – 1998 No.3 11
An ongoing survey of foreign investors' activities has led to further upward revisions of the Foreign Direct Investment estimates, which were recorded as USD 242 million for 19974. Expectations for 1998 are very high, with the survey recording USD 81 million in 1998 Q1. Whilst there have been relatively few new foreign investors in Georgia, the privatisation of medium-sized and large enterprises has attracted several foreign buyers – see the Privatisation section of Chapter 7. In addition the foreign companies that have already made the biggest investments in Georgia are re-investing heavily. This pattern is basically encouraging for the longer term outlook, as "success stories" are likely to be the most effective way of promoting Georgia as an investment location. Inflation and Employment Consumer prices in June were recorded as being only 2.8 per cent higher than 12 months beforehand. This represents an impressive decrease in the 12-month rate from its recent peak of nearly 8 per cent in December 1997. The 12-month rate is likely to rise somewhat in the second half of the year, as the temporary fall in the exchange rate in September led many traders to mark up their prices and because of the 33 per cent rise in electricity tariffs. Estimates of employment and unemployment vary enormously according to the definitions used – see Chapter 8. However, as far as economic stability is concerned, the key characteristic is that in practice there are many people – both skilled and un-skilled – who are interested in new jobs because they are either unemployed or severely under-employed. This should enable the economy to continue to grow strongly without raising unit labour costs. Foreign Debt By 1st April 1998 the state's total outstanding debts had reached USD 1.815 billion. The full breakdown is given in Table 2.3. Turkey: Debt to Turkey has now been restructured. Turkmenistan: The problem concerning debt to Turkmenistan remains unresolved, with Georgia defaulting on its quarterly principal payments of USD 20 million which became payable in 1998 Q1. European Union: There is a problem concerning the payment of arrears to the EU. The EU was going to issue a ECU 55 million grant to be distributed over several years to help Georgia repay EU debt, but Georgia needed to find additional USD 6 million to finalise this. The finalisation of this agreement still seems to be in doubt because it is conditional on the Government meeting several targets which were set as conditions of the IMF’s Enhanced Structural Adjustment Facility loan: as discussed below, many of these conditions have not been met.
4 The 1997 FDI data is as provided in 1998 Q1 and may have been revised since.

NATIONAL ACCOUNTS AND ECONOMIC STABILITY
12 GEORGIAN ECONOMIC TRENDS – 1998 No.3
Table 2.3: Credits Contracted and Credits Disbursed by Creditor as of March 31, 1998 (USD million)
Creditor Total Credit Credit Disbursed
% of total
Turkmenistan 393.6 393.6 21.7 WB 352.8 233.8 19.4 IMF 252.9 252.9 13.9 EU 240.6 122.1 13.3 Russia 179.3 179.3 9.9 Austria 83.2 83.2 4.6 Turkey 54.3 54.3 3.0 Germany 51.4 34.5 2.8 EBRD 41.1 22.1 2.3 OECF* 40.3 0.0 2.2 USA 35.0 19.9 1.9 Kazakhstan 27.8 27.8 1.5 Armenia 19.6 19.6 1.1 Azerbaijan 16.2 16.2 0.9 Iran 12.8 12.8 0.7 IFAD 6.3 0.5 0.3 China 3.1 3.1 0.2 Uzbekistan 1.0 1.0 0.1 Ukraine 0.9 0.9 0.1 ATC** 2.5 2.5 0.1 Total 1,814.7 1,343.0 100.0
Source: Ministry of Finance *Japanese Overseas Economic Cooperation Fund ** Guarantee for USA Air-Traffic Control credit Armenia: Negotiations are underway on clearing Armenia’s liabilities to Georgian energy enterprises against Georgia’s state debt to Armenia; the sums concerned are roughly equal. Table 2.4: Foreign Debt Ratios (Per cent)
1995 1996 1997 Foreign debt / Exports 8.3 7.2 7.1 Foreign debt service / Exports 1.1 24.4 46.0 Foreign debt / GDP 44.0 34.0 33.0
Source: State Department for Statistics - 1998 Q1 data. ECONOMIC STABILITY Relations with the International Monetary Fund The IMF agreed to release the first tranche of a USD 74 million ESAF loan in July 1998. However, the Government’s failure to meet many of the conditions of this loan threatens to delay the release of the second tranche of the ESAF loan (which was originally scheduled for late 1998). Most, but not all, of the targets missed are interdependent: in other words, failure to meet some targets led to the failure to meet others. It appears that the Government found itself in a vicious circle and that its position has been deteriorating ever since. The failure to fulfil the conditions attached to the loan has been compounded by bad luck (notably the impact of the Russian crisis on confidence in Georgia). However it is clear that the problem began quite early in 1998 with poor collection of tax revenues – specifically, major shortfalls in revenue from excise duties and VAT on domestic production. These lower-than-expected revenues were too big to be offset by the positive impact on government finance of unexpectedly high privatisation receipts. The lack of government income forced the government to borrow excessively from the central bank. Despite this borrowing it also had to cut back on expenditure which led to other targets being missed –

NATIONAL ACCOUNTS AND ECONOMIC STABILITY
GEORGIAN ECONOMIC TRENDS – 1998 No.3 13
these include the failure to meet the minimum agreed level of health spending, and the accumulation rather than reduction in expenditure arrears (notably the backlog in the payment of salaries). June and July also saw the sale of an excessive number of T-Bills, which undermined Georgia’s financial credibility. In July the IMF approved the ESAF loan, but then bad luck struck with the impact of the Russian crisis: many people began to worry that Georgia would suffer a similar fate, and began to withdraw savings from bank deposits. As discussed below, there was a run on the GEL in early September but the central bank was able to use intervention to restore the exchange rate to its target level. However, this seems to have caused the central bank’s targets (concerning international reserves) to be missed. Apart from these interdependent targets being missed, a number of separate conditions have been violated. The Government decided to reduce the size of the Large Taxpayers’ Unit instead of increasing it as had been planned: this decision (apparently taken for internal political reasons) might not have mattered if enough tax revenue targets had been collected, but as things turned out it was evidently a big mistake. Tax arrears, which were supposed to fall, instead accumulated – this suggested lower efficiency in the system of tax collection. The Government also fell behind schedule with the implementation of its plan to introduce a new system of excise stamps for cigarettes, which has now been officially delayed by 5 months. With so many targets having been missed, it is most unlikely that the IMF’s strict internal procedures will permit it to release the second tranche of the ESAF loan before January 1999 at the earliest. Consequently it appears that the only way that the government finances can be stabilised in the meantime is through a major short-term improvement in tax revenue collection. In early October the President established a Commission, headed by the new State Minister, which is required to meet at least twice a week to “implement urgent measures to increase tax revenues of the budget and present proposals if necessary”. If successful this would enable Georgia to break out of the vicious circle, as it would have the additional benefit of meeting many of the conditions for the release of the second tranche. If unsuccessful, a further delay in the release of the tranche would seem inevitable; in that case the situation would be likely to deteriorate further. The measures that are most likely to work include the early adoption of tax changes to which Georgia is likely to have to adopt in the longer term anyway. These include the introduction of excise duty on petroleum products, heavier taxation of agriculture5, and the application of tariffs to trade in natural gas and electricity. The reduction of tax arrears would not only be directly beneficial to the budget, but would also meet one of the ESAF loan conditions. As discussed in Chapter 3, the adoption of an appropriate 1999 Budget will also be crucial as Georgia need to take specific measures restore international confidence in its commitment to fiscal reform. Parallels and differences between Russia and Georgia On 17-18 August 1998 the Russian government was forced to abandon its policy of maintaining the RUR's value against other currencies. The Russian crisis is seen by most economists as being part of a general currency crisis that so far has affected countries in south-east Asia and more recently has threatened the macroeconomic stability of countries in other regions, most notably Latin America. However, macroeconomic conditions in Georgia and most other countries along the "Silk Road”
5 The IMF has been pressing for VAT to be levied on agricultural goods. However, bearing in mind the poor operation of Georgia’s domestic VAT system, alternative measures such as an increase in land tax might be easier to implement.

NATIONAL ACCOUNTS AND ECONOMIC STABILITY
14 GEORGIAN ECONOMIC TRENDS – 1998 No.3
corridor have remained quite stable. This is largely thanks to structural differences between the various economies concerned, as well as because of their improving fiscal discipline6. The consumer imports equation described in Box 2.1 is a useful way of looking at currency stability in an emerging open market economy, because a currency crisis is normally the result of a major imbalance between consumer imports and the items on the right-hand side of the equation. Such an imbalance tends to be eliminated by an exchange rate adjustment which forces the demand for consumer imports to change: either by making imports cheaper if their level is too low or (more usually) by making them more expensive if their level is too high7. In Russia, the most important items on the right-hand side of the consumer imports equation are exports (notably energy exports) and the budget deficit (which was financed by the IMF and by sales of T-bills). One cause of instability was the fall in world energy prices, which cut Xp sharply. The large budget deficit and the government's inability to increase tax revenue were also important factors: they reduced monetary transfers from abroad because foreign investors lost confidence in Russian T-bills and therefore bought fewer of them. Consequently the level of consumer imports became unsustainable: when transfers from the IMF proved to be inadequate, the devaluation of the RUR became inevitable. More generally, emerging markets that have large budget deficits and whose exports depend on commodities such as energy or raw materials tend to be macroeconomically unstable. (Commodity prices are generally much less stable than prices of manufactured goods.) In Georgia, as in Russia, consumer imports are in part sustained as a result of IMF transfers (A); however in Georgia's case the items on the right-hand side of the equation are much more stable. As discussed in Chapter 5, Georgia's own-produced exports (Xp) seem to be quite diverse and are therefore unlikely to fall suddenly. Value-added through transit {Xx - Mx} is a stable item and is significant because of Georgia's location on the Silk Road. The item {I - Mi - S} is unlikely to fall dramatically unless the investment climate changes dramatically. This leaves the budget deficit {G - T}, which has been small in recent years because the government has systematically linked its expenditure to the collection of tax revenue. However, uncertainty about the deficit caused problems for Georgia in the second half of 1998 because of fears that the Ministry of Finance would allow expenditure to grow faster than revenue and would then have no choice but to adopt an austerity programme which would almost inevitably involve devaluation. Box 2.1
CURRENCY CRISES IN EMERGING MARKETS A currency crisis is likely to occur in any country if the government mismanage its finances (usually by running an unsustainably large budget deficit). Equally, some economic changes are so great that they make a currency crisis practically unavoidable - the collapse of the Soviet Union is an example. However, some economies are more sensitive to economic changes than others are. This is not simply a question of macroeconomic management, but also of economic structure. Currencies in "emerging markets" (transition countries and the more advanced developing countries) seem to be more sensitive to economic shocks compared with long-established market economies and the least developed countries. But emerging markets do not all have similar economic structures: this is the key to 6 At about 2 per cent of GDP, Georgia’s budget deficit is comparable to that of other countries in the region; in contrast, Russia’s budget deficit in summer 1998 was about 7 per cent of GDP.

NATIONAL ACCOUNTS AND ECONOMIC STABILITY
GEORGIAN ECONOMIC TRENDS – 1998 No.3 15
understanding why some are more stable than others, and in particular why Georgia has not followed Russia into macroeconomic chaos. Basic economic algebra can be used to consider what the key structural factors are and why they matter. In any economy, total income can be expressed by an equation representing expenditure and by another representing output: Y = C + S + T - A (expenditure) Y = C + I + G + X - M (output) where Y is income, S is domestic savings, T is taxation, A is net monetary transfers from abroad, I is investment, G is government expenditure, X is exports and M is imports. It is also sometimes useful to separate total exports (X) into own-produced exports (Xp) and re-exports (Xx), and to separate total imports (M) into components representing imports that are for consumption (Mc), those that are for investment (Mi) and those that are re-exported (Mx); X = Xx + Xp and M = Mc + Mi + Mx. By introducing these terms and then manipulating the expenditure and output equations, it can be shown that: Mc = Xp + {Xx - Mx} + {G - T} + A + {I - Mi - S} (consumer imports) The interpretation of this equation is that consumer imports are equivalent to the sum of own-produced exports, value-added in transit, the budget deficit, net monetary transfers from abroad and foreign investment expenditure on domestic output. Restoring the value of the Georgian Lari In contrast to the Russian crisis (when the president and government promised not to devalue the RUR but were eventually left with no choice), the Georgian authorities were able to revalue the GEL in response to a mini-crisis in September. During the weekend of 5/6 September (when the central bank was closed), rumours of devaluation pushed the GEL to a street exchange rate of around 1.80 per USD. However, the central bank's relatively modest market intervention on 7 September was sufficient to restore the GEL exchange rate to its previous level of 1.35 per USD. In terms of the consumer imports equation, this intervention corresponded to a minor short-term increase in government expenditure (since it involved the central bank "buying" GEL) and thus had the short-term effect of restoring the equilibrium level of consumer imports through (what was, in effect) an increase in G. Although this demonstrated the GEL's structural security under present policies, it also showed how risky a change in policy would be: just as a modest reduction in the money supply was sufficient to stabilise the GEL, a correspondingly modest increase could have the opposite effect. Thus Georgia seems to have practically no scope for monetary loosening in the short term. Moreover, the scope for further monetary tightening is limited because too tight a monetary policy would undermine Georgia’s financial credibility. Therefore - assuming no major increase in exports, monetary transfers from abroad or foreign investment - the only ways that the consumer imports equation can be balanced in the medium term8 is by cutting the level of consumer imports. This demands either major increases in tax collection (in order to reduce consumer demand) or else a major (and destabilising) fall in the exchange rate.
7 Alternatively this can be achieved by raising tariffs on imports or by raising consumption taxes (such as VAT and excise duties) that affect consumer exports. 8 The medium term in this context is the next few quarters.

NATIONAL ACCOUNTS AND ECONOMIC STABILITY
16 GEORGIAN ECONOMIC TRENDS – 1998 No.3
In the longer term, however, the prospects for economic stability look much healthier: the underlying trend in government finances still seems to be towards a progressive reduction in the budget deficit9; infrastructural and commercial foreign investment would tend to strengthen the capital account, and it also seems realistic to expect that the current account would eventually be strengthened by major increases in oil production10.
9 See Chapter 3. 10 See also the Production section of Chapter 7 concerning oil: even if oil prices remain low, 300,000 barrels/day domestic production would strengthen the current account by around USD 1.500 million per year.

CHAPTER THREE: GOVERNMENT REVENUE AND EXPENDITURE
GEORGIAN ECONOMIC TRENDS – 1998 No.3 17
As explained in Chapter 2, the ineffective collection of tax revenue is one of the main threats to Georgia's continuing recovery and financial stability. In the second half of 1998 this has become a major issue. Although the budget deficit was reduced from 4.4 per cent in 1996 to 2 per cent of GDP in 1997, this was basically achieved by keeping expenditure very low. This meant very little public capital investment (resulting in the continued deterioration of much of the country's infrastructure) and tightly constrained payments of public employees’ salaries, which led to the accumulation of expenditure arrears, in violation of Georgia’s agreements with the IMF. The deficit was supposed to be reduced to about 1.8 per cent of GDP in 1998, but in the second half of 1998 this target seems to have been threatened by higher expenditure and by an apparent deterioration in the collection of excise duty and VAT. Issues relating to deficit financing are again covered elsewhere in this edition of GET: external debt is covered in Chapter 2, whilst the issue of Treasury bills is covered in Chapter 4. This chapter looks at the issues of revenue and expenditure; the focus of this issue of GET is mainly on revenue because a lot of new detailed information is already available concerning collection but relatively little on the details of expenditure. The chapter also discusses some of the key issues concerning the 1999 Budget, which is due to be debated in 1998 Q4. CONSOLIDATED TAX REVENUE Low government revenue collection remains the most pressing problem facing Georgia's public finance. From April 1998 onwards disturbing reports began to appear in the Georgian press about “catastrophic” shortfalls in tax collection1. The fiscal data for the first six months of 1998 indicates that total tax revenue in 1998 Q2 was 17 per cent higher in nominal terms than in the corresponding period of 1997. This represented a slowdown compared with 1997 (when, according to GET’s database, annual revenue was 58 per cent higher than in the previous year). Taking into account the Government’s and donors’ concerted efforts to improve methods of revenue collection, this slowdown could be considered disappointing. Nevertheless the 17 per cent rise in tax revenues was still a couple of percentage points higher than nominal GDP growth; as Chart 3.1 shows, revenue collection in 1998 H1 seems to have remained on an upward trend after allowing for the seasonal fall in activity between the fourth and first quarters. As the chart also shows, consolidated government income (excluding the Special State Funds, whose revenue is predicated) fell slightly during the second quarter, from GEL 165 million to GEL 157 million. This fall is explained by the drop in fees and non-tax income. A general pattern seems to be emerging this year: most revenue targets (including those for income tax, profits tax and customs) are being met or even exceeded but those for VAT and excise duty are being missed by wide margins. As VAT and excise duty are two of the most important sources of revenue, the result is that total revenue is well below target. In the first half of 1998, VAT and excise 1 For example, figures reported in the 24 April - 1 May issue of Georgian Business News indicated that the State Customs Department and State Tax Service had between them transferred only GEL 15.2 million to the Treasury compared with the planned GEL 36 million for April.

GOVERNMENT REVENUE AND EXPENDITURE
18 GEORGIAN ECONOMIC TRENDS – 1998 No.3
duty were planned to provide about three-quarters of the State’s tax revenue but in fact provided less than two-thirds: consequently its total tax revenue was some 18 per cent below target. Figure 3.1: Consolidated revenue and expenditure, 1996 Q1 to 1998 Q22 (GEL thousand per quarter)
0
50000
100000
150000
200000
250000
300000
96Q 2 97Q 2 98Q 2
C apita l receiptsTaxes on importsTaxes on businessIncome taxExpenditureC onsolidated income
Source: Ministry of Finance Note: revenue and expenditure from the Special State Funds is not included in this chart and is discussed in Chapter 8. THE EFFECTIVENESS OF TAX COLLECTION For most taxes, data on revenue in the second quarter of 1998 may be compared with the trend in 1996-97. The easiest historical comparison is with 1997 Q2: assuming that real output has grown by about 11 per cent and that 1998 Q2 prices were on average 4 per cent higher than in 1997 Q2, the increase in revenue should generally be more than 15 per cent in nominal terms if collection rates are improving. Evidence from the first quarter of 1998 also enables us to make a preliminary assessment of tax collection by local authorities in comparison with their planned revenue targets. 1. Personal income tax For Georgia as a whole, income tax collection in the first half of 1998 was GEL 39 million. This includes income tax revenue allocated to the central budget, which was GEL 16 million (8 per cent above target) and GEL 23 million retained by the local authorities (11 per cent below the aggregated regional targets). The aggregate shortfall for local authorities reflects large shortfalls in the more industrial regions of Georgia: most rural districts exceeded their targets. Considering that income tax revenue is still partly a reflection of salary-payments to public-sector employees, this regional pattern may indicate that there have been efforts to ensure salary-payments to public-sector employees in rural regions. Alternatively rural targets may have been set lower in anticipation of non-payment which has apparently been a particular problem for rural employees in the past. In either case, it seems unlikely that the regional pattern reflects an increase in revenue from the taxation of private incomes
2 Taxes on business include domestic VAT and excise duty, and regionally-retained taxes. Taxes on imports include VAT and excise duty. Contributions to the Special State Funds are excluded from this data.

GOVERNMENT REVENUE AND EXPENDITURE
GEORGIAN ECONOMIC TRENDS – 1998 No.3 19
(which tend to be very low in rural areas: it is in Georgia’s urban areas that incomes tend to be highest and economic growth tends to be strongest). Figure 3.2: Personal income tax revenue, 1996 Q1 to 1998 Q2 (GEL thousand per quarter)
0
5000
10000
15000
20000
25000
96Q2 97Q2 98Q2
LocalState
Source: Ministry of Finance As Chart 3.2 shows, the collection of income tax has been rising steadily though with seasonal variations. Revenue in Q2 was 22 per cent higher in nominal terms than in the corresponding period in 1997 - comfortably above the 15 per cent "benchmark" mentioned above. Therefore the underlying trend continues to look satisfactory. 2. Corporate Profit Tax The application of profit tax rules and allowances tends to be especially arbitrary because accounting rules remain unclear and there is widespread distrust between tax collectors and taxpayers. Tax collectors tend not to trust the figures that business managers present them with, and few business managers trust tax collectors to implement the system correctly. Overall profit tax collection in the first half of 1998 was GEL 22 million. As Chart 3.3 shows, the collection of profit tax has been increasing rather slowly. However, consolidated profit tax revenue in Q2 was 21 per cent higher in nominal terms than in 1997 Q2: this indicates some improvement in collection rates, which might reflect the impact of technical assistance aimed at improving the system of business taxation. However, there still seems to be a long way to go in establishing a reasonable degree of mutual trust between taxpayers and the STS.

GOVERNMENT REVENUE AND EXPENDITURE
20 GEORGIAN ECONOMIC TRENDS – 1998 No.3
Figure 3.3: Profit Tax Revenue (GEL thousand per quarter)
0
5000
10000
15000
20000
25000
96Q2 97Q2 98Q2
LocalState
Source: Ministry of Finance As with income tax, the central target was exceeded by 8 per cent, whilst the aggregated regional revenue targets were 5 per cent below target. Again there were significant regional differences: Tbilisi and Achara both exceeded their targets, but revenue was much lower than planned in almost every other region. As far as local authorities are concerned, the incentive for collecting profit tax is the same as for income tax - in both cases 60 per cent of revenue is retained locally with the remainder transferred to the state budget. However, whereas most authorities met their income tax targets, almost every administrative district’s revenue collection was below the target set; this suggests that the regional profit tax targets may have been unrealistic. 3. Value-Added Tax VAT is the most important tax in Georgia, providing around 40 per cent of consolidated tax revenue. The total amount of VAT revenue collected in 1998 Q2 was about 17 per cent higher in nominal terms than in 1997 Q2. However this figure masks major differences between the respective collections of VAT on imports and VAT on domestic production. Revenue from VAT on imports is on a strong upward trend, albeit below target. However revenue from VAT on domestic goods and services is actually dropping; as Chart 3.4 shows, it has now fallen below that of VAT on imports.

GOVERNMENT REVENUE AND EXPENDITURE
GEORGIAN ECONOMIC TRENDS – 1998 No.3 21
Figure 3.4: VAT revenue – imports and domestic (GEL thousand per quarter)
0
10000
20000
30000
40000
50000
60000
70000
96Q2 97Q2 98Q2
DomesticOn ImportsTotal VAT
Source: Ministry of Finance In most regions of Georgia all the VAT revenue collected is transferred to the central budget, giving local authorities little incentive to collect it. The two exceptions are Achara, which now retains 99 per cent of the VAT it collects from imports, and Tbilisi, which is now entitled to retain 15 per cent of VAT on domestic goods and services. The consolidated revenue from VAT on imports was slightly below target, with a surfeit of more than GEL 4 million in Achara not quite large enough to offset general shortfalls elsewhere. It is unclear why VAT on domestic goods and services is actually dropping, or why (outside Achara) the revenue target for VAT on imports was also missed. VAT is one of the taxes where technical assistance is evidently needed to improve the effectiveness of the system, and the advice that has been given does not yet seem to have resulted in any improvements. 4. Customs duty Revenue from customs duty continued to grow strongly, with 1998 Q2's figure 41% higher than that of 1997 Q2. A concerted effort has been underway over the past year to improve collection rates by the Customs Department, with the World Bank providing technical assistance to help push through organisational reform.

GOVERNMENT REVENUE AND EXPENDITURE
22 GEORGIAN ECONOMIC TRENDS – 1998 No.3
Figure 3.5: Customs Revenue (GEL thousand per quarter)
0
5000
10000
15000
20000
25000
96q1 97q1 98q1
LocalState
Source: Ministry of Finance 5. Excise duty In strong contrast to Customs duty, the revenue from Excise duty has been much lower than planned over the last 3 quarters and was some 30 per cent lower in nominal terms in 1998 Q2 than in 1997 Q2. The initial impression given by Chart 3.6 is that the relatively high levels of revenue collected in 1997 Q2 and 1997 Q3 were aberrations. However there is no practical reason why this should be so: with living standards rising in Georgia, the consumption of goods that are liable for Excise duty (notably alcohol and tobacco) would be expected to increase; this should have led to an increase in Excise revenue. The small amount of available data on alcohol and tobacco imports in the first quarter seems to confirm this: the US-Georgia bilateral statistics presented in the 1998 Q1 issue of GET show a marked rise in US exports of beverages and tobacco to Georgia. Figure 3.6: Excise Revenue (GEL thousand per quarter)
0
5000
10000
15000
20000
25000
96Q2 97Q2 98Q2
Excise duty on domestic suppliesExcise duty on imports
Source: Ministry of Finance

GOVERNMENT REVENUE AND EXPENDITURE
GEORGIAN ECONOMIC TRENDS – 1998 No.3 23
The Government is now planning to introduce a new system of excise stamps to discourage smuggling; its implementation has been scheduled for 1998 Q4. COLLECTION OF REGIONAL TAXES Revenue from the regional taxes was about 8 per cent below target. In aggregate, the revenue from two of the three most important taxes (property tax and local tax) was on target. However, revenue from land tax and from the less important taxes was generally quite a long way below target. As in Q1 there were major regional variations; no district seems to be capable of meeting all of its revenue targets. Figure 3.7: Collection of the regional taxes in 1998 H1 (GEL thousand)
0
2000
4000
6000
8000
10000
12000
Land tax Naturalresources tax
Pollution tax Property tax Propertytransfer tax
Local tax
PlanOutcome
Source: Ministry of Finance a. Land tax As in Q1, Samegrelo and Zemo Svaneti’s collection of land tax revenue was above target; Imereti (whose collection was well below target in Q1) also met its target for H1.

GOVERNMENT REVENUE AND EXPENDITURE
24 GEORGIAN ECONOMIC TRENDS – 1998 No.3
Figure 3.8: Regional collection of land tax (GEL thousand per quarter)
0
500
1000
1500
2000
2500
Abkh
azia
Ajar
a
Tbilis
i
Kakh
eti
Imer
eti
Sam
egre
lo
Shid
a Ka
rtli
Kvem
o Ka
rtli
Gur
ia
Java
khet
i
Mts
khet
a
Rac
ha
PlanOutcome
Source: Ministry of Finance However, the rest of the regions were all below their revenue targets; this included Tbilisi, which had been above its target in Q1. In aggregate, land tax revenue was 9 per cent below target. b. Natural resources tax Collection of natural resources tax revenue remains a long way below target in the regions where most of it was expected to be collected. As in Q1, revenue targets were exceeded in the smaller regions of Guria, Samtskhe-Javakheti and Racha-Lechkhumi. Figure 3.9: Regional collection of natural resources tax (GEL thousand)
0
100
200
300
400
500
600
700
800
900
1000
Abkh
azia
Ajar
a
Tbilis
i
Kakh
eti
Imer
eti
Sam
egre
lo
Shid
a Ka
rtli
Kvem
o Ka
rtli
Gur
ia
Java
khet
i
Mts
khet
a
Rac
ha
P lanO utcom e
Source: Ministry of Finance
GOVERNMENT REVENUE AND EXPENDITURE
GEORGIAN ECONOMIC TRENDS – 1998 No.3 25
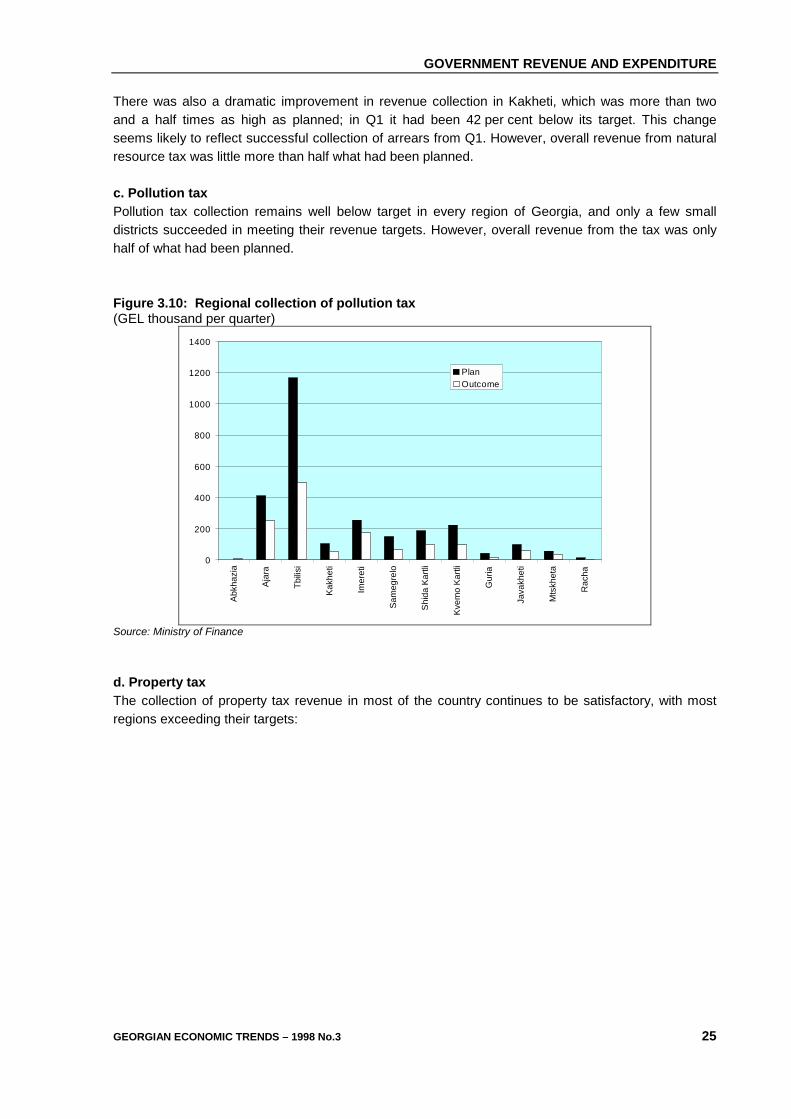
There was also a dramatic improvement in revenue collection in Kakheti, which was more than two and a half times as high as planned; in Q1 it had been 42 per cent below its target. This change seems likely to reflect successful collection of arrears from Q1. However, overall revenue from natural resource tax was little more than half what had been planned. c. Pollution tax Pollution tax collection remains well below target in every region of Georgia, and only a few small districts succeeded in meeting their revenue targets. However, overall revenue from the tax was only half of what had been planned. Figure 3.10: Regional collection of pollution tax (GEL thousand per quarter)
0
200
400
600
800
1000
1200
1400
Abkh
azia
Ajar
a
Tbilis
i
Kakh
eti
Imer
eti
Sam
egre
lo
Shid
a Ka
rtli
Kvem
o Ka
rtli
Gur
ia
Java
khet
i
Mts
khet
a
Rac
ha
PlanOutcome
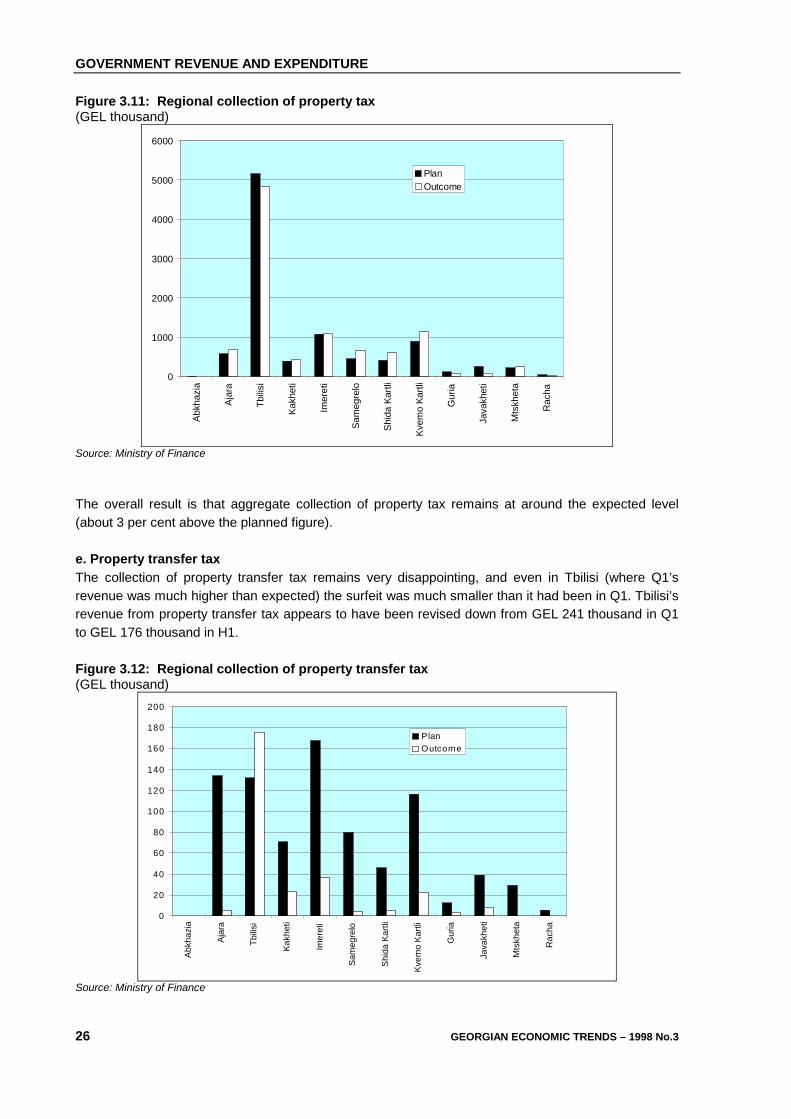
Source: Ministry of Finance d. Property tax The collection of property tax revenue in most of the country continues to be satisfactory, with most regions exceeding their targets:
GOVERNMENT REVENUE AND EXPENDITURE
26 GEORGIAN ECONOMIC TRENDS – 1998 No.3
Figure 3.11: Regional collection of property tax (GEL thousand)
0
1000
2000
3000
4000
5000
6000
Abkh
azia
Ajar
a
Tbilis
i
Kakh
eti
Imer
eti
Sam
egre
lo
Shid
a Ka
rtli
Kvem
o Ka
rtli
Gur
ia
Java
khet
i
Mts
khet
a
Rac
ha
PlanOutcome
Source: Ministry of Finance The overall result is that aggregate collection of property tax remains at around the expected level (about 3 per cent above the planned figure). e. Property transfer tax The collection of property transfer tax remains very disappointing, and even in Tbilisi (where Q1’s revenue was much higher than expected) the surfeit was much smaller than it had been in Q1. Tbilisi’s revenue from property transfer tax appears to have been revised down from GEL 241 thousand in Q1 to GEL 176 thousand in H1. Figure 3.12: Regional collection of property transfer tax (GEL thousand)
0
20
40
60
80
100
120
140
160
180
200
Abkh
azia
Ajar
a
Tbilis
i
Kakh
eti
Imer
eti
Sam
egre
lo
Shid
a Ka
rtli
Kvem
o Ka
rtli
Gur
ia
Java
khet
i
Mts
khet
a
Rac
ha
P lanOutcome
Source: Ministry of Finance
GOVERNMENT REVENUE AND EXPENDITURE
GEORGIAN ECONOMIC TRENDS – 1998 No.3 27
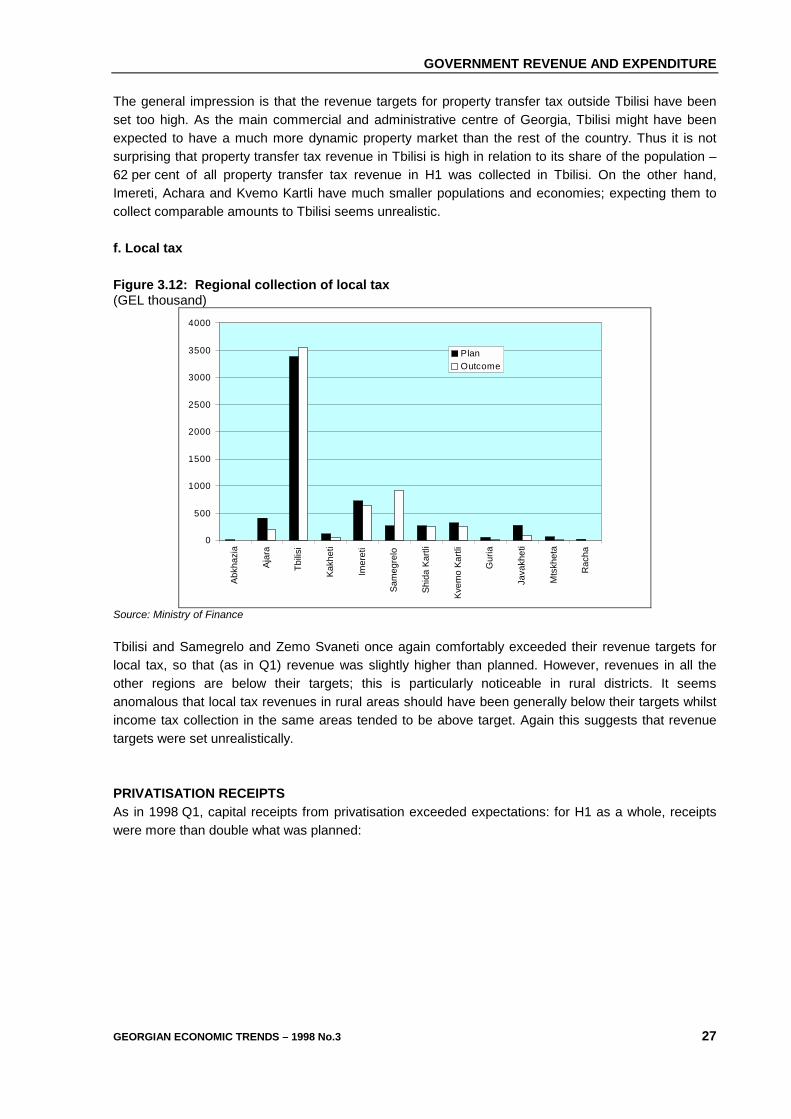
The general impression is that the revenue targets for property transfer tax outside Tbilisi have been set too high. As the main commercial and administrative centre of Georgia, Tbilisi might have been expected to have a much more dynamic property market than the rest of the country. Thus it is not surprising that property transfer tax revenue in Tbilisi is high in relation to its share of the population – 62 per cent of all property transfer tax revenue in H1 was collected in Tbilisi. On the other hand, Imereti, Achara and Kvemo Kartli have much smaller populations and economies; expecting them to collect comparable amounts to Tbilisi seems unrealistic. f. Local tax Figure 3.12: Regional collection of local tax (GEL thousand)
0
500
1000
1500
2000
2500
3000
3500
4000
Abkh
azia
Ajar
a
Tbilis
i
Kakh
eti
Imer
eti
Sam
egre
lo
Shid
a Ka
rtli
Kvem
o Ka
rtli
Gur
ia
Java
khet
i
Mts
khet
a
Rac
ha
PlanOutcome
Source: Ministry of Finance Tbilisi and Samegrelo and Zemo Svaneti once again comfortably exceeded their revenue targets for local tax, so that (as in Q1) revenue was slightly higher than planned. However, revenues in all the other regions are below their targets; this is particularly noticeable in rural districts. It seems anomalous that local tax revenues in rural areas should have been generally below their targets whilst income tax collection in the same areas tended to be above target. Again this suggests that revenue targets were set unrealistically. PRIVATISATION RECEIPTS As in 1998 Q1, capital receipts from privatisation exceeded expectations: for H1 as a whole, receipts were more than double what was planned:

GOVERNMENT REVENUE AND EXPENDITURE
28 GEORGIAN ECONOMIC TRENDS – 1998 No.3
Figure 3.13: Capital receipts (GEL thousand per quarter)
0
5000
10000
15000
20000
25000
96Q2 97Q2 98Q2
LocalState
Source: Ministry of Finance This is partly thanks to receipts from large privatisations, which seem to have brought windfalls to a small number of district authorities (notably Kvareli, Zestaphoni, Poti, Gori, Rustavi, Ozurgeti, Mtskheta and Ambrauli). However, the vast majority of districts also exceeded their planned receipts from privatisation: this suggests that the general pattern is also better than expected. OTHER GOVERNMENT RECEIPTS Fees and non-tax revenues fell back to their normal level in 1998 Q2. As in Q1, the state budget received no grants from donors. No grant income had been expected in Q2, but it appears that in Q1 the GEL 5.1 million that had been expected was in effect replaced by correspondingly higher net transfers to the budget from the central bank. This would have left less scope for central bank transfers in the rest of the year, resulting in recorded growth in the budget deficit in Q2. Figure 3.14: Quarterly Consolidated Miscellaneous Government Receipts (GEL thousand per quarter)
0
10000
20000
30000
40000
50000
60000
70000
96Q2 97Q2 98Q2
LocalState
Source: Ministry of Finance

GOVERNMENT REVENUE AND EXPENDITURE
GEORGIAN ECONOMIC TRENDS – 1998 No.3 29
Thus it seems that the relatively healthy appearance of the government finances in Q1 masked a continuing structural deficit, and that subsequent government finance figures will seem worse because it has become practically to use central bank transfers to conceal the structural deficit.3 On the other hand, the underlying trend in the income side of government finances does not seem to have changed significantly in the first half of the year: tax revenues were still growing steadily. THE DIVISION BETWEEN STATE AND LOCAL EXPENDITURE At just under GEL 162 million, actual expenditure under the central budget was only 1 per cent higher than in 1997 Q2 - in other words, about 3 per cent lower in real terms. However, higher spending by local authorities pushed up consolidated government expenditure in 1998 Q2 to GEL 227 million, compared with GEL 209 million in 1197 Q2 – an increase of 9 per cent. Figure 3.15: State and local expenditure (GEL thousand per quarter)
-
50,000
100,000
150,000
200,000
250,000
300,000
350,000
97Q1 98Q1
StateLocalTOTAL
Source: Ministry of Finance As government in Georgia becomes less centralised (with the first local authority elections due to take place in mid-November 1998), expenditure and revenue at the local level is increasing at a rate of about 30 per cent a year. Education and national economy together account for most of this rise. In some countries the decentralisation of expenditure can threaten to fiscal discipline, as local authorities accumulate deficits which must then be funded by central government. However, Georgia’s local government finance rules seem to be effective in ensuring balanced budgets: therefore the trend towards decentralisation of expenditure does not seem to pose a risk to the stability of government finances. The composition of local government expenditure by category of expenditure does not fluctuate much, either over time or between one region and another (though there is some local variation within some regions). Most local government expenditure is on education and items categorised as “national economy” which range from minor infrastructural investment to the employment of specialist professionals such as veterinary surgeons. 3 “Income from the central bank” in 1998Q1 (GEL 36 million) inflated the consolidated income figure for that quarter. The item is not listed separately in the Ministry of Finance’s data, but the aggregate figure for non-tax income items in Q2 was less than GEL 14 million which suggests that the central bank income item was very low.

GOVERNMENT REVENUE AND EXPENDITURE
30 GEORGIAN ECONOMIC TRENDS – 1998 No.3
CONSOLIDATED EXPENDITURE The apparent composition of consolidated expenditure is derived by adding together similar categories of expenditure in the public accounts of central and local government provides: Figure 3.16: Detailed composition of consolidated expenditure in 1998H1 (GEL thousand per quarter)
-
20,000
40,000
60,000
80,000
100,000
120,000
140,000
160,000
180,000
Education Administration Health Care Culture, Sportand Religion
Law and Order Social Security Defence Other
LocalState
Source: Ministry of Finance Consolidated expenditure on social services (law and order, education, health and cultural and sporting events) and on social security has stayed fairly constant over the past year. The main fluctuations have been in state expenditure on administration and in miscellaneous items of state expenditure (including public investment and debt servicing). Expenditure on social security and on health includes such items as central government "top-up" support for the United Social Security Fund, special centrally-funded programmes (such as assistance to disabled people) and local authority spending on social security including assistance to single mothers. As mentioned earlier, information about the Special State Funds is provided in Chapter 8. Figure 3.17: Changes in the composition of consolidated expenditure 1997 Q1 to 1998 Q2 (GEL thousand per quarter)
-
50,000
100,000
150,000
200,000
250,000
300,000
97Q1 98Q1
Administration & DefenceSocial ServicesSocial SecurityOther expenditure ex SSF
Source: Ministry of Finance

GOVERNMENT REVENUE AND EXPENDITURE
GEORGIAN ECONOMIC TRENDS – 1998 No.3 31
As happened in 1997, state expenditure on administration was kept low in the first half of this year; this helped to constrain the rise in overall expenditure. However, this seems to have once again been achieved by postponing the payment of salaries to public servants. Therefore, as in 1997, a major increase in expenditure on administration to pay back the arrears seems unavoidable: Figure 3.18: Changes in expenditure on administration 1997 Q1 to 1998 Q2 (GEL thousand per quarter)
-
10,000
20,000
30,000
40,000
50,000
60,000
70,000
97Q1 98Q1
LocalState
Source: Ministry of Finance Judging from the other expenditure patterns (not re-produced here) most of the expenditure arrears that were accumulated in 1998 H1 were in administration. Chart 3.18 provides a rough indication of likely expenditure requirements in the second half of the year: if it is to follow the same pattern as in 1997, administrative expenditure in 1998 H2 seems likely to be some GEL 70 million higher than in 1998 H1. THE 1999 BUDGET With consolidated government income apparently still growing steadily at an annual rate of around 20 per cent, and with consolidated expenditure growing at only about half that rate, the fiscal position seems to be sustainable in the long term. However in the short term, as Chapter 2 explains, the failure to meet projected tax revenue targets in 1998 has led Georgia to a situation where it is struggling to fund the budget deficit. As the deficit is relatively small, the high-level Commission that has been established has a fair chance of averting the potential crisis. This could also enable Georgia to meet many of the conditions attached to the planned release of the second tranche of IMF credit. In addition to its efforts to meet the conditions that are presently being violated, Georgia must avoid violating other conditions. Apparently an early draft Budget envisages the establishment of new tax exemptions, which would violate the conditions of the ESAF loan. In addition the Budget would need to address the issue of applying tariffs to trade in natural gas and electricity.

CHAPTER FOUR: MONEY AND FINANCE
32 GEORGIAN ECONOMIC TRENDS – 1998 No.3
The controlled depreciation of GEL continued in 1998 Q2, standing at GEL USD 1.3478 at the end of June 1998). The GEL’s nominal exchange rate against the US dollar depreciated by 3 per cent during 1998 H1 and was 4 per cent lower than in June 1997. Nevertheless, the nominal exchange rate remained an anchor for domestic inflation and the year-on-year inflation rate (2.8 per cent annual in June) was still one of the lowest in the CIS region. Despite the low rate of inflation, the coefficient of deposit dollarisation was still high (about 60 per cent) but did not increase in 1998 Q2. Direct financing of the State budget remained significant. The NBG issued GEL 81 million for the MoF in 1998 H1, compared the revised annual target of GEL 110 million. The budget deficit was also financed by T-Bills emissions, of which GEL 18.9 million were outstanding at the end of June 1998. The last 28-day T-Bills auction was held in April, so that the market consisted only of 91-day T-Bills. MONETARY DEVELOPMENTS Figure 4.1: Money Supply
0
5 0 ,0 0 0
1 0 0 ,0 0 0
1 5 0 ,0 0 0
2 0 0 ,0 0 0
2 5 0 ,0 0 0
3 0 0 ,0 0 0
3 5 0 ,0 0 0
4 0 0 ,0 0 0
D e c95
J a n96
F e b M a r A pr M a y J un J ul A ug S e p O c t N o v D e c J a n97
F e b M a r A pr M a y J un J ul A ug S e p O c t N o v D e c J a n F eb M a r A pr M a y J un
GEL
thou
sand
s
F o re ig n C urre nc y D e p o s itsG E L D e p o s its
C urre nc y O uts id e C o m m e rc ia l B an ks
M 3
M 2
M 0
Source: Data provided by the National Bank of Georgia The money supply did not grown significantly in 1998 H1, with M3 increasing by only GEL 14 million and cash outside commercial banks increasing by GEL 1 million. GEL deposits grew by 5 million, whilst deposits in foreign currency increased by GEL 28 million. With direct budget financing running at GEL 81 million (plus GEL 3 million spent from Government deposits), it was only the tight monetary policy that prevented a rise in the inflation rate.

MONEY AND FINANCE
GEORGIAN ECONOMIC TRENDS – 1998 No.3 33
CREDIT TO THE GOVERNMENT Table 4.1: Central Government Loans and Deposits with the Banking System (GEL thousands)
1997 1998Mar Jun Sep Dec Jan Feb Mar Apr May Jun
Net Claim s on Central Governm ent 305,682 362,403 409,350 403,701 413,586 424,005 434,758 445,550 455,993 480,767
Central Government Borrow ing from NBG 333,418 372,818 424,759 412,725 424,925 436,583 446,100 460,600 466,700 493,650
Central Government Deposits 27,736 10,416 15,410 12,803 14,265 15,636 14,530 15,050 10,708 12,883 Central Government Deposits at NBG in GEL 6,821 3,172 10,368 11,929 10,959 11,725 9,883 11,511 6,361 8,931 Other Government accounts liab ilities 295,237 800,341 1,022,499 1,473,257 91,987 200,898 387,170 507,640 609,045 760,591 Other Government accounts assets 288,416 797,169 1,012,132 1,461,328 81,028 189,173 377,287 496,129 602,684 751,661 Central Government Deposits at NBG in foreign currency 10,745 1,666 465 1,264 2,494 2,086 3,130 1,942 2,393 2,286 Central Government Deposits at commercial banks 10,169 5,578 4,577 -390 812 1,824 1,517 1,597 1,954 1,666
Source: Data provided by the National Bank of Georgia Because of the growing difficulties in government finance, direct deficit financing became a major problem in 1998 H1. The upper limit for 1998 on deficit financing by the NBG credit was increased from GEL 54 million to GEL 110 million, but in 1998 H1 alone the NBG issued GEL 81 million. Consequently the NBG was forced to focus its attention on financing the state budget, the expense of at other key functions (improving the regulation of the banking system, developing the money markets, and strengthening the foreign exchange policy). In principle, the priority of the NBG should be to support a workable banking system; instead, it had to spend a high proportion of its international reserves on sterilising money emission. GOVERNMENT TREASURY BILLS In addition to direct NBG credit, the budget deficit was financed by the issue of T-Bills. This was an alternative way of financing the budget deficit that should in the long term completely replace NBG credit. However, that remained difficult because of the lack of market development. Figure 4.2: 91-day T-Bills Yields and Rate
0.00%
10.00%
20.00%
30.00%
40.00%
50.00%
60.00%
11/6/
97
11/13/9
7
11/20
/97
11/27
/97
12/4/
97
12/11
/97
12/18
/97
12/25
/971/1
/981/8
/98
1/15/9
8
1/22/9
8
1/29/9
82/5
/98
2/12/9
8
2/19/9
8
2/26/9
83/5
/98
3/12/9
8
3/19/9
8
3/26/9
84/2
/984/9
/98
4/16/98
4/23/9
8
4/30/9
85/7
/98
5/14/9
8
5/21/9
8
5/28/9
86/4
/98
6/11/9
8
6/18/9
8
T-B i lls ra te (a ve ra g e )
Ye ld (a nnua l s im p le )
Ye ld (a nnua l co m p o und )
Source: GET calculation based on data provided by the National Bank of Georgia The last 28-day auction was held in April, so that at the end of H1 the market consisted entirely of three month (91-day) T-bills. The Ministry of Finance planned to issue six-month T-Bills later in the

MONEY AND FINANCE
34 GEORGIAN ECONOMIC TRENDS – 1998 No.3
year. At the end of June, there were GEL 19 million (USD 14 million) outstanding T-Bills. The Georgian T-Bills market was relatively small compared with some other CIS countries markets: for example, the Kyrgyz market includes 3-, 6- and 12-month maturities. The yield on Georgian T-Bills remained high despite a drop in the T-Bill rate during 1998 Q2. Figure 4.2 shows the T-Bill rate and the simple annual yield for 91-day T-Bills. COMMERCIAL BANKS AND INTEREST RATE DEVELOPMENTS Interest rates on GEL-denominated loans fell to 35 per cent in 1998 Q2, about 7 percentage points lower than in 1997 Q1. The average rate on term deposits increased to 20 per cent in June 1998 (10 percentage points higher than in June 1997). The overall deposit rate remained low, reflecting the high share of current accounts and demand deposits in the deposit structure; this situation showed no sign of changing. Figure 4.3: Average Commercial Banks Interest Rates in GEL Terms
0%
10%
20%
30%
40%
50%
60%
70%
Dec
-95
Jan-
96
Feb-
96
Mar
-96
Apr-
96
May
-96
Jun-
96
Jul-9
6
Aug-
96
Sep-
96
Oct
-96
Nov
-96
Dec
-96
Jan-
97
Feb-
97
Mar
-97
Apr-
97
May
-97
Jun-
97
Jul-9
7
Aug-
97
Sep-
97
Oct
-97
Nov
-97
Dec
-97
Jan-
98
Feb-
98
Mar
-98
Apr-
98
May
-98
Jun-
98
T im e depos it ra teLend ing ra teTB -s ra teO ve ra ll depos its ra teC red it A uc t ions
Source: Before October 1997, GET calculations from data provided by the National Bank of Georgia. Since October 1997,
data provided by the National Bank of Georgia1 The interest rate on USD-denominated loans also decreased since the beginning of the year and was similar to the rates on loans in GEL. Notwithstanding the slow but gradual depreciation of the GEL against the USD, the weighted average interest rate for deposits in foreign currency was higher than in GEL reflecting the commercial banks’ preference for foreign currency assets. At the same time, the lucrative and relatively low-risk T-Bills market encouraged commercial banks to attract GEL deposits and it seemed likely that banks would start offering higher interest rates for GEL deposits. The T-Bills market shaped the demand on the credit auctions: the effect of the T-Bill rate on the credit auctions market was evident in 1998 Q2, when the interest rates on credit auctions and T-Bills converged. The commercial banks’ demand for liquidity increased, with 60-day auctions held in April and June: the NBG participated in the auctions only as a buyer. The total outstanding amount of credits from commercial banks was GEL 0.5 million at the end of June 1998.
1 All rates are calculated as the weighted average on the outstanding loans at the end of each month. Lending rates exclude overdue and bad loans. Credit auction rates are calculated on outstanding NBG lending at the end of month. The overall deposit rate refers to the weighted average interest rate on demand and time deposits.

MONEY AND FINANCE
GEORGIAN ECONOMIC TRENDS – 1998 No.3 35
Figure 4.4: Credit Auctions, Monthly Transaction Volume
0
2 ,0 0 0 ,0 0 0
4 ,0 0 0 ,0 0 0
6 ,0 0 0 ,0 0 0
8 ,0 0 0 ,0 0 0
1 0 ,0 0 0 ,0 0 0
1 2 ,0 0 0 ,0 0 0G
EL
Tota l month ly vo lume
NB G lending
In terbank
Source: GET calculations from data provided by the National Bank of Georgia MONETARY RATIOS Table 4.2: Monetary Ratios
1997 1998Jul Aug Sep Oct Nov Dec Jan Feb Mar Apr May Jun
Required reserves/ CBs Deposit Liabilities % 13.2 12.8 11.4 10.8 10.8 11.8 10.3 11.3 11.8 11.5 11.3 11.8CBs Correspondent A/Cs in NBG/CBs Deposit Liabilities % 12.7 16.7 10.8 12.3 11.4 5.1 9.4 7.0 9.0 11.0 7.3 11.5Cash in CBs/ CBs Deposit Liabilities % 10.7 9.9 13.5 12.1 9.7 11.0 11.4 11.0 11.5 11.8 11.6 10.5Total CBs Reserves/ CBs Deposit Liabilities % 36.6 39.4 35.7 35.2 31.9 27.9 31.1 29.3 32.3 34.3 30.2 33.8Dollarisation Ratio % 52.3 52.0 53.3 57.9 57.5 58.4 59.0 59.1 61.0 60.7 60.7 59.8Money Multiplier (M2) 1.05 1.04 1.06 1.04 1.06 1.07 1.06 1.07 1.04 1.03 1.05 1.04Money Multiplier (M3) 1.31 1.31 1.34 1.35 1.37 1.35 1.39 1.42 1.39 1.37 1.40 1.38 Source: GET calculations from data provided by the National Bank of Georgia Because of the undeveloped state of the money market, potential savings (as well as investments) were not fully used. This was one of the reasons why the deposit dollarisation ratio was so high despite the favourable rate of inflation. The ratio remained at about 60 per cents for the first half of the year, reflecting a high level of foreign exchange flows into the country; the main reason for this was the large quantity of unregistered cash associated with shadow economic activity. The programme of monetary and credit development for 1998 – 2000 assumed that the velocity of money would fall and that the M2 money multiplier would increase. However, difference between M2 and M3 remains significant because of the high dollarisation ratio for deposits and the under-developed state of the money and credit markets.

MONEY AND FINANCE
36 GEORGIAN ECONOMIC TRENDS – 1998 No.3
FOREIGN ASSETS AND EXCHANGE RATES Figure 4.5: Net Foreign Assets of the NBG
-3 5 0 ,00 0
-3 0 0 ,00 0
-2 5 0 ,00 0
-2 0 0 ,00 0
-1 5 0 ,00 0
-1 0 0 ,00 0
-5 0 ,00 0
0
5 0 ,0 00
1 0 0 ,00 0
1 5 0 ,00 0
2 0 0 ,00 0
2 5 0 ,00 0
3 0 0 ,00 0
M ar1997
A pr M ay Jun S ep Dec Jan1998
Feb M ar A pr M ay Jun
GEL
thou
sand
s .
Ne t Inte rna tiona l Reserves
F ore ign E xchange
Use o f IM F resources
Source: Data provided by the National Bank of Georgia The NBG’s foreign exchange reserves fell by GEL 26 million in 1998 Q22 compared with a fall of GEL 39 million in Q1. The total fall of GEL 65 million in 1998 H1 was the same as in 1997 H1. GEL 48.5 million entered circulation as a result of direct deficit financing and of spending NBG’s Government deposits. As the NBG’s net sales were only USD 11 million (GEL 15 million), it was anticipated that they should be raised in Q3 1998 in order to sterilise the issued amount and thus keep inflation low. The Q2 data showed that the gradual nominal depreciation of the GEL continued. In addition, capital inflows were expected to grow to strengthen the current account. An increase in the inflow of capital increases would enable the NBG to re-build the stock of its international reserves; very large inflows would even make it possible to appreciate the nominal exchange rate. In that respect, monetary and exchange rate policy should focus on the creation of an appropriate and attractive environment for foreign capital (low inflation, confidence in the GEL, developed money and financial markets). However, a more business-oriented administrative system and better legal framework are also necessary.
2 GEL 15 million was due to net sales on TICEX, and GEL 11 million was due to foreign debt service.

MONEY AND FINANCE
GEORGIAN ECONOMIC TRENDS – 1998 No.3 37
Figure 4.6: GEL/USD Exchange Rates on TICEX and FXB Markets. September 1996 - July 1998
1 .2 4
1 .2 6
1 .2 8
1 .3 0
1 .3 2
1 .3 4
1 .3 6
2-Se
p
3-O
ct
6-N
ov
9-D
ec
13-J
an
13-F
eb
19-M
ar
21-A
pr
28-M
ay
1-Ju
l
1-Au
g
3-Se
p
4-O
ct
10-N
ov
11-D
ec
15-J
an
18-F
eb
23-M
ar
23-A
pr
26-M
ay
26-J
un
29-J
ul
GEL
/USD
T IC E X
F X B
Source: Data provided by the National Bank of Georgia Figure 4.7: NBG Net Interventions on TICEX
-10
-5
0
5
10
15
20
25
Jan
1996 Mar
May Ju
l
Sep
Nov
Jan
1997 Mar
May Ju
l
Sep
Nov
Jan
1998 Mar
May
USD
mill
ions
NB G s ale s
NB G p urc has e s
NB G N e t In te rve ntio ns
Source: Data provided by the National Bank of Georgia BANKING SECTOR REFORM Reform of the banking sector began in 1994 and has been fairly impressive. By the end of June 1998, there were 48 commercial banks of which 43 were certified by the NBG. The total amount of statutory funds was GEL 114 million, and total assets were GEL 429 million: this compares to only GEL 60 million statutory funds and GEL 238 million assets in December 1996, when there were 99 certified banks was. However, commercial banks are still undercapitalised and further reform is needed to improve this situation. In these regards, and in accordance with the ESAF policy framework paper for 1998 – 2000, the NBG and other Georgian authorities planned to reduce the limit on the ratio of insider lending to total capital

MONEY AND FINANCE
38 GEORGIAN ECONOMIC TRENDS – 1998 No.3
from 50 to 25 per cent, to increase the ratio of total capital to risk weighted assets from 10 to 15 per cent since July 1st, 1998, to reduce the reserve requirements ratio if monetary conditions permitted this3, and to develop a secondary market for T-Bills and additional monetary instruments.
3 The reserve requirement ratio was set at 12 per cent in September 1997, and an increase to 16 per cent (effective from October 1, 1998) was planned. There was a risk that the low capitalisation of commercial banks would leave them short of liquidity, but the increase was considered necessary in the light of the gradual depreciation of Lari.
CHAPTER FIVE: INFRASTRUCTURAL DEVELOPMENT AND REGIONAL NEWS
39 GEORGIAN ECONOMIC TRENDS – 1998 No.3
Although it lacks the vast mineral resources of many neighbouring countries, Georgia can benefit from its location on international trade routes between Central Asia and continental Europe (east-west) and also between Russia and the Middle East (north-south). This will require the development of the necessary transport and communications infrastructure. Geographical differences between regions are important factors in Georgia's domestic economic performance. Key regional economic issues include not only the terrain and climate (which are obviously important factors, especially in agriculture) but also the internal infrastructure - not just transport and communications links, but also the patterns of human settlement and industrial concentration. In analysing the country's overall economic performance it is useful to examine information on a regional basis, as well as looking at the national aggregate statistics. INFRASTRUCTURAL DEVELOPMENT Georgia's east-west transport links follow the route of the ancient "Silk Road" and already include roads, rail and pipeline infrastructure. All of these demand extensive work to upgrade them so that they are capable of carrying the large volumes of freight that are anticipated. Major infrastructural investment is planned under the framework of the Traceca (Transport and communications corridor between Europe, the Caucasus and Asia) programme. A major Traceca working group meeting was held in Tbilisi at the beginning of May and was followed by a multilateral summit in Baku in September (see Box 2.1). Box 2.1
THE BAKU CONFERENCE 7-8 SEPTEMBER 1998 On 7-8 September, more than 301 European and Asian countries and 13 international organisations participated in a key 2-day conference to formalise plans for development of transport infrastructure along the �Silk Road� corridor. Georgia was one of 12 signatary countries2 to a multilateral agreement covering infrastructural development, harmonisation of customs and tarriffs, and various other legal and administrative points that are key to ensuring efficient international transit along the route. Georgia was also one of 11 to sign the Baku Declaration which is essentially a memorandum on the conference�s outcome3. The infrastructural development is still at a relatively early stage - at present, according to Russian estimates, the Silk Road route costs twice times as much and takes twice as long as trans-Siberian routes from eastern Asia. Nevertheless, transportation along the route has already increased by an estimated 60 per cent in two years, assisted by EU investment of about USD 70 million. In total, about USD 1 billion of investment is expected to bring down costs and transportation times and to increase the volume of trade along the route from less than 2 million tonnes/year to more than 30 mT/year. In addition to east-west transportation, trade passing north-south across Georgia also has considerable potential. At present the bulk of Armenian trade passes through Georgia as Armenia's borders with Turkey and Azerbaijan are effectively closed and its other neighbouring country, Iran, is the subject of an embargo by the United States (on whom Armenia depends heavily for aid).
1 Various reports put the number of countries at between 31 and 38! 2 The signataries were the Transcaucasian countries (Georgia, Armenia and Azerbaijan), four Central Asian countries (Kazakhstan, Kyrgyzstan, Tajikistan and Uzbekistan), three south-east European countries (Bulgaria, Romania and Turkey), and Moldova and Ukraine. Mongolia and Turkmenistan seem likely to join later. 3 Apparently the 11 signataries were the 12 above-mentioned countries with the exception of Tajikistan.
INFRASTRUCTURAL DEVELOPMENT AND REGIONAL NEWS
40 GEORGIAN ECONOMIC TRENDS – 1998 No.3
PIPELINE DEVELOPMENT Although Georgia is not expected to become a major oil producer (see Chapter 7), it seems likely benefit from the fact that neighbouring countries are. This is because it is located on some of the most attractive routes for the pipeline transportation of oil, from the Caspian countries of central Asia and Azerbaijan to the Black Sea or Mediterranean, from where it can be shipped to continental Europe and other major oil-consuming regions. Two of the three pipeline routes that have been proposed to carry most of the oil from the Caspian region to world markets run through Georgia. One is from Baku to Supsa and westward across the Black Sea; another is from Baku across Georgia and Turkey to the Mediterranean port of Ceyhan. A third route runs from Baku across the north Caucasus to Russia's Black Sea port of Novorossiisk. The final decision on which route(s) to construct/expand is due to be made in the second half of this year4. Gas As with oil, Georgia is not expected to become a significant gas producer but looks set to benefit from the construction and utilisation of gas pipelines across its territory. The Georgian International Gas company, which was established in July 1997, is reported to be planning investment of $500 million in upgrading pipelines which will eventually carry around 8.5 billion cubic meters (bcm) per year of Russian gas to Armenia and Turkey; part of this will go to Georgia as payment for the transit. At present (June 1998) under a contract with the multinational company Itera and Russian and Armenian companies, the pipeline is carrying 1.5-3.5 bcm of gas per year, depending on domestic Armenian demand. AIRPORTS AND EXTERNAL AIR LINKS The main international airport is at Tbilisi, and has been modernised with support from the EBRD. Smaller airports and heliports in various other towns are not used much, and are mainly for internal transportation. With western business and tourist interest in Georgia on the increase, demand for air travel between Tbilisi and western Europe is clearly increasing. The British Airways direct flights to/from London (including connecting flights on from Tbilisi to Yerevan and Bishkek) are now much busier than when they started a year ago. In addition 1998 has already seen the establishment of regular Swiss Air flights between Tbilisi and Zurich and Air Austria flights between Tbilisi and Vienna. The cheapest routes to western Europe and north America tend to be Turkish Airlines' connecting flights through Istanbul and Georgian operators' flights through Prague and Frankfurt. However the long-term prospects for Georgian operators' flights seem to be restricted by technical constraints - the summer connection with Amsterdam which ran until 1997 has been dropped, apparently because of the aircraft's non-compliance with Dutch controls on noise pollution. The eventual privatisation of the state carrier Georgian Airlines should improve matters, but looks unlikely to go ahead unless the terms of the proposed package are modified � see Chapter 7. BLACK SEA PORTS Georgia's main ports are Batumi (in Achara), Poti (in Samegrelo), and Sokhumi (in Abkhazia, outside the Georgian Government's control). In addition an oil terminal is being constructed at Supsa (close to Poti, but in Guria). At present the ports are excluded from the list of enterprises to be privatised, apparently because they have been categorised as natural monopolies: this assessment is now reported to be under review as Poti and Batumi seem to be competing with each other for business.
4 For a detailed examination of the issues involved, see Chapter 5 of the 1998 Q1 issue of GET.

INFRASTRUCTURAL DEVELOPMENT AND REGIONAL NEWS
GEORGIAN ECONOMIC TRENDS – 1998 No.3 41
Batumi was traditionally used more for fishing and as a tourist resort than for trade. However, together with Poti it is now important as the main sea-port for Armenian trade and as the point to which Caspian oil is carried by rail from Azerbaijan and shipped westward to continental Europe. Some 1.5 million tonnes (mT) of oil are expected to be carried in 1998. Poti port was constructed almost a century ago. Its throughput of cargo, which peaked at around 5 mT in the 1980s, declined sharply after the collapse of the Soviet economy. The volume of cargo carried by Poti began to recover in 1994, and the port is ideally situated as a key transit point for trade between central Asia and continental Europe. However, many of Poti port's facilities and equipment are obsolete or damaged and require substantial redevelopment in order to cope with structural changes in the way that cargo is transported. The Georgian Government, lacking the financial and institutional capacity to invest effectively in the port, now seems to have come to the rational conclusion that some form of privatisation is required to realise the port's potential. As discussed in detail in the 1998 Q1 issue of GET, privatisation of the port has been the subject of three separate feasibility studies. As of October 1998, the Georgian authorities still appear to be undecided on how best to proceed. EXTERNAL RAIL AND ROAD LINKS Georgia's internal rail and road network is discussed below (see Domestic Transport Arteries). One of the most important rail and road links, the north-west coastal link with Russia, is effectively closed because of the situation in Abkhazia. The prospects of reopening the link are remote considering that, even before the renewed conflict in May, negotiations between the Georgian Government and Abkhazian leadership failed to agree on the question. Consequently most road traffic between the Russian Federation and Georgia has to go through the mountainous "Georgian Military Highway" between Vladikavkaz, the north Caucasus, Kazbegi in northern Georgia and Tbilisi. Despite its many hairpin bends the road is suitable for most vehicles, but is frequently impassable in winter. There are other road links across the north Caucasus, but most are so poor that they are only of local significance. The main rail and road links with Baku (Azerbaijan) and Yerevan (Armenia) are both comparatively good, and a lot of rail and road trade between Russia and Georgia passes via Baku. At present the biggest problem with the Baku road link is the level of corruption at the border, with the border guards reputed to be worse culprits than the customs officers themselves. A lot of trade is transported by rail including Chevron's Caspian oil on its way to Batumi. There seems to be less traffic on the Yerevan route, and the road is much worse - particularly on the Georgian side of the border. According to a number of reports, a rich Armenian émigré is interested in financing major improvements to the route because of its strategic importance to Armenia. The rail journey to Yerevan is generally faster than the Baku rail link, and there appears to be less corruption - particularly on the Armenian side of the border. The links with Turkey in the south-west are still developing. The road between Batumi and Trabzon is the main conduit, and progress is also being made on a planned rail link between Akhalkalaki in Samtskhe-Javakheti and Kars in northern Turkey. The project is estimated to cost about USD 400 million, with Turkey expected to contribute USD 250 million. This would give Turkey a rail link not only to Georgia but also further east to Azerbaijan; Turkey has rejected an Armenian proposal to restore a pre-Soviet rail link from Kars to Yerevan because of the continuing dispute between Armenia and Azerbaijan.

INFRASTRUCTURAL DEVELOPMENT AND REGIONAL NEWS
42 GEORGIAN ECONOMIC TRENDS – 1998 No.3
TELECOMMUNICATIONS Construction is underway in Georgia on an international cable system to which would form part of a Trans-Asian-European fibre-optic line running from Frankfurt-am-Main in Germany to Shanghai in China. DOMESTIC TRANSPORT ARTERIES Georgia's main transport artery (both road and rail) runs basically east-west between the Gardabani district on the border with Azerbaijan and the coastal Kolkheti lowlands in Samegrelo. The vast majority of Georgia's industrial enterprises are located close to this route, in the capital Tbilisi and in towns such as Kutaisi, Rustavi, Zestaphoni, Zugdidi, Samtredia and Mtskheta. At Samegrelo the artery splits, having both road and rail links with coastal Abkhazia and on towards Sochi (north-west), Poti (west), and Achara and on to northern Turkey (south-west). From the south-east border the main road and rail links continue to Baku. Figure 5.1: Georgia's geography and main transport artery
A number of smaller arteries are - at least potentially - important for Georgia's international trade. The most notable of these are the Georgian Military Road north from Tbilisi to Vladikavkaz, and the road and rail links south from Tbilisi to Armenia. Various other road links with neighbouring countries are economically significant for border districts, such as Lagodekhi (on the eastern border with Azerbaijan), Ninotsminda (at the western end of the border with Armenia) and Java (linking North and South Ossetia).
INFRASTRUCTURAL DEVELOPMENT AND REGIONAL NEWS
GEORGIAN ECONOMIC TRENDS – 1998 No.3 43
In addition, other main roads (and a few branch railway lines) are important for internal transportation between towns: these tend to run approximately parallel to the main east-west artery, with a few links running north or south to it. According to Q3 press reports, Turkey is planning a USD 200 million project to upgrade the mountain road north from the border through Samtskhe-Javakheti to Khashuri (which is on the main east-west artery approximately mid-way between Kutaisi and Gori) 5. REGIONAL NEWS TBILISI Tbilisi is the capital city and the administrative and commercial centre of Georgia, and is located to the east of the country's geographical centre. According to the SDS� latest estimate, 1.4 million people (more than a quarter of Georgia's population) live in the city. Tbilisi has considerably better infrastructure than the rest of Georgia, such as effective transport services, a good telephone system in several parts of the city plus competing mobile telecommunications services, and developing business services such as providers of legal and management advice. Consequently it is an attractive location for domestic business, and is also the main location for much foreign investment in Georgia. The summer's governmental changes saw the promotion of Tbilisi's mayor Badri Shoshitaishvili to Industry Minister; the new mayor is Vano Zodelava who was previously the mayor of Poti. It seems unlikely that this change will have a significant impact on economic growth in Tbilisi. There is little doubt that while Shoshitaishvili was mayor economic growth in Tbilisi was stronger than in the rest of the country, but on the other hand it can be argued that Tbilisi's relative prosperity has been due mainly to its relatively good infrastructure and other economic advantages that are inherent in being the country's administrative and commercial centre. (For example, foreign investors generally prefer to locate their first investment projects in a country's commercial centre.) Moreover, critics of Shoshitaishvili could point to the fact that, according to opinion polls of Georgian officials and the general population, the Tbilisi municipal authority was considered to be amongst most corrupt organisations of all those considered. Perhaps the most notable commercial event in the Tbilisi region during 1997 Q2 was the tender for control of a majority stake in the municipal gas distributor Tbilgas. The MSPM formally invited applications for the tender in May, and on 4 August the MSPM's working committee on the tender announced that it had awarded the tender to Intergas, which was established by the Georgian-British company Interpack6. In September the new mayor reportedly told the heads of Tbilisi's district councils to check markets for cheap imported goods from Russia which could harm local producers. This might reflect the general nervousness felt on that day, when the NBG had had to intervene to restore the Lari to its normal level after a dramatic fall during the weekend7. However, experience shows that when local authorities intervene to protect sellers of more expensive goods, the main impact is that local prices rise and therefore that general living standards fall8. Such actions can also undermine the credibility of Georgia's application to accede to the World Trade Organisation, whose rules do not allow local authorities to protect local producers (except in clearly-defined cases of dumping).
5 The road would run from the Georgian-Turkish border at Kartsakhi, about 20 km west from where Georgia, Armenia and Turkey meet. 6 For further details of the sale see Chapter 7. 7 For further details see Chapter 4. 8 For further details see the Prices chapter of the 1997 Q1 edition of GET.

INFRASTRUCTURAL DEVELOPMENT AND REGIONAL NEWS
44 GEORGIAN ECONOMIC TRENDS – 1998 No.3
KAKHETI Location: Eastern Georgia Population: 467,000 Districts: Akhmeta, Gurjaani, Dedoplis Tskaro, Telavi, Lagodekhi, Sagarejo, Signakhi, Kvareli Unemployment rate: 6аperаcent Kakheti is a mainly agricultural region, specialising in wine-growing. The major road in the region runs east-west between Tbilisi and the Lagodekhi border with Azerbaijan (from where the Azerbaijani town of Belakani is only 12 km): there is some local cross-border trade between the Lagodekhi area and Azerbaijan. The region is also served by a branch railway line, connecting Telavi, Gurjaani and Dedoplis Tskaro with Tbilisi. Foreign investment in the region's wine industry includes the US-Georgian joint venture Chalice Wines (Sagarejo district) and the Franco-Georgian joint venture Alazani-1 (Kvareli). The US oil company Frontera has invested more than USDа10аmillion in oil exploration in Kakheti, opening offices in Dedoplistskaro and Mirzaani (which is also in the Dedoplistskaro district). Dedoplistskaro's oil reserves are reportedly 300аmT; if this is correct they would be comparable to one of Azerbaijan's medium-sized fields and their development would raise Georgia's oil output to a far higher level than at present�. Production contracts in Azerbaijan for on-shore fields with comparable reserves seem to be worth in the region of USDа10аbillion, but the actual value would depend on geological factors. Sagarejo in western Kakheti was the subject of a Presidential order (28 June) which instructed various government ministries to take action to promote economic development in the district. 25 Chinese-made tractors are being donated to small-scale farmers; this follows the Chinese government's gift in April of fertilisers to farmers in the district whose crops had been damaged by bad weather. Amongst its other instructions, the order calls for improvements to the road between Sagarejo and the tourist attraction of David Gareji. Sagarejo is also to benefit from its own power supply, with the local Sagarejo Power Company generating electricity from gas produced as a by-product of local oil production. The Kakheti region was also the scene of a political row in June over a by-election in Lagodekhi, which was one of the factors in the boycott of Parliament by various opposition parties. KVEMO KARTLI Location: South eastern Georgia Population: 607,000 Districts: Rustavi (town), Bolnisi, Gardabani, Dmanisi, Tetri-Tskaro, Marneuli, Tsalka
INFRASTRUCTURAL DEVELOPMENT AND REGIONAL NEWS
GEORGIAN ECONOMIC TRENDS – 1998 No.3 45
Kvemo Kartli is located to the south of Tbilisi, and has good transport links - the main road and rail links from Tbilisi to Armenia and to Azerbaijan both run through Kvemo Kartli. The region is recorded as producing some 15-20% of Georgia's industrial output. Overall recorded industrial output in Kvemo Kartli saw some decline in the early part of this year. Even some of the most successful plants have suffered production problems as a result of the erratic supply of electricity. This situation may improve following a project to install electricity meters in domestic households and to disconnect non-paying consumers. (According to one report, only 10аperаcent of domestic consumers in Rustavi were paying for their electricity before the experiment.) In addition, a 20 megawatt hydro-electric station may be constructed near Rustavi: the MTFER told reporters that German engineers believe that from a technological perspective this could be done relatively easily. Despite the recorded fall in overall industrial output, the general development of industrial and commercial activity in the region seems to be progressing better than in most other regions. The east of the region benefits from its relative proximity to Tbilisi and to Azerbaijan, which helps access both to supplies and to markets. For many industrial products the road south of Gardabani to Baku is the only practical road link, not just to Azerbaijan and Central Asia but also to Russia. Therefore Kvemo Kartli is likely to benefit from the completion of the Red Bridge on the Georgian-Azerbaijan frontier, which is financed by the Traceca programme. SHIDA KARTLI Location: Central Georgia Population: 343,000 Districts: Tskhinvali (town), Java, Gori, Kaspi, Kareli, Khashuri The southern districts of Shida Kartli are located on Georgia's main road and rail artery: Kareli, Gori and Kaspi districts contain most of the region's industry. Northern Shida Kartli contains most of the territory of South Ossetia (whose autonomous status was abolished after Georgia left the Soviet Union, leading to conflict and to the loss of government control over the region). The prospects of a settlement of South Ossetia's constitutional status seem to have improved this year with North Ossetia's categorical rejection of the idea that South Ossetia could be unified with North Ossetia within the Russian Federation. The main developments in Shida Kartli are related to progress on political reconciliation between the South Ossetian leadership (in the northern part of the region) and the Georgian Government. Notions of separatism from Georgia were in effect killed off earlier in the year by North Ossetia's rejection of the idea of North-South unification; instead, North Ossetia has played a valuable role in mediating in the negotiations. On 3 April Georgia's Finance Minister Chkuaseli and his South Ossetian counterpart met in the South Ossetia's main town Tskhinvali for wide-ranging talks, and on 16 April the new North Ossetian President visited Georgia to help lay the groundwork for a direct meeting of Georgian President Shevardnadze and South Ossetian leader Chibirov which eventually took place on 20 June. As far as economic and social developments are concerned, cooperation between the Georgian and South Ossetian sides has borne fruit: rail services between Gori (in southern Shida Kartli) and Tskhinvali were due to be restored in August, and the Post Bank is planning to open a branch in

INFRASTRUCTURAL DEVELOPMENT AND REGIONAL NEWS
46 GEORGIAN ECONOMIC TRENDS – 1998 No.3
Tskhinvali. According to press reports the Georgian Government is hoping to receive USDа10аmillion from international donors to assist in resettling Georgians who fled their homes during the fighting. With some 30,000 people having fled, this would be equivalent to only USDа500 per person but would probably not be distributed equally: according to one report it would be used to compensate 1,400 families whose abandoned homes have been legally taken over by South Ossetians in their absence. In the more industrialised south of the region, economic conditions seem to be improving. In the south-west the local economy is probably helped by rising output at the Agara sugar plant in Kareli district. Reports say the plant is expanding output following the settlement of a lengthy court dispute which had constrained normal commercial activities, preventing it from being able to purchase imports of raw sugar. Production statistics indicate that the plant's enforced dependence on domestic supplies compelled it to remain idle for most of 1997; with access to imports the plant's annual output is likely to be some four times higher than in 1996-97 assuming that there is sufficient demand. The signs so far look promising: Agara-produced sugar has become widely available in Georgian shops in time for the jam-making season, and it looks set to capture a large share of the domestic market from imports which are considerably more expensive. MTSKHETA-MTIANETI Location: North eastern Georgia Population: 139,000 Districts: Akhalgori, Dusheti, Tianeti, Mtskheta, Kazbegi Mtskheta-Mtianeti is mainly agricultural, with market gardening in Mtskheta and sheep-farming in the highland regions of Tianeti, Dusheti and Kazbegi. The Georgian Military Highway runs through the region between Tbilisi and the border with the Russian Federation. The Highway seems to be carrying very little freight considering that, while the road through Abkhazia remains blocked, it is the only major road connecting Georgia with Russia. Most of the industry in the region is located in Mtskheta and Dusheti, where industrial output seems to be growing quite strongly. The region also includes the country's main ski resort of Gudauri, which is likely to be benefiting from the rising number of foreigners visiting or living in Georgia. The main news event in the Mtskheta-Mtianeti region was the removal of uranium from Mtskheta's inactive nuclear reactor to Dounreay station in Scotland. Opposition in Britain to this action made it headline news all over the world - Britain lifted its general policy of not importing nuclear material because it wanted to help make Georgia nuclear free. However, whilst the Mtskheta uranium was almost certainly the last such stock in Georgia, there are still occasional discoveries of radioactive material in areas around the country that were used by the Soviet military forces.

INFRASTRUCTURAL DEVELOPMENT AND REGIONAL NEWS
GEORGIAN ECONOMIC TRENDS – 1998 No.3 47
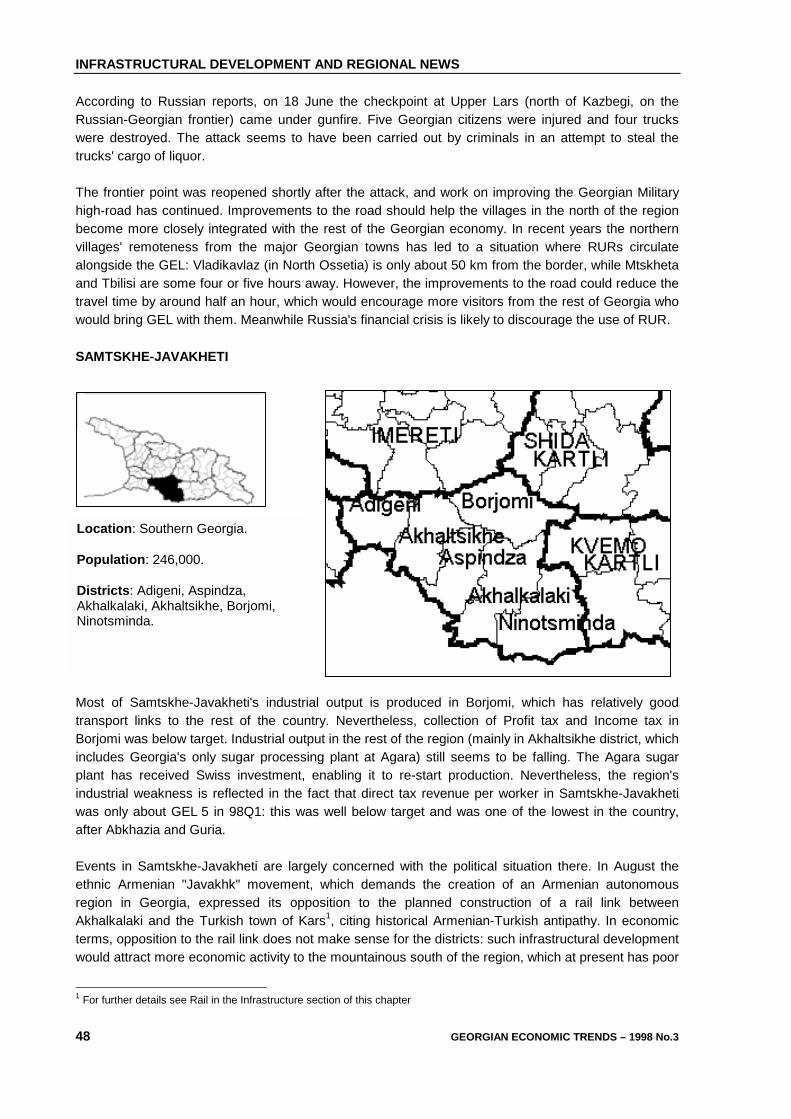
INFRASTRUCTURAL DEVELOPMENT AND REGIONAL NEWS
48 GEORGIAN ECONOMIC TRENDS – 1998 No.3
According to Russian reports, on 18 June the checkpoint at Upper Lars (north of Kazbegi, on the Russian-Georgian frontier) came under gunfire. Five Georgian citizens were injured and four trucks were destroyed. The attack seems to have been carried out by criminals in an attempt to steal the trucks' cargo of liquor. The frontier point was reopened shortly after the attack, and work on improving the Georgian Military high-road has continued. Improvements to the road should help the villages in the north of the region become more closely integrated with the rest of the Georgian economy. In recent years the northern villages' remoteness from the major Georgian towns has led to a situation where RURs circulate alongside the GEL: Vladikavlaz (in North Ossetia) is only about 50 km from the border, while Mtskheta and Tbilisi are some four or five hours away. However, the improvements to the road could reduce the travel time by around half an hour, which would encourage more visitors from the rest of Georgia who would bring GEL with them. Meanwhile Russia's financial crisis is likely to discourage the use of RUR. SAMTSKHE-JAVAKHETI
Most of Samtskhe-Javakheti's industrial output is produced in Borjomi, which has relatively good transport links to the rest of the country. Nevertheless, collection of Profit tax and Income tax in Borjomi was below target. Industrial output in the rest of the region (mainly in Akhaltsikhe district, which includes Georgia's only sugar processing plant at Agara) still seems to be falling. The Agara sugar plant has received Swiss investment, enabling it to re-start production. Nevertheless, the region's industrial weakness is reflected in the fact that direct tax revenue per worker in Samtskhe-Javakheti was only about GEL 5 in 98Q1: this was well below target and was one of the lowest in the country, after Abkhazia and Guria. Events in Samtskhe-Javakheti are largely concerned with the political situation there. In August the ethnic Armenian "Javakhk" movement, which demands the creation of an Armenian autonomous region in Georgia, expressed its opposition to the planned construction of a rail link between Akhalkalaki and the Turkish town of Kars1, citing historical Armenian-Turkish antipathy. In economic terms, opposition to the rail link does not make sense for the districts: such infrastructural development would attract more economic activity to the mountainous south of the region, which at present has poor
1 For further details see Rail in the Infrastructure section of this chapter
Location: Southern Georgia. Population: 246,000. Districts: Adigeni, Aspindza, Akhalkalaki, Akhaltsikhe, Borjomi, Ninotsminda.

INFRASTRUCTURAL DEVELOPMENT AND REGIONAL NEWS
GEORGIAN ECONOMIC TRENDS – 1998 No.3 49
transport and communications links both to the Georgian economic heartland and to Armenia. It is more likely that the protests are concerned with moves towards new constitutional arrangements in Georgia. IMERETI
Location: West central Georgia Population: 800,000 Districts: Kutaisi (town), Tkibuli (town), Tskaltubo (town), Chiatura (town), Bagdati, Vani, Zestaphoni, Terjola, Samtredia, Sachkhere, Kharagauli, Khoni Many of Imereti's enterprises are located on the country's main road/rail artery in towns such as Kutaisi, Zestaphoni and Samtredia. Around half the region's enterprises are located in Kutaisi, which is the most important town in the region and is served by an airport. Enterprises in the region produce 10-15% of Georgia's industrial production. Although recorded industrial output in the region still seems to be on a downward trend, the labour market was reported to be relatively buoyant in the first quarter of 1998: 2,000 jobs were created in Kutaisi alone. Foreign investment in the region includes Russian portfolio investment in Zestaphoni's ferro-alloys plant which is the region's leading exporter. The region’s economy seems to be experiencing mixed fortunes. On the one hand, privatised manufacturing plants such as the Kutaisi Motor Factory and the Kutaisi Aviation Repairs Factory are reported to have received major export orders which should have a significant positive impact on the wider economy. On the other hand, the northern districts appear to have suffered knock-on effects as a result of the uncertainty surrounding Chiatura Manganese (see also Chapter 7). Anecdotal evidence indicates that stalled investment and production at the plant, which is an important employer in the district, has led to a significant drop in living standards; the demand for coal from the neighbouring district of Tkibuli and the supply of manganese to the Fero ferro-alloy plant at Zestaphoni may also have been affected. According to reports in 1998 Q3, Kutaisi’s electricity distribution company Kelasi may be privatised as an individual entity. This would mark a deviation from earlier proposals under which Kelasi would have been part of a general west Georgian distributor; however, as Tbilisi’s distributor is being privatised separately it may also make sense to do the same in Kutaisi which is Georgia’s second city.

INFRASTRUCTURAL DEVELOPMENT AND REGIONAL NEWS
50 GEORGIAN ECONOMIC TRENDS – 1998 No.3
SAMEGRELO AND ZEMO-SVANETI
Location: Western and northern Georgia Population: 437,000 Districts: Poti (town), Abasha, Zugdidi, Martvili, Mestia, Senaki, Chkhorotsku, Tsalenjikha, Khobi Economic progress in Samegrelo and Zemo Svaneti region is characterised by a very marked geographical difference between the Khobi coastal region (around the Black Sea port of Poti) and the hinterland. Poti has the potential advantage of being a major port on the Traceca "Silk Route" between continental Europe and Central Asia. One of Georgia's main sea routes is between Poti and Burgas in Bulgaria; Burgas port officials report that their total through-put of 7.5 mT/year is growing at a rate of 7 per cent a year, with particularly strong growth in goods transported from Poti (FN Financial Times, 3 September 1998). In May a new ferry service between Poti and the Romanian port of Costanza came into operation; although further away than Burgas from Georgia, Costanza has larger capacity. Elsewhere in Samegrelo's hinterland and in Zemo Svaneti economic progress is more difficult. The natural market for much of the region's output is southern Russia, but this is cut off because of the situation in Abkhazia. It is difficult to tell to what extent the region's producers have begun to focus their efforts on exporting via Poti to continental Europe, or south via Achara to Turkey, instead of to Russia. However, production and trade statistics seem to indicate that west Georgian manufacturers are not using either of these routes to a substantial extent. The Georgian government is continuing to provide ad hoc assistance to the region's industry, including the allocation of GEL 0.2 million loans to Zugdidi Porcelain according to a presidential Decree (15 April). On the other hand, land conservation schemes in the region had to be halted because of cuts in budget expenditure. Conditions in much of Samegrelo's hinterland (in particular in the Zugdidi and Tsalenjikha districts) have worsened because of the situation in Abkhazia. At the beginning of May Zugdidi became the new seat of the "Abkhaz parliament in exile" (which represents around 200,000 ethnic Georgian refugees from the conflict in Abkhazia); the parliament moved from Tbilisi in order to be closer to the adjacent Gali district of Abkhazia. From 20 May when the conflict in Abkhazia resumed, some 35,000 ethnic Georgians fled from Gali. This put great pressure on the districts' social facilities, with schools and hospitals having to be used as emergency accommodation.

INFRASTRUCTURAL DEVELOPMENT AND REGIONAL NEWS
GEORGIAN ECONOMIC TRENDS – 1998 No.3 51
GURIA
Location: Western Georgia Population: 167,000 Districts: Lanchkhuti, Ozurgeti, Chokhatauri Guria is mainly agricultural, with tea-growing and sub-tropical crop-farming the main forms of activity. Revenue from direct taxes in 98Q1 was only GEL 3, the lowest in the country apart from Abkhazia: this seems to reflect the particularly low level of incomes in Guria. However, the region's small industrial output (based mainly in and around the largest town, Ozurgeti) seems to be growing quite strongly, probably stimulated by construction activity around Supsa where a new oil terminal is being established to enable oil from the Baku-Supsa pipeline to be shipped onward across the Black Sea towards central and western Europe. RACHA-LECHKHUMI AND KVEMO-SVANETI
Location: Northern Georgia Population: 57,000 Districts: Ambrolauri, Lentekhi, Oni, Tsageri Most of Racha-Lechkhumi and Kvemo-Svaneti is very mountainous, and the economy is mainly agricultural. Infrastructure is very limited, consisting basically of circuitous minor roads between the

INFRASTRUCTURAL DEVELOPMENT AND REGIONAL NEWS
52 GEORGIAN ECONOMIC TRENDS – 1998 No.3
major settlements. The villages of Ambrolauri and Oni are also linked to Kutaisi by helicopter, which is often the only practical form of transport in winter. The main activities in the region are potato-growing and animal farming, predominantly cattle. In addition there is some wine-growing, mainly in the more low-lying districts of Tsageri and Ambrolauri which also contain most of the region's industry. A sharp drop in 1998 Q1's industrial output compared with a year earlier was attributed to the interruption of the power supply from Lajanuri HES. ACHARA A.R.
Location: South western Georgia Population: 395,000 Districts: Batumi, Kedi, Kobuleti, Shuakhevi, Khelvachauri, Khulo Achara is quite prosperous, largely as a result of its favourable location as an international transit point; Batumi is almost certainly the main port through which Armenian imports and exports are carried. The number of registered enterprises in each of Achara's districts indicates that most economic activity is concentrated along the coast - most of it in the main port of Batumi, although the minor port of Kobuleti further north is also significant as a tourist resort. The coast has reasonable infrastructure, being linked by road and rail to the country's main transport artery; Batumi also has an airport. The other districts are on a main road which runs east-west to the south of the Meskheti mountain range, between Batumi and western Samtskhe-Javakheti. Although a breakdown of industrial production figures for Achara's districts is not available, total output in the republic seems to be rising steadily. Achara's coastline environment is believed by many commentators to be threatened by a new hydroelectric power station at Chorokhi in Turkey, construction of which has now been agreed to. As compensation for the possible environmental damage, Turkey has promised substantial public investment to develop links between the two countries. Meanwhile the city of Batumi is due to undergo substantial urban redevelopment, part-funded by a USD 2.5 million contribution from the World Bank. In April Abashidze said the Acharan regional political party will boycott the next Georgian parliamentary elections unless a "free economic zone" is created in Batumi. He also made various political demands related to Achara's constitutional status, which seem likely to be aimed at ensuring that if South Ossetia's status is resolved Achara will have an equally high degree of autonomy. At present, as an Autonomous Republic, Achara is entitled to retain 99 per cent of the revenue from customs and excise duty on imports that enter Georgia through it.

INFRASTRUCTURAL DEVELOPMENT AND REGIONAL NEWS
GEORGIAN ECONOMIC TRENDS – 1998 No.3 53
ABKHAZIA A.R.
Location: North western Georgia Population: 237,000. Districts: Gali, Ochamchire, Gulprishi, Sokhumi, Gudauta, Gagra. The Abkhazian autonomous republic is outside Georgian government control, and the re-settlement in the region of ethnic Georgians displaced from Abkhazia (mainly the south-eastern Gali district) is still a very sensitive social and political issue. Little progress has been made towards finding a political solution to the conflict between the Georgian and Abkhaz leaders, based mainly on cooperation between the sides on a few economic areas. Inevitably, reports on the economic situation in Abkhazia provide only sketchy details. The republic's economy, which would normally prosper from its excellent location along the coastal road to Russia, has evidently been devastated by the conflict itself and also by the trade embargo imposed by the CIS. Nevertheless, the truce in 1997 apparently permitted the beginnings of an economic recovery with retail turnover said to have doubled and tax revenue rising by 20%. Sadly in May there was a major setback to peace in the republic when the conflict was reignited following animosity between Abkhaz security forces and ethnic Georgians. This ended very quickly with the comprehensive defeat of the latter and their expulsion from Gali.

CHAPTER SIX: INTERNATIONAL TRADE
54 GEORGIAN ECONOMIC TRENDS – 1998 No.3
This chapter assesses the Georgia's application to the WTO, including an evaluation of the progress made and a discussion of some of the issues involved. It then examines the trends in the direction and composition of Georgia’s exports, and provides the 1998 Q2 data on other countries’ shares of the Georgian market. PROGRESS TOWARDS WTO ACCESSION Early accession to the WTO has taken on greater importance as a result of the political and economic crisis in Russia. Faced with growing uncertainty about the direction of economic development in Russia, foreign companies who want to do business in the former Soviet Union are now attracted by the higher degree of economic stability in the Transcaucasus and Central Asia. For example, the US embassy in Tbilisi reports a growing number of inquiries from a number of US companies who are looking for a non-Russian location for their investments in the CIS. In this context, early WTO accession is likely to be a major attraction for companies that have not yet decided in which CIS country to invest: it is a strong signal that a country’s policies are trade-oriented and that the government is united enough to make radical changes in key areas. Moreover, WTO membership provides a number of useful guarantees to investors: in particular, it ensures that tariffs on its imports to and exports from the country will remain below specified limits and that it will not be discriminated against by any WTO member country. Therefore, given the choice between similar countries, most international business leaders would choose to locate new investment in a WTO member country rather than in a non-member country. Of the countries in the region, only Kyrgyzstan and Latvia have concluded their accession negotiations (see Box 6.1). Because of disadvantages such as its poor transport links with major markets, landlocked Kyrgyzstan is unlikely to be attractive to the majority of companies as a base for trade and investment in the region. In comparison, Georgia has an excellent geopolitical location, being on the crossroads between the major markets of Russia, the Caspian countries, Iran and Turkey. In addition Georgia enjoys good diplomatic relations with all of its neighbouring countries. On the other hand, these advantages have not been enough to compensate for non-membership of WTO. A number of other CIS countries’ accession processes are at a fairly advanced stage; the danger is that by joining after them Georgia would miss out on investment that it would be able to attract as a WTO member. Georgia's application to the WTO has continued to make fair progress, with bilateral negotiations in July and October 1998 followed by a second Working Party meeting. Georgia concluded its negotiations on market access for trade in services in October 1998, representing an important milestone in the accession process. In addition Georgia’s report on its legislative changes was very well received; further progress (notably concerning the protection of intellectual property rights) is expected and will be reviewed by the third Working Party meeting, which is likely to be in February or March 1999. GEPLAC’s legal team leader, who attended the second Working Party meeting, considers that bilateral negotiations with the leading WTO members may be completed by the beginning of 1999 and that Georgia has excellent prospects of acceding to the WTO in late 1999 as the Government hopes. However, binding tariffs on goods are still in the process of being negotiated, and the question of possible transition periods for various sectors still seems to be unsettled. Agreements on these issues are not expected to be formalised until the third Working Party meeting. Georgia also needs to bring its policies on subsidisation into line with WTO requirements.
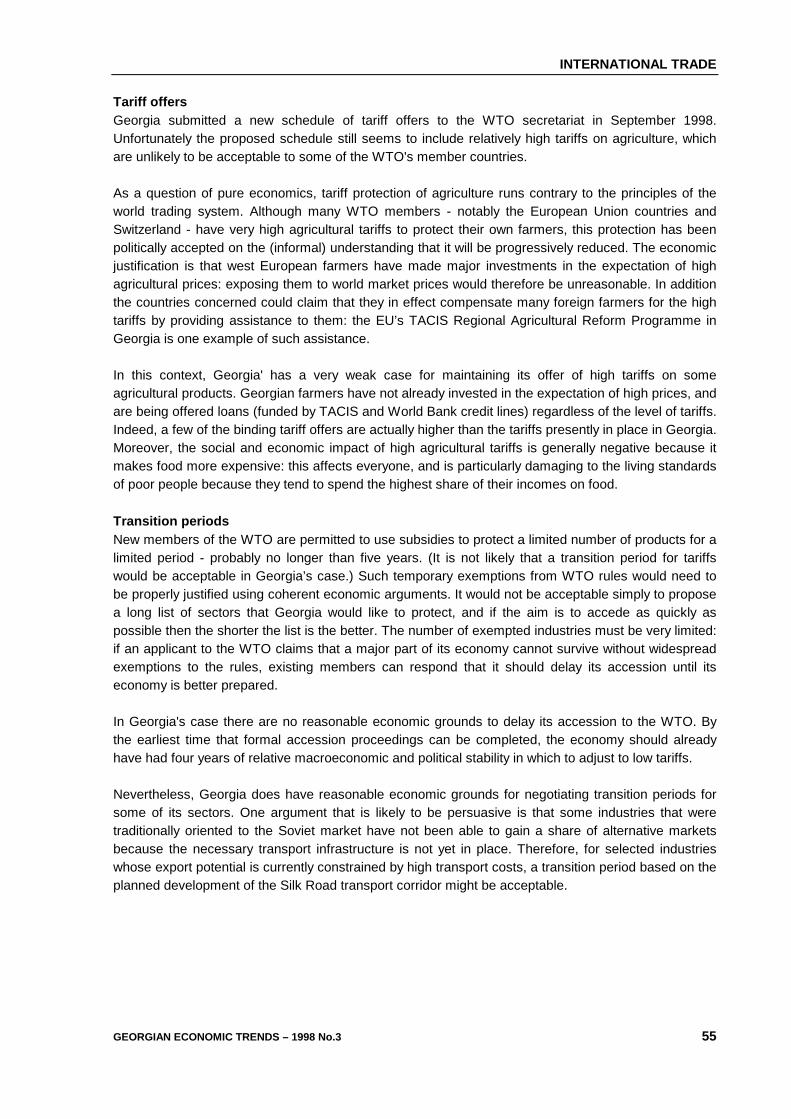
INTERNATIONAL TRADE
GEORGIAN ECONOMIC TRENDS – 1998 No.3 55
Tariff offers Georgia submitted a new schedule of tariff offers to the WTO secretariat in September 1998. Unfortunately the proposed schedule still seems to include relatively high tariffs on agriculture, which are unlikely to be acceptable to some of the WTO's member countries. As a question of pure economics, tariff protection of agriculture runs contrary to the principles of the world trading system. Although many WTO members - notably the European Union countries and Switzerland - have very high agricultural tariffs to protect their own farmers, this protection has been politically accepted on the (informal) understanding that it will be progressively reduced. The economic justification is that west European farmers have made major investments in the expectation of high agricultural prices: exposing them to world market prices would therefore be unreasonable. In addition the countries concerned could claim that they in effect compensate many foreign farmers for the high tariffs by providing assistance to them: the EU’s TACIS Regional Agricultural Reform Programme in Georgia is one example of such assistance. In this context, Georgia' has a very weak case for maintaining its offer of high tariffs on some agricultural products. Georgian farmers have not already invested in the expectation of high prices, and are being offered loans (funded by TACIS and World Bank credit lines) regardless of the level of tariffs. Indeed, a few of the binding tariff offers are actually higher than the tariffs presently in place in Georgia. Moreover, the social and economic impact of high agricultural tariffs is generally negative because it makes food more expensive: this affects everyone, and is particularly damaging to the living standards of poor people because they tend to spend the highest share of their incomes on food. Transition periods New members of the WTO are permitted to use subsidies to protect a limited number of products for a limited period - probably no longer than five years. (It is not likely that a transition period for tariffs would be acceptable in Georgia’s case.) Such temporary exemptions from WTO rules would need to be properly justified using coherent economic arguments. It would not be acceptable simply to propose a long list of sectors that Georgia would like to protect, and if the aim is to accede as quickly as possible then the shorter the list is the better. The number of exempted industries must be very limited: if an applicant to the WTO claims that a major part of its economy cannot survive without widespread exemptions to the rules, existing members can respond that it should delay its accession until its economy is better prepared. In Georgia's case there are no reasonable economic grounds to delay its accession to the WTO. By the earliest time that formal accession proceedings can be completed, the economy should already have had four years of relative macroeconomic and political stability in which to adjust to low tariffs. Nevertheless, Georgia does have reasonable economic grounds for negotiating transition periods for some of its sectors. One argument that is likely to be persuasive is that some industries that were traditionally oriented to the Soviet market have not been able to gain a share of alternative markets because the necessary transport infrastructure is not yet in place. Therefore, for selected industries whose export potential is currently constrained by high transport costs, a transition period based on the planned development of the Silk Road transport corridor might be acceptable.

INTERNATIONAL TRADE
56 GEORGIAN ECONOMIC TRENDS – 1998 No.3
Box 6.1 STRATEGIES FOR ACCESSION TO THE WTO
In July Kyrgyzstan became the first country in the former Soviet Union to successfully complete its negotiations on WTO accession. In many ways Kyrgyzstan still lags a long way behind other transition economies1, in terms of both its degree of economic development and its progress on general economic reforms. However, according to a statement from the WTO secretariat, “the process of accession has been greatly accelerated by the willingness of the Kyrgyz Republic to bring its economic and trade regime into conformity with WTO rules and obligations as rapidly as possible, by putting in place the necessary implementing legislation prior to accession”. Kyrgyzstan’s successful negotiations, and Mongolia’s accession last year, demonstrate that the main task that transition economies face in order to accede early to the WTO is to keep their applications simple. Both Kyrgyzstan and Mongolia focused their efforts on finding acceptable solutions to technical problems, and avoided adopting negotiating-positions to which existing member countries would have objected. Other ex-Soviet countries’ accessions have been delayed because of protracted negotiations over their conditions of entry. In particular, Lithuania and Estonia have not yet completed their negotiations, despite having undertaken such extensive economic reforms that they are being seriously considered for entry to the European Union. The problem that they face is that their negotiating positions are unrealistic, as it causes no harm to existing members if an applicant’s accession is delayed. Existing members welcome new WTO members for political reasons, but only if they comply strictly with the WTO’s existing requirements: most non-WTO countries account for such a small share of WTO trade that their membership makes practically no economic difference to existing member countries. Thus it is only very large countries such as China that have much negotiating power in their accession processes. Subsidies The WTO defines subsidies as financial contributions from government or public bodies that give benefits to producers or exporters. Unrestrained subsidies to producers can distort international trade, for example when a country's assistance to its exporters gives them an unfair advantage producers in other countries. To reduce such distortions, WTO membership obliges countries to keep state assistance within certain agreed guidelines. In certain cases WTO members are also entitled to protect their producers against subsidised exports from another country by taking actions known as “Countervailing Measures” – normally this is done by imposing special taxes on goods that have been subsidised in order to counteract the distortions that the subsidies create. This must be done in accordance with WTO procedures. The WTO classifies subsidies into four categories:
Subsidies that are given specifically to goods that use inputs produced on its territory or to exports are prohibited. “Prohibited subsidies” are not yet forbidden in practice but are being phased out: Georgia would probably need to eliminate them over a five-year period. (In the future, a member country that introduced prohibited subsidies might be fined or expelled from the WTO.)
1 The EBRD’s 1997 Transition Report gives Kyrgyzstan and Georgia almost identical marks for progress in economic reform, with Georgia slightly ahead with MLE privatisation and Kyrgyzstan slighly ahead on competition policy and development of financial institutions.

INTERNATIONAL TRADE
GEORGIAN ECONOMIC TRENDS – 1998 No.3 57
Subsidies that are given to a particular enterprise (for example to assist with restructuring) are classified as “enterprise-specific”. In general such subsidies must be given to an enterprise as a once-and-for-all package on the clear understanding that no further assistance will be given if the package fails. Subsidies that are given to producers in a particular region (to assist regional development) are classified as “regionally specific”. Such subsidies must be distributed fairly amongst enterprises in each assisted region, and the regions selected for assistance need to be selected on the basis of transparent criteria such as income per capita. Subsidies that are given to producers in a particular industry (to assist structural adjustment) are classified as “industry-specific”. Such subsidies must be distributed fairly amongst enterprises in the industry, and the need for assistance to the industry must be justified according to transparent criteria.
Member countries must provide information about all their subsidies to the WTO’s Committee on Subsidies and Countervailing Measures. In addition to the prohibitions mentioned above, many subsidies are “actionable” – in other words they can be challenged, and Countervailing Measures may be taken against them if they break the WTO rules on the distortion of trade. The rules are very detailed (and too complex to describe in GET), but are transparent and effective. In some cases a member country must make its own complaint about a subsidy; in others, it is the responsibility of the government that provides the subsidy to demonstrate that it is not harmful to trade. Some forms of subsidy are defined as “non-actionable” – in other words they are generally permitted even if they distort trade because they have other benefits. Such subsidies are carefully defined, and include subsidies for basic technological development, assistance to disadvantaged regions, and subsidies to help adapt to environmental requirements. Subsidies to agriculture are a special case and are treated differently in some respects, although the same basic principles apply to them. GEORGIA’S EXPORTS The recorded trade deficit is discussed in Chapter 2, which also provides the recorded data on aggregate exports and imports. However, it should be borne in mind that the accuracy of all sources of data on Georgian trade is highly uncertain. Therefore, in order to try to provide an accurate picture, this part of the chapter examines the underlying trends in Georgian exports (including a discussion of the developments in Georgia's main export markets). Factors such as trade through third countries, transit trade through Georgia, and non-reporting of informal trade flows affect not only Georgia's statistical data but also those of foreign countries’ governments and international agencies. On balance, Georgia's official figures generally seem to be the most accurate source of data on Georgian trade. Some international sources seem to record transit goods as exports produced by Georgia. A striking example of this is cotton, which Georgia does not produce but which is listed by some agencies as one of Georgia's major exports. Georgian trade statistics generally avoid such mistakes, though (as explained below) the level of mineral fuel exports seems to be over-stated. THE PATTERN OF EXPORTS BY PRODUCT The overall composition of (officially-recorded) Georgian exports is shown in Figure 6.1. This indicates that the strongest export growth is from the drinks, food and tobacco, metallurgical and engineering

INTERNATIONAL TRADE
58 GEORGIAN ECONOMIC TRENDS – 1998 No.3
industries. Export growth in these industries is relatively recent: separate econometric analysis of Georgia's exports since 19922 suggests that only the small ship-building sector has seen consistently strong growth over the past 5 years. On the other hand, it is only since 1996 that macroeconomic conditions have been stable so steady export growth since the early 1990s would not generally have been expected in any sector of the economy. Figure 6.1: Georgian exports, 1996 and 1997 (f.o.b. USD million)
0
10
20
30
40
50
60
70
Mineral fuels Food & tobacco Drinks Heavy industry Light industry Engineering
19961997
Source: Derived from State Department of Statistics data Figure 6.2 on the next page shows Georgia's main exports in 1997: altogether, the top 10 product-groups (at SITC 2-digit level) represent around three quarters of Georgia's total recorded exports. Mineral fuels are the largest single group, though a high proportion of these seem to be re-exports rather than from domestic production. As noted in Chapter 7, Georgian crude oil production is around 2,500 barrels/day, and even assuming that all of it was exported at world prices it would only have been worth around USD 20 million3. This suggests that the export figure includes some USD 20 million of transit oil. The export of drinks more than doubled from 1996 to 97, and this seems to reflect genuine growth in production and exports. Georgian mineral water and wine already enjoy good reputations throughout the former Soviet Union, and in addition the abundance of fresh fruit gives Georgia a comparative advantage in the production of fruit juices. Consequently exports in this product-group seem likely to continue to grow strongly.
2 GEPLAC's economic policy team’s paper on Georgian Comparative Advantages. 3 Most crude oil is exported with domestic demand for refined products being imported.

INTERNATIONAL TRADE
GEORGIAN ECONOMIC TRENDS – 1998 No.3 59
Figure 6.2: Georgia’s top 10 export product-groups as shares of total exports
Mineral fuels
Drinks
Iron and steelIron and steel products
Tea, coffee & spices
Fertilisers
Fruit & nuts
Ore
Machinery
Other
Inorganic chemicals
Source: Derived from State Department of Statistics data Exports of iron and steel (both processed and un-processed) also grew very rapidly. However, there was considerable officially-recorded growth in both imports and exports of un-processed iron and steel, and Georgia's net exports of the product-group actually fell slightly. The likeliest explanation is that scrap metal has been imported from Azerbaijan for processing at the steelworks in Rustavi, whilst elsewhere in the country Georgian iron and steel have been exported in un-processed form - perhaps from the west of the country to Turkey. More detailed information would be required to confirm this. The oil industry in Azerbaijan seems to be a secure market for Georgian-processed iron and steel, but problems with energy shortages and quality control seem likely to have affected Georgia's iron and steel exports. The transport engineering sector (not yet one of the top 10 exports) seems export-oriented: export growth seems likely to continue, as a number of export orders have been reported following foreign investment in various plants. The sector includes ship-building, light aircraft construction and motor-parts manufacturing activity; such diversity makes it less vulnerable to sudden economic changes than if it was dependent on only one product. THE GEOGRAPHICAL PATTERN OF EXPORTS Transport links and geographical proximity are the most important determinants of Georgia's pattern of exports: Georgia's immediate neighbours (Russia, Azerbaijan, Armenia and Turkey) remain the main export markets with most other nearby countries also accounting for significant shares of Georgia's total exports4. Consequently the most useful way of assessing the different countries that Georgia exports to is to classify them according to their main direction of transportation from Georgia. In this chapter the western CIS is grouped together with Russia; the Central Asian countries are grouped with Azerbaijan; Iran with Armenia, and Bulgaria and Romania are grouped with Turkey. Chart
4 The approximate shares of 1997 exports quoted in this sub-chapter are based on Georgian officially-recorded data which seems to be the most accurate source.

INTERNATIONAL TRADE
60 GEORGIAN ECONOMIC TRENDS – 1998 No.3
6.1 displays the changes in exports to each of these groups and to the rest of the world in the period since 1996.5 Figure 6.3: Georgian exports by destination, 1996 H1 – 1998 H2 (USD million, annualised rate)
0
20
40
60
80
100
120
96H1 96H2 97H1 97H2 98H1
North CISCaspianS.E.EuropeSouthEU & other
Source: Derived from State Department of Statistics data As the chart shows, the general trend in exports to all of the neighbouring country-groups is stable but has shown no sign of growing, whilst exports to the rest of the world seem to be on a significant upward trend. (A sharp rise in exports to Russia was recorded in the second half of 1997, but the figure for the first six months of 1998 is not significantly higher than in the corresponding period of 1996 and 1997.) Exports to each of the groupings are discussed below. Exports to the north: Russia and the western CIS Russia and the western CIS countries (Ukraine, Belarus and Moldova) together accounted for some 30 per cent of Georgia's recorded exports in 1997. Since the fall of the Soviet Union, all four countries experienced continuing declines in GDP up to 1997, and any subsequent growth in output was weak. Nevertheless, Russia remains Georgia's largest single export market as a result of its size and its proximity to Georgia; Ukraine is also a significant export market, being directly accessible by sea. In comparison, the smaller economies of Belarus and Moldova are insignificant as markets for Georgian exports. Changes in Georgia's exports to Russia and Ukraine are shown in Chart 6.2.
5 All the charts in this part of the chapter show exports over this time period, measured in USD millions for 6-month periods but at an annualised rate. Thus a rate of USD 20 million for a 6-month period indicates that USD 10 million was actually imported during that time. (6-month periods rather than 3-month periods have been used because the 1996 data-set is incomplete.)
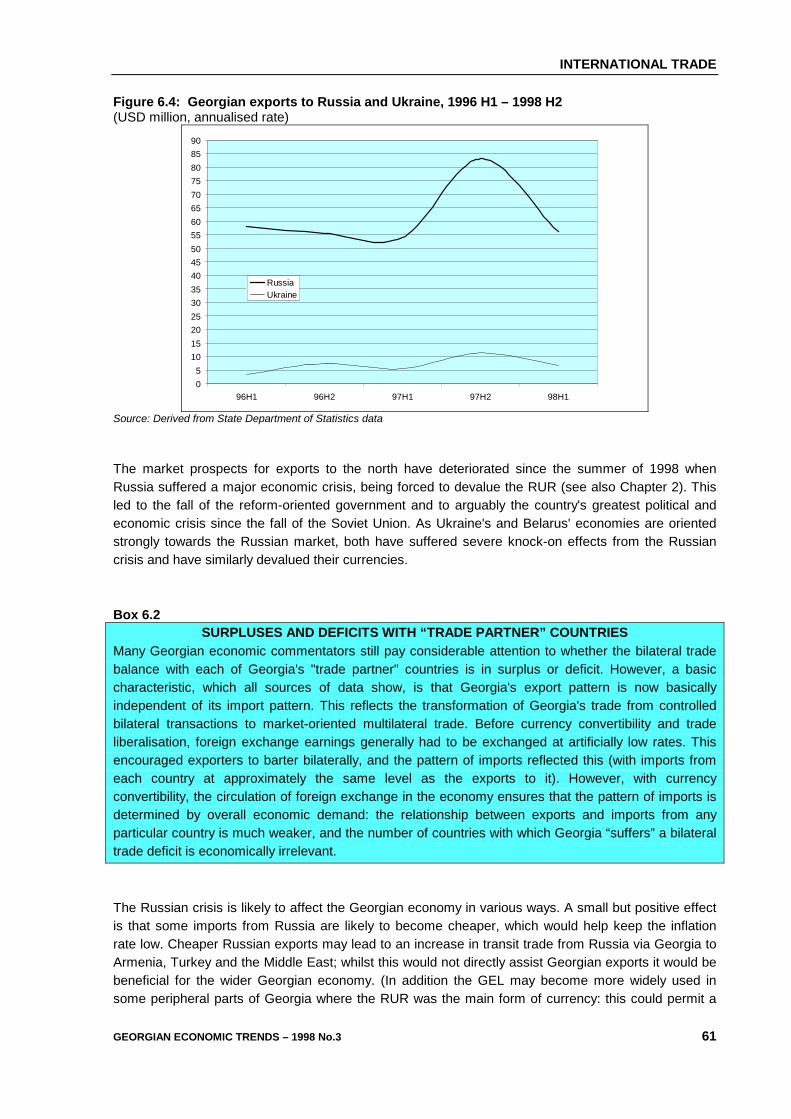
INTERNATIONAL TRADE
GEORGIAN ECONOMIC TRENDS – 1998 No.3 61
Figure 6.4: Georgian exports to Russia and Ukraine, 1996 H1 – 1998 H2 (USD million, annualised rate)
05
1015202530354045505560657075808590
96H1 96H2 97H1 97H2 98H1
RussiaUkraine
Source: Derived from State Department of Statistics data The market prospects for exports to the north have deteriorated since the summer of 1998 when Russia suffered a major economic crisis, being forced to devalue the RUR (see also Chapter 2). This led to the fall of the reform-oriented government and to arguably the country's greatest political and economic crisis since the fall of the Soviet Union. As Ukraine's and Belarus' economies are oriented strongly towards the Russian market, both have suffered severe knock-on effects from the Russian crisis and have similarly devalued their currencies. Box 6.2
SURPLUSES AND DEFICITS WITH “TRADE PARTNER” COUNTRIES Many Georgian economic commentators still pay considerable attention to whether the bilateral trade balance with each of Georgia's "trade partner" countries is in surplus or deficit. However, a basic characteristic, which all sources of data show, is that Georgia's export pattern is now basically independent of its import pattern. This reflects the transformation of Georgia's trade from controlled bilateral transactions to market-oriented multilateral trade. Before currency convertibility and trade liberalisation, foreign exchange earnings generally had to be exchanged at artificially low rates. This encouraged exporters to barter bilaterally, and the pattern of imports reflected this (with imports from each country at approximately the same level as the exports to it). However, with currency convertibility, the circulation of foreign exchange in the economy ensures that the pattern of imports is determined by overall economic demand: the relationship between exports and imports from any particular country is much weaker, and the number of countries with which Georgia “suffers” a bilateral trade deficit is economically irrelevant. The Russian crisis is likely to affect the Georgian economy in various ways. A small but positive effect is that some imports from Russia are likely to become cheaper, which would help keep the inflation rate low. Cheaper Russian exports may lead to an increase in transit trade from Russia via Georgia to Armenia, Turkey and the Middle East; whilst this would not directly assist Georgian exports it would be beneficial for the wider Georgian economy. (In addition the GEL may become more widely used in some peripheral parts of Georgia where the RUR was the main form of currency: this could permit a

INTERNATIONAL TRADE
62 GEORGIAN ECONOMIC TRENDS – 1998 No.3
gradual increase in the money supply.) On the other hand, economic and political instability in Russia is not generally in Georgia's interests. the countries’ imports from Georgia may also fall: for example, at 15 RUR/GEL the cost to a Russian of imports from Georgia is three times as high as at the start of summer when the rate was about 5 RUR/GEL. Exports of some products to the north are likely to be hit harder than others. Generally, exports of basic goods such as agricultural products might be less affected because Russia’s food requirements are unlikely to be strongly affected by the crisis. However, the demand for imported luxuries in all three countries can be expected to fall sharply; this could have a major impact on Georgia's drinks exports, and amplifies the case for action to be taken against the counterfeiting of Georgian brands of wine (see Chapter 7). However, on balance the long-term impact of the crisis on Georgia does not seem to be very significant: since becoming independent Georgia has already had to adapt to Russia's economic instability. Exports to the east: the Caspian region In 1997 Azerbaijan and the Central Asian CIS countries to the east of the Caspian accounted for about 15 per cent of Georgia's recorded exports. Azerbaijan, which alone accounted for more than 10 per cent of Georgia's exports in 1997, is experiencing economic growth of about 8 per cent per year due to the development of its oil industry. Most of Azerbaijan's total imports are related to oil, and these include Georgian inputs such as steel pipes for the construction of new facilities. Exports to Turkmenistan have fallen steadily, apparently reflecting the failure to resolve various bilateral problems related to Georgia's problems in paying for Turkmen gas imports. Figure 6.5: Exports to the Caspian region, 1996 H1 – 1998 H2 (USD million, annualised rate)
0
5
10
15
20
25
30
35
40
96H1 96H2 97H1 97H2 98H1
AzerbaijanTurkmenistanUzbekistanKazakhstan
Source: Derived from State Department of Statistics data The development of the Caspian region's energy resources is generating rapid economic growth, which seems likely to lead to rising demand for some of Georgia's food and drinks exports. Improving transport links should facilitate a rise in exports to the Caspian countries. Against this background, it is disappointing that Georgian exports to the region have not grown rapidly. Instead the first half of 1998 saw a rather surprising decline in Georgia's recorded exports to the Caspian region. It is unclear why this happened; it is possible that the fall in world energy prices led to weaker import demand in the

INTERNATIONAL TRADE
GEORGIAN ECONOMIC TRENDS – 1998 No.3 63
short term, but this cannot be the full explanation because the weak export performance pre-dates the price-fall. There is anecdotal evidence which suggests that the prospects for Georgia's exports to the region are now improving. For example, Uzbekistan is reported to be interested in placing an order for road vehicles to be manufactured by the Kutaisi motor factory (KMZ). In addition, the construction industry in Azerbaijan could become a major importer of Georgian products: the recently-privatised Rustavi Cement is reported to be planning a major expansion which would make it capable of satisfying cement demand in the entire Transcaucasus region. Exports to the south: Armenia and Iran Armenia and Iran together accounted for about 10 per cent of Georgia's 1997 recorded exports. The Armenian economy is growing at a rate of around 5 per cent, and its import demand grew rapidly in 1997. However the new government (appointed in April) seems to be tightening its macroeconomic policies in order to prevent a return to high inflation; consequently, imports are likely to grow much more moderately in the short term. Figure 6.6: Exports to Armenia and Iran, 1996 H1 – 1998 H2 (USD million, annualised rate)
0
5
10
15
20
25
30
35
40
96H1 96H2 97H1 97H2 98H1
ArmeniaIran
Source: Derived from State Department of Statistics data Considering that Georgia is adjacent, it would be surprising if Armenia's imports from it were as little as the recorded amount of USD 19 million: this represents only about USD 5 per capita and seems implausibly low. The explanation probably lies in the very fact that the two countries are adjacent: unrecorded cross-border shopping (by rail or road) seems to be widespread, and the net flow of this informal trade seems to be from Georgia to Armenia. Georgia exports relatively little to Iran, and the recorded data shows no sign of growth. This is likely to be partly because Iran's economy has been hit by low oil prices. However, like Armenia, Iran seems to be another country which in the long term could become a significant importer of Georgian food. Exports to Georgia's western neighbours: Turkey and south-east continental Europe About a quarter of Georgia's 1997 recorded exports went to Turkey and south-east continental Europe (notably Bulgaria). The economies of these countries seem to be stable, and their demand for imports

INTERNATIONAL TRADE
64 GEORGIAN ECONOMIC TRENDS – 1998 No.3
is likely to continue to expand. Furthermore, the various improvements in transport links with Georgia (see Chapter 5) can be expected to give a particular boost to Georgia's exports to these markets as transport capacities increase and costs fall. Figure 6.7: Exports to Turkey and Bulgaria, 1996 H1 – 1998 H2 (USD million, annualised rate)
0
5
10
15
20
25
30
35
40
96H1 96H2 97H1 97H2 98H1
TurkeyBulgaria
Source: Derived from State Department of Statistics data The Turkish economy is expected to continue growing at around 5 per cent a year, with overall import demand growing at between 5 and 10 per cent a year. According to the SDS' June report, Georgia's recorded exports to Turkey rose to such an extent that Turkey overtook Russia as Georgia's biggest export market in the first six months of the year. However, the figure has since been revised down from USD 28 million to only USD 10 million; this is a dramatic indication of the uncertainty about the level of Georgia's exports. Bulgaria accounted for around 4 per cent of Georgia's exports in 1997, despite suffering an economic crisis (which saw a 15 per cent in GDP in 1996-97); its economy has now been stabilised and import demand is expected to grow strongly. Although Georgia's recorded exports to Bulgaria fell rather surprisingly in 1998 Q1, recorded exports in 1998 Q2 were much higher which tallies with Bulgarian port officials' reports of a large increase in shipments from Georgia. This suggests that Georgia's exports to Bulgaria are now responding to the increase in import demand. Georgia's recorded exports to Romania have been negligible over the past 2 years, though in the past exports have been significant (exceeding USD 2 million in the first six months of 1996, for example). However Georgia's exports to Romania seem certain to pick up following the establishment of the sea link between Poti and Constanta – see also the coverage of the Black Sea ports in the Infrastructure part of Chapter 5. Exports to the rest of the world Other countries - mainly in western Europe and north America - accounted for around 20 per cent of Georgia's 1997 recorded exports. As Chart 6.6 shows, most of these go to the EU, Switzerland and the United States. The chart also indicates the level of recorded exports to the island of Anguilla, which is a British Tax Shelter: the recorded statistic was significant in 1997, but seems likely to refer to capital

INTERNATIONAL TRADE
GEORGIAN ECONOMIC TRENDS – 1998 No.3 65
transfers rather than actual exports6. Consequently exports to Anguilla are shown separately from those to other countries: Figure 6.8: Exports to the EU, Switzerland, USA and the rest of the world, 1996 H1 – 1998 H2 (USD million, annualised rate)
0
5
10
15
20
25
30
35
40
96H1 96H2 97H1 97H2 98H1
E.U.U.S.ASwitzerlandOtherAnguilla
Source: Derived from State Department of Statistics data Of the more distant of Georgia's export markets, the EU remains the most important. Growth in Georgia's exports to the EU has been moderate over the past two years, but most countries in western Europe are now experiencing increases in their economic growth rates following periods of below-trend GDP growth.7 When industrialised economies move from below-trend to above-trend growth their import demand usually grows particularly strongly, and this should assist Georgian exports to most west European countries over next year or two. On the other hand, the United States has already experienced above-trend economic growth for several years - this is part of the reason for the strong growth in its imports from Georgia. Its economy now seems to have reached the stage where its overall demand for imports is likely to grow relatively slowly. However, the growing number of commercial links between Georgia and the US seem likely to sustain the growth: for example, according to one report the Kutaisi aircraft plant has received an export order from the US for 100 light aircraft. Georgia exports very little to east Asia and Latin America (where many countries have suffered currency crises or are in danger of doing so). Consequently Georgian exports are unlikely to be significantly affected by the problems in those regions. COUNTRY SHARES OF THE GEORGIAN MARKET FOR IMPORTS On the import side, statistics can be distorted by the fact that a lot of imports arrive via third countries. For such trade, the Georgian records of countries of origin are not always accurate but can nevertheless be helpful for constructing an accurate picture. For example, a high proportion of imports that are recorded by Georgia as coming from the United Arab Emirates seem to be consumer goods that originate from east Asia and are then bought from wholesale markets in Dubai. This helps to
6 British Tax Shelters are islands where some companies register their headquarters to avoid paying tax; actual trade with them tends to be very low but financial transactions (capital flows) can be high. In recent years Georgia has “imported” from various British Tax Shelters, suggesting inflows of capital; correspondingly, exports to British Tax Shelters are likely to be outflows of capital. 7 Trend GDP growth is the rate of growth where the level of employment is stable: below-trend growth leads to falling employment, and above-trend growth to rising employment. In industrialised economies the trend level is considered to be fairly stable at between 2 and 3 percent, but in other economies it is much more difficult to judge and is generally higher.

INTERNATIONAL TRADE
66 GEORGIAN ECONOMIC TRENDS – 1998 No.3
explain the surprisingly low proportion of recorded imports from Japan and Korea, and provides an indication of actual level of imports from east Asia. Inevitably, mirror trade statistics from Japan and Korea do not provide any indication of the volume of such trade. More generally, Georgian records of what actually arrives are more likely to be accurate than exporting countries' records of export orders. For example, British statisticians report a very low level of British exports to Georgia; Georgia's records of imports from Britain are higher and seem to be a better reflection of reality. Chart 6.7 illustrates the shares of the Georgian market in the 12-month period up to the end of June 1998. Figure 6.9: Composition of the Georgian market for imports, 1997
Turkey
Russia
Azerbaijan USA
Great Britain
Ukraine
Germany
Bulgaria
Italy
Others
Romania
Source: Derived from State Department of Statistics data As the chart shows, Georgia's imports come from a diverse mixture of countries. Although the three leading exporters to Georgia are all adjacent to it, imports from more distant countries are also important. The relatively large share of industrialised countries (notably the United States, the United Kingdom, Germany and Italy) reflects Georgian demand for consumer products from these countries which can be transported to Georgia relatively cheaply. In comparison, a high share of Georgia's output has high transport costs in proportion to its value, which is part of the reason why its own exports are so concentrated on neighbouring markets.

CHAPTER SEVEN: PRIVATISATION AND PRODUCTION
GEORGIAN ECONOMIC TRENDS – 1998 No.3 67
PRIVATISATION The second quarter of 1998 saw several important developments in the privatisation of the medium and large enterprises (MLE). The Ministry of State Property Management (MSPM) established a strategy for the privatisation of the electricity sector. It began announcing tenders for energy sector enterprises, including majority shareholdings of the Tbilisi electricity distribution company (Telasi) and the Tbilisi gas distribution company (Tbilgazi). It also started to prepare for the privatisation of the telecommunication sector. Unfortunately there have been problems in finalising the privatisation of two of the largest enterprises, Rustavi Metallurgy and Chiatura Manganese. Failure to resolve these problems would be a major interruption to the progress of MLE privatisation. MEDIUM AND LARGE ENTERPRISE PRIVATISATION Corporatisation and approval for privatisation The Ministry established 2 new joint stock companies (JSCs) in the agriculture and social sectors, and liquidated 47 JSCs most of which were in the agriculture and food sector (mainly flour mills and bread factories). The liquidations undertaken at the request of the enterprises with the support of the Ministry of Agriculture and Food: instead of being privatised as enterprises the assets will be privately managed on a hire-purchase basis. In addition Poti port and two oil product distribution companies were removed from the list of JSCs to enable them to be re-structured1. Table 7.1: Corporatisation of MLEs by Sector (MSPM Classification), as of 1st July, 19982 (Number of MLEs)
Sector Approved Established Established in 1998
Manufacturing 192 173 2
Mining and chemicals 31 25 0
Bread products 61 22 0
Agriculture and food 383 318 5
Architecture and construction 219 210 3
Retail and Wholesale Trade 81 68 1
Oil products 49 25 0
Gas 57 42 7
Transport 116 104 4
Social sphere 49 42 1
Energy sector 52 86 18
Poti and Batumi Ports 2 0 0
Total 1,292 1,115 41 Source: Ministry of State Property Management. During the second quarter the MSPM did not approve any MLEs for privatisation, and on 1 July 1998
1 Under Georgia’s procedure for privatisation, state assets are either established as corporate entities (JSCs) or liquidated. Removing enterprises from the list of JSCs indicates that their assets are to be re-valued and possibly re-structured before being re-constituted as JSCs. 2 The first column gives the number of enterprises approved for privatisation, and in the second those that have actually been valued and established as joint-stock companies. It does not represent enterprises actually privatised. The numbers in the second column can exceed those in the first since some enterprises are split up when being corporatised. MSPM classifies enterprises according to the Ministry or Department that was responsible for them under the Soviet system.

PRIVATISATION AND PRODUCTION
68 GEORGIAN ECONOMIC TRENDS – 1998 No.3
the total number approved (including those not yet corporatised, state-owned JSCs and JSCs that have been privatised) still stood at 1,292. According to GET’s preliminary calculations using the MSPM’s database, 80 per cent of JSCs have been privatised3. The 20 per cent that are still owned by the state include energy-sector enterprises and JSCs that have only recently been corporatised. With the privatisation of the electricity sector now underway, the privatisation of MLEs seems to be entering its final phase. The sectoral breakdown of the privatised enterprises is not yet available and will be published in the next edition of GET. Privatisation by cash auction Table 7.2: Results of the First 32 Privatisation Cash Auctions
Cash Auction Number
Number of Shares Offered
Number of Shares Sold %
1 253,704 169,984 67.02 1,514,338 229,682 15.23 1,799,276 79,696 4.44 4,648,050 63,814 1.45 3,922,480 28,758 0.76 2,702,161 1,902 0.17 1,854,841 34 0.0028 6,300,775 518 0.019 19,096,540 62,512 0.310 10,833,034 33,038 0.311 26,811,058 37,114 0.112 6,241,759 0 0.013 18,320,003 2,480 0.0114 6,031,247 37,694 0.615 12,899,441 4 0.0000316 15,747,240 115,514 0.717 4,429,787 0 0.018 10,053,901 6,007 0.0619 21,522,431 35,632 0.16620 74,708,476 39,488 0.05321 9,448,624 606 0.00622 22,069,462 1 0.00000523 157,068,194 15,760 0.0124 16,849,596 44,056 0.2625 22,397,059 1,116 0.00526 163,973,012 586,525 0.35827 18,492,776 87,501 0.47328 45,977,461 252,971 0.55029 12,900,761 86,362 0.66930 15,204,846 42,702 0.28131 18,608,737 32,074 0.17232 16,048,090 200 0.001
Total 768,729,160 2,093,745 0.3 Source: Ministry of State Property Management There has been almost no change in the use of cash auctions to privatise MLEs. In general,
3 The State’s share-holding in part-sold companies varies a lot. GET defines an enterprise as “privatised” if 51 per cent or more of its shares have been transferred to private ownership.

PRIVATISATION AND PRODUCTION
GEORGIAN ECONOMIC TRENDS – 1998 No.3 69
shareholdings in JSCs are still being initially offered at a price of 150 per cent of their nominal (book) value, which usually far exceeds their commercial value. In a few recent cash auctions some shares have been offered with a reserve price of 100 per cent of their nominal value, but this has made practically no difference: as Table 7.2 shows, the amount of shares sold at cash auctions remains insignificant – only 0.3 per cent of those offered. Although it has been obvious for a long time that prices based on nominal values are much too high, Georgia’s privatisation law still obliges the MSPM to hold cash auctions before it can cut the price by 50 per cent or auction the shares without any reserve price. Privatisation by "investment tender" Georgia is persisting with the use of “investment tenders”, which set the new owners of privatised enterprises a number of conditions – typically clearance of debts; minimum levels of capital investment, production and employment; and in some cases specific commercial activities. Setting such obligations restricts the new owners’ commercial freedom and therefore undermines one of the main economic benefits that privatisation is supposed to bring. (See Box 7.1.) Nevertheless, the MSPM has successfully completed several investment tenders announced in 1998Q1. The Russian firm "Aviaton" won the tender for 91.4 per cent of the shares in the Kutaisi Aviation Repairs factory, and is to pay GEL 10,000 for its shareholding. It must also fulfil an investment programme that was specified as a condition of the tender; this includes USD 2 million investment in the assembling line, USD 500 thousand on staff training, reconstruction of the premises and the assembly of 2 aircraft. Aviaton must also retain the number of employees at its present level and later increase it by 100. A subsidiary of the Hyundai Group4 has won the tender for a 99 per cent shareholding in the Poti Shipbuilding plant, for which it is to pay the equivalent of USD 101,000. In addition the terms of the tender oblige it to pay GEL 60,000 to the Georgian state budget and GEL 80,000 to Poti’s local budget, to invest USD 9 million to enable the plant to produce small and medium-sized vessels, and to cover the GEL 700,000 debt of the enterprise. Checks on whether the conditions are being fulfilled will be carried out every 6 months, with fines of up to GEL 567,000 for violations. The enterprise’s hydrotechnical premises (land and water) remain in state ownership and are being leased to the owner. If it succeeds in collecting any of the GEL 13 million debts that are owed to the plant, it will have to pay them to the state budget (which suggests this will be a low managerial priority). On 5 May Ocean Sea Products Ltd. (registered in the British Virgin Islands) won the tender for 96.5 per cent of "Potitevzi" (the Poti fishing JSC) whose assets are valued at USD 4.64 million. Ocean Sea Products will pay the equivalent of USD 450,000 for the shareholding but must clear the JSC’s debts, maintain the main production activity in the enterprise, and invest at least USD 1 million within a year in repairing the enterprise’s fleet of ships.
4 The name of the subsidiary (as transliterated from Georgian news agency reports) seems to be Darlingwart Limited, but the original English spelling of the name is unclear.

PRIVATISATION AND PRODUCTION
70 GEORGIAN ECONOMIC TRENDS – 1998 No.3
Box 7.1 THE IMPACT OF CONDITIONS OF SALE ON PRIVATISATION RECEIPTS
In some cases of privatisation, certain commercial obligations are economically justified as a condition of sale. For example, it is normal to require natural monopolies to keep their prices within an agreed range; it can also be reasonable to require owners of network industries to increase the areas of their networks because this can be of great benefit to the wider economy. However, as a general principle, the owners of private enterprises should be free to decide their levels of investment, production, training and employment in order to maximise long-term profits. Conditions of sale which oblige particular targets to be met are at best irrelevant (in the sense that the enterprise would have taken the same action anyway); in many cases they are counter-productive because they constrain the enterprise’s potential profitability. For example the proposed requirement, that Georgian Airlines should have two European-standard 100-seater aircraft within 2 months of being privatised, would represent a costly obligation; it is just the exactly of decision that should be left to the buyer. Conditions of sale do not always deter buyers: an enterprise may still be attractive enough if its sale price is low enough in relation to its profitability. However, potential investors certainly take the conditions of sale into account in deciding whether to buy (and, in the case of an auction, how much to bid). In effect, a potential investor adds the likely cost of meeting the conditions to the sales price and compares this with the potential profit. Therefore setting conditions tends to reduce the price that investors are prepared to pay for an enterprise. As mentioned in Chapter 3, the unexpectedly high level of privatisation receipts in the first half of this year partly offset the shortfall in tax revenues. However, a more orthodox approach to sales – demanding prompt payment, and maximising the value of the enterprises by avoiding unnecessary commercial conditions – could be much more effective in increasing the flow of privatisation receipts. Such an approach would also tend to avoid the sort of problems experienced in the privatisation of Chiatura Manganese: an investor who is financially strong enough to pay immediately for his shareholding is likely to be able to invest in the enterprise. On the other hand, a sale that permits payment in small instalments would tend to attract financially weak investors who may find themselves unable to make the enterprise successful. As happened in 1998Q1, a Georgian individual won one of the international tenders held during the second quarter: the director of "Laguna Vere" (Tbilisi’s main swimming pool complex) won the tender for the 47.3 per cent of the shares in the JSC with a bid equivalent to USD 251,503; this compares with the reserve price of USD 145,678 and a competitor’s bid of USD 170,000. In addition he must pay off a debt of USD 297,728 and attract a further USD 700,000 investment by the end of year 2000. In the event of the complex being put up for sale, the Tbilisi municipal authority will have an option to buy the complex. Several investment tenders for majority shareholdings in energy and construction companies were the also announced by the MSPM during 1998Q2. Of these the most important is the tender for 75 per cent of the shares in the Tbilisi electricity distribution company Telasi which is covered in the Electricity Sector Privatisation section of this chapter. The announcement of a tender for 76 per cent of the shares in Tbilisi’s gas distribution company Tbilgazi also represented a major step forward. The starting price of the shareholding was the equivalent of USD 6 million in national currency. Under the many conditions set out in the tender, Tbilgazi should continue to supply Tbilisi with gas and spend at least USD 30 million within 2 years in rehabilitating the network and safety system; see also the gas section in the production part of this

PRIVATISATION AND PRODUCTION
GEORGIAN ECONOMIC TRENDS – 1998 No.3 71
chapter. The privatisation of other gas distributors has been suspended at the World Bank’s request. The MSPM is also privatising 27 regional oil-product distributors. Majority shareholdings ranging from 51 to 97 per cent in 24 of them are being auctioned by tender; the reserve prices add up to nearly USD 1.5 million. The tenders are conditional on each buyer maintaining the level of commercial activity, covering the JSC’s debts and investing enough to continue to distribute oil products to the company’s allotted region. Seven have already been sold and the MSPM has announced a second set of tenders for the remainder. The MSPM announced similar tenders for the majority shareholdings in 5 construction JSCs. The minimum prices are 15 per cent of the JSCs’ nominal book values, which should be low enough to attract buyers. For details of the JSCs see the Construction in the Production section of this chapter. The MSPM has announced a tender for 49 per cent of the shares of Georgian Airlines with the reserve price set at USD 2.5 million (though the airline’s debts of USD 3 million must be paid off within 2 months). The airline’s assets, which are valued at USD 2.3 million, include 21 aircraft (5 TU-154, 5 TU-134 and 11 YAK-40) and technical facilities for repairing them; it is already licensed to operate 10 routes. At present the airline is wholly state-owned with 430 employees. The conditions of the tender include a minimum investment requirement of USD 12 million, staff training, installation of modern management and marketing systems, retention of 60 per cent of the staff for at least 3 years and provision of social security to laid-off members of staff as required under Georgian law. As mentioned in Box 7.1, the new owner must also ensure that within 2 months the airline has two European-standard 100-seater aircraft. Taking into account the price, debt liabilities and onerous conditions, the offer does not seem likely to attract any applicants. The MSPM has begun to prepare for the privatisation of the telecommunication system, starting by compiling information about the enterprises in the sector. The basic strategy has not yet been decided; the enterprises may be privatised one by one or sold in groups. It is expected that the experience of privatising Telasi will be taken into consideration. Privatisation of the sector will probably need some changes in the privatisation law as well, which would indicate that actual privatisation will not start until the end of 1998. However, the fact that the political decision has been taken to privatise telecommunications is a positive development which will bring revenues to the state budget, create a more commercial environment and thus facilitate its further development. Two recent major privatisations ran into difficulty after the tenders had been awarded. Although the tenders for control of Chiatura Manganese and Rustavi Metallurgy were completed, there is a danger that the sales will be aborted and that the tenders will have to be re-held. In the case of Chiatura Manganese, the Russian firm Industria was awarded the tender for the shareholding but seems to be unable to pay: consequently there is a danger that the privatisation will have to be annulled. In the case of Rustavi Metallurgy, the signing of the agreement between the MSPM and the tender winner (Metallurggazoilinvest) was delayed for 5 months. This was because of uncertainty concerning ownership of the plant’s slag-heap, which had been listed as one of the plant’s assets but turned out to be disputed. The agreement, which was eventually signed on 16 June, permits Metallurggazoilinvest to annul the contract, suspend investments and claim reimbursement if Rustavi Metallurgy loses the court case concerning the slag-heap. In both these cases, failure to privatise would be a major setback because going to tender a second time would further delay investment and modernisation. There is already anecdotal evidence that the uncertainty about the ownership of Chiatura Manganese has not only hit production but is also having serious knock-on effects on the local economy. This is an inherent risk with the “investment tender”

PRIVATISATION AND PRODUCTION
72 GEORGIAN ECONOMIC TRENDS – 1998 No.3
approach to privatisation: by (in effect) accepting a low price in exchange for long-term commercial commitments, the policy seems to have resulted in the transfer of ownership to an entity which is financially unable or unwilling to honour its commitments even in the short-term. The small amount of revenue already received from Industria does not compensate for the general damage to the Chiatura district economy which the commitments were supposed to protect. On the other hand, if Chiatura Manganese had been sold without so many conditions but for a higher price, at least the receipts to the budget would have been higher. ELECTRICITY SECTOR PRIVATISATION The MSPM, the Ministry of Fuel and Energy and other respective executive bodies have now set out their strategy for privatising the electricity sector. The key changes are the separation of regulatory functions and commercial activities, the progressive removal of state monopolies (other than over transmission), the attraction of commercial environment, and opening-up of the sector to foreign investment. These changes should lead to higher electricity production and more efficient distribution. The MSPM has contracted Merrill Lynch to manage the sector’s privatisation and find investors. Telasi (which distributes 35 per cent of total consumption) is to be privatised first. According to the government’s strategy, the 66 distribution companies currently operating in Georgia are to be amalgamated into four regional groups: Tbilisi, eastern Georgia, western Georgia and the Autonomous Republic of Achara. Majority shareholdings in the resultant larger distribution companies are then to be privatised by tender; the conditions of the tenders are expected to specify minimum levels of capital investment in the enterprises. Investors should be permitted to buy both distribution and generation companies in order to ensure security of supply, and should also have the opportunity to manage their entire distribution systems. The privatisation strategy papers seem to recognise the importance to investors of tariff levels and of the role of the Electrical Power Regulatory Commission, though there is still a lot of uncertainty about these issues. Telasi Tbilisi’s electricity distribution company Telasi has 370 thousand consumers5, and will be the first distributor to be privatised. This looks certain to go ahead as the privatisation of Telasi is one of the conditions for the release of the next tranche of the World Bank’s Structural Adjustment Credit. Before the tender was announced, Merrill Lynch and the MSPM discussed what the share offer price should be. Three options were considered: privatising the company for a symbolic (nominal) price without writing off its debts; writing off the debts and then setting a substantial reserve price, and writing off the debts and setting the sales price at the nominal value of 75 per cent of the charter capital of the company. Merrill Lynch’s view was that there should be no minimum price, since the debts exceed the value of the assets. However, the Georgian officials were opposed to privatising such a well-known company without gaining budget revenue. The final decision was a compromise between the options outlined above. 75 per cent of its shares are being offered for sale by international tender. In addition some shares will be given free to the company’s employees, and a few are to be sold to the general public. The reserve price is USD 10,375,000 (25 per cent of their book value); in addition the winner of the tender must clear the enterprise’s debts which amount to more than GEL 100 million and must invest at least USD 25 million in the enterprise. Three bidders met the 15 August 1998 deadline for registration of their interest in participating, although one of them no longer seems to be interested. The bidders’ experiences of managing electricity distribution networks will be taken into account; they had until 15 October 1998 to carry out their own technical examinations of the plant and to present their bidding proposals.
PRIVATISATION AND PRODUCTION
GEORGIAN ECONOMIC TRENDS – 1998 No.3 73
Electricity generators Electricity generating JSCs are expected to be privatised at a later stage: they would be more commercially attractive to potential buyers once the privatisation of distribution companies has created a competitive market for electricity and the transmission network has been renovated to reduce transmission losses. The majority shareholdings of the generator companies could then be transferred to their management or sold by tender. Many generators are in poor technical condition, requiring heavy capital investment. SMALL ENTERPRISE PRIVATISATION There seem to be no major obstacles in the privatisation of small enterprises, with 223 small enterprises privatised in 1998Q2. As of 1 July 1998, 11,978 small enterprises had been approved for privatisation of which 11,834 had actually been privatised. It seems that the only reason why 144 small enterprises are still unsold is that the ongoing restructuring of MLEs leads to the creation of new state-owned small enterprises that are then approved for privatisation. Enough small enterprises now seem to have been privatised to enable a competitive property market to develop. Thus, although in many cases small enterprises were originally sold to insiders, secondary sales of enterprises should eventually bring them efficient owners. Table 7.3: Small Privatisation by Sector (MSPM Classification), as of 1st July, 19986
Sector Approved Privatised % of total privatised
1 Manufacturing 345 251 2.12 Energy 33 31 0.33 Bread products 140 98 0.84 Agriculture & food industry 584 387 3.35 Construction 224 261 2.26 Trade 4,439 4,612 39.0
7 Services 4,954 4,856 41.08 Oil products 165 165 1.49 Health 747 545 4.6
10 Social sphere 246 530 4.511 Transport 101 98 0.8
Total 11,978 11,834 100.0 Source: Ministry of State Property Management The sectoral breakdown given in Table 7.3 shows that around 80 per cent of privatised small enterprises are in the trade and service sectors. According to the breakdown given in Table A7.2 of the Statistical Appendix, the regional pattern has not changed: the privatisation of small enterprises in the Autonomous Republic of Achara, where only 2 were privatised in the first half of this year, is still well behind the other regions. LAND PRIVATISATION The quantity of land in private ownership hardly changed in 1998Q2. Agricultural land privatisation seems to have progressed as far as possible, whilst the privatisation of industrial and commercial land has not yet begun.
5 The number of individuals who consume Telasi’s electricity is higher, as each “consumer mentioned here is either an enterprise or a household. 6 The number of enterprises actually privatised can exceed those approved for privatisation since some are split up during corporatisation. The total number of small enterprises, including those not approved for privatisation, is not available. Small enterprises are those with a book value of less than USD 44,000 on April 1st 1993.

PRIVATISATION AND PRODUCTION
74 GEORGIAN ECONOMIC TRENDS – 1998 No.3
It seems that the privatisation of the agricultural land is almost complete and that the very small number of commercially-viable plots that are still in state ownership will be privatised until the end of this year. Table 7.4 gives the picture of the privatisation of the agricultural land as of April 1998. Non-distributed land represents plots that have been excluded from privatisation in order to be used for particular activities such as scientific research, and plots that nobody is interested in buying because, taking into account the liability for land tax that ownership entails, income from them would be too low. Table 7.4: Land Privatisation as of 1st April, 1998
Land Category April 1, 1997 % April 1, 1998 %
Total agricultural land 2,988,600 2,991,100 Privatised 748,500 25.0 789,700 26.4 Leased 553,500 18.5 756,900 25.3 Not distributed 1,686,600 56.4 1,444,500 48.3 Arable 781,100 785,000 Privatised 412,300 52.8 431,900 55.0 Leased 235,000 30.1 255,900 32.6 Not distributed 133,800 17.1 97,200 12.4 Perennials 284,600 277,500 Privatised 190,600 67.0 185,700 66.9 Leased 37,500 13.2 31,000 11.2 Not distributed 56,500 19.9 60,800 21.9 Hayfields 148,000 140,600 Privatised 55,100 37.2 47,600 33.9 Leased 31,000 20.9 28,600 20.3 Not distributed 61,900 41.8 64,400 45.8 Pastures 1,774,900 1,788,000 Privatised 90,500 5.1 124,500 7.0 Leased 250,000 14.1 441,400 24.7 Not distributed 1,434,400 80.8 1,222,100 68.4
Source: State Department for Land Management Following the near-completion of agricultural land privatisation, the second stage of land reform envisages the creation of a land registration system and the privatisation of industrial and commercial land. The latter is still waiting for the parliament to pass the required legislation. The establishment of a land register has been hindered by lack of finance; registration is proceeding in selected regions, financed by a DEM 700,000 grant from the German government and by World Bank funds. The financing problem now seems to have been solved by the German government’s decision to provide DEM 30 million credit for this purpose. The credit will be allocated on 1 January 1999, with the announcement of a tender for the implementation of the land registration expected at the beginning of 1999. One of the conditions of the tender is that Georgian specialists should be employed as far as possible, with training to be undertaken if necessary. This condition should ensure the employment of Georgian specialists for relatively long period of time, since the establishment of the system is expected to take several years. PRODUCTION
PRIVATISATION AND PRODUCTION
GEORGIAN ECONOMIC TRENDS – 1998 No.3 75
COMPETITION POLICY AND CONSUMER PROTECTION Competition policy In contrast to the situation in most OECD countries, competition policy in Georgia seems to be more closely related to broad economic issues (such as trade and investment) than to consumer protection. For example, Georgia's accession to the WTO is one of the most important considerations. Unfair or anti-competitive behaviour often distorts trade, and therefore there is pressure on applicants to the WTO to demonstrate that they are implementing effective competition policies. However, as Box 7.2 explains, an effective competition policy has wider potential economic benefits for Georgia: competition policy is not simply an obligation that should be associated with WTO accession. Box 7.2
Does Georgia need a competition policy?
As in all transition countries, competition policy and consumer protection in Georgia is still being developed. Georgia does not yet have a fully coherent framework (for example, there does not yet seem to be a standard formal procedure for registering complaints about anti-competitive practices), but it should be noted that it is only over the past 20 years that many of the most advanced industrialised countries have fully established their own such frameworks. Because Georgia is a small open economy, the scope for unfair or anti-competitive behaviour by enterprises is more limited than in large economies: in many cases enterprises that are victimised can respond by investing in nearby countries from which they can sell to Georgian consumers. Georgian consumers only tend to be politically influential in relation to the prices of natural monopolies (even though in some cases these are still below world prices). Therefore competition policy may seem unnecessary for many Georgian consumers, as well as undesirable for some Georgian producers. On the other hand, it is clearly not in Georgia's interests for potential competitors in the Georgian market to be forced to locate abroad (or to be forced out of business) because of unfair or anti-competitive behaviour. More generally, the aim of unfair or anti-competitive behaviour is to weaken a competitor. This normally discourages investment and employment, contributing not only to higher prices (and more imports) but also to lower living standards and fewer jobs. In other words one of the victims of unfair or anti-competitive behaviour is the Georgian economy itself. Because of Georgia's legacy of industrialisation under Russian and Soviet rule, many industrial producers have found themselves in positions of "monopoly" in the narrow sense of having no competitors within Georgia. However, in the context of a small open market economy, most such monopolies should basically be seen an accident of history: they do not need to be regulated as monopolies because they face actual competition from imports, or (in a few cases such as cement) face potential competition which discourages them from charging monopoly prices. The basic principles of Georgian competition policy reflect this situation, and a number of laws have been passed in recent years which empower various authorities to take action against organisations which are engaged in unfair or anti-competitive behaviour. This general approach is sensible as it should focus action towards identifiable cases where markets are being manipulated, and away from technical monopolists who in reality face competition. The focus of action against unfair and anti-competitive behaviour is also sensible in the context of Georgia's attempts to attract investment. Although many officials still seem interested only in large-scale investments, the experience of other countries shows that economic growth is more stable if it is based on the development of a large number of small and medium-sized enterprises (SMEs). Whilst

PRIVATISATION AND PRODUCTION
76 GEORGIAN ECONOMIC TRENDS – 1998 No.3
monopolistic behaviour is unlikely to be a major concern to SMEs in Georgia, there seem to be cases where unfair and anti-competitive behaviour has actively deterred investment. One example is where a small-scale investor was apparently stopped from opening a shop after insiders used their influence over the local authority to prevent him from getting the necessary license. In such cases corruption could also be blamed, but in practical terms it is generally easier to take legal action against unfair or anti-competitive behaviour: the corruption behind a decision is usually difficult to prove, but the unfair or anti-competitive nature of a decision can often be demonstrated using objective criteria. Institutional involvement in competition policy The overall competition policy regime that has evolved in Georgia seems to consist of three distinct forms of authority. Firstly, various government ministries retain both formal powers and informal influence over sectors of the economy for which they have been assigned responsibility. In addition, regional and local authorities retain influence over sectors of the economy within their geographical areas: they sometimes intervene in local markets on their own initiative. Finally, there is the State Anti-Monopoly Service (AMS). Various government ministries retain formal responsibilities concerning the State's involvement in production and commerce. This involvement includes: formal control over the management of state-owned entities; market influence through their control of public procurement; regulatory control over the private sector such as the discretionary power to require and issue/withhold various licenses; and the capacity to use (or abuse) their influence within the government to propose intervention. As the section on subsidies in Chapter 6 explains, such intervention can promote or hinder competition. Regional and local authorities retain a considerable degree of influence over economic and commercial activity within their geographical areas. Like central government ministries, these authorities have the capacity to exercise regulatory control over the private sector; they collect local taxes and control local expenditure, and can also use their political influence to lobby the central government for special regional or local economic assistance. The Anti-Monopoly Service was established in 1997 to investigate, and if necessary take legal action against, the abuse of dominant position. As the scope of this responsibility is potentially very wide-ranging, it was initially unclear what the AMS' approach should be. The AMS has quite limited resources and is only one of several authorities (including government ministries) that have varying degrees of responsibility and influence regarding policy towards natural monopolies and possible cartels. As the AMS' function in such work is basically technical, there is a danger of its opinions being over-ruled by other authorities that tend to have more political influence. Consequently, when the AMS was still being established, some western policy advisors were concerned that it would become embroiled in wrangling over control of natural monopolies and would ultimately perform no useful function. However the AMS seems to have decided to put considerable effort into cases where no other authority is taking action against abuse of a dominant position, or where another authority seems to be involved in such abuse. At present, the AMS seems to be most actively involved in cases where the mis-labelling of products results in unfair competition. For example, in the Samtrest case (see Box 7.3) the AMS argues that the action of the authorities is undermining fair competition. In separate cases the AMS has acted to stop Georgian abuse of trademarks - for example by dissuading distillers from using counterfeit Stolichnaya brand labels to falsify their output. In addition, the AMS is involved in related work including the drafting of a new law on the labelling of cigarette packs.

PRIVATISATION AND PRODUCTION
GEORGIAN ECONOMIC TRENDS – 1998 No.3 77
Box 7.3 The AMS' action against Samtrest
The AMS' most high-profile case in recent months has been its action against the Samtrest state agency, which has licensing powers concerning wine production. At the end of March the AMS took legal action aimed at annulling an agreement that Samtrest had made granting Moldovan wine bottling plants the right to use Georgian trademarks for their wine. Ostensibly, the agreement is of minor economic importance because it permits the Moldovan plants to use Georgian trademarks for wine produced using imported Georgian grapes. In that sense the agreement is beneficial in facilitating the export of Georgian grapes. However, the AMS is concerned that, in practice, the agreement unfairly undermines the capacity of Georgian wine producers to compete in export markets. The reason for this is that Moldova is one of the countries (the others being Bulgaria and Hungary) where wine traders are understood to be widely involved in the false labelling of low-quality wines using Georgian trademarks that have retained a high reputation in many east European countries. The AMS decided that it should become involved because the unfair competition caused by falsification is having a major commercial impact on producers of the genuine Georgian wines. The AMS' legal suit against Samtrest seems to have been based on the charge that Samtrest had exceeded its competence and had acted in violation of the Paris and Madrid Conventions on the violation of geographical trademarks. This charge was strenuously denied by the Ministry of Agriculture (which has formal responsibility for Samtrest) and was rejected in a court hearing held on 20 May. The AMS is now calling for criminal action against Samtrest officials on the grounds that they have abused their authority by acting against the national interest. Consumer protection As indicated at the beginning of this sub-chapter, consumer protection is not a major consideration in competition policy and therefore tends to be treated quite separately. It seems that the result of this separation is not that consumers are left unprotected, but rather that various authorities take action against producers or retailers of products that they consider to be sub-standard. Georgia seems to lack adequate facilities for carrying out scientific tests on the quality of consumer goods, and this leads to uncertainty about the quality of many consumer goods. Consequently officials involved in regulation have a high degree of discretion over the enforcement of standards, and this creates opportunities for corruption. In addition, consumer protection sometimes seems to have been used as an excuse for taking actions whose main effect is to reduce competition. For example, in March 1997 the Tbilisi authorities closed down and demolished a large number of street kiosks, claiming that such action was justified by evidence that kiosks were selling sub-standard goods. Whilst some form of action may have been justified, a law that took account of commercial fairness and competition considerations would not have allowed for the destruction of the kiosks. Even if every kiosk owner had been guilty of selling sub-standard goods, the destruction was unfair because it caused disproportionate hardship for the kiosk owners themselves and was also anti-competitive because it had the unnecessary long-term effect of constraining competition. If repeated today, such actions would seem to represent an abuse of authorities' powers: as in the example of the shopkeeper discussed above, threatened kiosk owners could now have grounds for calling for legal protection. PRODUCTION

PRIVATISATION AND PRODUCTION
78 GEORGIAN ECONOMIC TRENDS – 1998 No.3
Agriculture Agricultural production seems to have improved markedly in the last few years. Productivity and yields are still low but have been rising thanks to the growing affordability of basic agricultural inputs, and more recently by technical assistance projects and increasing access to credit lines. According to press reports, the Ministry of Agriculture expected around 530 thousand hectares of arable land to be cultivated this summer. According to GET's calculations this was some 5 per cent more than in 1997: therefore, with the economic conditions for farming continuing to improve, agricultural output seemed likely to increase further. However, cutbacks in planned government expenditure on agriculture may have adversely affected production; the rather sketchy picture that we have been able to get from press reports suggests mixed results. Tea production, which has received extensive assistance, is likely to have improved substantially and press reports indicate that output might be some 40 per cent higher than last year. However, several reports suggest that the grain harvest is worse than last year with yields considerably lower in several regions including Kakheti. Official statistics from the first half of the year, which of course pre-date the main harvest, are also worrying for the agricultural sector whose recorded nominal output was 5 per cent but whose prices rose by 12 per cent – a decline in real terms of 7 per cent. Energy: Electricity The second quarter of 1998 saw no serious improvements in the performance of electricity sector. Although the production and total supply of electricity to the network has increased compared with the second quarter of the 1997, this was mainly thanks to favourable weather which boosted production at the hydroelectric plants (whose share of output is highest in this season). Domestic output increased by 6 per cent compared with the first quarter, to a level that was 27 per cent higher than in 1997 Q2. This was due to increased output from the hydroelectric plants, in particular Enguri Hydro power plant which produced approximately 5.5 times more electricity than in 1997 Q2 when it was under repair (see Table A7.3 of the Statistical Appendix). Figure 7.1: Electricity Production
-500
0
500
1000
1500
2000
2500
3000
Q11995
Q2 Q3 Q4 Q11996
Q2 Q3 Q4 Q11997
Q2 Q3 Q4 Q11998
Q2
GW
h Total supply to networkPrivate and leased generationNet importsState generation
Source: Data from Sakenergo
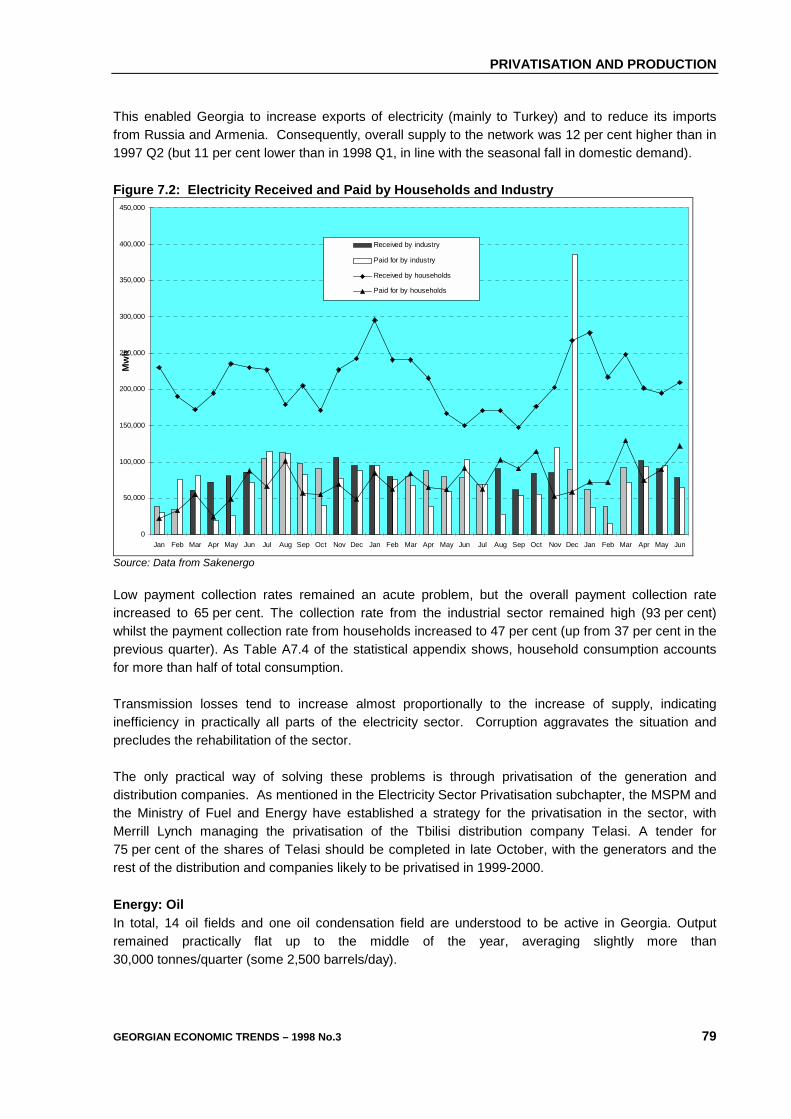
PRIVATISATION AND PRODUCTION
GEORGIAN ECONOMIC TRENDS – 1998 No.3 79
This enabled Georgia to increase exports of electricity (mainly to Turkey) and to reduce its imports from Russia and Armenia. Consequently, overall supply to the network was 12 per cent higher than in 1997 Q2 (but 11 per cent lower than in 1998 Q1, in line with the seasonal fall in domestic demand). Figure 7.2: Electricity Received and Paid by Households and Industry
0
50,000
100,000
150,000
200,000
250,000
300,000
350,000
400,000
450,000
Jan Feb Mar Apr May Jun Jul Aug Sep Oct Nov Dec Jan Feb Mar Apr May Jun Jul Aug Sep Oct Nov Dec Jan Feb Mar Apr May Jun
Mw
h
Received by industry
Paid for by industry
Received by households
Paid for by households
Source: Data from Sakenergo Low payment collection rates remained an acute problem, but the overall payment collection rate increased to 65 per cent. The collection rate from the industrial sector remained high (93 per cent) whilst the payment collection rate from households increased to 47 per cent (up from 37 per cent in the previous quarter). As Table A7.4 of the statistical appendix shows, household consumption accounts for more than half of total consumption. Transmission losses tend to increase almost proportionally to the increase of supply, indicating inefficiency in practically all parts of the electricity sector. Corruption aggravates the situation and precludes the rehabilitation of the sector. The only practical way of solving these problems is through privatisation of the generation and distribution companies. As mentioned in the Electricity Sector Privatisation subchapter, the MSPM and the Ministry of Fuel and Energy have established a strategy for the privatisation in the sector, with Merrill Lynch managing the privatisation of the Tbilisi distribution company Telasi. A tender for 75 per cent of the shares of Telasi should be completed in late October, with the generators and the rest of the distribution and companies likely to be privatised in 1999-2000. Energy: Oil In total, 14 oil fields and one oil condensation field are understood to be active in Georgia. Output remained practically flat up to the middle of the year, averaging slightly more than 30,000 tonnes/quarter (some 2,500 barrels/day).

PRIVATISATION AND PRODUCTION
80 GEORGIAN ECONOMIC TRENDS – 1998 No.3
Figure 7.3: Georgian oil production 1996 Q1 – 1998 Q2 (Quarterly output, ‘000 T)
0
10
20
30
40
50
60
96Q2 97Q2 98Q2
Source: Derived from State Department of Statistics data Around 1,600 b/d of Georgia's oil output is produced west of Rustavi (Kvemo Kartli) and in Ninotsminda (Samtskhe-Javakheti) by a joint venture between Britain's JKX and the Georgian state oil producer Saknavtobi7. In addition some 800 b/d is produced in the Samgori area of Gardabani district (Kvemo Kartli) by the Ioris Valley JV between Saknavtobi and Switzerland's National Petroleum. A third JV between Saknavtobi and USA's Frontera Resources, called Frontera Eastern Georgia, is starting small-scale production in Kakheti: the agreed minimum output level for the first 18 months of production is about 150 b/d. Press reports indicate that overall oil output in the first half of this year has been some 20 per cent below expectations, with the Ministry of Fuel and Energy blaming the shortfall on Ioris Valley. It is possible that, with oil prices having dropped, the relatively high cost of producing oil from already-depleted fields has made the expected increase in output unprofitable. In addition to oil production there is a limited amount of exploration and development activity. JKX is exploring a block of the Black Sea shelf and is also drilling in the Ninotsminda region in cooperation with a JV involving a Canadian oil company. The Kakhetis Navtobi (or "Kakheti Oil") JV between Saknavtobi and a subsidiary of Ramco is exploring the Kakheti region, as is Frontera Eastern Georgia. The Kakheti region seems to contain most of Georgia's estimated onshore oil reserves: Dedoplistskaro district in the south-eastern corner of the country is reported to contain 300 mT of oil, with a further 90 mT onshore in other fields and some 200 mT offshore8. Although a lot depends on geological factors, the output from a typical 300 mT field might be expected to be around 300,000 b/d over 20 years which would be of major benefit to Georgia's economic stability - see Chapter 2.
7 also known by the Russian name Gruzneft. 8 It is unclear whether these figures refer to "proven", "probable" or "possible" reserves, using international oil-industry terminology.

PRIVATISATION AND PRODUCTION
GEORGIAN ECONOMIC TRENDS – 1998 No.3 81
In the downstream (refining) sector, USA's McOil has started production from its new USD 3 million refinery at Sartichala in Gardabani district near Ioris Valley's Samgori oilfields. At present the refinery produces only heavy petroleum products (gasoil/diesel, naphtha and mazout9), but there are plans to upgrade the plant to produce high-octane gasoline which is a more valuable commodity and to expand the capacity from the present 1,800 b/d in order to refine imported crude oil from the Caspian region. Meanwhile Georgia's other refinery at Batumi (Achara), with a capacity of about 10,000 b/d, is due to be modernised by a Japanese-Austrian group (Marubeni-JGC-Transandina). In its present dilapidated condition the Batumi refinery is not commercially viable: output from it is said to be worth only half as much as the inputs that it uses. Energy: Coal As Figure 7.4 shows, coal output seems to have stabilised at around 3,000 tonnes/quarter (compared with almost no production in the first three quarters of last year). Production is from one of the four coal mines in the Tkibuli district of northern Imereti: according to press agency reports the three idle mines are now being renovated and it was hoped that output would rise to 4,500 tonnes/quarter later by the second quarter. However, one of the main constraints on production appears to be low demand which is likely to have become a problem from Q2 onwards: the mines seem to be dependent on sales to the Fero (ferro-alloys) plant at Zestaphoni, whose output is likely to have been suffered as a result of the abortive sale of Chiatura Manganese to Industria. Figure 7.4: Georgian coal production 1996 Q1 – 1998 Q2 (Quarterly output, ‘000 T)
0
2
4
6
8
10
12
96Q2 97Q2 98Q2
Source: Derived from State Department of Statistics data Energy: Gas According to one report Georgia has an active gas "field": this seems to refer to the associated gas (that is, gas produced as a by-product of oil production) which is now being used to fuel a small private power station near Sagarejo in Kakheti. With the minor exception of the Sagarejo output, Georgia seems to import its gas supplies via Russia. For most of the post-Soviet period the origin of most of the supplies was Turkmenistan, but the supply
9 Mazout is low-quality gasoline

PRIVATISATION AND PRODUCTION
82 GEORGIAN ECONOMIC TRENDS – 1998 No.3
was cut off in March 1997 because of a dispute between Georgia and Turkmenistan over the terms of payment. The absence of gas has contributed significantly to the chronic shortage of electricity in Georgia, with many households now having switched to electricity instead of gas for cooking and heating. The privatisation of Tbilisi's gas distributor Tbilgas could be a significant step in reversing this process: under the terms of the tender Tbilgas will supply gas to an increasing number of districts of Tbilisi. 40 per cent of the population is due to be supplied within one year, and 60 per cent within two years. According to press reports the tender was awarded to Intergas, which has to clear Tbilgas’ debts, meet environmental standards and retain the existing workforce for the two-year period while gas supplies are being restored; the tariff policy is also specified. Mining With the apparent exception of Chiatura Manganese (see the section of this chapter concerning the Privatisation of MLEs), Georgia's mining sector seems to have been successful in attracting foreign investment. These include a Greek investment in the extraction of Bentonite clay in western Georgia, a British investment in the Uravi arsenic mine in Racha-Lechkhumi, and an Australian investment in extracting precious metals from quartzite deposits in Bolnisi district (Kvemo Kartli).

PRIVATISATION AND PRODUCTION
GEORGIAN ECONOMIC TRENDS – 1998 No.3 83
Box 7.4 WHAT SORT OF INDUSTRIAL POLICY DOES GEORGIA NEED?
The meeting that led up to the mass-resignation of most government ministers in July (see Calendar) reportedly included not only general debate over the economy and the level of corruption, but also sharp criticism of the outgoing Industry Minister Tamaz Agladze for failing to do anything practical to develop the sector10. This, and the replacement of Agladze with former Tbilisi mayor Badri Shoshitaishvili, may signal a more dynamic industrial policy. With Shoshitaishvili as its mayor, Tbilisi seems to have experienced stronger economic growth than the rest of the country. One of the most evident differences between economic growth in Tbilisi and the relative weakness in the most other parts of Georgia is that the city's economy is relatively diverse, being based much more on SMEs than on large-scale manufacturing industries. In recent years the Industry Ministry, with assistance from various donor organisations, has already been quite effective in supporting SME development in Tbilisi (and, to a lesser extent, Kutaisi) and could use this aspect of Tbilisi's success as the basis for a coherent national industrial policy. Under the present programme of technical assistance to SMEs, entrepreneurs are being given management training and expert assistance in developing viable business plans with which to attract private investment. This tends to be the most effective means of creating a profitable industrial sector, because enterprises that are capable (with the aid of a business plan) of attracting private investment tend to be profitable. Unfortunately the Ministry has done less to assist SMEs in the more remote areas of Georgia: giving wider support to SME development would be the next logical step and would bring Georgia's industrial policy closer to that of most other European countries. Another major improvement in industrial policy would be the development of a similarly systematic approach to large-scale industry. The more traditional approach of allocating subsidies to enterprises that cannot attract sufficient private investment has encouraged the development of an unprofitable industrial sector that requires chronic subsidisation. The approach to restructuring seems to depend mainly on the judgement of officials who are more familiar with Soviet-era planning than with commercial restructuring. Even where outside advisors are used, their recommendations are often adjusted by officials, and the resultant compromise solutions generally fail to eradicate the dependence on subsidies. Subsidisation is also an area of policy that is likely to have to change in order to comply with the requirements of WTO membership and EU harmonisation (see the section Box on subsidies in Chapter 6). Consequently industrial policy needs to be aimed at eradicating subsidies to production: funding needs to be directed away from production subsidies towards activities such as training, research and development, and the establishment of new enterprises. Manufacturing Although manufacturing output in Georgia remained low in Q2, it was generally too early for the output data to reflect the substantial progress that was made this year in privatising Georgia's manufacturing plants. Light industry seems to be particularly weak, and it will be interesting to see how successful Russia's Logovaz will be in reviving the fortunes of the Maudi textiles plant. As part of the powerful business group that is controlled by Boris Berezovsky (the powerful Russian magnate who is also the CIS Chief Executive), Logovaz seems more likely than most other Russian buyers to be able to honour its investment obligations.
10 Georgian Business News No.247, 24-31 July, p.5

PRIVATISATION AND PRODUCTION
84 GEORGIAN ECONOMIC TRENDS – 1998 No.3
Figure 7.5: Georgian knitwear and footwear production 1996 Q1 – 1998 Q2 (Quarterly output)
0
20
40
60
80
100
120
140
160
96Q2 97Q2 98Q2
Knitwear, 000 items Footwear, '000 pairs
Source: Derived from State Department of Statistics data Engineering and heavy manufacturing seem to be doing rather better than light industry. There have been encouraging reports of new export orders being won by transport manufacturers: Kutaisi Aviation has apparently received orders from the USA and Russia to assemble light aircraft, and the Kutaisi Motor Factory (KMZ), which is now part-owned by an Italian subsidiary of Fiat, opened in May and is making car parts for export to continental Europe. Food Georgia's food processing industry seems to have grown strongly over the past year, judging by the greatly increased availability in retail outlets of Georgian products such as fruit juice, soft drinks, beer and some dairy products. These are all products where Georgian producers seem to have a comparative advantage because of the abundance of cheap local agricultural inputs. Rival imports, which in many cases are made using reconstituted inputs rather than fresh ingredients, tend to retail at twice the price or more. However the apparent recovery of the sector is not generally reflected in the official statistics. For example, the output of canned fruit and vegetables recovered strongly in 1997 but seems to have fallen back to around the 1996 level. The fall may reflect a trend towards the use of alternative forms of packaging such as Tetrapack boxes which do not register in the statistics for canned output; it is also possible that improving transport and trade links with Georgia's neighbours have made the export of fresh fruit and vegetables more attractive than exporting in cans.

PRIVATISATION AND PRODUCTION
GEORGIAN ECONOMIC TRENDS – 1998 No.3 85
Figure 7.6: Georgian canned fruit and vegetables production 1996 Q1 – 1998 Q2 (Quarterly output, ‘000 conventional cans)
0
200
400
600
800
1000
1200
1400
96Q2 97Q2 98Q2
Source: Derived from State Department of Statistics data It is also difficult to be sure whether the low rate of production in the first half of 1998 signifies a change in the trend. As the chart shows, most officially-recorded output is registered during the second half of the year: only a moderate improvement in the second half of the year (compared with 1997H2) would be necessary to bring the 1998 total above that of 1997. Drinks The output statistics for drinks are rather complex, as a number of additional factors need to be taken into account. The production of alcoholic spirits seems to be a much more profitable activity than the official data suggests. (One report featured an entrepreneur who had bought a wine factory in order to distil liquor for export to Russia.) It is probable that there are many unregistered distillers, and that a large share of their output is smuggled across Georgia's mountainous borders as unrecorded exports. On the other hand, there seems to be little external demand for official Georgian brands of spirits because the export market is unlikely to value official brands higher than unregistered supplies. Within Georgia the prospects are similarly poor: the poorest consumers would tend to prefer cheaper illicit supplies, the luxury market seems to prefer exotic imports, and most other Georgians seem to prefer other drinks.

PRIVATISATION AND PRODUCTION
86 GEORGIAN ECONOMIC TRENDS – 1998 No.3
Figure 7.7: Georgian production of alcoholic drinks, 1996 Q1 – 1998 Q2 (Quarterly output, ‘000 L)
0
2000
4000
6000
8000
10000
12000
96Q2 97Q2 98Q2
Still+sparkling wineBeerVodka, liquor and brandy
Source: Derived from State Department of Statistics data The wine production statistics record only the production of official brands, and therefore under-estimate total wine production in Georgia. Farm-made and home-made wines appear to account for most domestic consumption. Considering that exports of official brands are still low, unrecorded wine production is likely to be much higher than recorded production. Most Georgians seem to consider that bottled wine is too expensive and often inferior to the country wine that farmers sell wholesale at markets: consequently, the traditional export markets of the former Soviet Union offer official brands of wine the greatest potential sales. However, at present there are major problems due to counterfeiting: customs data from countries such as Ukraine indicates that trade in the falsified wines is widespread with tens of millions of bottles involved. This volume far exceeds the quantity of wine that could have been produced from the exported Georgian grapes, and significantly reduces the market share of genuine Georgian produces. Moreover, the low quality of the falsified wine undermines the reputation associated with the brands. (Much of the wine is understood to be surplus EU output, which producers are not permitted to sell within the EU and therefore "dump" in eastern Europe at prices as low as 10 US cents per litre.) As discussed in relation to competition policy, the Anti-Monopoly Service has taken the lead in trying to stop the abuse of Georgia's trademarks. Beer production in Georgia has experienced something of a revolution over the past year, led by the Kazbegi brewing company. Major quality improvements and an aggressive marketing campaign (including extensive advertising, low prices and attractive deals for restaurant owners) have established Kazbegi as one of the market leaders in eastern Georgia. Several restaurants have switched from foreign brands of beer to Kazbegi, and other new Georgian brands have also started to appear. In this context the recorded output figures for beer seem likely to be lower than the amount of beer actually being produced. One area where the official statistics do register a major expansion of output is in the production of mineral water. The mineral water statistics are likely to be much more accurate than the other statistics because bottling mineral water remains the main way of distributing and selling it (and the output of

PRIVATISATION AND PRODUCTION
GEORGIAN ECONOMIC TRENDS – 1998 No.3 87
mineral water bottling plants is quite easy to monitor). Counterfeit versions of Borjomi (the most popular brand) have been seized, and according to one report foreign investors were so concerned about the problem that they were reconsidering their participation in the industry. However, such concern seems to be misplaced: the low price of mineral water makes counterfeiting much less profitable than is the case in the wine industry. Figure 7.8: Georgian mineral water production 1996 Q1 – 1998 Q2 (Quarterly output, million litres)
0
2
4
6
8
10
12
14
16
96Q2 97Q2 98Q2
Source: Derived from State Department of Statistics data As the graph shows, mineral water production in Georgia is very seasonal, but in each quarter the level of output is higher than four quarters earlier - in other words, each summer's output (Q3) is higher than during the previous summer, and each winter's (Q1) output is higher than during the previous winter. This indicates the steady underlying growth in mineral water production. Construction It seems fairly clear that construction is clearly one of the booming areas of the economy: the official statistics calculate that it has been growing at more than 20 per cent a year in real terms, rising to 25 per cent in the first half of this year. These figures are in line with by the rapidly growing demand for some construction materials (see Figures 7.9 and 7.10). Interpack (which recently bought Rustavi Cement) expects cement consumption to rise from 87 thousand tonnes in 1997 to 395 thousand tonnes in 2002 representing average annual growth of 35 per cent.

PRIVATISATION AND PRODUCTION
88 GEORGIAN ECONOMIC TRENDS – 1998 No.3
Figure 7.9: Georgian raw-board and saw-timber production 1996 Q1 – 1998 Q2 (Quarterly output, ‘000 cubic metres)
0
2
4
6
8
10
12
14
16
96Q2 97Q2 98Q2
Raw boardSaw-timber
Source: Derived from State Department of Statistics data Figure 7.10: Georgian cement production, 1996 Q1 – 1998 Q2 (Quarterly output, ‘000 T)
0
10
20
30
40
50
60
96Q2 97Q2 98Q2
Source: Derived from State Department of Statistics data As mentioned in the Privatisation section of this chapter, the MSPM announced tenders for majority shares in five construction JSCs. These included:
60.7 per cent of the shares in "Perliti" at USD 47,000. The terms specify capital investment of USD 200,000 over 3 years. 83.3 per cent of the shares in "Maglivmsheni" at USD 8,840. The winner must invest USD 100,000 over two years in the enterprise’s capital. 83.3 per cent of the shares in "Mshentransi" at USD 57,181. The winner has to clear the

PRIVATISATION AND PRODUCTION
GEORGIAN ECONOMIC TRENDS – 1998 No.3 89
enterprise’s debts, and the specified level of capital investment is USD 200,000 over 3 years. 62.95 per cent of the shares of the construction company "Darkveta" at USD 217,753. The specified level of capital investment is USD 200,000 over 3 years. 51.9 per cent of "Bazalti" at USD 44,060; capital investment conditions are the same as for Darkveta.
In addition to these JSCs, about 40 smaller construction enterprises are registered in Georgia. As in most countries, a lot of minor construction activity also seems to take place informally. Construction is one of many sectors for which licensing requirements have been introduced relatively recently; the only discernible impact of such licensing seems to have been to impose costly and bureaucratic controls on owners have taken the courageous step of registering their enterprises. Tourism As discussed in the 1998 Q1 issue of GET, the Ministry of Tourism continued its plans to introduce licensing requirements in July covering a wide range of tourism-related business activity. It seems that intense lobbying by hotel owners dissuaded the authorities from adding significantly to the already considerable regulatory burden on the formal sector. July also saw the establishment of a National Association of Hotel Businesses, whose aims are to defend the interests of private hotels and to promote tourism in Georgia. As high-profile businesses, private hotels and guest-houses in Georgia are particularly vulnerable to corruption. The costs - of ensuring effective security, of satisfying unnecessary regulatory requirements and of dealing with corrupt officials - have helped to make Tbilisi one of the most costly cities in the world for short-stay visitors, with overnight rates in the capital’s private hotels typically starting from USD 90 per person. Unfortunately the costly regulations do not represent any guarantee of quality, because the high level of official corruption enables hotels to obtain certificates and licenses regardless of whether they meet the formal requirements. On the other hand, Georgian traditions of hospitality enable foreign visitors to find informally-arranged accommodation: if the host feels rich enough this may be free, but more often a daily contribution of between USD 5 and USD 30 (depending on the quality) is sufficient for a foreigner to secure a room as a short-term paying guest in a private house in Tbilisi11. If this summer’s licensing plans were aimed at stamping out such arrangements, they are unlikely to have had any effect (other than to undermine public respect for the authorities concerned). Outside Tbilisi, there are few private hotels and the choice of accommodation tends to be very limited. Domestic tourists account for almost all business at Georgia’s traditional resorts (such as Batumi, Kobuleti and Borjomi), but domestic tourism is not a category that the authorities seem to recognise. Soviet-era hotels and sanatoria (often still state-owned) tend to offer the best deals – typically USD 20 per night12. Some such resorts also have many private guest-houses; however, these tend to be of poor quality, being aimed at domestic tourists. Elsewhere in Georgia, informal arrangements are often the only way of securing accommodation.
11 Longer-stay visitors may get better deals by renting entire apartments. 12 Some of the largest state-owned hotels, including practically all those in Tbilisi, are presently being used as accommodation for IDPs.
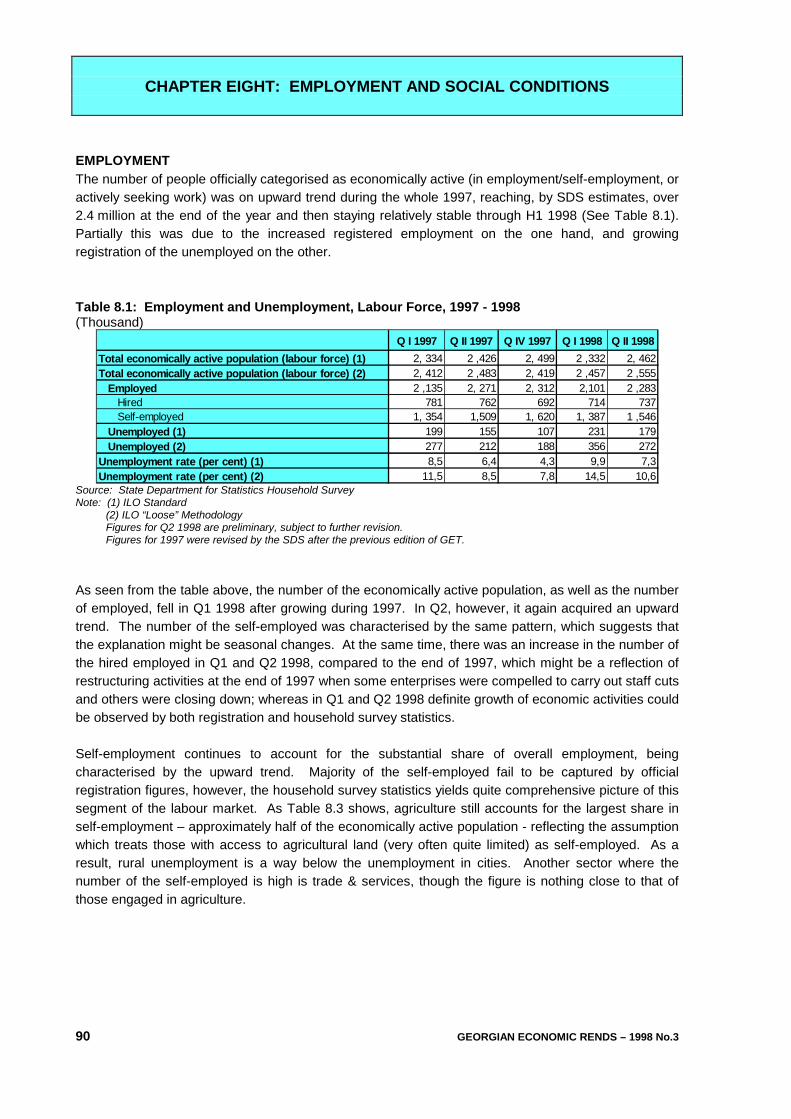
CHAPTER EIGHT: EMPLOYMENT AND SOCIAL CONDITIONS
90 GEORGIAN ECONOMIC RENDS – 1998 No.3
EMPLOYMENT The number of people officially categorised as economically active (in employment/self-employment, or actively seeking work) was on upward trend during the whole 1997, reaching, by SDS estimates, over 2.4 million at the end of the year and then staying relatively stable through H1 1998 (See Table 8.1). Partially this was due to the increased registered employment on the one hand, and growing registration of the unemployed on the other. Table 8.1: Employment and Unemployment, Labour Force, 1997 - 1998 (Thousand)
Q I 1997 Q II 1997 Q IV 1997 Q I 1998 Q II 1998Total economically active population (labour force) (1) 2, 334 2 ,426 2, 499 2 ,332 2, 462Total economically active population (labour force) (2) 2, 412 2 ,483 2, 419 2 ,457 2 ,555 Employed 2 ,135 2, 271 2, 312 2,101 2 ,283 Hired 781 762 692 714 737 Self-employed 1, 354 1,509 1, 620 1, 387 1 ,546 Unemployed (1) 199 155 107 231 179 Unemployed (2) 277 212 188 356 272Unemployment rate (per cent) (1) 8,5 6,4 4,3 9,9 7,3Unemployment rate (per cent) (2) 11,5 8,5 7,8 14,5 10,6
Source: State Department for Statistics Household Survey Note: (1) ILO Standard (2) ILO “Loose” Methodology Figures for Q2 1998 are preliminary, subject to further revision. Figures for 1997 were revised by the SDS after the previous edition of GET. As seen from the table above, the number of the economically active population, as well as the number of employed, fell in Q1 1998 after growing during 1997. In Q2, however, it again acquired an upward trend. The number of the self-employed was characterised by the same pattern, which suggests that the explanation might be seasonal changes. At the same time, there was an increase in the number of the hired employed in Q1 and Q2 1998, compared to the end of 1997, which might be a reflection of restructuring activities at the end of 1997 when some enterprises were compelled to carry out staff cuts and others were closing down; whereas in Q1 and Q2 1998 definite growth of economic activities could be observed by both registration and household survey statistics. Self-employment continues to account for the substantial share of overall employment, being characterised by the upward trend. Majority of the self-employed fail to be captured by official registration figures, however, the household survey statistics yields quite comprehensive picture of this segment of the labour market. As Table 8.3 shows, agriculture still accounts for the largest share in self-employment – approximately half of the economically active population - reflecting the assumption which treats those with access to agricultural land (very often quite limited) as self-employed. As a result, rural unemployment is a way below the unemployment in cities. Another sector where the number of the self-employed is high is trade & services, though the figure is nothing close to that of those engaged in agriculture.

EMPLOYMENT AND SOCIAL CONDITIONS
GEGIAN ECONOMIC TRENDS – 1998 No.3 91
Table 8.2: Self-employment by Sectors, Q1 – Q2 1998 Sector
Number of employed (thousand)
Average net monthly
income (GEL)
Number of employed (thousand)
Average net monthly
income (GEL)
Agriculture, forestry and fishery 1073.1 47.3 1242.1 50.2Mining or processing industry 17.2 101.3 14.4 111.9Construction 18.3 218.7 9.2 198.6Trade and services 175.4 94.1 129.9 103.2Transport and communications 25.2 210.6 26.3 205.3Culture, sports and recreation 16.7 62.1 17.3 57.5
Other sectors 27.8 66.2 16.5 96.7Non-defined 11.0 143.3 9.3 200.0
Total 1364.8 103.2 1465.1 112.2
Q1 1998 Q2 1998
Source: Data from the SDS Household Survey As comparison of Tables 8.2 and 8.3 shows, the incomes of the self-employed are significantly higher for all the sectors than for wage earners and salaried employees. An average monthly income of a self-employed is about 40 per cent higher than an average monthly wage/salary. This serves a very good incentive for those who have to choose, to shift to self-employment. The number of those engaged in agriculture grew in Q2 compared to Q1 for both self-employed and hired employees, self-employees’ monthly income continuing to grow, though remaining the lowest compared to other sectors. Both tables suggest that activities in such sectors as mining & processing industry and construction were suffering certain recession in Q2 as numbers of people employed/self-employed in these sectors were falling and the incomes of the self-employed decreasing, though wages of construction workers grew substantially. Table 8.3: Hired Employment by Sector, Q1 – Q2 1998
SectorsNumber of employed (thousand)
Average monthly
salaries (GEL)
Number of employed (thousand)
Average monthly
salaries (GEL)
Agriculture, forestry and fishery 47.0 37.5 49.0 36.8
Mining or processing industry 68.7 102.7 62.7 81.7
Electricity, gas and water supply 29.3 78.1 23.2 83.7
Construction 34.5 122.4 25.8 150.7
Trade and services 60.5 73.5 62.1 87.2
Transport and communications 71.6 90.4 61.9 93.5
Government and defence 86.8 81.0 94.2 74.8
Education 147.6 32.2 137.9 36.6
Health care 84.9 33.3 70.5 39.4
Culture, sports and recreation 69.5 52.6 64.4 60.1
Other sectors 32.5 106.2 27.7 94.0
Non-defined 7.3 79.6 9.4 37.0
Total 740.2 62.5 688.7 66.4
Q1 1998 Q2 1998
Source: Data from the SDS Household Survey

EMPLOYMENT AND SOCIAL CONDITIONS
GEORGIAN ECONOMIC TRENDS – 1998 No.3 92
The largest shares of hired employment fall on education, health care and government & defence, salaries of teachers and medical workers, together with the salaries of agricultural workers, though having grown in nominal terms, being the lowest. Salaries of construction workers are the highest. In most of the sectors (exceptions being only self-employed in agriculture and hired employees in trade and services), a negative relationship can be observed, whereby as the number of those employed/self-employed in the sector decreases, the incomes and wages/salaries grow and vice versa. Most of the sectors are characterised by growing monthly nominal incomes for both self- and hired labour, however, the growth rates of the incomes of the self-employed are higher on average. While the number of people in hired employment grew in some sectors, on average, the overall figure decreased by about 7 per cent in Q2 against Q1. At the same time, the number of the self-employed grew by the same 7 per cent, though primarily at the expense of agriculture. Large numbers of self-employed continue to avoid registration, thus evading tax payment. In fact, there is no incentive for them to register and it is much simpler to operate in the shadow economy. At the same time, at the moment there is no mechanism of collecting taxes from them. Since large numbers of people are self-employed/employed in the shadow economy, where the incomes are higher, it is essential to take measures to encourage official private entrepreneurship. UNEMPLOYMENT Growing registration of the unemployed in H1 1997 was conditioned mainly by their eligibility for receiving family allowance on top of the unemployment benefit from the beginning of 1997 till summer of the same year when the registration for the allowance was suspended, resulting in the reduction of the number of the registered unemployed (from 140 thousand in summer to 120 thousand in December 1997). Table 8.4: Registered Unemployment, October 1997 – August 1998
Month Number (thousand)
1997 January 58,800 February 90,000 March 111,000 April 125,000 May 139,600 June 139,000 July 143,000 August 142,000 September 142,000 October 142,000 November 142,800 December 142,900 1998 January 116,800 February 117,900 March 114,500 April 96,800 May 101,700 June 74,000 July 75,400 August 77,400
Source: Data from the State Department for Statistics

EMPLOYMENT AND SOCIAL CONDITIONS
GEGIAN ECONOMIC TRENDS – 1998 No.3 93
The tendency of falling of both registered job-seekers1 and registered unemployed2 figures persisted further into 1998 almost halving the above numbers by the end of H1 - at 76,000 of the former and 74,000 of the latter. During the summer months, however, the number of the registered unemployed remained stable (see Table 8.4), presumably, due to the availability of seasonal jobs during the summer in the labour market, both official and unofficial. And yet, the overall downward trend of officially registered unemployment figures is encouraging, indicating, without any doubt, an increasing number of jobs in the economy, that cannot be explained by seasonal factors alone. However, there is more of “statistical” rather than “economic” factors to the nature of this trend. Part of the explanation is that being no more eligible for the family allowance, and the unemployment benefit being symbolic, the unemployed are discouraged to undergo a complicated and time consuming procedure of registration. Another factor is that since the beginning of 1997 all those with access to land (owners or family members of owners of 1 hectar and more of agricultural land) are considered self-employed, in fact they account for about half of employed/self-employed. (Rural unemployment was 4 times smaller than the unemployment in the cities in H1). Since many of them have only very little plots of land to survive on, let alone generate income, it is likely that a substantial portion of such “farmers” would be eager to have another better paying employment. The unemployment rate based on official registration figures (See Box 8.1) was only 3.5 per cent as of end of 1 July 1998. This is a very optimistic figure, though a figure that should be treated with caution, since its reliability is undermined by low rate of registration of the unemployed and job-seekers on the one hand, and the poor if any coverage of informal activities, which accounts for about 40 per cent of GDP, by SDS estimates. Another important factor is the widespread hidden unemployment, when the officially employed are paid token salaries or are on unpaid leave for quite extended periods of time. Both categories have to find alternative employment to survive, sometimes in the private sector, but mostly in the informal economy. As a result of multiple employment, double counting is often the case. These trends fail to be recorded by the official figures. And still, though official registration figures could be misleading, failing to reflect certain trends on the labour market, some conclusion can still be drawn from them. First of all, they certainly reflect the growth of economic activity, though a tendency of over-staffing in some sectors of the economy can be observed. Second, as seen from the figures, the vast majority of the job-seekers are unemployed reflecting very little hope of finding jobs through official registration on the part of job-seekers: e.g. one (suggesting low remuneration) vacancy per 37 registered unemployed as of end of H1 (155 – in April). This drives many of the potential job-seekers to shift to informal economy, which can absorb certain portion of both registered and unregistered job-seekers (both for primary and for secondary employment), in which case impressive amounts of potential payroll tax fail to reach the government budget.
1 Both unemployed and employed people who are looking for new jobs may register as job-seekers. 2 Changes and ammendments to the Law on Employment, introduced in December 1997 defined an unemployed as a person of working age who is a registered unemployed job-seeker.

EMPLOYMENT AND SOCIAL CONDITIONS
GEORGIAN ECONOMIC TRENDS – 1998 No.3 94
Box 8.1 Employment Office Statistics
These statistics generally refer to the number of applicants for work on the registers at the end of each month. Where registration is entirely voluntary, and especially where the employment offices function only in the most populous regions of a country or are not widely patronised by employees seeking work or by employers seeking workers, the data are generally very incomplete and do not give a reliable indication of the extent of unemployment. The scope of the figures is determined partly by the manner in which the system of exchanges is organised and the advantages which registration brings, and partly by the extent to which workers are accustomed to register. In many cases, persons engaged in agriculture and living in less populous areas are scarcely represented in the statistics, if at all. The scope of employment office statistics is therefore most difficult to ascertain, and in very few cases can satisfactory percentages of unemployment be calculated. In general, these statistics are not comparable from country to country. However, if there are no changes in legislation, administrative regulations and the like, fluctuations within a country may reflect changes in the prevalence of unemployment over time. Source: International Labour Organization (1994) Yearbook of Labour Statistics, 53rd edition, ILO; Geneva, p.483-484 It is likely that the figures from the on-going SDS household survey bear more relation to the reality (Table 8.1). Though they also fail to provide a perfectly correct picture of the labour market, generally not capturing the rural unemployment either, they yield comprehensive statistics including groups of persons not always covered by official registration figures, e.g. they do capture even informal activities to some extent. The unemployment rate derived from such figures is quite reliable since the numbers of both employed and unemployed come from the same surveys. The unemployment rate for Q2 1998, both by ILO standard – at 7.3 per cent and by “loose” methodology3 – at 10.6 per cent, suggested by the household survey results, seem a way more realistic than the one based on the unemployment registration figures – at 3.5 per cent. Unlike official registration-based unemployment rate, the unemployment rate based on household survey statistics shows that its decline, that persisted throughout the whole 1997, was reversed in 1998 (Table 8.1). Explaining these changes by seasonal factor only does not seem relevant, as comparison of Q1 and Q2 of 1997 and 1998 percentages show that unemployment rate was lower in H1 1997 than in H1 1998. The most likely explanation could be restructuring activities of enterprises. A very likely explanation is that now both the respondents and the interviewers are better familiar with the terminology, thus answering questionnaires more accurately. WAGES The "normative minimum salary"4 stood at GEL 40.9/month per employee of an average (four-member) family nationally in June 1998, which represented just over one quarter of the minimum subsistence for such a family. The minimum salary of a budgetary organisation5 employee was fixed at GEL 17/month by a presidential decree of 31 December 1997 which provided for a 10 per cent
3 While calculating the rate of unemployment according to “loose” methodology, discouraged workers are also included under the category of unemployed. 4 The "normative minimum salary" is the level of salary that, when taken together with other household income, is estimated to provide an average household with the minimum subsistence level. 5 A budgetary organisation is a public organisation fully subsidised by the state budget.

EMPLOYMENT AND SOCIAL CONDITIONS
GEGIAN ECONOMIC TRENDS – 1998 No.3 95
increase in state-funded salaries and benefits, effective from 1 January 1998 (the non-taxable minimum being GEL 9). It was the third time during 1997 when the salaries of civil servants, as well as pensions and other benefits were increased, though very slightly: by 15 per cent in January and by 20 per cent in August, as electricity tariffs grew first by 32 per cent and then by 36.4 per cent. As a result, the minimum salary of a budgetary organisation employee grew by GEL 5 over 1997. Another 10 per cent raise of budgetary salaries and social benefits was introduced by a presidential decree of 11 August 1998 effective from 1 September. The salaries of budgetary organisations’ employees are now in the range of GEL 18 to GEL 66. The average monthly salary across the economy grew by 9.8 per cent in nominal terms against end of 1997 and fell by 7.8 per cent against Q1 as of end of H1 1998 to GEL 60.3 after doubling during 1997 (See Table 8.4). The average monthly salary at a budgetary organisation continued its upward trend to GEL 58.8 and at a private company to GEL 69.1 as of end Q2 1998, according to the SDS estimates. These developments, though representing essentially a nominal increase, still indicate a stable tendency towards growth. INCOME AND EXPENDITURE The SDS household survey, covering 5,200 households throughout Georgia, provides extremely useful and interesting data about consumption patterns and income distribution. The expenditure figures serve a rather reliable source of information for estimating income distribution, since income figures, though being of interest too, often suffer from underestimation. While measuring income distribution, both cash and non-cash expenditure should be taken into consideration, since families with low cash income tend to compensate for by non-cash incomes. Table 8.5: Average Monthly Household Consumption Structure by Deciles, Q2 1998 (GEL)
Expenditure 1 (Poorest) 2 3 4 5 6 7 8 9 10 (Richest)
Food products 22.7 42.3 61.1 70.3 85.2 91.9 109.8 122.5 146.8 166.6
Beverages 0.2 0.3 0.6 0.8 0.8 1.3 1.2 2.1 3.4 5.5
Tobacco products 0.6 1.1 1.6 1.7 3.0 3.5 4.3 4.5 5.0 9.3
Clothing and footwear 2.0 3.2 5.0 5.8 7.8 9.5 10.1 14.0 14.3 21.3
Household consumer goods 4.0 6.4 6.9 9.7 10.7 13.5 16.0 20.3 22.6 51.1
Medicine 1.5 3.0 2.7 2.7 3.6 5.2 5.4 7.3 6.6 10.8
Electricity and fuel 3.4 4.8 5.4 6.2 7.0 7.9 8.9 10.3 11.4 14.4
Transport 1.3 2.5 4.0 6.3 7.9 10.0 11.3 19.3 19.6 35.6
Education, culture and recreation 0.3 0.7 1.4 2.9 2.4 3.5 4.8 5.5 6.3 22.9
Other consumer expenses 0.8 1.1 2.0 2.7 3.6 3.5 5.2 6.6 9.8 14.5
Total consumer expenses 37 .637 .637 .637 .6 66.366.366.366.3 92.892.892.892.8 112.0112.0112.0112.0 135.8135.8135.8135.8 153.3153.3153.3153.3 182.3182.3182.3182.3 219.0219.0219.0219.0 255.7255.7255.7255.7 366.4366.4366.4366.4
Agricultural expenses 1.4 1.6 3.1 2.8 3.8 3.9 5.8 5.7 7.1 11.1
Transfers 0.0 0.1 0.1 0.9 0.1 0.1 1.4 0.0 1.6 1.0
Savings and lending 9.5 7.7 8.5 13.8 7.1 20.3 7.3 17.4 37.0 54.8
Total other expenses 11 .011 .011 .011 .0 9.39.39.39.3 11 .711 .711 .711 .7 17 .517 .517 .517 .5 11.011.011.011.0 24.224.224.224.2 14.514.514.514.5 23.223.223.223.2 45.745.745.745.7 66.966.966.966.9
Total cash expenses 12.612.612.612.6 20.420.420.420.4 27 .227 .227 .227 .2 40.540.540.540.5 48.848.848.848.8 63.463.463.463.4 79.279.279.279.2 91 .591 .591 .591 .5 110.7110.7110.7110.7 183.9183.9183.9183.9
Non-cash expenses 48.548.548.548.5 75.675.675.675.6 104.5104.5104.5104.5 129.5129.5129.5129.5 146.8146.8146.8146.8 177 .6177 .6177 .6177 .6 196.8196.8196.8196.8 242.2242.2242.2242.2 301 .4301 .4301 .4301 .4 433.3433.3433.3433.3
Total expenses 61 . 161 . 161 . 161 . 1 96. 196. 196. 196. 1 131 .7131 .7131 .7131 .7 169.9169.9169.9169.9 195.6195.6195.6195.6 241 .0241 .0241 .0241 .0 276.0276.0276.0276.0 333.7333.7333.7333.7 412.2412.2412.2412.2 617.2617.2617.2617.2 Source: Data from the SDS Household Survey While the richest decile consume 10 times more than the poorest decile, cash consumption of the richest decile is 8.9 times higher and non-cash consumption 14.6 times higher than that of the poorest decile. (See Table 8.5). Measured by total consumption, the inequality of the distribution is higher than if measured by cash consumption. However, measuring by non-cash consumption suggests the
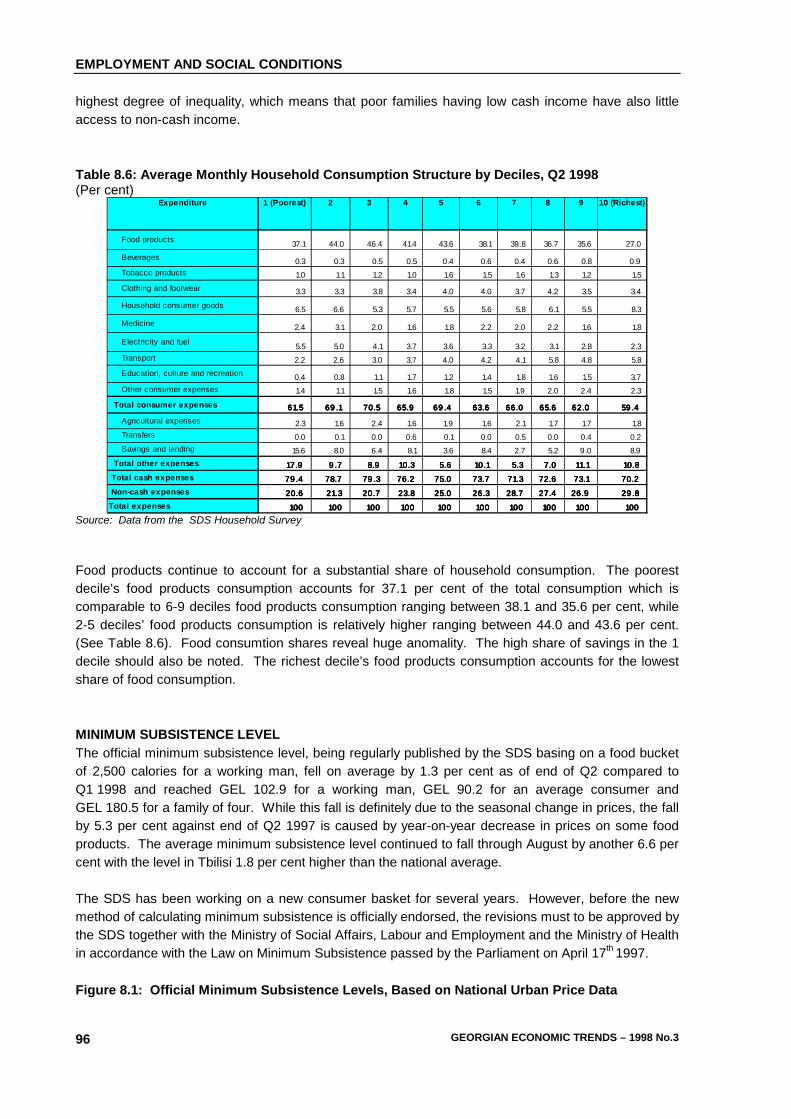
EMPLOYMENT AND SOCIAL CONDITIONS
GEORGIAN ECONOMIC TRENDS – 1998 No.3 96
highest degree of inequality, which means that poor families having low cash income have also little access to non-cash income. Table 8.6: Average Monthly Household Consumption Structure by Deciles, Q2 1998 (Per cent)
Expenditure 1 (Poorest) 2 3 4 5 6 7 8 9 10 (Richest)
Food products37.1 44.0 46.4 41.4 43.6 38.1 39.8 36.7 35.6 27.0
Beverages0.3 0.3 0.5 0.5 0.4 0.6 0.4 0.6 0.8 0.9
Tobacco products 1.0 1.1 1.2 1.0 1.6 1.5 1.6 1.3 1.2 1.5
Clothing and footwear 3.3 3.3 3.8 3.4 4.0 4.0 3.7 4.2 3.5 3.4
Household consumer goods6.5 6.6 5.3 5.7 5.5 5.6 5.8 6.1 5.5 8.3
Medicine2.4 3.1 2.0 1.6 1.8 2.2 2.0 2.2 1.6 1.8
Electricity and fuel5.5 5.0 4.1 3.7 3.6 3.3 3.2 3.1 2.8 2.3
Transport 2.2 2.6 3.0 3.7 4.0 4.2 4.1 5.8 4.8 5.8
Education, culture and recreation0.4 0.8 1.1 1.7 1.2 1.4 1.8 1.6 1.5 3.7
Other consumer expenses 1.4 1.1 1.5 1.6 1.8 1.5 1.9 2.0 2.4 2.3
Total consumer expenses 61.561 .561 .561 .5 69.169.169.169.1 70.570.570.570.5 65.965.965.965.9 69.469.469.469.4 63.663.663.663.6 66.066.066.066.0 65.665.665.665.6 62.062.062.062.0 59.459.459.459.4
Agricultural expenses 2.3 1.6 2.4 1.6 1.9 1.6 2.1 1.7 1.7 1.8
Transfers 0.0 0.1 0.0 0.6 0.1 0.0 0.5 0.0 0.4 0.2
Savings and lending 15.6 8.0 6.4 8.1 3.6 8.4 2.7 5.2 9.0 8.9
Total other expenses 17 .917 .917 .917 .9 9.79.79.79.7 8.98.98.98.9 10.310.310.310.3 5.65.65.65.6 10. 110. 110. 110. 1 5.35.35.35.3 7.07.07.07.0 11 . 111 . 111 . 111 . 1 10.810.810.810.8
Total cash expenses 79.479.479.479.4 78.778.778.778.7 79.379.379.379.3 76.276.276.276.2 75.075.075.075.0 73.773.773.773.7 71 .371 .371 .371 .3 72.672.672.672.6 73.173.173.173.1 70.270.270.270.2
Non-cash expenses 20.620.620.620.6 21 .321 .321 .321 .3 20.720.720.720.7 23.823.823.823.8 25.025.025.025.0 26.326.326.326.3 28.728.728.728.7 27.427.427.427.4 26.926.926.926.9 29.829.829.829.8
Total expenses 100100100100 100100100100 100100100100 100100100100 100100100100 100100100100 100100100100 100100100100 100100100100 100100100100 Source: Data from the SDS Household Survey Food products continue to account for a substantial share of household consumption. The poorest decile’s food products consumption accounts for 37.1 per cent of the total consumption which is comparable to 6-9 deciles food products consumption ranging between 38.1 and 35.6 per cent, while 2-5 deciles’ food products consumption is relatively higher ranging between 44.0 and 43.6 per cent. (See Table 8.6). Food consumtion shares reveal huge anomality. The high share of savings in the 1 decile should also be noted. The richest decile’s food products consumption accounts for the lowest share of food consumption. MINIMUM SUBSISTENCE LEVEL The official minimum subsistence level, being regularly published by the SDS basing on a food bucket of 2,500 calories for a working man, fell on average by 1.3 per cent as of end of Q2 compared to Q1 1998 and reached GEL 102.9 for a working man, GEL 90.2 for an average consumer and GEL 180.5 for a family of four. While this fall is definitely due to the seasonal change in prices, the fall by 5.3 per cent against end of Q2 1997 is caused by year-on-year decrease in prices on some food products. The average minimum subsistence level continued to fall through August by another 6.6 per cent with the level in Tbilisi 1.8 per cent higher than the national average. The SDS has been working on a new consumer basket for several years. However, before the new method of calculating minimum subsistence is officially endorsed, the revisions must to be approved by the SDS together with the Ministry of Social Affairs, Labour and Employment and the Ministry of Health in accordance with the Law on Minimum Subsistence passed by the Parliament on April 17th 1997. Figure 8.1: Official Minimum Subsistence Levels, Based on National Urban Price Data

EMPLOYMENT AND SOCIAL CONDITIONS
GEGIAN ECONOMIC TRENDS – 1998 No.3 97
0
50
100
150
200
250
Jan-95 Apr-95 Jul-95 O ct-95 Jan-96 Apr-96 Jul-96 O ct-96 Jan-97 Apr-97 Jul-97 O ct-97 Jan-98 Apr-98 Jul-98
Lari/
mln
cou
pons
for an average person
for a family of four
for a w orking man
Source: Data from the State Department for Statistics Note: For Tbilisi only until July 1996; for 6 cities in Georgia since July 1996. POVERTY ASSESSMENT The SDS has been working on poverty assessment in Georgia since February 1998. Household consumption and structure of expenditures is used to determine the level of living. The SDS calculates the poverty level against three different indicators of the poverty line: minimum subsistence, 60 per cent of median6 consumption and 40 per cent of median consumption for a working man. Table 8.7: Poverty Level Distribution by Regions, Q2 1997 and Q2 1998 (Per cent)
Region
Q2 1997 Q2 1998 Q2 1997 Q2 1998 Q2 1997 Q2 1998
Kakheti 47.3 46.7 26.9 16.9 13.3 5.6Tbilisi 40.2 54.1 18.7 22.9 5.7 6.6Shida Kartli 34.6 48.7 19.9 25.0 9.3 10.4Kvemo Kartli 44.4 40.5 25.6 18.0 11.4 5.8
Samtskhe-Javakheti 28.4 50.6 16.3 19.8 8.4 8.4Achara 35.2 46.0 18.7 22.5 6.4 11.0Guria 49.8 54.5 28.1 21.6 9.4 5.2Samegrelo 24.2 45.3 8.2 21.0 2.8 12.5Imereti 54.1 59.8 31.0 38.0 9.9 23.1
Georgia, total 41.4 50.8 21.9 24.4 8.2 10.7
Against minimum subsistence
Against 60 per cent of median consumtion
Against 40 per cent of median consumtion
Source: Data from the SDS Household Survey Note: Shida Kartli includes also Mtsketa-Mtianeti region and Imereti includes Racha-Lechkhumi and Kvemo Svaneti regions. The share of those living below the poverty line calculated against the minimum subsistence level – GEL 180.5 for a family of four in Q2 1998 – accounted for 50.8 per cent of the total population of Georgia, 9.4 percentage points higher than in Q2 1997. 60 per cent of median consumption is a relative poverty line which during Q2 1998 comprised approximately the equivalent of the food basket of the minimum subsistence (GEL 86.8), median monthly consumption for an average (four-member) household being GEL 144.6. The population living
6 Median devides the households or individuals into two groups each comprising 50 per cent of the population and represents the 3rd quintile or the average of the 5th and 6th deciles.

EMPLOYMENT AND SOCIAL CONDITIONS
GEORGIAN ECONOMIC TRENDS – 1998 No.3 98
below this poverty line can be considered very poor and accounted for 24.4 per cent of the total population of Georgia in Q2 1998, which is a 2.5 percentage points increase compared to Q2 1997. This increase was relatively higher in Samegrelo and Imereti, at the same time the share of those living below this poverty line considerably decreased in Kakheti and Kvemo Kartli (See Table 8.7). Assuming that 60 per cent of median consumption is a poverty line, 40 per cent of median consumption can be called extreme poverty line and comprised GEL 57.8 for a family of four in Q2 1998. The share of the population living below the extreme poverty line amounted to 10.7 per cent of the total Georgia population in Q2 1998 – 2.5 percentage points higher compared to Q2 1997. According to the statistics, despite impressive economic growth, poverty in Georgia is growing. SOCIAL SEFETY NET The reforms aimed at improving efficiency of the social safety net and at making the scarce budgetary resource available for the most needy are underway. Though authorities’ commitment to pursuing reform in the sector is irreversible and certain steps aimed at improving targeting have been made, so far the official social safety net remains largely irrelevant for small household incomes. The budget resources are extremely limited and collection of payroll tax insufficient to ensure sustainable social safety mechanisms even for the limited number of beneficiaries. Quite a lot remains to be done for the system to be in the position to alleviate poverty and provide adequate support to the elderly. However, with further reform the system may become sustainable in medium term. The World Bank is working in close co-operation with the USSF under the framework of the Structural Adjustment Credit and the Structural Adjustment Technical Assistance Credit; the advice being offered includes reform of the state pension system and the social safety net, the design of a programme of social assistance to the vulnerable groups who do not qualify under any other programmes and the facilitation of a private pensions scheme, as well as the development of the appropriate regulatory framework. In order for the social security system to be effective at alleviating poverty (including the provision of adequate support to the elderly and meeting social insurance objectives) and to become sustainable in the long run, benefits need to become more generous whilst being targeted on a relatively small number of the poorest people. However, social benefits, even appropriately targeted, are likely to remain modest in the medium term. As economic growth continues in the longer term, the amount of social assistance could grow and its coverage could expand. In the meantime, the Government’s ability to run a comprehensive social security system will be limited: state pensions and other benefits for the most vulnerable will remain very low in the short and medium term. The aim should be to allocate very modest budgetary resources as fairly and efficiently as possible. Assistance to people on very low incomes Aiming at further improvement of targeting the social assistance, the Family Allowance, introduced in the beginning of 1997, which could be claimed in addition to Unemployment Benefit, was replaced in January 1998 by the State Social Allowance targeted at only one category of vulnerable families – non-working pensioners without a legal breadwinner living alone, in fact, playing the role of the topping up to the pensions of the poorest categories of the elderly. The State Social Allowance is GEL 9 for a qualifying family consisting of one member, GEL 7 for each member of an eligible family of two and GEL 5 for each member of a family consisting of three or more
EMPLOYMENT AND SOCIAL CONDITIONS
GEGIAN ECONOMIC TRENDS – 1998 No.3 99
members per month. For an average pensioner who receives GEL 11.2 (the remaining GEL 1.80 being transferred to Sakenergo to cover some of electricity payment) additional GEL 9 added to pension, at least slightly alleviating the situation, is definitely worth undergoing registration for. Hence, it is likely that the majority of those eligible for the allowance have already registered. Around 41.5 thousand families (approximately 50.6 thousand recipients) were eligible for State Social Allowance as of end of Q2 1998 (See Table 8.8). As of 1 September 1998 the number of families grew to 43.8 thousand and the number of beneficiaries – to 53.3 thousand. The lists of the claimants are being checked in order to make sure that the allowance reaches those who are really in need (as of 1 October the Ministry of Labour and Social Affairs officials have checked registers at 35 regions). Though registration for the state social allowance started in January, payments did not begin until April when the Ministry of Finance transferred the money to the MoLSA. The sums paid mostly covered the arrears for the Q1 and for April, after that the payments, especially in some regions, were accumulating arrears again. While GEL 1,986.4 thousand were to be transferred by MoF for payment of social allowance nationally in Q2, only GEL 931.5 thousand was actually paid (respectively GEL 538.8 and GEL 297.4 for Tbilisi). At the same time, the state budget still owes GEL 8,000,000 worth of family allowance arrears left over from 1997. Another type of social assistance was also introduced in the beginning of 1998: vulnerable families are eligible (on a case-by-case basis) for one-off benefit payments not exceeding an annual limit of GEL 60 per family. Though coverage of the state social allowance is limited, taking into consideration the constraints that the state budget is facing, it is definitely better targeted on the most vulnerable and needy. However, even paying the social allowance to the minimum number of the most vulnerable pensioners without going in arrears appears to be problematic for the state budget which suffers from undercollection. Assistance to unemployed people The standard monthly Unemployment Benefit payments since the beginning of 1997 were GEL 13 for the first two months of unemployment, GEL 11 for the next two months, and GEL 9 for the final two. In accordance with a presidential decree they were raised by 1 lari and effective from September. The low level, and sometimes infrequent payment, of Unemployment Benefit makes it a very weak incentive for people to go through the complicated and time-consuming procedure required to register as being officially unemployed. As of 1 July, only 3.5 per cent of the registered unemployed – 2,590 – were receiving unemployment benefit, and not even everybody did actually bother to collect the money. Both the figures for the registered unemployed and for the recipients of unemployment benefit remained stable through August growing by only 3,000 compared to end of Q2. There is a definite tendency towards fall in the number of the benefit recipients, which can be explained by the low level of the benefit and expanding informal economy which absorbs substantial numbers of people, making it for many not worth registering as unemployed. As of 1 August, 51 per cent of the registered unemployed were without job for more than 3 years, 33 per cent – for 1 to 3 years and 16 per cent – for up to 1 year. According to the current system, however, a registered unemployed is only eligible for the benefit for the first 6 months of unemployment. In future the Government is planning to extend the period of unemployment benefit from six months to a year, and to make it easier to qualify as a recipient. Pensions Currently the pension system is being financed on a PAYG basis, pensions depending on a successful collection of payroll taxes. Though some steps have already been made to introduce new categories of pensioners in order to differentiate pension rates, the pension system still provides a flat-rate benefit to the majority of pensioners. Since the new year, monthly pensions have been in the range GEL 35 to GEL 45 for war veterans and invalids and GEL 13 for all other categories of pensioners, which is going

EMPLOYMENT AND SOCIAL CONDITIONS
GEORGIAN ECONOMIC TRENDS – 1998 No.3 100
to be raised by 1 lari from 1 November, in accordance with a presidential decree. GEL 1.8 of each monthly pension is transferred direct to Sakenergo in an attempt to improve electricity payment collection, although war veterans have the privilege of paying only 50 per cent of the standard electricity tariff. In addition to USSF revenue from the collection of payroll tax, certain transfers are usually made from the state budget to alleviate the underfunding of pensions. The 1998 budget law provided for the allocation of GEL 16 million for this purpose, GEL 5 million for raising war veterans’ pensions and an additional GEL 6 million for paying arrears from 1997. The pension arrears persist, especially in some regions. Since Tbilisi accounts for 57.5 per cent of the overall USSF collection, the delivery of pensions in the capital is better compared to the rest of the country, though the tax revenue collected in Tbilisi is being transferred to the regions as well. Table 8.8: Payments of Pensions by the USSF and State Social Allowance, Q1 and Q2 1998
Recipients Sum paid
(GEL thousand)Average to be received
Recipients Sum to be paid (GEL
thousand)
Average to be received
Total Pensions 919,667 24,801.4 9.0 900,137 62,644.0 23.2 Working 784,632 19,086.9 8.1 762,927 47,215.9 20.6
War veterans & invalids 52,566 2,905.7 18.4 51,505 8,323.1 53.9 Widows of war veterans 9,001 190.8 7.1 10,313 634.3 20.5 Social 66,531 1,600.9 8.0 67,378 3,937.8 19.5 Personal 6,937 1,017.1 48.9 8,014 2,533.0 105.4
State social allowance 50,985 1,410.0 9.2 50,621 1,986.3 13.1
Q1, 1998 Q2, 1998
Source: Data from the United Social Security Fund and the Ministry of Social Affairs, Labour and Employment Note: Working pensions are those awarded after a fixed number of years of work, often to people under 65. Social pensions are awarded to those who reach retirement age. Personal pensions are those that used to be awarded for special achievement. The total number of pensions paid shown in the table is higher than the actual, since it also includes the arrears for the previous period paid in Q1 1998. Certain progress has been in improving control over the lists of pensioners. Full responsibility was handed to the United Social Security Fund (USSF) in 1997, basing on presidential decrees. By the beginning of January 1998 the transfer of responsibilities from the Ministry of Social Affairs, Labour and Employment had been completed though there is still a lot of work to be done to eliminate double registration. A re-registration of pensioners that was held between February and July revealed that pensions were being delivered basing on the lists 10 to 15 years old. As a result of the re-registration, about 35 thousand of recipients were eliminated from the list. According to the USSF's official figures, the total number of registered non-working pensioners stood at just above 900 thousand at the end of Q2 1998, about 20 thousand lower than at the end of Q1.However, an extremely low ration of contributors to beneficiaries renders the pension system unsustainable in the long term. Though this problem has been partially addressed, first (in 1995) by withdrawing eligibility from working pensioners and later (in February 1996) by raising the retirement age from 60 to 65 for men and from 55 to 60 for women the latter is largely a temporary solution since in 2001 the number of pensioner will start growing as new pensioners reach the pension age. The procedure of delivering pensions was concentrated in the hands of the Post Bank which won the tender of servicing pensions, announced by the Ministry of Finance. This should make the control over delivery of pensions centralised and hence, more effective.

EMPLOYMENT AND SOCIAL CONDITIONS
GEGIAN ECONOMIC TRENDS – 1998 No.3 101
The Government is strongly committed to pursuing reforms in the pension system aimed at streamlining extremely modest budgetary means in the most fair and efficient way possible. Currently, the pension system is funded through the USSF whose revenue comes from levies on payrolls7. The relatively high payroll tax rate is a heavy burden on many enterprises and no doubt encourages evasion, leaving the USSF with very limited funds at its disposal. The reduction of the payroll tax rate is currently being considered by the Government. The actual tax base for the social tax is very small compared to the potential tax base. Most revenue is raised from budgetary organisations and some large companies. As a consequence, budgetary wage arrears and the widespread practice of unpaid leaves, common with the enterprises standing idle, add to the pension arrears. The USSF has been suing quite a number of companies, winning about 90 per cent of the cases, however, mostly it happens rather de jure than de facto. The authorities consider to announce such companies bankrupt. A presidential decree of 3 June 1998 provided for the creation of a commission of considering the expediency of restructuring tax arrears of the companies. The coverage of USSF tax collection should be expanded, which is being considered by the Government. A presidential decree provided for procedures for levying payroll taxes on the self-employed and the employees of the private sector. However, it will be some time before the small private companies and the self-employed actually start paying payroll taxes, since at the moment there is no incentive for them to do so and there are no clear mechanisms of collecting taxes from them. The possibility of levying a social tax on agricultural land owners is also being considered. Since 1 October 1998 the function of collecting payroll tax was transferred from the USSF to the State Tax Inspectorate, which was preconditioned by the Tax Code, whereby the only body having the right of collecting taxes should be STI. The authorities expect this change to improve tax collection since the experience of the USSF inspectors, some of whom will continue their work with the STI, combined with the experience of the STI officials will make the process more efficient. In the meantime, the old age pension scheme, functioning on a pay-as-you-go basis, is to be backed up by new schemes. The draft law “On Providing Non-State Pensions” has been approved by the Parliament in the first reading. Another draft law - “On State Security” is being worked on at the USSF. The draft law on state social insurance, prepared jointly by the United Social Security Fund and the Health and Social Issues Parliamentary Committee, provides for a number of social welfare guarantees. Shifting the state pension system to a scheme of defined individual contributions would imply to a substantial extent loss of payroll tax collection reducing their scope as a device for supporting present commitments, which might further aggravate the fiscal situation in regard to sustaining present pension provisions, however, this would build up a more sustainable scheme for the medium- and long-term perspectives. Though, with the low household incomes it is difficult to predict how many people would go for it.
7 The contributions from workers’ wages, that form the United Social Security Fund (USSF) revenue are 26 per cent of gross wages for budgetary organisations and 27 per cent for others paid by the employer and 1 per cent paid by employees.

EMPLOYMENT AND SOCIAL CONDITIONS
GEORGIAN ECONOMIC TRENDS – 1998 No.3 102
THE SPECIAL STATE FUNDS As mentioned in Chapter 3, there are three Special State Funds8, whose revenue and expenditure is administered separately from the rest of the central state budget. In general each fund’s expenditure is tied to its revenue, and in the first two quarters of 1998 there was no significant difference between expenditure and revenue9. Consequently the performance of the Special State Funds has no direct impact on the state budget deficit. Table 8.2: Expenditure and Revenue of the Special State Funds (Quarterly, GEL million)
0
10
20
30
40
50
60
96Q2 97Q2 98Q2
Special State Funds, expenditure
Special State Funds, revenue
Social Security & Health Insurance revenue
Roads Fund revenue
Employment Fund revenue
Source: Ministry of Finance By far the most important of the funds is the amalgamated Social Security and Health Insurance Fund, which accounts for about 90 per cent of the Special State Funds’ turnover. The Fund is increasing strongly, with its underlying rate of growth at about 25 per cent a year in real terms. It is noticeable that the Social and Health Fund is characterised by a seasonal pattern of decline in Q1, strong growth in Q2, decline in Q3 and growth in Q4. This pattern is surprising as it does not correspond to the seasonal pattern of recorded GDP (which is generally much higher in Q3 and Q4 than in Q1 and Q2); the most likely explanation for this seems to be that the Fund’s revenue is determined by wages and salaries, whereas GDP is determined by output. In 1998 the Social and Health Fund’s growth has been particularly encouraging, with Q1 revenue not far below that of 1997 Q4 and a particularly strong increase in revenue in Q2. On the other hand, at under GEL 4 million the Roads Fund’s revenue in 1998 Q2 was actually lower than in Q1. This is disappointing as it rose in 1996 Q2 and 1997 Q2: the impression is that the Q1 figure was unusually high10 and that the Fund may even be declining in real terms. The limited amount of available data makes this difficult to judge: the alternative explanation is that 1998 Q2’s revenue was unusually low. At GEL 946 thousand in 1998 Q2, the Employment Fund is very small; there does seem to be some underlying growth, but - as with the Health Insurance Fund – there could be a case for merging it with the faster-growing Social Security Fund. 8 The Social Security Fund and Health Insurance Fund were merged in early 1997. 9 Quarterly surpluses and deficits in 1997 balanced each other. Quarterly expenditure data for 1996 is unavailable. 10 1998 Q1 Road Fund revenue was 77 per cent higher in nominal terms than in 1997 Q1.

EMPLOYMENT AND SOCIAL CONDITIONS
GEGIAN ECONOMIC TRENDS – 1998 No.3 103
Expenditure from the amalgamated Social Security and Health Insurance Fund and from the Employment fund now accounts for nearly half of total public expenditure on social security and health in Georgia: Table 8.3: Total Public Expenditure on Social Security and Health, 1997 Q1 – 1998 Q2 (Quarterly, GEL million)
0
10
20
30
40
50
60
97Q2 98Q2
From Special State FundsOther State social and healthLocal social and health
Source: Ministry of Finance GEL 84 million, aggregate public expenditure on social security and health in 1998 Q2 was equivalent to about GEL 5 per person per month.

CALENDAR OF EVENTS, APRIL-SEPTEMBER 1998
GEORGIAN ECONOMIC TRENDS – 1998 No.3 105
April 1 Regions (Abkhazia) / Electricity Abkhaz and Georgian negotiators agreed on a
40:60 division of electricity production from Inguri HES. 1 Business An Intellectual Property seminar was held in Tbilisi. 1 Finance Ivertbank was put into administration. 3 Regions (Shida Kartli) Georgian Finance Minister Chkuaseli met South Ossetian
Finance Minister Gagloeve for talks in Tskhinvali. 3 Competition / Agriculture The AMS annulled the Samtrest wine agreement. 7 Privatisation The second "zero-price" auction of 86 enterprises closed. Also Industria
(Russia) won the tender for control of Chiatura Manganese. 7 Infrastructure (rail) 24 applications were received for the contract to build the Kars-
Akhalkalaki railway linking Georgia with Turkey. 9 Privatisation Logovaz (Russia) won the tender for control of Maudi textiles. 11 to 18 Assistance IMF, World Bank and Georgian Government representatives met in
Washington to prepare for the IMF's May mission concerning ESAF credit. 13 Social The Ministry of Social Security was fiercely criticised for non-payment of
pensions. 13 Energy President Shevardnadze accepted David Zubitashvili's resignation from the
post of Minister of Fuel and Energy. 16 Defence The Georgian navy received delivery of a patrol boat supplied by the United
States. 16 Defence Georgia and Turkey sign a memorandum on defence cooperation, Turkey
providing up to USD 2 million in assistance. 17 Social Pensioners blocked the streets in Zugdidi in protest at the chronic non-payment
of pensions. 21 Trade / Agriculture Georgia suspended imports of meat from Turkey to prevent
spread of food and mouth disease. 22 Regions (Achara) / Governance The Achara-based Revival party, demanding
electoral and constitutional changes and greater political influence, announced that it would boycott the Georgian Parliament.
23 Regions (Mtskheta & Mtianeti) Britain announced that it would take delivery of 5 kg of nuclear material from Mtskheta.
26 Achara / Electricity The Georgian, Azerbaijani and Turkish Presidents attended a ceremony near Diriner (Turkey) to mark the start of work on a hydroelectric station on the Chorokhi River.
27 Defence President Shevardnadze sacked DM Vardiko Nadibaidze for negligence, replacing him with David Tevzadze (approved by Parliament on 28th).
27 Electricity Almost the whole of Georgia was left without electricity following strong winds.
28 Regions (Racha) / Social Landslides caused by melting snow left hundreds homeless in Racha.
28 Regions (Abkhazia, Achara) A delegation from Abkhazia visited Achara for talks on the prospects for economic cooperation.
28 Finance / Agriculture: The World Bank expanded the IFAD credit line for agriculture at TbilComBank from USD 0.5 m to USD 1 m.

CALENDAR OF EVENTS
106 GEORGIAN ECONOMIC TRENDS – 1998 No.3
28 Energy Parliament approved Temur Giorgadze's appointment as the new Minister of Fuel and Energy.
30 Regions (Imereti) The Sachkhere district in eastern Imereti was hit by floods. 30 Privatisation Georgian businessman Vladimer Goiashvili bought a controlling stake in
Laguna Vere JSC.
May 2 Infrastructure (air) Swiss Air commenced direct flights between Geneva and Tbilisi. 4 Privatisation / Regions (Kvemo Kartli) The Kvemo Kartli authorities demanded that
the sale of 47 per cent of Rustavi Metallurgy's shares be postponed. The deadline for the sale was prolonged to 1 August.
4 Privatisation The auction of 142 JSCs (including the Akhmeta biochemical plant, the Vake Hotel and Zugdidi Tea Plant No.1) closed.
5 Privatisation The Poti Fish JSC was sold to Ocean Sea Products Ltd (a company that is registered in the British Virgin Islands). Also at around the same time the Kutaisi Aviation Works were sold to Aviation of Russia.
5 Infrastructure (air) Austrian Airlines, in partnership with Georgia's Air Zena, commenced direct flights between Tbilisi and Vienna.
5 to 6 Infrastructure A Working Group meeting of Traceca was held to plan investment in transportation between Europe and Central Asia.
6 Social Pensioners held a demonstration in Rustavi in protest at late payment and non-payment of pensions.
6 Government revenue The Government met the Heads of SCD and STS to discuss revenue collection during the 1st quarter of 1998.
10 Competition / Agriculture A court ruled against the AMS in its legal case against Samtrest.
11 Assistance / Electricity / Agriculture / Privatisation The German Government allocated DM 90 m to Georgia (mostly as a soft loan), mainly for the renovation of Vartsikhe HES and to finance the establishment of the new land register.
11 Assistance / Infrastructure (rail) The EBRD reportedly allocated ECU 20 m for improving Georgia's rail network; the European Commission was reported to be planning to allocate a further ECU 8 m.
13 Finance / Agriculture IFAD's Vice-President van der Sand visited Georgia to monitor the credit lines that are being provided for small-scale farmers.
Mid-May Trade / Agriculture Imports of Turkish meat and eggs and of Indian frozen meat were banned. The Turkish meat was banned following an outbreak of foot-and-mouth disease in Turkey.
15 Infrastructure (air) / Regions (Achara) The Transport Ministers of Georgia and Turkey agreed on a USD 16 m plan to develop Batumi airport, to be financed by Turkey.
15 Government revenue & expenditure The Parliament approved the Ministry of Finance's report on the 1997 Budget.
15 Trade / Industry An agreement was signed in Brussels giving Georgian textile producers improved access to the European market.
16 Governance New professional qualification exams were held for sitting judges as part of Georgia's programme of strengthening the judicial system. The second round was subsequently held on 23 May, 61 of 312 applicants having passed the first round.

CALENDAR OF EVENTS
GEORGIAN ECONOMIC TRENDS – 1998 No.3 107
16 Infrastructure (ports) / Regions (Samegrelo) The Mayor of Poti announced that a USD 25 million tender for the first stage of the port's re-development would be held, and that the port's capacity would eventually rise to 10 mT.
19 Regions (Abkhazia) Around 20 Abkhaz militiamen were killed in the Republic's Gali district, apparently by ethnic Georgian guerrillas. This led to reprisals and conflict in which several hundred people were killed, and ended in the expulsion during the following few weeks of virtually all ethnic Georgians from Abkhazia (some 40,000 people).
19 Social (health) Health Minister Avtandil Jorbenadze told a press conference that the World Bank would allocate a further USD 20 million to Georgia's health service for the second stage of the First Aid Programme which begins in 1999.
19 Defence The US government allocated USD 0.5 m to assist the management of Georgia's defence resources.
19 Gas The Georgian government and Enron (US) signed a protocol concerning the construction of a pipeline running east-west across Georgia to carry gas from the Caspian to Turkey and continental Europe.
20 Defence The new Defence Minister Tevzadze sacked the Commander of the Georgian Navy.
22 to 22 June Privatisation An auction was held to sell the State's shares in 145 JSCs. 25 Regions (Abkhazia) Georgian and Abkhaz negotiators agreed a protocol aimed at
achieving a cease-fire. 28 Privatisation A seminar, funded by the German Government, was held to discuss
methods of valuing land and real estate. 28 Assistance Following the end of the IMF's Mission to Georgia, the IMF's resident
representative Hunter Monroe outlined the specific areas where progress is required before the next tranche of ESAF could be released.
29 Telecoms Interfax reported that work had begun on a sub-sea fibre-optic telecommunications cable between Poti and Sochi.
end-May Finance The EBRD bought a 10 per cent stake in Absolute Bank.
June 1 Infrastructure (rail) / Oil The Georgian Government decided to cut the tariff for the
rail transportation of Chevron's oil across Georgia. From 6 June the tariff per tonne was USD 6.20 and from 1 July USD 6.01.
1 Regions (Shida Kartli) The South Ossetian Deputy PM was assassinated. 2 Business A seminar on reform of Georgia's accountancy and auditing was held in
Tbilisi. 2 Assistance The European Commissioner responsible for the European Union's
relations with central and eastern Europe, Hans van den Broek, visited Georgia. 4-6 Trade The Yalta conference of the Black Sea Economic Cooperation (BSEC)
countries1 was held, and the BSEC Charter was signed establishing the BSEC as an international organisation. The conference declaration called for further trade liberalisation and harmonisation and for accession to the WTO.
7 Governance / Regions (Kakheti) A by-election in Lagodekhi was held, but the result was declared void because of allegations of electoral violations.
1 Albania, Armenia, Azerbaijan, Georgia, Greece, Moldova, Romania, Russia, Turkey and Ukraine.

CALENDAR OF EVENTS
108 GEORGIAN ECONOMIC TRENDS – 1998 No.3
11 to 12 Governance The Socialist and Labour parties joined the Revival party's boycott of Parliament. The Labour party complained about its lack of political influence, and the Socialist Party protested against the decision to re-run the Lagodekhi by-election.
11 Privatisation / Industry Poti Ship-Building was bought by a subsidiary of the South Korean-company Hyundai.
12 Foreign relations The United States announced that Kenneth Spencer Yalowitz would be the next US Ambassador to Georgia. (The post had been vacant for several months.)
12 Regions (Kvemo Kartli) / Infrastructure (roads) / Agriculture Torrential rain led to heavy flooding in Kvemo Kartli's western Tsalka district, causing serious damage to roads and agriculture in the district.
12 Electricity / Social Workers at Gardabani TPP2 went on strike in protest against the non-payment of several months' wages.
16 Money The Parliament approved the NBG's basic monetary and exchange rate policies for 1998, which are aimed at achieving an inflation target of 6 per cent and increasing foreign exchange reserves to USD 210 million.
17 Finance The NBG withdrew Ivertbank's license because of its violations of banking regulations. However Agrobank was removed from temporary administration following the interest shown in it by the Russian bank CBC-Agro.
19 Business The 4th congress of the Georgian Union of Industrialists was held. The main subject of debate was the level of taxation and the IMF's role in demanding high taxes. (A pamphlet, "IMF: Good or Evil" was distributed to the congress' participants.)
20 Finance The NBG began the liquidation of Ivertbank's assets. 20 Regions (Shida Kartli) President Shevardnadze and South Ossetian leader Ludwig
Chibirov met in Borjomi. Discussion of the difficult question of South Ossetia's status was avoided, and useful progress seems to have been made on logistical issues including the return of some 30,000 IDPs to the area.
20 Infrastructure The President passed a decree on Traceca to facilitate the international transportation of goods across Georgia.
21 Governance / Regions (Kakheti) At the re-held by-election in Lagodekhi, the government party candidate narrowly defeated the Socialist candidate, reversing the result of 7 June. The Socialists alleged further electoral violations.
24 Money The development of Georgia's fledgling financial market took another step forward as trading of exchange-rate futures contracts began on TIMEX. The closing price for July dollars was 1.355 Laris, slightly above the spot market rate of 1.348 but well below the initial rate of 1.370.
25 Regions (Abkhazia) Georgian and Abkhaz negotiators reported good progress towards new protocols on avoiding conflict, repatriating IDPs, and on economic reconstruction in the republic.
26 Governance On the last day before Parliament closed for the summer recess, the
Speaker Zurab Zhvania warned of a catastrophe and threatened to resign unless there were fundamental improvements in government policy. A week later the chairman of the Georgian parliamentary Committee on State and Legal Affairs, Mikheil Saakashvili, also threatened to resign unless the governmental structure was streamlined.
2 also known as TbilSRES, the Tbilisi state thermal power station.

CALENDAR OF EVENTS
GEORGIAN ECONOMIC TRENDS – 1998 No.3 109
28 Regions (Samegrelo) / Government revenue / Privatisation A Presidential Order stipulates that Poti's local authorities would receive more than 60 per cent (65 per cent of 95 per cent) of the receipts from the proposed privatisation of Poti port.
29-30 Infrastructure A conference on the development of transport links, organised by ARCO and titled the Restoration Of The Great Silk Road, was held in Tbilisi.
30 Governance The Georgian Government and World Bank held a seminar on public sector corruption in Georgia.
late June Foreign Investment The Ministry of Trade and Foreign Economic Relations decided to close down its Foreign Investments Agency which had been responsible for registering major foreign investments in Georgia (for statistical purposes).
30 to 1 July Trade A conference on trade policy organised by the Georgian Consulting Group, titled World And Regional Legal Institutions, was held in Tbilisi.
July
1 Privatisation / Infrastructure (air) The MSPM put 49 per cent of the shares in Georgian Airlines up for sale, with the offer due close on 15 September.
1 Tourism According to a resolution prepared by the Georgian Department of Tourism and Resorts, licenses for all services concerning tourism were required from 1 July.
1 Regions (Abkhazia) / Defence The separatist forces in Abkhazia began naval patrols of Abkhazia's coastline, two weeks before Georgian coast-guards assumed formal responsibility for patrolling Georgian waters.
3 Tourism A National Association of Hotel Businesses was established. 7 Privatisation / Electricity The Merrill Lynch consortium of energy consultants held a
seminar on the privatisation of Telasi, the Tbilisi electricity distribution company. 9 Governance / Regions Opposition representatives announced that they would ask
the Constitutional Court to abolish the territorial-administrative division of the country. The Labour Party leader Shalva Natelashvili indicated that this could lead to considerable savings in spending on administration.
14 Social A Polish secretary working at UNOMIG was murdered at her home, apparently after disturbing burglars.
16 Defence Georgian coast guards began patrols of Georgia's territorial waters, taking over responsibility from Russian forces.
16 Finance The EBRD opened a USD 7 million credit line with the Bank Of Georgia for SMEs. On 17th it opened a similar USD 1 million credit line at TbilComBank.
16 Regions (Guria) / Oil A court in Lanchkhuti ruled in favour of landowners whose property rights were violated during the construction of the Baku-Supsa oil pipeline.
17 Electricity / Regions (Abkhazia) Georgian and Abkhaz negotiators agreed a memorandum on a programme of repairs to Inguri HES.
24 Privatisation / Gas The offer of shares in the Tbilisi gas distributor TbilGas was closed.
25 Governance A major government meeting was held to discuss economic progress in the 1st half of 1998. Although the economy had continued its recovery, corruption was identified as a major political concern and therefore the State Minister decided that he and all other ministers should resign so that the President could appoint a new government. President Shevardnadze was also reported to be sharply critical of the Minister of Industry for not doing enough to strengthen Georgian industry.
26 to 27 Governance Most ministers resigned, but continued their duties in a "care-taking" capacity. President Shevardnadze said that the new government team should be in place by the middle of August. Later it emerged that new ministers would be appointed

CALENDAR OF EVENTS
110 GEORGIAN ECONOMIC TRENDS – 1998 No.3
for trade and foreign economic relations, state property management, communications, industry, justice, and education.
27 Assistance The IMF gave approval for the delayed tranche of ESAF to be disbursed. 30 Regions (Abkhazia) The UN Security Council extended UNOMIG's mandate until 31
January 1999 and condemned the Abkhaz separatist forces' actions aimed at expelling ethnic Georgians from the region.
30 Electricity An accident at Gardabani TPP disrupted power supplies to practically all of Georgia.
30 Governance Vazha Lortkipanidze, previously Georgia's Ambassador to Russia, was appointed as the new Minister of State.
August
1 Governance / Telecoms A parliamentary committee hearing on corruption discussed allegations that the outgoing Minister of Communications Pridon Injia had been involved in illegal sales of state assets. Injia held a press conference on 3 August, rejecting the allegations.
1 Regions (Imereti) Environment Minister Nino Chkhobadze announced that radioactivity had been discovered near two former Soviet army bases in Terjola and Khoni districts. She said that cleanup operations had already been completed at the Terdjola site and were continuing in Khoni.
4 Privatisation / Gas The Ministry of State Property Management announced that British-Georgian InterGas3 had won the tender for 76 per cent of the shares of gas distributor TbilGas.
7 Governance President Shevardnadze formally accepted the resignations of four Ministers (Industry, Trade and Foreign Economic Relations, State Property Management, and Justice).
7 Government revenue / Trade President Shevardnadze and Minister of State Lortkipanidze met the head of the SCD to discuss further reform of the customs.
8 Governance / Privatisation / Industry / Social / Telecoms Parliament approved the appointment of new ministers of state property management, industry, justice, and education, but rejected the proposed candidate for the communications ministry.
10 Agriculture President Shevardnadze passed a Decree on leasing state-owned agricultural land.
10 Government revenue Budget revenue for the 1st half of 1998 was 21 per cent below target, President Shevardnadze announced.
11 Regions (Samegrelo) Ethnic Abkhaz groups made armed raids on villages in the Zugdidi and Tsalendjikha districts bordering Abkhazia.
13 Regions (Samtskhe Javakheti) A military exercise in the predominantly ethnic Armenian district of Akhalkalaki was aborted when soldiers were confronted by armed local people.
17 Trade Russia announced that it was devaluing the rouble. The immediate impact of this on the Georgian economy was not significant.
22 Regions (Samtskhe Javakheti) A leader of the ethnic Armenian Javakh movement called for four of the region's districts to be given autonomous status; he also said the local population is opposed to the construction of a rail link between Kars and Akhalkalaki.
3 This Intergas should not to be confused with a company with the same name, which is operating in Central Asia and is a subsidiary of the Belgian gas concern Tractebel.

CALENDAR OF EVENTS
GEORGIAN ECONOMIC TRENDS – 1998 No.3 111
23 Stability The reform-minded Russian Government was dismissed. Subsequent political discord led to major uncertainty over the future direction of Russian economic policy.
26 Tourism A governmental session considered the prospects for tourism. The state department for tourism and resorts considers that the basic conditions for a revival in tourism are now in place and that the main problem is lack of investment.
28 Government revenue Petrol prices reportedly rose by 20 per cent following an increase in excise duties.
September
1 Governance The autumn session of the Georgian parliament began. 1 Banking The NBG withdrew the license of the commercial bank Armazibank. 2 Oil / Regions (Abkhazia) The Abkhaz leadership expressed its support for the
possible construction of an oil pipeline from Supsa through Samegrelo and Abkhazia to the Russian port of Novorossiisk.
5 to 7 Money A speculative attack on the Lari brought it down to a level of around 1.80 per USD at the weekend. Intervention by the NBG on 7 September restored its value to the previous level of around 1.35.
7 to 8 Infrastructure A key conference on infrastructural development of the “Silk Road” transport corridor was held in Baku, culminating in the Baku Declaration.
7 to 10 Trade Coinciding with a week of celebrations of 2600 years of Judaism in Georgia, Israel and Georgia signed several cooperation agreements including one on customs. Further bilateral agreements are under preparation, including one on trade and another on standardisation and certification.
8 Defence The Russian naval frontier forces completed their withdrawal from the Abkhazian port of Sokhumi.
9 Money / Shadow economy The NBG began a campaign of closures of foreign exchange bureaux: Georgian Business News No.254 (11-18 September) reported that 136 bureaux had been closed because of minor technicalities. Officials of international organisations are unimpressed: the only tangible effect of such campaigns is to force small-scale businesses out of the formal economy.
14 to 27 Economic stability An IMF mission visited Georgia to review the progress of the 1998-2000 structural adjustment programme. The IMF was particularly concerned about the shortfall in government revenue, with total government income for January to August 26 per cent below target.
19 Government revenue The President of the Tax-payers’ Union was appointed as the new head of the State Tax Service.
25 Government revenue Parliament began to debate the 1999 Budget. 30 Privatisation Three bids were received for the tender to renovate the hydroelectric
station at Lajanuri. 30 Money Trading of the Lari closed at the end of 1998 Q3 at an exchange rate of
1.367 per USD.

STATISTICAL APPENDIX
GEORGIAN ECONOMIC TRENDS – 1998 No.3 113
CONTENTS
Guidance on the Accuracy of Statistics
Table A3.1 Composition of Total Tax Revenue
Table A3.2 Apparent Consolidated Expenditure
Table A4.1 Accounts of the National Bank of Georgia
Table A4.2 Consolidated Accounts of Commercial Banks
Table A4.3 Monetary Survey
Table A4.4 Results of Credit Auctions
Table A6.1 Georgia’s Exports by Destination
Table A6.2 Georgia’s Imports by Country of Origin
Table A7.1 Establishment of JSCs by Regions, as of 1st Julyl, 1998
Table A7.2 Small Privatisation by Regions, as of 1st July, 1998
Table A7.3 Electricity Supply
Table A7.4 Electricity Consumption and Payment by Sector
Table A7.5 Georgian Output of Selected Products
Table A8.1 Hired Employees’ Average Monthly Salaries by Sector by Region, Q2 1998
Table A8.2 Hired Employment by Sector by Region, Q2 1998
Table A8.3 Self-employees’ Average Monthly Net Income by Sector by Region, Q2 1998
Table A8.4 Sefl –employment by Sector by Region, Q2 1998
Note: First digit in the number of an appendix table indicates the number of the chapter to which it belongs.
STATISTICAL APPENDIX
114 GEORGIAN ECONOMIC TRENDS – 1998 No.3
GUIDANCE ON THE ACCURACY OF STATISTICS As indicated in previous editions of GET, the accuracy of data is very variable and many statistics are subject to major revision. To some extent this is the case in every country, but Georgia (in common with most transition economies) faces particular problems with some of its statistics. Some of these result from the use of inappropriate methodology dating from the Soviet era, while others are caused by mis-reporting due either to incompetence or to dishonesty. In spite of these difficulties and the impact of very low state salaries on morale, most government ministries seem to do a commendable job in collecting and providing statistics. For many output and financial statistics we have used the differences between the cumulative figures provided for 3, 6, 9 and 12 months to derive quarterly figures for 1997. Because the figures are still collected on a cumulative basis, it is not generally clear whether quarterly fluctuations are actual or result from major revisions to earlier data. (For example, on government expenditure a portion of the GEL 41.56 million that Table 3.6 shows for administration in Q4 1997 might incorporate an upward statistical revision of the abnormally low Q3 figure of GEL 6.35 million; on the other hand, considering that actual expenditure tends to be determined by actual revenue, it might reflect payments during Q4 of administrative staff's salaries that should have been made in Q3 but had to be delayed until Q4 when seasonally high revenues provided departments with adequate cash.) Unfortunately this method of collection does not enable us to identify revisions, and thus requires us to judge for ourselves whether revisions are required. The general assumption is that revisions are not required unless the need for them is clearly identified, as sometimes happens when items are re-classified between on report and another. Chapter One The accuracy of the figures quoted in the summary and short economic report are discussed in relation to the relevant chapters below. Chapter Two One of the greatest areas of difficulty is national accounting. The GDP statistics are based on unreliable production figures; the current account statistics are based on unreliable trade data and the capital account figures are based on highly judgemental estimates of capital flows. All of these problems are discussed in greater detail in the relevant chapters. On the other hand, the external debt figures tend to be accurate by their very nature and the inflation rate also seems accurate. Chapter Three Government revenue and expenditure figures are still collected and provided on a cumulative rather than periodic basis - for example, May data provides aggregate figures for January to May instead of the monthly breakdown. Fortunately the budgetary figures now seem to be consistent and are rarely in need of major revision; consequently this edition has derived series of "apparent" quarterly data by looking at the differences between 3-, 6-, 9- and 12-month reports. However, unexpected changes in the classification of some non-tax revenue and expenditure items can still be the cause of confusion. Chapter Four To the best of our knowledge the NBG provides accurate data on items such as monetary aggregates, bank deposits, Treasury Bills etc. The figures for foreign exchange rates and price inflation are

STATISTICAL APPENDIX
GEORGIAN ECONOMIC TRENDS – 1998 No.3 115
certainly realistic, and as in other countries the methodology used for the CPI basket is now based on household survey data. The only really questionable data concerns the calculation of "average" interest rates: a large part of the problem seems to be that the banking sector in Georgia is still at a rather low level of development. Chapter Five As this is a relatively new chapter GET is still building up its data-set. Most of the statistics concerning infrastructure are calculated on the basis of figures published in various news reports: as far as possible, GET checks one source against another in order to judge whether information is accurate or not. The social data-set (populations, levels of employment etc.) in the regional section seems plausible, but we must wait until the results of next year's census to be reasonably confident of such information. Although GET's access to regional production figures has been limited until now, the evidence so far suggests that there are major inconsistencies in the reported data which cast doubt on the validity of the aggregate output figures. By contrast the budgetary data appears to be accurate. Chapter Six As with most other countries, Georgia's trade data is problematic due to under-reporting and problems of classification. In particular, the evasion of trade-related taxes seems likely to lead to extensive under-reporting of both imports and exports. Chapter Seven There is enough information to provide a reasonably accurate picture of the progress being made in restructuring and privatising Georgian enterprises. The biggest area of uncertainty is measurement of the sizes of state-owned and privatised enterprises rather than just the numbers in each group. This uncertainty is related to the problems concerning production data: some of the available evidence suggests that there are major inconsistencies, but not enough information is yet available to enable re-estimates to be made. Clearly the large scale of the shadow economy (officially estimated at some 40 to 50 per cent of GDP) also complicates matters, as does the ad hoc way in which the authorities sometimes try to estimate its effects. On the other hand, physical output data for industry seems relatively accurate. GET is still revising its data-set on agriculture. Chapter Eight The big differences between household surveys and other information, such as data from the social welfare offices, show how difficult it is to produce internationally-comparable figures concerning labour-market and social conditions. This impact of the shadow economy is part of the problem: there are also cultural and institutional factors (employment regulations may encourage managers to retain a large workforce for nominal wages). On the other hand, the various sources of information seem to point to different aspects of the same basic picture of employment and income distribution.

Table A3.1: Composition of total tax revenue(GEL thousand)
96Q1 96Q2 96Q3 96Q4 97Q1 97Q2 97Q3 97Q4 98Q1 98Q2Income tax 6 421 10 372 12 620 17 621 15 055 17 160 20 015 24 696 17 931 20 881Profit tax 5 627 10 390 8 505 7 706 8 965 9 787 9 094 10 982 10 500 11 883Total VAT 18 719 30 939 39 886 48 549 39 732 44 845 56 533 64 361 47 662 52 556Domestic 16 811 27 707 35 418 35 333 27 332 27 604 35 056 40 108 24 854 24 583On Imports 1 908 3 232 4 468 13 216 12 400 17 241 21 477 24 253 22 808 27 973Customs duty 2 486 5 391 5 020 2 857 7 722 12 900 19 945 20 608 14 520 18 969Excise duty 778 2 090 2 152 10 851 10 851 17 004 15 677 9 219 8 947 11 666 on dom. production 642 1 429 842 1 515 901 1 059 1 615 1 225 731 873 on imp. production 136 661 1 310 9 336 9 950 15 945 14 062 7 994 8 216 10 793Other taxes 6 703 12 654 13 034 25 563 8 743 11 213 13 625 15 909 11 549 16 388TOTAL 57 545 99 543 116 635 148 480 118 400 140 513 169 945 185 883 135 965 156 926Source: Ministry of Finance

Table A3.2: Apparent consolidated expenditure(GEL thousand)
CATEGORY 97Q1 97Q2 97Q3 97Q4 98Q1 98Q2Administration 23 434 28 657 41 467 60 679 17 942 20 790 Defence 15 773 17 737 19 952 14 593 14 449 15 985 Law and Order 18 876 22 029 20 268 32 441 17 981 22 107 Education 21 837 24 989 25 797 40 032 23 783 29 936 Health Care 8 991 6 628 13 284 10 739 7 543 8 917 Social Security 44 638 10 448 34 054 34 816 30 051 35 287 Culture, Sport and Religion 9 574 14 238 14 264 13 408 12 222 12 676 Other expenditure ex SSF 37 711 84 619 32 416 86 011 75 217 81 693 TOTAL 180 835 209 344 201 502 292 718 199 188 227 392
State onlyCATEGORY 97Q1 97Q2 97Q3 97Q4 98Q1 98Q2
Administration 20 600 25 626 6 350 41 561 13 817 17 051 Defence 15 700 17 603 19 814 14 458 14 347 15 836 Law and Order 18 600 19 933 18 664 30 350 16 345 19 570 Education 8 800 9 071 8 166 18 547 8 475 8 140 Health Care 7 000 3 140 9 563 6 072 4 780 5 205 Social Security 44 500 9 940 33 532 34 243 29 614 33 439 Culture, Sport and Religion 6 700 9 783 8 828 8 844 8 306 7 911 Other expenditure ex SSF 22 400 65 331 44 360 71 981 58 848 54 793 TOTAL 144 300 160 427 149 275 226 055 154 532 161 945
Local onlyCATEGORY 97Q1 97Q2 97Q3 97Q4 98Q1 98Q2
Administration 2 834 3 031 35 116 19 118 4 125 3 740 Defence 73 134 138 135 102 149 Law and Order 276 2 096 1 605 2 090 1 636 2 537 Education 13 037 15 918 17 632 21 485 15 308 21 796 Health Care 1 991 3 488 3 722 4 667 2 763 3 712 Social Security 138 509 522 573 437 1 848 Culture, Sport and Religion 2 874 4 455 5 436 4 564 3 916 4 765 Other expenditure ex SSF 15 311 19 287 11 944- 14 030 16 369 26 900 TOTAL 36 535 48 917 52 227 66 662 44 656 65 447
Source: Ministry of Finance

Table A4.1: Accounts of the National Bank of Georgia (GEL thousands)
Mar Apr May Jun Sep Dec Jan Feb Mar Apr May JunNet International Reserves -99 219 -123 561 -155 854 -160 118 -153 923 -105 982 -126 008 -139 651 -150 269 -152 008 -164 947 -177 341 Foreign exchange (1) 139 008 161 680 135 097 130 069 131 328 225 936 212 340 198 455 187 118 186 850 174 284 160 456 Use of IMF resources -239 046 -285 497 -291 211 -290 448 -285 444 -332 003 -338 432 -338 191 -337 576 -339 047 -339 420 -337 982 Other foreign assets (net) (2) 818 256 261 261 193 84 84 84 189 189 189 185
Net Domestic Assets 299 491 332 727 361 689 368 283 403 811 383 048 385 902 394 458 410 059 422 977 431 570 449 370 Net Claims on General Government 301 465 338 143 349 891 366 644 411 198 396 981 408 765 418 902 429 045 443 011 452 966 478 258 Net Claims on Banks 10 562 10 624 9 024 5 311 4 393 3 470 2 515 2 472 2 397 2 745 2 713 2 154 Other assets net -12 536 -16 039 2 773 -3 673 -11 779 -17 403 -25 379 -26 916 -21 383 -22 779 -24 108 -31 041
Reserve Money 200 272 209 166 205 835 208 165 249 888 277 066 259 894 254 807 259 791 270 969 266 623 272 030 Currency in circulation 170 569 183 023 175 281 178 183 220 330 254 555 231 311 227 331 228 985 237 560 238 970 236 768 Banks' deposits 29 702 26 143 30 554 29 982 29 558 22 511 28 584 27 476 30 805 33 409 27 653 35 261 Required reserves 12 736 13 842 13 655 14 301 15 157 15 653 14 946 16 985 17 436 17 093 16 846 17 873 Balances on correspondent accounts 16 967 12 300 16 899 15 681 14 401 6 859 13 638 10 491 13 369 16 316 10 807 17 389
Source: National Bank of Georgia Notes : (1) Figures for Foreign Exchange and Net Claims on General Government have been revised by the NBG since March 1997 and before by GET. (2) Includes Gold and RUR denominated net foreign assets
19981997

Table A4.2: Consolidated Accounts of Commercial Banks (GEL thousands)
1997 1998Mar Jun Sep Dec Jan Feb Mar Apr May Jun
Net Foreign Assets 25 805 25 899 37 139 33 005 26 573 16 680 23 226 13 545 22 078 24 626 Foreign exchange 34 893 42 029 55 496 47 223 48 265 41 139 46 434 43 147 54 130 57 952 Foreign currency liabilities -10 123 -17 502 -19 665 -15 578 -23 020 -25 758 -24 562 -31 301 -33 745 -35 374 Other foreign assets (net) (1) 1 035 1 372 1 307 1 360 1 329 1 299 1 354 1 699 1 693 2 048
Net Domestic Assets 61 711 77 094 95 829 100 172 118 897 133 162 124 971 140 072 138 589 141 757 Domestic Credit 119 805 137 447 145 258 170 028 183 732 192 502 188 945 189 676 192 534 199 470 Net Claims on General Government -18 516 -10 876 -9 668 -2 913 -5 750 -8 055 -7 191 -5 552 -7 295 -2 087 Claims on the Rest of the Economy 138 321 148 323 154 926 172 940 189 481 200 557 196 135 195 228 199 829 201 557 Claims on Enterprises (GEL) 76 181 76 831 67 400 71 750 71 907 73 619 67 457 66 581 65 354 64 641 Claims on Individuals (GEL) 15 228 17 708 18 584 24 195 24 709 24 715 25 051 24 482 25 385 27 719 Other claims 23 19 4 4 4 4 4 4 4 4 Foreign Currency Loans 46 889 53 764 68 938 76 992 92 861 102 219 103 624 14 161 109 086 109 194 Other Assets Net -58 094 -60 353 -49 429 -69 856 -64 834 -59 340 -63 973 -49 604 -53 945 -57 713
Deposit Liabilities 87 515 102 993 132 968 133 177 145 471 149 842 148 197 153 616 160 667 166 382 GEL Deposits 46 776 46 907 62 054 55 346 59 609 61 219 57 798 58 513 58 539 60 762 Of which: Enterprises' Current A/Cs 17 797 15 992 46 029 37 697 41 511 43 875 40 903 41 599 42 262 44 000 Foreign Currency Deposits 40 740 56 086 70 913 77 832 85 861 88 623 90 399 95 104 102 128 105 621
Source: National Bank of GeorgiaNote: (1) Includes Gold and RUR denominated net foreign assets

Table A4.3: Monetary Survey (GEL thousands)
Mar Jun Sep Dec Mar Apr May JunNet Foreign Assets -73 415 -134 219 -116 784 -72 977 -127 043 -138 463 -142 869 -152 715 Foreign exchange 173 901 172 098 186 824 273 160 233 552 229 997 228 415 218 408 Foreign liabilities -249 169 -308 507 -305 666 -347 581 -362 138 -370 348 -373 165 -373 356 Other foreign assets (net) (1) 1 854 2 190 2 058 1 445 1 543 1 888 1 881 2 233
Net Domestic Assets 319 223 405 868 452 154 446 022 487 143 512 014 525 169 540 046 Domestic Credit 421 269 504 091 556 456 567 009 617 990 632 687 645 499 677 728 Net Claims on General Government 282 949 355 768 401 530 394 069 421 855 437 459 445 671 476 170 Net Claims on Republican Government 305 682 362 403 409 350 399 920 431 571 445 550 455 993 484 100 Net Claims on Local Government -5 090 -4 523 -4 279 -2 415 -4 788 -2 847 -4 612 -3 147 Net Claims on Pension Fund -970 -1 076 -1 195 -899 -946 -1 108 -748 -983 Other Extra-Budgetary Funds -16 675 -1 035 -2 346 -2 540 -3 982 -4 136 -4 963 -3 800 Claims on the Rest of the Economy 138 321 148 323 154 926 172 940 196 135 195 228 199 829 201 557 Other items, net -102 046 -98 224 -104 302 -120 987 -130 847 -120 673 -120 330 -137 682
Broad Money (M3) 245 808 271 648 335 369 373 042 360 100 373 550 382 300 387 331 Broad Money, excl. foreign currency deposits (M2) 205 068 215 562 264 456 295 211 269 700 278 447 280 172 281 710 Currency in circulation 170 569 178 183 220 330 254 555 228 985 237 560 238 970 236 768 Currency outside banks (MO) 158 293 168 656 202 402 239 865 211 903 219 934 221 633 220 948 Cash in commercial banks 12 277 9 527 17 928 14 690 17 082 17 626 17 337 15 820 Deposit Liabilities (GEL) 46 776 46 907 62 054 55 346 57 798 58 513 58 539 60 762 Foreign Currency Deposits 40 740 56 086 70 913 77 832 90 399 95 104 102 128 105 621
Source: National Bank of GeorgiaNotes: (1) Includes Gold and RUR denominated net foreign assets
1997 1998

Table A4.4.1: Results of Seven Day Credit Auctions (GEL)
Auction Auction Interest Rate NBG activity Inter-bankNumber Date volume (annualised) Lending Borrowing Activity
102 5-08-97 295 000 12 0 0 295 000103 12-08-97 1 660 000 22 1 060 000 0 600 000104 19-08-97 60 000 15 0 0 60 000105 26-08-97 500 000 23 0 0 500 000106 2-09-97 250 000 16 0 0 250 000107 9-09-97 157 000 15 0 157 000 0108 16-09-97 200 000 15 0 200 000 0109 30-09-97 200 000 9 0 0 200 000110 7-10-97 900 000 15 700 000 0 200 000111 28-10-97 1 000 000 16 900 000 0 100 000112 11-11-97 90 000 23 0 25 000 65 000113 18-11-97 100 000 20 0 100 000 0114 25-11-97 450 000 19 0 0 450 000115 2-12-97 95 000 20 0 0 95 000116 16-12-97 565 000 27 500 000 0 65 000117 23-12-97 800 000 34 0 0 800 000118 30-12-97 395 000 43 0 0 395 000119 6-01-98 330 000 45 0 0 330 000120 13-01-98 280 000 38 0 0 280 000122 27-01-98 300 000 24 0 300 000 0123 3-02-98 250 000 20 0 0 250 000126 24-02-98 1 218 500 25 0 0 1 218 500127 10-03-98 320 000 36 0 0 320 000128 17-03-98 560 000 37 0 0 560 000129 24-03-98 277 000 28 0 0 277 000130 31-03-98 290 000 46 0 0 290 000131 7-04-98 600 000 34 0 0 600 000132 14-04-98 9 500 21 0 0 9 500133 21-04-98 450 000 30 0 0 450 000134 28-04-98 700 000 33 0 0 700 000135 05-05-98 210 000 27 0 0 210 000136 09-06-98 118 500 11 0 0 118 500137 23-06-98 150 000 12 0 150 000 0138 30-06-98 290 000 20 0 0 290 000
Table A4.4.2: Results of Thirty Day Credit Auctions (GEL)
Auction Auction Interest Rate NBG activity Inter-bankNumber Date volume (annualised) Lending Borrowing Activity
54 08-05-97 546 000 19 0 0 546 00055 15-05-97 1 247 000 19 947 000 0 300 00056 22-05-97 220 000 19 0 70 000 150 00057 19-06-97 200 000 21 50 000 0 150 00062 07-08-97 800 000 30 740 000 0 60 00063 14-08-97 73 000 30 0 0 73 00064 21-08-97 950 000 30 650000 0 300 00065 04-09-97 830 000 30 680 000 0 150 00066 02-10-97 350 000 30 160 000 190 00067 09-10-97 1 000 000 30 800 000 0 200 00068 16-10-97 1 428 750 30 578 750 0 850 00069 30-10-97 1 080 000 29 280 000 0 800 00070 06-11-97 1 449 300 30 599 300 0 850 00071 13-11-97 260 000 30 3 500 0 256 50072 20-11-97 903 000 40 0 0 903 00073 27-11-97 80 000 35 0 0 80 00074 11-12-97 218 000 41 0 0 218 00075 18-12-97 1 930 000 49 0 0 1 930 00076 25-12-97 1 010 000 48 0 0 1 010 00077 15-01-98 770 000 34 0 0 770 00078 22-01-98 2 380 000 36 0 0 2 380 00079 29-01-98 740 000 36 0 0 740 00080 12-02-98 205 000 44 0 0 205 00081 19-02-98 784 000 36 0 0 784 00082 26-02-98 1 370 800 37 0 0 1 370 80083 5-03-98 1 220 000 43 0 0 1 220 00084 19-03-98 219 000 38 0 0 219 00085 26-03-98 586 000 44 0 0 586 00086 02-04-98 1 068 000 40 0 0 1 068 00087 16-04-98 447 000 40 0 0 447 00088 23-04-98 692 400 34 0 0 692 40089 30-04-98 449 000 32 0 0 449 00090 07-05-98 350 100 27 0 0 350 10091 14-05-98 1 060 000 27 0 0 1 060 00092 28-05-98 810 000 23 0 0 810 00093 4-06-98 235 600 27 0 0 235 60094 11-06-98 650 000 28 0 0 650 00095 18-06-98 434 000 28 0 0 434 00096 25-06-98 520 000 22 0 520 000 0
Table A4.4.3: Results of Sixty Day Credit Auctions (GEL)
Auction Auction Interest Rate NBG activity Inter-bankNumber Date volume (annualised) Lending Borrowing Activity
1 01-02-96 20 000 46 0 0 20 0002 11-04-96 13 000 60 0 0 13 0003 23-05-96 50 000 60 0 0 50 0004 05-09-96 74 000 41 4 000 0 70 0005 26-09-96 29 700 35 29 700 0 06 16-04-98 800 000 31 0 0 800 0007 23-04-98 200 000 31 0 0 200 0008 30-04-98 170 000 29 0 0 170 0009 18-06-98 900 000 33 0 0 900 00010 25-06-98 800 000 23 0 0 800 000
Table A4.4.4: Results of Ninety Day Credit Auctions(GEL)
Auction Auction Interest Rate NBG activity Inter-bankNumber Date volume (annualised) Lending Borrowing Activity
45 07-08-97 62 000 30 62 000 0 046 14-08-97 500 000 30 300 000 0 200 00047 21-08-97 38 000 30 38 000 0 049 25-09-97 158 000 32 0 0 158 00050 02-10-97 168 000 30 168 000 0 051 09-10-97 102 000 30 102 000 0 052 23-10-97 630 400 31 630 400 0 053 22-01-98 45 400 44 0 0 45 40054 29-01-98 634 000 34 0 0 634 00055 05-02-98 100 000 45 0 0 100 00056 12-02-98 302 000 48 0 0 302 00057 26-02-98 60 500 44 0 0 60 50058 05-03-98 70 000 48 0 0 70 00059 23-04-98 9 500 35 0 0 9 50060 30-04-98 456 350 29 0 0 456 35061 21-05-98 55 000 28 0 0 55 00062 28-05-98 337 000 24 0 0 337 00063 04-06-98 19 800 30 0 0 19 80064 18-06-98 120 000 38 0 0 120 000
Source: National Bank of Georgia

Table A6.1: Georgia's exports by destination(USD Thousand)
Country Q.1 Q.2 Q.3 Q.4 Total Q1 Q2Anguilla - 1 163 3 515 2 254 6 932 - - Arab Emirates - 60 55 - 116 73 224 Argentina - Armenia 1 957 6 036 3 396 7 552 18 942 3 917 4 012 Australia - 0 - - 0 - - Austria 120 - - 3 123 1 15 Azerbaijan 5 147 7 460 5 498 6 996 25 101 2 378 7 772 Bahamas - Bahrain - Belgium 0 231 22 1 917 2 170 1 281 393 Belorus 214 107 389 352 1 061 154 262 Botswana - Brazil - Bulgaria 1 785 1 839 2 921 2 208 8 754 419 1 246 Butung 31 Canada - Cape Verde - China + HK 9 621 99 152 882 8 26 Colombia 0 - - - 0 4 - Costa-Rica - Cote D'Ivoire - Cyprus - - - 0 0 - 19 Czechia - - 22 72 94 20 14 Denmark 160 - - 55 215 176 0 Ecuador - Egypt - 70 - 0 70 - 16 Estonia - 56 - 58 113 - 62 Falkland Islands - Finland - France 1 1 0 16 18 26 115 French Polynesia - Gabon - Germany 2 281 2 507 72 35 4 896 1 977 2 507 Gibraltar - Greece 704 0 134 33 871 137 91 Guyana - Hungary - 4 - 38 41 7 31 Iceland - India - 305 - - 305 - 189 Indonesia - - - 0 0 - - Iran 687 1 238 745 1 108 3 779 985 463 Ireland - - - - - 10 1 Israel 43 9 81 39 172 14 31 Italy 2 254 202 208 2 450 5 115 651 3 528 Jamaica - Japan - - 1 - 1 - 3 Jordan - Kazakhstan 312 919 1 376 1 067 3 675 1 136 187 Kenya - 22 34 5 61 78 (0) Kirgizstan 1 72 48 51 172 12 73 Korean PDR - Korean Republic - - - 2 2 - - Kuwait - Latvia 0 - 16 20 36 29 18 Lebanon - Liberia - Liechtenstein 0 - 37 3 40 - - Lithuania 2 185 3 1 190 16 89 Luxembourg - Macedonia - Malaysia - - 20 - 20 - - Maldives - - - 0 0 - - Malta - Mauritania - Mexico - Moldova 55 64 6 96 220 38 53 Monaco - Mongolia - 134 128 152 415 72 34 Netherlands 202 172 106 207 686 437 1 380 New Zealand - - - - - 2 1 Nigeria - Norway - - - 191 191 - - Oman - Pakistan - - - 0 0 - - Panama - Peru 9 Poland 147 103 140 40 430 117 150 Portugal 45 62 22 32 160 30 11 Romania - 110 0 - 110 - 80 Russia 6 805 20 238 20 087 21 471 68 600 12 584 15 442 S.Africa - Saudi Arabia - Singapore - Slovakia 2 - - - 2 - - Slovenia - Spain 0 48 14 18 80 172 37 Sri Lanka - Sweden 22 - - - 22 - - Switzerland 3 713 4 986 2 657 2 493 13 849 2 787 2 650 Syria - - - 2 2 - 389 Taiwan - Tajikistan 130 167 176 196 669 101 175 Thailand - - - 9 9 - - Togo 11 Tonga - Turkey 5 851 7 147 5 745 11 297 30 040 4 649 5 826 Turkmenistan 1 366 1 879 13 2 356 5 614 369 222 Uganda 0 - - - 0 - - Ukraine 1 214 1 538 2 363 3 297 8 413 1 320 1 973 United Kingdom 1 450 1 230 818 711 4 208 51 191 USA 291 1 494 2 117 317 4 219 1 762 4 582 Uzbekistan 116 506 1 963 2 172 4 758 657 280 Venezuela - Vietnam - - - - - 10 0 Virgin Islands - - 308 110 418 256 0 Xmas Island - Yugoslavia 0 0 1 25 26 - - Zambia 214 Total of above 37087,471 62984,828 55359,167 71677,896 227109,36 38919,7 55125,3Source: State Department for Statistics
1997 1998

Table A6.2: Georgia's Imports by Country of Origin(USD Thousand)
Country Q.1 Q.2 Q.3 Q.4 Total Q1 Q2Anguilla - - 129 245 374 - - Arab Emirates 1 767 4 432 5 785 3 862 15 846 3 824 4 802 Argentina - - - - - 941 105 Armenia 4 631 4 015 5 276 7 870 21 792 1 631 1 686 Australia 45 0 107 558 710 335 279 Austria 3 898 1 482 959 1 957 8 295 1 506 1 770 Azerbaijan 20 069 25 997 27 480 41 964 115 509 18 528 25 620 Bahamas 651 71 316 - 1 038 23 41 Bahrain - - - 4 4 - - Belgium 821 1 174 6 383 4 739 13 117 1 502 4 298 Belorus 544 512 683 994 2 733 428 777 Botswana - 1 - 12 13 - - Brazil 20 33 9 96 158 - 77 Bulgaria 9 475 13 227 13 796 9 650 46 147 8 300 7 697 Butung - - - 6 6 - - Canada 45 45 713 141 944 141 306 Cape Verde - - - 0 0 - - China + HK 121 175 722 692 1 710 160 1 529 Colombia - - - 0 0 - - Costa-Rica - - - 28 28 - 88 Cote D'Ivoire 5 Cyprus 179 170 300 119 769 787 292 Czechia 438 661 804 810 2 713 666 1 749 Denmark 623 443 702 1 075 2 843 1 562 1 658 Ecuador 142 122 53 782 1 099 405 464 Egypt 23 3 - 17 43 - - Estonia 7 14 51 77 150 14 48 Falkland Islands 1 - - - 1 - - Finland 35 64 2 796 1 101 3 996 109 212 France 2 424 5 791 5 043 4 344 17 602 6 580 6 179 French Polynesia - 1 - - 1 - - Gabon - - - - - 1 500 166 Germany 8 974 10 499 10 018 10 441 39 932 8 512 19 888 Gibraltar 5 - - - 5 - - Greece 2 501 1 260 3 060 7 535 14 356 5 649 9 600 Guyana - - - 1 1 - - Hungary 1 536 2 205 2 834 1 694 8 270 3 580 3 342 Iceland 208 India 27 59 80 182 348 59 125 Indonesia 213 0 94 81 388 23 33 Iran 470 882 1 250 976 3 578 875 950 Ireland 838 459 583 54 1 934 179 1 144 Israel 1 666 5 232 2 876 4 787 14 562 2 311 730 Italy 7 680 10 010 12 868 10 695 41 253 7 299 7 080 Jamaica 1 - - - 1 188 21 Japan 11 20 209 174 414 318 725 Kazakhstan 1 022 350 421 965 2 758 1 328 1 969 Kirgizstan 32 78 300 410 212 59 Korean PDR 200 101 40 820 1 161 94 181 Korean Republic 19 486 36 112 653 1 323 1 880 Kuwait 29 18 6 65 118 6 32 Latvia 21 97 262 79 459 298 348 Lebanon 1 965 1 548 2 751 2 119 8 383 1 736 1 562 Liberia - - - 108 108 61 6 Liechtenstein 129 7 15 - 151 129 190 Lithuania 309 484 666 594 2 054 331 572 Luxembourg 44 761 53 97 955 33 28 Macedonia - - - - - 21 48 Malaysia 1 319 Maldives - - - 32 32 - - Malta 384 24 29 29 467 20 451 Mauritania - - - - - 631 70 Mexico - - 4 760 142 4 902 65 8 Moldova 119 150 90 73 432 50 38 Monaco - - 20 32 52 - 79 Mongolia 14 - - - 14 - - Netherlands 6 350 4 170 6 716 3 646 20 882 3 850 12 507 New Zealand 72 - - 6 78 11 1 Norway - 171 256 629 1 056 462 274 Oman - - - 9 9 8 (8) Pakistan 10 - - 200 210 3 3 Panama 20 48 182 251 501 136 433 Poland 355 229 314 333 1 230 907 975 Portugal 242 607 40 32 920 273 471 Romania 48 835 5 576 8 760 15 219 7 979 10 708 Russia 37 568 33 167 23 225 31 050 125 010 30 614 30 620 Saudi Arabia - - 38 38 - 23 Singapore 31 23 5 24 84 2 11 Slovakia 13 198 150 122 482 553 845 Slovenia - - - - - 204 175 Spain 54 205 141 288 688 419 443 Sri Lanka 13 15 16 62 106 25 24 Sweden - 167 718 139 1 023 417 3 699 Switzerland 1 868 647 2 198 1 405 6 117 3 264 9 890 Syria 56 211 134 165 566 120 274 Taiwan 9 - - - 9 3 30 Tajikistan - - - 3 3 1 553 172 Thailand 9 - - 11 20 - 7 Tonga - - 3 - 3 - - Turkey 16 670 29 199 46 662 21 491 114 021 25 658 37 543 Turkmenistan 1 164 1 953 8 946 1 440 13 503 4 276 1 781 Ukraine 9 448 13 082 13 750 19 222 55 502 6 661 13 900 United Kingdom 3 829 18 064 9 525 10 504 41 922 16 928 19 085 USA 19 673 15 086 13 102 22 360 70 221 20 263 14 443 Uzbekistan 66 53 56 592 767 135 264 Venezuela - - - 7 7 - - Virgin Islands 15 328 20 420 16 915 192 52 856 917 183 Yugoslavia 399 424 486 303 1 612 227 467 Total of above 187463 232268,9 264363 246575 930669,9 210137,1 295789,2Source: State Department for Statistics
1997 1998
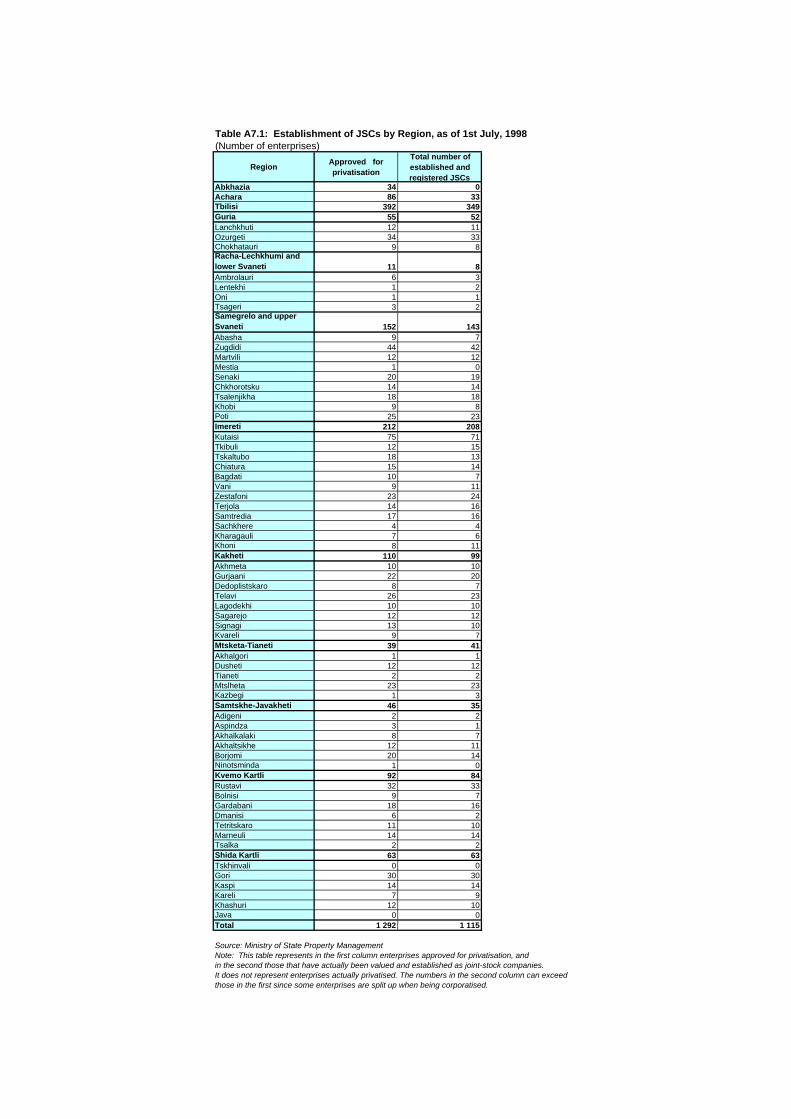
Table A7.1: Establishment of JSCs by Region, as of 1st July, 1998(Number of enterprises)
Region Approved for privatisation
Total number of established and registered JSCs
Abkhazia 34 0Achara 86 33Tbilisi 392 349Guria 55 52Lanchkhuti 12 11Ozurgeti 34 33Chokhatauri 9 8Racha-Lechkhumi and lower Svaneti 11 8Ambrolauri 6 3Lentekhi 1 2Oni 1 1Tsageri 3 2Samegrelo and upper Svaneti 152 143Abasha 9 7Zugdidi 44 42Martvili 12 12Mestia 1 0Senaki 20 19Chkhorotsku 14 14Tsalenjikha 18 18Khobi 9 8Poti 25 23Imereti 212 208Kutaisi 75 71Tkibuli 12 15Tskaltubo 18 13Chiatura 15 14Bagdati 10 7Vani 9 11Zestafoni 23 24Terjola 14 16Samtredia 17 16Sachkhere 4 4Kharagauli 7 6Khoni 8 11Kakheti 110 99Akhmeta 10 10Gurjaani 22 20Dedoplistskaro 8 7Telavi 26 23Lagodekhi 10 10Sagarejo 12 12Signagi 13 10Kvareli 9 7Mtsketa-Tianeti 39 41Akhalgori 1 1Dusheti 12 12Tianeti 2 2Mtslheta 23 23Kazbegi 1 3Samtskhe-Javakheti 46 35Adigeni 2 2Aspindza 3 1Akhalkalaki 8 7Akhaltsikhe 12 11Borjomi 20 14Ninotsminda 1 0Kvemo Kartli 92 84Rustavi 32 33Bolnisi 9 7Gardabani 18 16Dmanisi 6 2Tetritskaro 11 10Marneuli 14 14Tsalka 2 2Shida Kartli 63 63Tskhinvali 0 0Gori 30 30Kaspi 14 14Kareli 7 9Khashuri 12 10Java 0 0Total 1 292 1 115
Source: Ministry of State Property ManagementNote: This table represents in the first column enterprises approved for privatisation, andin the second those that have actually been valued and established as joint-stock companies. It does not represent enterprises actually privatised. The numbers in the second column can exceed those in the first since some enterprises are split up when being corporatised.

Table A7.2: Small Privatisation by Region, as of 1st July, 1998(Number of enterprises)
Region Approved for privatisation
Total privatised or liquidated 1998
Merged with medium or
large enterprises
Liquidated
Abkhazia 2 - - - - Achara 290 110 2 21 - Tbilisi 4 350 3 703 442 412 -
Guria 302 339 4 3 71 Lanchkhuti 58 88 4 - 17 Ozurgeti 190 199 - 3 40 Chokhatauri 54 52 - - 14
Racha-Lechkhumi and lower Svaneti 153 207 - 2 50
Ambrolauri 56 60 - 1 18 Lentekhi 29 38 - - 23 Oni 41 52 - 1 9 Tsageri 27 57 - - -
Samegrelo and upper Svaneti 1 042 1 344 39 158 290
Abasha 84 82 - 3 13 Zugdidi 206 257 10 7 - Martvili 50 51 6 2 19 Mestia 12 15 - 1 5 Senaki 238 418 4 133 111 Chkhorotsku 34 42 - - 23 Tsalenjikha 37 41 1 - 16 Khobi 129 119 - - 60 Poti 252 319 18 12 43 Imereti 2 198 2 372 7 181 563 Kutaisi 588 633 - 71 211 Tkibuli 134 141 - 1 28 Tskaltubo 231 223 3 5 28 Chiatura 170 231 - 68 44 Bagdati 61 96 1 - 36 Vani 65 75 1 1 17 Zestafoni 294 327 2 12 52 Terjola 129 129 - - 20 Samtredia 355 352 - 19 59 Sachkhere 72 49 - - 19 Kharagauli 47 51 - 3 14 Khoni 52 65 - 1 35 Kakheti 1 017 1 027 66 71 181 Akhmeta 172 142 11 18 28 Gurjaani 129 124 11 13 19 Dedoplistskaro 71 94 1 34 2 Telavi 206 219 8 3 36 Lagodekhi 65 65 2 - 15 Sagarejo 126 129 20 3 10 Signagi 129 143 - - 34 Kvareli 119 111 13 - 37 Mtsketa-Tianeti 270 265 2 21 71 Akhalgori 15 13 - - 5 Dusheti 77 80 - 1 12 Tianeti 50 51 - 8 12 Mtslheta 112 116 2 12 42 Kazbegi 16 5 - - - Samtskhe-Javakheti 506 564 20 8 105 Adigeni 38 48 8 - 7 Aspindza 29 28 - - 8 Akhalkalaki 48 46 1 1 10 Akhaltsikhe 235 263 5 7 56 Borjomi 139 169 6 - 20 Ninotsminda 17 10 - - 4 Kvemo Kartli 943 932 47 20 125 Rustavi 318 342 1 4 31 Bolnisi 58 56 - 6 - Gardabani 153 165 31 - 36 Dmanisi 16 39 - - 7 Tetritskaro 90 104 5 4 17 Marneuli 278 198 10 6 10 Tsalka 30 28 - - 24 Shida Kartli 687 753 18 47 169 Tskhinvali - 5 - 5 - Gori 287 297 - 19 52 Kaspi 98 95 7 - 21 Kareli 131 140 9 - 64 Khashuri 171 216 2 23 32 Java - - - - - MSPM 218 218 13 - -
Total 11 978 11 834 660 944 1 625 Source: Ministry of State Property ManagementNote: Number of enterprises actually privatised can exceed those approved for privatisation since some are split up during corporatisation.

Table A7.3: Electricity Supply (Gwh)
1995 1996 1997 1995 1996 1997Q1 Q2 Q3 Q4 Q1 Q2 Q3 Q4 Q1 Q2 Q3 Q4 Q1 Q2
Domestic Supply 7 770 7 985 8 274 1 650 1 988 1 871 2 261 1 679 2 039 2 061 2 206 2 080 1 872 1 813 2 509 2 256 2 386 Hydro-electric power stations 6 206 6 010 6 044 1 155 1 669 1 695 1 687 869 1 649 1 831 1 661 1 225 1 332 1 517 1 970 1 250 2003Inguri Hydro 3 075 2 725 2 109 488 807 1 043 737 220 771 1 016 718 515 176 591 827 477 996Private and Leased Power Generation 860 870 1 111 188 228 176 268 166 242 230 232 232 304 272 303 221 301Thermal power stations 704 1 105 1 119 307 91 0 306 644 148 0 313 623 236 24 236 785 82Gardabani thermal 704 1 088 1 109 307 91 0 306 630 146 0 312 617 236 24 232 775 81State generation 6 910 7 115 7 163 1 462 1 760 1 695 1 993 1 513 1 797 1 831 1 974 1 848 1 568 1 541 2 206 2 035 2 085
Net Imports 752 121 191 365 163 69 155 151 -11 -79 60 47 87 -27 84 214 -192Russia 418 404 306 164 93 63 98 89 67 27 221 74 61 60 111 299 31Turkey 173 -237 -462 90 38 0 45 50 -63 -103 -121 -22 -116 -150 -174 -153 -218Azerbaijan 161 -46 337 111 32 6 12 12 -15 -3 -40 -5 136 63 143 3 -19Armenia 10 6 0 4 65 14
Total Supply to the Network 8 522 8 106 8 465 2 015 2 151 1 940 2 416 1 830 2 028 1 982 2 266 2 127 1 959 1 786 2 593 2 470 2 194
1998

Table A7.4: Electricity Consumption and Payment by Sector
1997Jan Feb Mar Apr May Jun Jul Aug Sep Oct Nov Dec Jan Feb Mar Apr May Jun H1
ELECTRICITY CONSUMPTIONIndustryElectricity supplied (MWh) 95 400 80 300 80 100 87 270 79 600 78 400 69 510 90 500 61 900 84 600 85 500 90 000 62 700 38 900 92 600 101 800 90 900 78 800 465 700Collection rate (per cent) 100,0 94,2 85,0 44,9 73,3 131,4 98,8 31,5 86,1 65,5 140,8 428,6 59,2 38,5 77,6 91,7 105,0 82,0 75,65Average tariff charged (tetri) 4,40 4,20 4,20 4,44 4,43 4,45 4,49 4,49 4,5 4,5 4,3 4,15 4,2 4,43 4,5 3,86 3,79 4,1 4,15Budget organisationsElectricity supplied (MWh) 17 600 16 700 16 490 19 170 14 600 14 700 16 340 17 500 17 700 22 000 26 900 32 551 17 800 17 700 19 300 17 300 15 200 13 600 100 900Collection rate (per cent) 56,8 142,0 289,0 47,9 156,8 160,6 45,6 94,4 122,3 91,2 91,8 29,4 104,2 206,3 103,3 72,1 80,8 73,7 106,75Average tariff charged (tetri) 4,50 4,50 4,50 4,5 4,5 4,5 4,5 4,5 4,5 4,5 4,5 4,5 4,5 4,5 4,5 4,5 4,5 4,5 4,50PopulationElectricity supplied (MWh) 295 800 240 700 240 300 215 200 167 100 150 200 170 800 170 900 147 800 177 000 202 300 267 400 278 200 217 200 248 200 201 600 194 600 209 600 1 349 400Collection rate (per cent) 28,6 25,9 34,8 29,9 37 60,7 36,7 60,2 61,1 64,4 26,0 22,0 26,0 33,0 52,0 37,0 46,0 58,0 42,00Average tariff charged (tetri) 2,89 3,10 3,10 3,17 3,09 3,2 3,25 4,0 4,37 4,38 4,32 4,33 4,33 4,33 4,3 4,19 4,2 4,3 4,28OthersElectricity supplied (MWh) 67 600 47 800 46 500 60 100 46 500 43 300 46 900 43 900 45 900 45 800 60 700 59 004 88 500 89 100 61 000 60 800 47 600 47 600 394 600Collection rate (per cent) 92,0 50,2 51,1 73,6 98 182,7 68,5 57,8 99,2 63,6 48,0 54,6 46,5 50,5 118,1 89,0 93,0 74,0 78,52Average tariff charged (tetri) 4,50 4,50 4,50 4,06 3,96 3,9 4,24 4,33 4,49 4,5 4,42 4,45 4,42 4,5 4,5 4,12 4,4 4,5 4,41Electricity losses during transmission (MWh) 83 540 51 800 47 400 45 880 45 200 15 300 22 200 22 700 30 000 26 300 33 100 51 491 33 100 36 900 69 000 57 600 46 000 72 800 315 400
Total Collection Rate (%) 59,71 52,94 63,64 42,88 65,54 109,44 59,87 53,25 77,43 66,38 60,40 105,25 37,86 46,63 70,04 60,75 68,64 66,11 57,68% of collection in cash 44,9 38,0 45,8 51,5 45,3 35,6 51,0 79,2 29,9 23,1 35,8 17,7 59,3 60,2 16,5 32,3 51,5 27,8 38,3Effective average tariff paid (tetri) 2,08 1,89 2,26 1,57 2,39 4,07 2,25 2,23 3,43 2,95 2,63 4,55 1,64 2,05 3,07 2,50 2,84 2,84 2,47
1998

Table A7.5: Georgian output of selected products(physical units, quarterly)
96Q1 96Q2 96Q3 96Q4 97Q1 97Q2 97Q3 97Q4 98Q1 98Q2Petroleum, '000 T 14,4 17,1 44,0 52,4 39,6 32,1 29,9 32,2 30,5 32,3Coal, '000 T 10,4 3,9 0,2 8,0 0,0 0,9 0,3 3,4 3,2 3,6Cotton, '000 sq.m 82,3 182,0 68,3 143,3 16,1 1,2 0,5 30,2 25,6 27,5Wool, '000 sq.m 15,9 15,6 21,5 124,7 8,3 95,4 0,0 0,0 3,1 29,0Silk, '000 sq.m 2,9 299,8 132,8 97,2 62,2 204,7 33,3 19,7 4,3 27,0Synthetic, '000 sq.m 8,4 7,2 9,8 6,7 2,1 3,1 0,0 0,0 0,0 0,0Knitwear, 000 items 6,0 1,4 141,7 25,0 6,6 23,7 35,7 0,0 2,5 41,1Footwear, '000 pairs 8,7 5,3 1,1 7,0 33,8 22,2 14,2 36,8 21,0 21,1Mineral water, mln L 0,1 6,2 6,0 4,1 2,5 10,1 13,4 7,0 3,1 12,0Canned fruit and veg., '000 cans 433,8 264,0 684,9 523,9 306,6 514,3 1 300,8 995,1 192,4 428,1Vodka and liquor, '000 L 2,0 2,3 1,1 12,8 1,4 2,6 16,4 4,5 1,9 3,3Brandy ("Cognac"), '000 L 0,9 1,6 1,8 3,2 0,9 3,1 2,4 0,0 0,8 0,4Still wine, '000 L 28,2 56,0 68,9 71,0 24,3 95,3 41,1 62,4 32,7 62,8Beer 2,9 12,6 28,2 5,5 3,7 33,4 29,9 9,5 6,7 25,6Sparkling wine, '000 L 0,5 1,0 0,1 1,9 1,3 4,3 1,6 5,8 0,6 2,2Raw board 0,5 4,4 6,5 9,1 0,5 3,1 14,6 5,3 0,9 2,3Saw-timber 0,2 1,4 2,1 2,4 0,5 2,5 4,5 5,8 1,1 2,4Cement, Th. tonnes 3,3 21,8 34,4 25,2 7,5 32,3 25,7 25,1 9,3 56,8
Source: State Department for Statistics

(GEL)Sector Kakheti Tbilisi Shida Kartli Kvemo
KartliSamtske-Javakheti
Achara Guria Samegrelo Imereti Georgia, total
Agriculture, forestry & fishery 28,9 57,8 37,5 34,5 29,6 38,9 39,8 20,6 9,0 36,8Mining or processing industry 43,1 109,4 93,1 82,4 69,5 75,8 35,3 100,4 62,4 81,7Electricity, gas & water supply 29,0 135,5 88,7 75,5 42,7 66,3 31,7 79,9 43,4 83,7Construction 0,0 141,2 122,3 141,4 171,6 129,5 120,0 69,2 259,4 150,7Trade and services 47,7 92,7 131,1 48,6 88,0 99,1 37,5 123,1 80,1 87,2Transport and communications 78,6 98,0 133,1 44,5 29,9 145,6 28,9 63,4 64,4 93,5Government and defence 46,9 93,8 67,9 79,4 63,8 89,6 54,2 47,6 51,4 74,8Education 23,3 42,0 36,0 37,1 33,8 39,7 34,7 35,6 36,6 36,6Healthcare 28,2 44,4 28,6 45,9 27,5 53,7 28,8 36,1 31,3 39,4Culture, sports & recreation 28,7 76,1 33,9 39,9 30,7 48,0 29,8 51,0 32,3 60,1Other sectors 45,1 130,0 141,4 89,4 52,6 90,5 42,1 60,0 55,4 94,0Non-defined - - 45,0 38,3 - 25,0 29,0 - 39,3 37,0Total 34,9 82,5 63,6 60,0 54,3 75,0 37,9 58,0 57,2 66,4Source: SDS Household Survey
(Thousand)Sector Kakheti Tbilisi Shida Kartli Kvemo
KartliSamtske-Javakheti
Achara Guria Samegrelo Imereti Georgia, total
Agriculture, forestry & fishery 4,0 6,8 11,2 7,4 1,9 6,3 2,0 6,5 0,9 47,0Mining or processing industry 4,4 14,0 4,8 19,3 1,9 4,6 4,1 3,8 12,0 68,7Electricity, gas & water supply 0,7 8,9 1,0 4,2 0,8 3,7 0,7 3,1 6,2 29,3Construction 0,0 19,3 1,2 3,6 1,7 2,1 0,2 2,2 4,1 34,5Trade and services 4,5 15,6 3,5 7,7 1,5 7,3 1,4 7,0 12,1 60,5Transport and communications 3,2 29,6 5,1 1,4 1,3 9,9 1,1 7,0 13,0 71,6Government and defence 5,2 33,2 10,2 4,6 6,8 6,9 3,1 6,4 10,4 86,8Education 16,7 42,7 10,6 12,0 5,8 12,8 6,4 18,9 21,8 147,6Healthcare 5,0 32,2 7,5 5,5 3,8 8,6 1,7 7,1 13,5 84,9Culture, sports & recreation 5,4 41,0 2,3 4,9 1,7 3,7 1,3 2,4 6,9 69,5Other sectors 2,8 12,7 1,8 5,2 0,4 4,7 0,8 1,4 2,7 32,5Non-defined 0,0 0,0 0,7 0,7 0,0 0,8 0,5 0,0 4,7 7,3Total 51,8 256,0 59,8 76,4 27,5 71,4 23,3 65,8 108,2 740,2Source: SDS Household Survey
Table A8.1: Hired Employees' Average Monthly Salaries by Sector by Region, Q2 1992
Table A8.2: Hired Employment by Sector by Region, Q2 1992
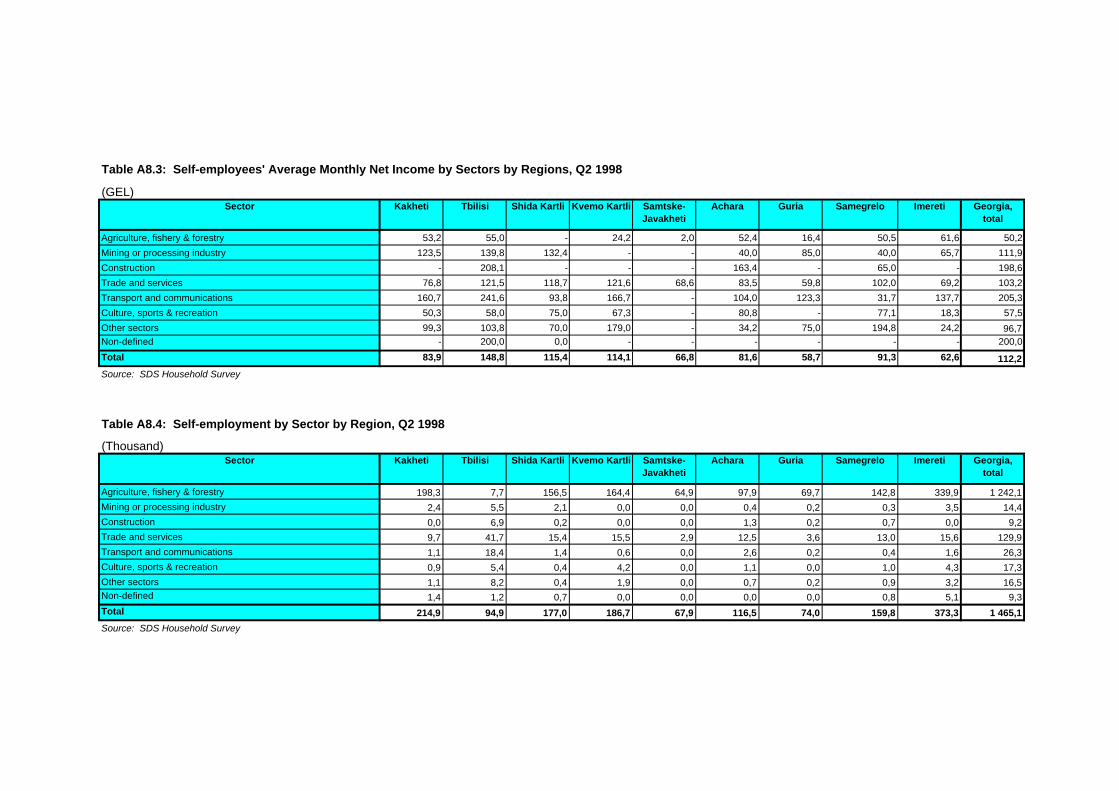
(GEL)Sector Kakheti Tbilisi Shida Kartli Kvemo Kartli Samtske-
JavakhetiAchara Guria Samegrelo Imereti Georgia,
total
Agriculture, fishery & forestry 53,2 55,0 - 24,2 2,0 52,4 16,4 50,5 61,6 50,2Mining or processing industry 123,5 139,8 132,4 - - 40,0 85,0 40,0 65,7 111,9Construction - 208,1 - - - 163,4 - 65,0 - 198,6Trade and services 76,8 121,5 118,7 121,6 68,6 83,5 59,8 102,0 69,2 103,2Transport and communications 160,7 241,6 93,8 166,7 - 104,0 123,3 31,7 137,7 205,3Culture, sports & recreation 50,3 58,0 75,0 67,3 - 80,8 - 77,1 18,3 57,5Other sectors 99,3 103,8 70,0 179,0 - 34,2 75,0 194,8 24,2 96,7Non-defined - 200,0 0,0 - - - - - - 200,0Total 83,9 148,8 115,4 114,1 66,8 81,6 58,7 91,3 62,6 112,2Source: SDS Household Survey
(Thousand)Sector Kakheti Tbilisi Shida Kartli Kvemo Kartli Samtske-
JavakhetiAchara Guria Samegrelo Imereti Georgia,
total
Agriculture, fishery & forestry 198,3 7,7 156,5 164,4 64,9 97,9 69,7 142,8 339,9 1 242,1Mining or processing industry 2,4 5,5 2,1 0,0 0,0 0,4 0,2 0,3 3,5 14,4Construction 0,0 6,9 0,2 0,0 0,0 1,3 0,2 0,7 0,0 9,2Trade and services 9,7 41,7 15,4 15,5 2,9 12,5 3,6 13,0 15,6 129,9Transport and communications 1,1 18,4 1,4 0,6 0,0 2,6 0,2 0,4 1,6 26,3Culture, sports & recreation 0,9 5,4 0,4 4,2 0,0 1,1 0,0 1,0 4,3 17,3Other sectors 1,1 8,2 0,4 1,9 0,0 0,7 0,2 0,9 3,2 16,5Non-defined 1,4 1,2 0,7 0,0 0,0 0,0 0,0 0,8 5,1 9,3Total 214,9 94,9 177,0 186,7 67,9 116,5 74,0 159,8 373,3 1 465,1Source: SDS Household Survey
Table A8.3: Self-employees' Average Monthly Net Income by Sectors by Regions, Q2 1998
Table A8.4: Self-employment by Sector by Region, Q2 1998

ABBREVIATIONS
GEORGIAN ECONOMIC TRENDS – 1998 No.3 131
ACDI Agricultural Cooperative Development International CASE Centre for Social and Economic Research CIS Commonwealth of Independent States CPI Consumer Price Index DMB Deposit Money Bank (Commercial Bank) EBRD European Bank for Reconstruction and Development ECU European Currency Unit ESAF IMF Enhanced Structural Adjustment Facility EU European Union FAO Food and Agricultural Organisation FSU Former Soviet Union FXB Foreign Exchange Bureau (x) GDP Gross Domestic Product GEL Georgian Lari GET Georgian Economic Trends GNP Gross National Product H Half year ha hectares IDP Internally Displaced Person ILO International Labour Organisation IMF International Monetary Fund IFAD International Fund for Agricultural Development ISIC International Standard Industrial Classification JSC Joint Stock Company KWh Kilowatt hour MoF Ministry of Finance MoLSA Ministry of Labour and Social Affairs MSPM Ministry of State Property Management MWh Megawatt hour NBG National Bank of Georgia NDA Net Domestic Assets NFA Net Foreign Assets NMP Net Material Product OECD Organisation for Economic Co-operation and Development Q Quarter year RM Reserve Money RUR Russian Ruble SAC World Bank Structural Adjustment Credit SCD State Customs Department SDR Special Drawing Rights SDS State Department for Statistics STI State Tax Inspectorate TICEX Tbilisi Interbank Currency Exchange TRL Turkish Lira USD United States Dollar VAT Value Added Tax USSF United Social Security Fund