georgia department of community health aged, blind...
TRANSCRIPT

Georgia Department of Community HealthAged, Blind and Disabled (ABD) ProfilesApril 10, 2012

Project Background• The Georgia Department of Community Health (DCH) is conducting
a comprehensive assessment and recommended redesign ofa comprehensive assessment and recommended redesign of Georgia's Medicaid Program and Children's Health Insurance Program.*
• DCH convened an Aged Blind and Disabled (ABD) Task Force to• DCH convened an Aged, Blind and Disabled (ABD) Task Force to provide input into the Medicaid and CHIP Redesign Initiative.*
• The ABD Task Force will provide feedback about the delivery system needs for the Aged Blind and Disabled populations enrolled inneeds for the Aged, Blind and Disabled populations enrolled in Medicaid. *
• Thomson Reuters was engaged to complete a detailed profile for the Aged Blind and Disabled (ABD) population.
Reu
ters
Aged Blind and Disabled (ABD) population.
©20
10 T
hom
son
2
*http://dch.georgia.gov/00/channel_title/0,2094,31446711_175210527,00.html*http://dch.georgia.gov/00/channel_title/0,2094,31446711_180745698,00.html
Data Source: DSS, Claims Incurred July 1, 2010 through June 30, 2011; paid through December 2011 and includes crossovers.
Study Design – Aged, Blind and Disabled (ABD) Population
• This analysis uses claims data for services incurred in Fiscal Year 2011 (FY 2011) paid through December 2011 except otherwise noted(FY 2011), paid through December 2011 except otherwise noted.
• The ABD Medicaid population includes:– Aged g– Blind and Disabled – Deeming Waiver – Medically Needy – Specified Low-Income Medicare Beneficiaries (SLMB) and Qualified p ( ) Q
Individual – 1 (QI-1)– Qualified Medicare Beneficiaries (QMB) – Emergency Medical Assistance
Reu
ters
©20
10 T
hom
son
3Data Source: DSS, Claims Incurred July 1, 2010 through June 30, 2011; paid through December 2011 and includes crossovers.

How much did Georgia DCH spend in FY 2011?Georgia DCH spent over $7 Billion delivering healthcare services to over 1.6 million (average) members for the entire Medicaid population.
Population Descriptions AverageMembers
Total Cost of Coverage*
Aged 55,703 $1,035,828,757
( g ) p p
Aged, Blind &Disabled (ABD)
Population
Blind and Disabled 242,366 $2,848,887,902Emergency Medical Assistance 2 $63,731
Deeming Waiver 3,112 $27,669,043Medically Needy 4,669 $100,930,986
Specified Low-Income Medicare Beneficiaries (SLMB) d Q lifi d I di id l (QI 1) 58 097 $427 322and Qualified Individual (QI-1) 58,097 $427,322
Qualified Medicare Beneficiary (QMB ) 67,606 $82,838,396
Low Income Medicaid (LIM)
Population*
Low Income Medicaid (LIM), Right From the Start Medicaid (RSM), Breast and Cervical Cancer (BCC), Foster Care & Adoptions, Planning for H lth B bi (P4HB) R f
1,065,143 $3,242,624,234
Reu
ters
Population Healthy Babies (P4HB), Refugee
PeachCare (PCK)Population PeachCare for Kids 199,520 $317,649,840
TOTAL Medicaid Population 1,696,216 $7,656,920,211
©20
10 T
hom
son
4Data Source: DSS, Claims Incurred July 1, 2010 through June 30, 2011; paid through December 2011 and includes crossovers.
* Total Cost of Coverage includes Net Payment, Capitation Amount and Admin Fees

• The ABD Population accounts for 25% of Medicaid enrollment, but 54% of Medicaid spending in FY 2011
How much did Georgia DCH spend in FY 2011?
of Medicaid spending in FY 2011.
FY 2011 Total Cost of Coverage*
$7 6 Billion
FY 2011 Enrollment1.6 Million Average Members
LIM
$7.6 Billion
ABD 25%
ABD FY 2011
LIM42%ABD
54%LIM63%PCK
12%
Reu
ters
ABD FY 2011 Total Cost of Coverage *
= $4.1B PCK4%
©20
10 T
hom
son
5Data Source: DSS, Claims Incurred July 1, 2010 through June 30, 2011; paid through December 2011 and includes crossovers.
*Total Cost of Coverage includes Net Payment, Capitation Amount and Admin Fees

Aged Blind and DisabledAged, Blind and Disabled -OVERVIEW

How much did Georgia DCH spend on the ABD Population in FY 2011?
• Georgia DCH spent over $4 billion delivering healthcare services to over 430,000 (average) ABD members in FY 2011.
PCK
FY 2011 ABD Net Payment* ($4.05 Billion)
( g )
PCK4%
Aged
LIM42%
14%
Blind/Disabled37%
ABD54%
Reu
ters
Other Groups3%
©20
10 T
hom
son
Data Source: DSS, Claims Incurred July 1, 2010 through June 30, 2011; paid through December 2011 and includes crossovers. 7
*Net Payment excludes capitation amounts and admin fees

How much does Georgia DCH spend on the ABD?FY 2011 ABD Net Payment*
($4.05 Billion)
• ABD population consists of 3 groups:– Aged
Other ABD
Groups* ($210M)
($4.05 Billion) g– Blind/Disabled– Other ABD Groups
• Healthcare cost for the Blind andAged
($1.03B)
($210M) Healthcare cost for the Blind and Disabled accounts for 69% of total ABD net payments, while cost for the Aged accounts for 25% and costs for the Oth ABD G t f 6% f
Blind/ Disabled ($2 81B)
Other ABD Groups account for 6% of total ABD net payments.
• The average payment per member per year (PMPY) for the ABD was $9 524**
Reu
ters
($2.81B) year (PMPY) for the ABD was $9,524** compared to $3,011** for mothers and children (Low Income Medicaid and Right From the Start Medicaid groups).Other ABD Groups include Deeming Waiver,
Medically Needy QMB SLMB/QI-1 and Emergency
*Net Payment excludes capitation amounts and admin fees
©20
10 T
hom
son
g g p )
8
Medically Needy, QMB, SLMB/QI 1 and EmergencyMedical Assistance enrollees.
Data Source: DSS, Claims Incurred July 1, 2010 through June 30, 2011; paid through December 2011 and includes crossovers.
* *Data highlighted with an asterisks is the Total Cost of Coverage PMPY and includes claims paid through January 2012.

What services did the ABD receive in FY 2011?• Majority of the spending for the ABD population is on Nursing Facility,
Inpatient Hospital and Waiver services.Net Payments by Service Type
($4.05 Billion)
p p
Total ABD Population ($4.05 Billion)
Blind and Disabled
Population
Inpatient Hospital
Outpatient Hospital($2.81 Billion)
Oth G
AgedPharmacy
Professional
Nursing Facility
Waivers
($1.03 Billion)
Reu
ters
$0 $1,000 $2,000 $3,000 $4,000 $5,000
Other Groups
In Millions
Waivers
All Other ($210 Million)
©20
10 T
hom
son
9Data Source: DSS, Claims Incurred July 1, 2010 through June 30, 2011; paid through December 2011 and includes crossovers.

Aged Blind and DisabledAged, Blind and Disabled -AGED

Aged PopulationFY 2011 ABD Net Payments
Aged ($1 03B)
Other ABD Groups ($210M)
($1.03B)
Blind/Disabled($2.81B)
Reu
ters In FY 2011, Georgia Medicaid paid over $1 billion for services provided to the
Aged population.
©20
10 T
hom
son
Data Source: DSS, Claims Incurred July 1, 2010 through June 30, 2011; paid through December 2011 and includes crossovers. 11

Wh th A d?Who are the Aged?
• Low income elderly gain li ibilit i il th h
Enrollment & Costs by Eligibility Categoryeligibility primarily through:
– SSI Related– Nursing Facility – Resource Transfer / Spend-
Eligibility Category Members Average Net Payment*
down– Spousal Impoverishment– Home and Community-based
services
ABD Medicaid 29,737 $919,396,922
SSI Ex Parte Determination 251 $1,441,462
– Poverty Level
• In FY 2011, the average annual payment per Aged member (PMPY) was
SSI – Federally Qualified Receiving SSI Benefits 25,714 $111,467,547
Total 55,703 $1,032,305,967
Reu
ters
member (PMPY) was $18,532, which is almost double the combined ABD PMPY.
,
*Net Payment does not include Capitation Amount and Admin Fees.
©20
10 T
hom
son
12Data Source: DSS, Claims Incurred July 1, 2010 through June 30, 2011; paid through December 2011 and includes crossovers.

Aged Population: FY 2011 Types of Service
All Aged Members% of Net Payments by Service Type
Inpatient Outpatient
All Aged Members($1.03 Billion Net Payments)• Medicaid paid over 76% ($784
million) for Nursing Facility services for the Aged; this was p
Hospital2%
Hospital1% Pharmacy
1%
Professional1%Waivers
13%
Other6%
the highest expenditure for the Aged in FY 2011.
• The second highest expenditure t f W i i 13%were costs for Waiver services,
which accounts for 13% of payments (with an annual average payment of $10,534
Reu
ters
Nursing Facility
76%
g p y $ ,recipient).
©20
10 T
hom
son
13Data Source: DSS, Claims Incurred July 1, 2010 through June 30, 2011; paid through December 2011 and includes crossovers.

Aged Blind and DisabledAged, Blind and Disabled -BLIND AND DISABLED

Blind & Disabled PopulationFY 2011 ABD Net Payments
Other ABD Groups($210M)
Aged($1.03B)
Blind/Disabled
Reu
ters In FY 2011, Georgia Medicaid paid over $2.8 billion for services delivered to the
Blind and Disabled.
d/ sab ed($2.81 Billion)
©20
10 T
hom
son
Data Source: DSS, Claims Incurred July 1, 2010 through June 30, 2011; paid through December 2011 and includes crossovers.15

• Most disabled members i li ibilit i il
Who are the Blind & Disabled?Enrollment & Costs by Eligibility Category
gain eligibility primarily through:
– SSI Related– Spousal Impoverishment
Eligibility Category Members Average Net Payment
ABD Medicaid 10 898 $356 915 163– Home and Community-based
services – Poverty Level
I FY 2011 th
ABD Medicaid 10,898 $356,915,163
SSI Ex Parte Determination 1,981 $14,595,848
• In FY 2011, the average annual payment per Blind and Disabled member (PMPY) was $11,586,
SSI – Federally qualified receiving SSI Benefits 229,486 $2,436,644,158
Total 242,366 $2,808,160,059
Reu
ters
( ) as $ ,586,which is slightly above the combined ABD PMPY.
*Net Payment does not include Capitation Amount and Admin Fees.
©20
10 T
hom
son
16Data Source: DSS, Claims Incurred July 1, 2010 through June 30, 2011; paid through December 2011 and includes crossovers.

Blind & Disabled: FY2011 Types of Service
All Bli d/Di bl d M b
% of Net Payments by Service Type• Waiver and Inpatient Hospital
Inpatient All Other
All Blind/Disabled Members($2.81 Billion Net Payments)services account for 46% of
total net payments for the Blind and Disabled.
Hospital22%
OutpatientWaivers
All Other12%• Prescription drug expenditures
account for 15% of total net payments for the Blind/Disabled Outpatient
Hospital8%
Pharmacy15%
Waivers24%
Blind/Disabled.
• 39% of the Blind and Disabled population were between the
Reu
ters
15%
Professional8%
Nursing Facility
11%
age of 45 and 64 and account for 50% of net payments.
©20
10 T
hom
son
17Data Source: DSS, Claims Incurred July 1, 2010 through June 30, 2011; paid through December 2011 and includes crossovers.

Aged Blind and DisabledAged, Blind and Disabled –OTHER GROUPS
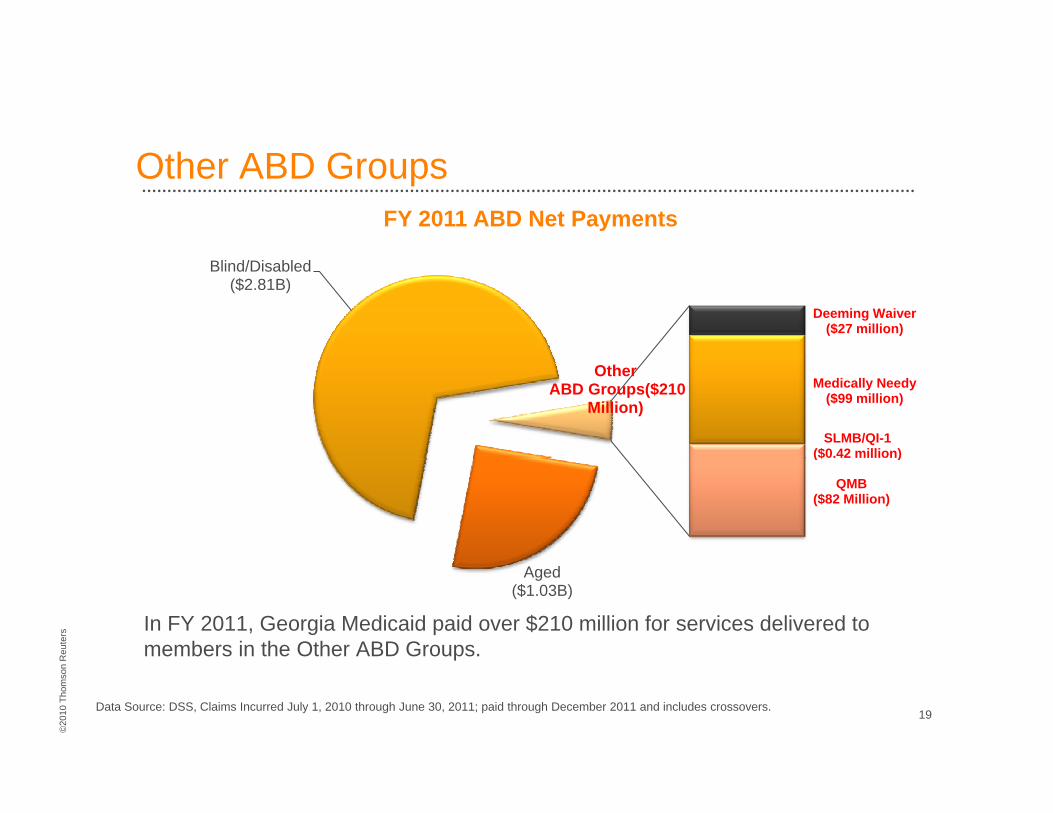
Other ABD GroupsFY 2011 ABD Net Payments
Blind/Disabled($2.81B)
Deeming Waiver($27 million)
Medically Needy($99 million)
SLMB/QI-1($0.42 million)
OtherABD Groups($210
Million)
($ )
QMB($82 Million)
Reu
ters In FY 2011, Georgia Medicaid paid over $210 million for services delivered to
members in the Other ABD Groups.
Aged($1.03B)
©20
10 T
hom
son
Data Source: DSS, Claims Incurred July 1, 2010 through June 30, 2011; paid through December 2011 and includes crossovers.19

• The Other Groups within the ABD P l ti i l d
Who are in the Other ABD Groups?Enrollment & Costs for Other ABD Groups
ABD Population include:– Qualified Medicare Beneficiaries
(QMBs) and Specified Low-Income Beneficiaries (SLMBs)
Other ABD Groups Members Average Net Payment
Emergency Medical Services 2 $63 731– Medically Needy– Deeming Waiver– Emergency Medical Services
• In FY 2011 the average
Emergency Medical Services 2 $63,731
Deeming Waiver 3,112 $27,489,212
Qualified Medicare Beneficiary (QMB) 67,606 $82,837,725
• In FY 2011, the average annual payment per member for the Other ABD Group (PMPY) was $1,575, which is
Medically Needy 4,669 $99,441,480
Specified Low-Income Medicare Beneficiaries (SLMB) and Qualified Individual – 1 (QI-1)
58,097 $426,138
Reu
ters
significantly lower than the combined ABD PMPY. Total 133,486 $210,258,286
*Net Payment does not include Capitation Amount and Admin Fees.
©20
10 T
hom
son
20Data Source: DSS, Claims Incurred July 1, 2010 through June 30, 2011; paid through December 2011 and includes crossovers.

Other ABD Groups: FY 2011 Types of Service• Inpatient Hospital and Professional services account for 59% of the
spending for the Other ABD Groups.
• Costs for Medically Needy and QMB groups account for $182.28 million (over 85%), while Deeming Waiver and SLMB/QI-1 groups account for $27.92 million of total net payments for the Other ABD Groups.
Total Other ABD Groups $210 Million
Net Payments by Service Type
Deeming Waiver
QMB
Medically Needy $99.44 Million
$27 49 Milli
$82.84 Million
Reu
ters
0% 20% 40% 60% 80% 100%
SLMB
Deeming Waiver
$0.43 Million
$27.49 Million
©20
10 T
hom
son
21Data Source: DSS, Claims Incurred July 1, 2010 through June 30, 2011; paid through December 2011 and includes crossovers.
Inpatient Hospital Outpatient Hospital Pharmacy Professional Nursing Facility Waivers All Other

Aged Blind and DisabledAged, Blind and Disabled –
FURTHER ANALYSISNote: The subsequent analysis is based on claims paid through January 2012.
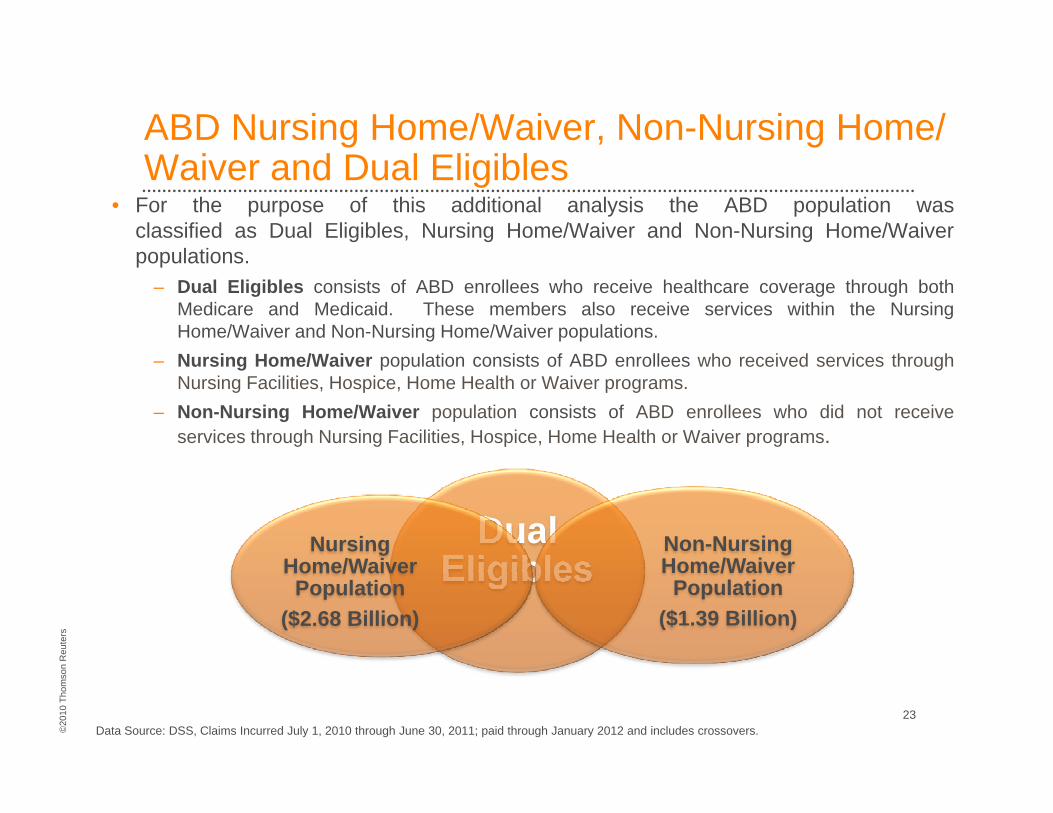
ABD Nursing Home/Waiver, Non-Nursing Home/ Waiver and Dual Eligibles
• For the purpose of this additional analysis the ABD population wasclassified as Dual Eligibles, Nursing Home/Waiver and Non-Nursing Home/Waiverpopulationspopulations.
– Dual Eligibles consists of ABD enrollees who receive healthcare coverage through bothMedicare and Medicaid. These members also receive services within the NursingHome/Waiver and Non-Nursing Home/Waiver populations.N i H /W i l ti i t f ABD ll h i d i th h– Nursing Home/Waiver population consists of ABD enrollees who received services throughNursing Facilities, Hospice, Home Health or Waiver programs.
– Non-Nursing Home/Waiver population consists of ABD enrollees who did not receiveservices through Nursing Facilities, Hospice, Home Health or Waiver programs.
Dual Eli ibl
Non-Nursing H /W i
Nursing H /W i
Reu
ters
Eligibles Home/Waiver Population
($1.39 Billion)
Home/Waiver Population
($2.68 Billion)
©20
10 T
hom
son
23Data Source: DSS, Claims Incurred July 1, 2010 through June 30, 2011; paid through January 2012 and includes crossovers.

Background: Dual Eligibles• Duals’ share of Medicaid
enrollment varies significantlyDual Eligibles as a Share of the Medicaid Population and Medicaid Spending, 2007*enrollment varies significantly
across states (10%-25%).*
• Duals account for 39% of all Medicaid expenditures, despite
15%
39%ed ca d e pe d u es, desp ecomprising only 15% of the beneficiary population.*
• In FY 2011, over 260,000 or 85%
39%
15% of Medicaid enrollees in Georgia were also eligible for Medicare Benefits.
61%
Reu
ters
• Georgia Medicaid Dual Eligibles account for 38% of expenditures in FY 2011.
Total Medicaid Population, 2007:
58 Million
Total Medicaid Spending, 2007:$311
Billion
*
©20
10 T
hom
son
24Data Source: DSS, Claims Incurred July 1, 2010 through June 30, 2011; paid through January 2012 and includes crossovers.
*Kaiser Family Foundation, “The Role of Medicare for the People Dually Eligible for Medicare and Medicaid”, January 2011. http://www.kff.org/medicare/upload/8138.pdf

Background: Nursing Home/Waiver & Non-Nursing Home/Waiver Population
• Non-Nursing Home/Waiver population account for 81% of the ABD enrollment but their healthcare cost was only 34% of total ABD net paymentsenrollment, but their healthcare cost was only 34% of total ABD net payments.
FY 2011 ABD EnrollmentOver 430,000 average members
FY 2011 ABD Net PaymentOver $4 Billion
Nursing Home/Waiver
19%
, g
Non-Nursing Home/ Waiver
Over $4 Billion
N
Waiver34%
Reu
ters
Non-Nursing Home/Waiver
81%
Nursing Home/ Waiver
66%
©20
10 T
hom
son
25Data Source: DSS, Claims Incurred July 1, 2010 through June 30, 2011; paid through January 2012 and includes crossovers.
66%

Background: Nursing Home/Waiver & Non-Nursing Home/Waiver Population
• Of the Nursing Home/Waiver population, the largest group is the Nursing Home followed by the SOURCE waiver.
30,986
36,389
35,000
40,000 Nursing Home/Waiver Population Enrollment by Delivery Model FY 2011
Average 500,000
Average Members*
Unique Recipients**
Non-Nursing Home/Waiver Population FY 2011 Enrollment
21,320 22,016
20,000
25,000
30,000 g
Members*
Unique Recipients**
348,205
306,654300,000
350,000
400,000
450,000
9,315
5,904
3 357 2 989 3 2415,008
10,098
5,968
3,733 4,855 3,373 5,060
5,000
10,000
15,000
100,000
150,000
200,000
250,000
Reu
ters
841
3,357 2,989 948
3,241
913 973
-
5,000
CCSP COMP GAPP Home Health
Hospice ICWP Deeming NOW Nursing Home
SOURCE
Nursing Home/Waiver population
0
50,000
100,000
Non-Nursing Home/Waiver
©20
10 T
hom
son
26
Nursing Home/Waiver population
Data Source: DSS, Claims Incurred July 1, 2010 through June 30, 2011; paid through January 2012 and includes crossovers.
*Average Members refers to the average number of members per month in FY 2011. **Unique recipients refers to the unique count of members who services.

Aged Blind and DisabledAged, Blind and Disabled –DUAL ELIGIBLES

Study Design: Dual Eligibles• The Dual Eligible population consists of ABD enrollees with any type
f M di Cof Medicare Coverage.• Medicare Coverage plans used to define the Dual Eligible population
include:Medicare Part A– Medicare Part A
– Medicare Part B– Medicare Parts A and B– Medicare Part D
Medicare Parts A and D– Medicare Parts A and D– Medicare Parts B and D– Medicare Parts A, B and D
Reu
ters
©20
10 T
hom
son
28Data Source: DSS, Claims Incurred July 1, 2010 through June 30, 2011; paid through January 2012 and includes crossovers.

Wh th D l Eli ibl ?Who are the Dual Eligibles?
• Some of the costs covered b M di id f d l li ibl
Enrollment & Costs by Eligibility Category
by Medicaid for dual eligiblesinclude:
– Monthly Medicare Part B Premiums (SLMB)
Eligibility Category Members Average Net Payment*
ABD Medicaid 39,881 $1,186,461,538e u s (S )– Cost sharing for most
Medicare services (QMB)– Coverage for a range of
k b fi h l
SSI 93,653 $509,524,925
SSI Ex Parte 1,658 $7,324,225
key benefits such as long term care and dental care
• In FY 2011, the average annual payment per Dual
Q Track (QMB, SLMB) 125,201 $83,658,534
Total 260,394 $1,786,969,221
Reu
ters
annual payment per Dual Eligible member was $6,863. *Net Payment does not include Capitation Amount and Admin Fees.
©20
10 T
hom
son
29Data Source: DSS, Claims Incurred July 1, 2010 through June 30, 2011; paid through January 2012 and includes crossovers.

Dual Eligibles: FY 2011 Types of Service% of Net Payments by Service Type
• Nursing Facility services Dual Eligibles• Nursing Facility services account for 55% of the total net payments for ABD Dual Eligibles. Inpatient
Hospital
Outpatient Hospital
3%
($1.78 Billion Net Payments)
Dual Eligibles
g
• Waiver services account for 27% of the total net payments for ABD Dual Eligibles.
4% Pharmacy1%
Professional3%
Waivers27%
• Prescription drugs account for 1% of the total net payments for ABD Dual Eligibles. This is
Nursing Facility
55%
27%
Reu
ters
ABD Dual Eligibles. This is lower than the prescription costs in FY 2005 due to the implementation of Medicare P t D
All Other7%
©20
10 T
hom
son
30Data Source: DSS, Claims Incurred July 1, 2010 through June 30, 2011; paid through January 2012 and includes crossovers.
Part D.

Dual Eligibles: FY 2011 Types of Service• 77% of the cost for Aged Dual Eligibles were for Nursing Facility services.
52% f th t f Bli d/Di bl d D l Eli ibl f W i i• 52% of the cost for Blind/Disabled Dual Eligibles were for Waiver services.
• 33% of the costs for Dual Eligibles within the Other ABD Groups were for Professional services.
% of Net Payments by Service Type
Dual - Aged $1 billion
($1.78 Billion Net Payments)
Dual - Blind & Disabled
Dual Aged $1 billion
$691 million
Reu
ters
0% 20% 40% 60% 80% 100%
Dual - Other ABD Groups
O f
$89 million
©20
10 T
hom
son
31Data Source: DSS, Claims Incurred July 1, 2010 through June 30, 2011; paid through January 2012 and includes crossovers.
Inpatient Hospital Outpatient Hospital Pharmacy Professional Nursing FacilityHome Health Hospice Waivers All Other

Dual Eligibles: Nursing Home/Waiver vs. Non-Nursing Home/Waiver Population
FY 2011 Net Payment($1 78 Billi )
Waiver Services
($1.78 Billion)
Non-Nursing Home/Waiver
Population9%
Waiver Services29%
Nursing Home, Home Health &
Hospice Services
Nursing Home/Waiver
Population91% Hospice Services
62%
Reu
ters
In FY 2011, Georgia Medicaid paid over $1.7 billion for services provided to the ABD Dual Eligible population.
$1.62 billion (91%) was spent on the ABD Dual Nursing Home/Waiver population and $168 million (9%) on the ABD Dual Non-Nursing Home/Waiver population
©20
10 T
hom
son $168 million (9%) on the ABD Dual Non-Nursing Home/Waiver population.
Data Source: DSS, Claims Incurred July 1, 2010 through June 30, 2011; paid through January 2012 and includes crossovers. 32

Dual Eligibles: gImpact on Non-Nursing Home/Waiver Population
• DCH spent $168M on Dual Eligibles in the Non-Nursing Home/Waiver group , which represents 9% of the total cost for Dual Eligibles. g p , p g
• Costs per recipient is $1,066 per year, which is four times lower than the total cost per recipient for the Non-Nursing Home/Waiver population .
• Costs per member per month (PMPM) is $69 which is significantly lower• Costs per member per month (PMPM) is $69, which is significantly lower than the total PMPM of $333 for the Non-Nursing Home/Waiver population.
Dual Eligibles TotalDual EligiblesNon-Nursing Home/Waiver
Total Non-Nursing Home/Waiver
Net Payments $168,177,260 $1,392,249,831
Unique Recipients 157,806 306,654
Reu
ters
Payments per Recipient $1,066 $4,540
% of Members with Services 78.0% 88.1%
Pmts per Member per Month $69 $333
©20
10 T
hom
son
33
p p $69 $333
Data Source: DSS, Claims Incurred July 1, 2010 through June 30, 2011; paid through January 2012 and includes crossovers.

Dual Eligibles: Top 10 Episodes for Non-Nursing Home/Waiver Population
• The top ten episodes account for 44% of total net payments for dual N N i H /W i bNon-Nursing Home/Waiver members.
• Chronic conditions related to mental health (i.e. schizophrenia) is the top condition for the dual Non-Nursing Home/Waiver population.
Hypertension, Essential
Mental Hlth - Schizophrenia
Dual Eligibles: Top 10 Episodes by Net Payment FY 2011
C O
Osteoarthritis
Coronary Artery Disease
Diabetes
Renal Function Failure
Facility
Reu
ters
$0 $2 $4 $6 $8 $10 $12 $14
Condition Rel to Tx - Med/Surg
Pneumonia, Bacterial
Anemia, Nutritional
Chronic Obstruc Pulm … Professional
Pharmacy
©20
10 T
hom
son
34
$0 $2 $4 $6 $8 $10 $12 $14
Net Payments (in millions)
Data Source: DSS, Claims Incurred July 1, 2010 through June 30, 2011; paid through January 2012 and includes crossovers.

Dual Eligibles: Nursing Home/Waiver Population• Almost 90% of CCSP and Nursing Home members are dual eligibles. • As expected GAPP and Deeming Waivers have the less than 1% of Duals
Percent Dual Eligible by Delivery Model – FY 2011
As expected, GAPP and Deeming Waivers have the less than 1% of Duals.
87%
56%64%
71%
90%
62%70%80%90%
100%
56%
6%
53%
20%30%40%50%60%
Reu
ters
0%6%
0%0%
10%
CCSP COMP GAPP Home Health Hospice ICWP Deeming NOW Nursing Home
SOURCE
©20
10 T
hom
son
35Data Source: DSS, Claims Incurred July 1, 2010 through June 30, 2011; paid through January 2012 and includes crossovers.

Dual Eligibles: Nursing Home/Waiver Population• Duals have the greatest impact on COMP, Hospice, ICWP, and Nursing Home. • The highest PMPM for the Nursing Home/Waiver Dual population are COMPThe highest PMPM for the Nursing Home/Waiver Dual population are COMP
waiver services.
$5,000 Dual Eligibles Net Pay PMPM by Delivery Model FY 2011$4,437
$2,927
$3,467
$3,047 $3,000
$3,500
$4,000
$4,500
$ ,
$1,091
$2,469
$1,289 $1,030 $1,035
$1,151
$1,000
$1,500
$2,000
$2,500
Reu
ters
$0
$500
CCSP COMP GAPP Home Health
Hospice ICWP Deeming NOW Nursing Home
SOURCE
©20
10 T
hom
son
36Data Source: DSS, Claims Incurred July 1, 2010 through June 30, 2011; paid through January 2012 and includes crossovers.
Aged Blind and DisabledAged, Blind and Disabled –NURSING HOME/WAIVERPOPULATION

Study Design: y gNursing Home/Waiver Population
• ABD Disabled Waiver population are ABD enrollees who received Waiver Services in FY 2011.
• The ABD Nursing Home/Waiver population is defined by using the following Categories of Service (where applicable):
Waiver Services:Waiver Services:– Community Care Services Program (CCSP)– Comprehensive Supports Waiver (COMP)– Deeming Waiver*– Georgia Pediatric Program (GAPP)Georgia Pediatric Program (GAPP)– Independent Care Waiver Program (ICWP Waiver)– New Options Waiver (NOW Waivers)– Service Options Using Resources in a Community Environment (SOURCE Waivers)
Nursing Home Services:
Reu
ters
Nursing Home Services:– Home Health– Hospice– Nursing Facility
©20
10 T
hom
son
38Data Source: DSS, Claims Incurred July 1, 2010 through June 30, 2011; paid through January 2012 and includes crossovers.
*Deeming Waiver Is defined by Aid Category Group

Nursing Home/Waiver PopulationFY 2011 Net Payment
($2 68 Billi )($2.68 Billion)
Waiver Population
($1.14 billion)
Nursing Home Population
($1.54 billion)
Reu
ters
In FY 2011, Georgia Medicaid paid over $1.14 billion for ABD Waiver services and $1.54 billion for ABD Nursing Home services including nursing home/waiver and non-nursing home/waiver costs.
©20
10 T
hom
son
Data Source: DSS, Claims Incurred July 1, 2010 through June 30, 2011; paid through January 2012 and includes crossovers. 39

Nursing Home/Waiver Population:
• The highest expenditure within Waiver Services was for SOURCE Waiver services (including waiver and non-wavier services), with over $430
gEnrollment & Costs by Service Types
( g ), $million in net payment, followed by COMP with $329 million.
• The highest expenditure within Facility Services was for Nursing Facility. Nursing Members Net Payment*g
Home/WaiverPopulation
Nursing Home/Waiver Services Members Average Net Payment* Net Payment
PMPY
Community Care Services Program (CCSP) 9,315 $144,585,763 $15,523 Comprehensive Supports Waiver (COMP) 5,904 $329,217,655 $55,759 Deeming Waiver** 3 241 $29 353 522 $9 058
Waiver Services
Deeming Waiver 3,241 $29,353,522 $9,058 Georgia Pediatric Program (GAPP) 841 $89,594,281 $106,544 Independent Care Waiver Program (ICWP) 948 $44,406,898 $46,830 New Options Waiver (NOW) 5,008 $71,283,167 $14,233 Service Options Using Resources in a C it E i t (SOURCE) 21,320 $430,001,217 $20,169
Reu
ters
Community Environment (SOURCE) 21,320 $430,001,217 $20,169
Nursing Home Services
Home Health 3,357 $145,695,758 $43,406 Hospice 2,989 $147,320,171 $49,282 Nursing Facility 30,986 $1,244,262,700 $40,156 Total Nursing Home/Waiver Population 83,909 $2,675,721,132 $31,888
©20
10 T
hom
son
40Data Source: DSS, Claims Incurred July 1, 2010 through June 30, 2011; paid through January 2012 and includes crossovers.
**Deeming Waiver Is defined by Aid Category Group
*Net Payment does not include Capitation Amount and Admin Fees. Net payment for Nursing Home/Waiver Population includes nursing home/waiver and non-nursing home/waiver costs.

Waiver Services: FY 2011 Types of Waiver Programs
% of Net Payments by Service Type• The Waiver population
Deeming Waiver
Waiver Programs($822 Million Net Payments)
• The Waiver population consists of services for all waivers.
• Waiver services account for
CCSP13%
SOURCE29%
Waiver4%72% of costs for the entire
Waiver population ($822 million out of $1.14 billion).
• 37% of Waiver service costs
COMP37%NOW
7%
• 37% of Waiver service costs within the ABD population were for COMP Waiver services, while 29% were for
Reu
ters
GAPP5%
ICWP5%
7%SOURCE.
©20
10 T
hom
son
41Data Source: DSS, Claims Incurred July 1, 2010 through June 30, 2011; paid through January 2012 and includes crossovers.

Nursing Home Services: FY 2011 Types of Services
% of Net Payments by Service Type• The Nursing Home population i t f i f N i
Home Health
0%Hospice
7%
Nursing Home Services($1.18 Billion Net Payments)
consists of services for Nursing Home, Home Health and Hospice.
• Of the total $1.54 billion for the 0% 7%O t e tota $ 5 b o o t eNursing Home population, $1.18 billion, or 77%, was for nursing home, home health, and hospice servicesservices.
• 93% of net payments for nursing home, home health and hospice services was for Nursing Facility
Reu
ters
Nursing Facility
93%
g yservices, while 7% of the net payment was for Hospice services.
©20
10 T
hom
son
42Data Source: DSS, Claims Incurred July 1, 2010 through June 30, 2011; paid through January 2012 and includes crossovers.

Aged Blind and DisabledAged, Blind and Disabled –NON-NURSING HOME / WAIVER POPULATION

In which Eligibility Groups do Non-Nursing Home/Waiver recipients belong?
• The Non-Nursing Home/ Waiver population consists
250 000
Non‐Nursing Home/Waiver Recipients by Eligibility Group FY 2011 Dual
non Dualp pof ABD enrollees who did not receive services through Nursing Facilities, Hospice, Home Health or Waiver
70,347 81,5058,074
146,205
92715 489
212,791
81,571
50,000
100,000
150,000
200,000
250,000
mbe
r of R
ecipients
non Dual
Total
Home Health or Waiver programs in FY 2011.
• 58% of Non-Nursing Home/ Waiver members are also
The unique total number of recipients are less than the sum identified in each eligibility category as recipients may be in more than one group during the year.
8,047 1,873 0 0927
75 17 715,489 2,707 17 7
0
50,000
ABD Medicaid SSI SSI Exparte QTrack Emerg Med Assist
Conversion
Num
Dual Eligibles and 69% are eligible through SSI.
• The average annual months f ll t f N 63 313
111,956
80 000
100,000
120,000
ipients
Non-Nursing Home/ Waiver Recipients by Age Group by Age Group FY 2011
Dual
Non Dual
Reu
ters
of enrollment for Non-Nursing Home/ Waiver members is 12, indicating that recipients are
515
24,650
55,71948,172
26,605
8,796
54,96740,110
59,081
1,711 906 190
55,288 63,31349,696
27,472
8,980
0
20,000
40,000
60,000
80,000
Age 0 to 20 Age 21 to 44 Age 45 to 64 Age 65 to 74 Age 75 to 84 Age 85 and
Num
ber o
f Reci
Total
©20
10 T
hom
son continuously enrolled.
44Data Source: DSS, Claims Incurred July 1, 2010 through June 30, 2011; paid through January 2012 and includes crossovers.
Age 0 to 20 Age 21 to 44 Age 45 to 64 Age 65 to 74 Age 75 to 84 Age 85 and over

What is the gender of the Non-Nursing Home/Waiver and where do they live?
• The Non-Nursing Home/Waiver are mostly female and majority of them live outside the Atlanta areathem live outside the Atlanta area.
• The average age of the Non-Nursing Home/Waiver member is 53.
Members by Gender Members by RegionAlb
Albany2%
Athens2%
Southeast
Southwest10%
Albany
Athens
Atlanta
Augusta
Ch tt
58%42% Female
MaleAtlanta
38%Northern12%
Savannah3%
10% Chattanooga
Columbus
Macon
Middle
Mid t
Reu
ters Augusta
4%ChattanoogaColumbusMaconMiddle
5%
Mideast4%
12% Mideast
Northern
Savannah
Southeast
S th t
©20
10 T
hom
son
45
2%3%5% Southwest
Data Source: DSS, Claims Incurred July 1, 2010 through June 30, 2011; paid through January 2012 and includes crossovers.

What is the cost of providing care to Non-Nursing Home/Waiver members?• Total FY 2011 payments for Non-Nursing Home/Waiver members was
$1,392,249,831. Facility and professional claims accounted for 77% of all $ , , , y pNon-Nursing Home/Waiver net payments.
• Average annual payments per Non-Nursing Home/Waiver recipient was $4,540 in FY 2011. Payments per member per month was $333 for Non-y p pNursing Home/Waiver members.
Facility Professional Drug Total
N t P tNet Payments $684,831,742 $388,852,353 $318,565,737 $1,392,249,831
Percent of Total 49.2% 27.9% 22.9% N/A
Unique Recipients $217,147 $290,582 $150,155 $306,654
Reu
ters
Payments per Recipient $3,154 $1,338 $2,122 $4,540
Pmts per Member per Month $164 $93 $76 $333
©20
10 T
hom
son
46Data Source: DSS, Claims Incurred July 1, 2010 through June 30, 2011; paid through January 2012 and includes crossovers.

What is the impact of Non-Nursing Home/Waiver on Non-Dual eligible members?
• DCH spent over $1.22 billion providing services to 153,766 Non-Dual Eligibles within the Non-Nursing Home/Waiver population. g p p
• Costs per recipient per year is $7,961, which is 75% higher than the total cost per recipient for the Non-Nursing Home/Waiver population .
• Costs per member per month (PMPM) is $700 which is more than double the• Costs per member per month (PMPM) is $700, which is more than double the total PMPM of $333 for the Non-Nursing Home/Waiver population.
Non-Dual Eligibles/
Non-Nursing /Non-Nursing Home/Waiver Home/Waiver
Net Payments $1,224,072,570 $1,392,249,831
Unique Recipients 153,766 306,654
Reu
ters
Payments per Recipient $7,961 $4,540
% of Members with Services 100.0% 88%
Pmts per Member per Month $700 $333
©20
10 T
hom
son
47
p p $700 $333
Data Source: DSS, Claims Incurred July 1, 2010 through June 30, 2011; paid through January 2012 and includes crossovers.

What services do Non-Nursing Home/Waiver members receive?
• Inpatient hospital services and pharmacy are the top service types used by Non-Nursing Home/Waiver members, accounting for $428.55
Top 10 Categories of Service for Non-Nursing Home/Waiver Members by Net Payment FY 2011
y g , g $million and $318.57 million, respectively.
$170.09
$217.79
$318.57
$428.55
Physician Services
Outpatient Hospital Services
Pharmacy
Inpatient Hospital Services
$15 16
$20.58
$23.77
$84.66
Childrens Intervention Svc
Dialysis Services - Technical
Durable Medical Equipment Serv
Community Mental Health Svcs
Reu
ters
$12.50
$14.97
$15.16
$0.0 $50.0 $100.0 $150.0 $200.0 $250.0 $300.0 $350.0 $400.0 $450.0
Psych Res Treat Fac (PRTF)
Emergency Ground Ambulance …
Childrens Intervention Svc
N t P t (i illi )
©20
10 T
hom
son Net Payments (in millions)
48Data Source: DSS, Claims Incurred July 1, 2010 through June 30, 2011; paid through January 2012 and includes crossovers.

What type of care is provided for Non-Nursing Home/Waiver members?• The top 10 procedures account for 60% of net payments.
Th ti hi t i i i th t d id d t
Top 10 Procedures for Non-Nursing Home/Waiver Membersby Net Payment FY 2011
• Therapeutic psychiatric service is the top procedure provided to Non-Nursing Home/Waiver members.
$17.60
$20.94
$36.05
$68.47
Medical supplies and devices
Facility-Based E&M Visits
Office visits, established patient
Therapeutic psychiatric servicesy y
$15.46
$16.27
$16.52
$
Transportation services
Durable medical equipment
Emergency room visits
pp
Reu
ters
$10.63
$13.53
$14.66
$0.0 $10.0 $20.0 $30.0 $40.0 $50.0 $60.0 $70.0 $80.0
Dental: basic restorative
Speech/hearing therapy
Psychotherapy, individual
N t P t (i illi )
©20
10 T
hom
son Net Payments (in millions)
49Data Source: DSS, Claims Incurred July 1, 2010 through June 30, 2011; paid through January 2012 and includes crossovers.

What are the costs for conditions of Non-Nursing Home/Waiver members?
• The top ten episodes account for 35% of total net payments for Non-Nursing Home/Waiver members.
Top 10 Episodes by Net Payment FY 2011
• Chronic conditions such as schizophrenia, hypertension and HIV infection are the top three.
HIV Infection
Hypertension, Essential
Mental Hlth - Schizophrenia
Top 10 Episodes by Net Payment FY 2011
Mental Hlth - Bipolar Disorder
Coronary Artery Disease
Hematologic Disord, Congenital
Diabetes
InpatientOutpatientPharmacy
Reu
ters
$0 $10 $20 $30 $40 $50 $60 $70
Pneumonia, Bacterial
Renal Function Failure
Mental Hlth - Neuroses
©20
10 T
hom
son Net Payments (in millions)
50Data Source: DSS, Claims Incurred July 1, 2010 through June 30, 2011; paid through January 2012 and includes crossovers.
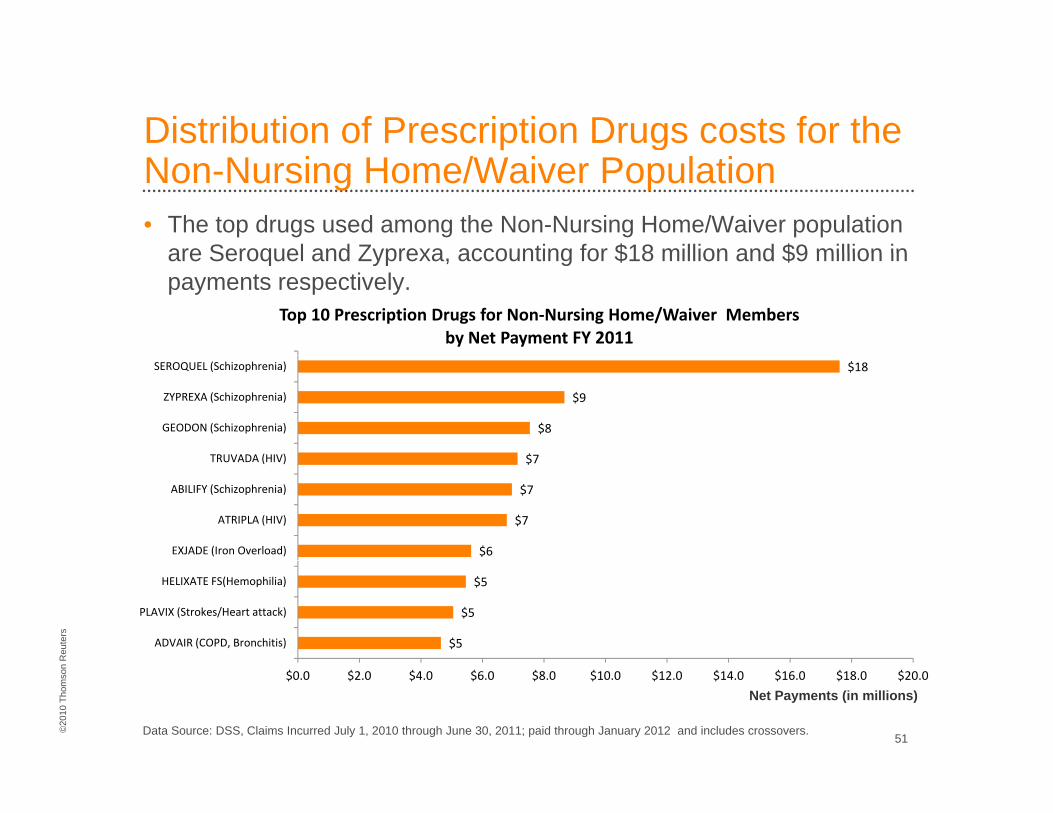
Distribution of Prescription Drugs costs for the gNon-Nursing Home/Waiver Population• The top drugs used among the Non-Nursing Home/Waiver population
are Seroquel and Zyprexa accounting for $18 million and $9 million inare Seroquel and Zyprexa, accounting for $18 million and $9 million in payments respectively.
Top 10 Prescription Drugs for Non‐Nursing Home/Waiver Members by Net Payment FY 2011
$7
$8
$9
$18
TRUVADA (HIV)
GEODON (Schizophrenia)
ZYPREXA (Schizophrenia)
SEROQUEL (Schizophrenia)
$6
$7
$7
$7
EXJADE (Iron Overload)
ATRIPLA (HIV)
ABILIFY (Schizophrenia)
TRUVADA (HIV)
Reu
ters
$5
$5
$5
ADVAIR (COPD, Bronchitis)
PLAVIX (Strokes/Heart attack)
HELIXATE FS(Hemophilia)
©20
10 T
hom
son
$0.0 $2.0 $4.0 $6.0 $8.0 $10.0 $12.0 $14.0 $16.0 $18.0 $20.0
Net Payments (in millions)
51Data Source: DSS, Claims Incurred July 1, 2010 through June 30, 2011; paid through January 2012 and includes crossovers.

Profile of the Non-Nursing Home/Waiver Population• Non-Nursing Home/Waiver members are generally:
– Female (58%)– Middle aged, average age of 53
Become eligible through SSI– Become eligible through SSI– Psychiatric patients, likely to be schizophrenic or have other
chronic conditions– Receiving inpatient services and therapeutic psychiatric
services– Live outside the Atlanta area
Reu
ters
©20
10 T
hom
son
52Data Source: DSS, Claims Incurred July 1, 2010 through June 30, 2011; paid through January 2012 and includes crossovers.

Aged Blind and DisabledAged, Blind and Disabled –HIGH COST POPULATION

• The High Cost Non-Nursing Home/Waiver enrollees within the ABD population are members who incurred more than $200,000 in net
High Cost Non-Nursing Home/Waiver Population
p p $ ,payments for FY2011.
• Only 124 Non-Nursing Home/Waiver recipients had annual payments greater than $200,000 in FY 2011.g
• The total net payment for the High Cost Non-Nursing Home/Waiver recipients was over $45 million, which accounts for 3% of the net payments for the ABD Non-Nursing Home/Waiver population.
Reu
ters
©20
10 T
hom
son
54Data Source: DSS, Claims Incurred July 1, 2010 through June 30, 2011; paid through January 2012 and includes crossovers.

What services do the High Cost Non-Nursing g gHome/Waiver recipients receive?
• In FY2011, Inpatient Hospital services accounted for 87% of total payments for the High Cost Non-Nursing Home/Waiver populationpayments for the High Cost Non-Nursing Home/Waiver population.
• The average annual cost per High Cost recipient was over $360,000.
Top 5 Categories of Service by Net Payments
Category of Service Net Payments % of Total Payments
010 Inpatient Hospital Services $39,433,651 86.5%
300 Pharmacy $2 404 630 5 3%
p g y y
300 Pharmacy $2,404,630 5.3%
430 Physician Services $2,136,281 4.7%
070 Outpatient Hospital Services $994,739 2.2%
370 Emergency Ground Ambulance Svc $156,205 0.3%
Reu
ters
370 Emergency Ground Ambulance Svc $156,205 0.3%
Other Categories of Services $446,339 1.0%
Total Payments, All COS $45,571,845
©20
10 T
hom
son
55Data Source: DSS, Claims Incurred July 1, 2010 through June 30, 2011; paid through January 2012 and includes crossovers.
*High Cost includes enrollee with Net Payments greater than $200,000 per year

What conditions do High Cost Non-Nursing g gHome/Waiver recipients have?
• The top 10 Clinical Conditions account for over 60% of total net payment for the population.
T 10 C diti b N t P t f Hi h C t R i i t *
p y p p
• The treatment of Skin Burns was top Clinical condition for the High cost Non-Nursing Home/Waiver population.
Condition Total Patients
Net Payments
% of All Payments PPPY**
Skin Burns 7 $5,757,124 13.34% $822,446
R i t Di d 108 $3 799 417 8 80% $35 180
Top 10 Conditions by Net Payments for High Cost Recipients*
Respiratory Disorder 108 $3,799,417 8.80% $35,180
Cancer - Leukemia 20 $3,279,922 7.60% $163,996
Newborns, with/without Complication 17 $3,012,672 6.98% $177,216
Condition Related to Tx - Med/Surgery 56 $2,800,441 6.49% $50,008
Hematologic Disorder Congenital 10 $1 899 883 4 40% $189 988
Reu
ters
Hematologic Disorder, Congenital 10 $1,899,883 4.40% $189,988
Spinal/Back Disorder, Ex Low 12 $1,599,215 3.70% $133,268
Gastroint Disorder 87 $1,367,012 3.17% $15,713
Infections 56 $1,158,528 2.68% $20,688
Chemotherapy Encounters 22 $1,139,161 2.64% $51,780
©20
10 T
hom
son Chemotherapy Encounters 22 $1,139,161 2.64% $51,780
56Data Source: DSS, Claims Incurred July 1, 2010 through June 30, 2011; paid through January 2012 and includes crossovers.
*High Cost includes recipients with Net Payments greater than $200,000 per year **PPPY refers to net payment per patient per year.

Aged Blind and DisabledAged, Blind and Disabled –NURSING HOME/WAIVER & NON-NURSING HOME/ WAIVER POPULATIONWAIVER POPULATION COMPARISONCO SO

How do payments per member compare? • Payments per Nursing Home/Waiver member per month (PMPM) are the
highest with the GAPP model at $8,879 followed by COMP at $4,647. g y
• The Non-Nursing Home/Waiver PMPM was the lowest at $333.
$8 879$10,000
Net Pay PMPM by Delivery Model FY2011
$4,647
$8,879
$4 107$5 000
$6,000
$7,000
$8,000
$9,000
$1,293
$3,617$4,107 $3,903
$755$1,186
$3,346
$1,681
$333$0
$1,000
$2,000
$3,000
$4,000
$5,000
Reu
ters
$0
Nursing Home/Waiver population
©20
10 T
hom
son
58
Nursing Home/Waiver population
Data Source: DSS, Claims Incurred July 1, 2010 through June 30, 2011; paid through January 2012 and includes crossovers.

How do Payment Distributions compare? • Nursing Home and the Non-Nursing Home/Waiver member ABD populations account
for the highest facility payments across the total ABD population. COMP d SOURCE tili th t f i l i b d t• COMP and SOURCE utilize the most professional services based on payment distribution.
$10.9 $28.4$6.3 $14.7 $6.1 $16.8$4.2 $1.1
$5 2$4.7
$21.5$45.3
$90%
100%Net Payment Distribution by Delivery Model FY2011
$1 194 3$120.2
$306 9
$56.8
$28.7
$40.3 $63 9$291.4
$388.9
$5.2 $318.6
50%
60%
70%
80%
90%
$26.8
$100.2
$132.3 $1,194.3
$93.4
$684.8
$306.9 $$20.8 $63.9
10%
20%
30%
40%
50%
Reu
ters
$18.0$7.6 $3.0 $3.4
$2.7
$
0%
10%
/
Non-Nursing Home/Waiver
N t t (i Milli )
©20
10 T
hom
son
59
Pharmacy Professional FacilityNursing Home/Waiver population
Data Source: DSS, Claims Incurred July 1, 2010 through June 30, 2011; paid through January 2012 and includes crossovers.
Net payments (in Millions)
APPENDIXAPPENDIX

APPENDIX: How do Service Rates compare across populations? p p p
• Admits per 1,000 members are the highest for Hospice (2,580) and Home Health (2,069) non d l b f ll d b
Delivery Model Admits per 1,000
ER Visits per Mbr
Office Visits per Mbr
Scripts per Mbr
CCSPDuals 472.7 1.4 7.5 5.2
Non Duals 648.3 1.8 9.5 75.9dual members, followed by Nursing Home (1,291) non duals.
• ER Visits per Member are highest for Hospice (4.3) and Home
COMPDuals 132.2 0.7 6.4 6.5
Non Duals 166.2 0.8 7.6 60.3
GAPPDuals 0.0 0.5 4.9 29.3
Non Duals 1,339.6 2.8 16.2 51.3
Duals 1 317 9 2 8 11 5 26 5p ( )Health (4.2) non duals followed by GAPP non duals at 2.8.
• Deeming non dual members had the highest office isit per
Home HealthDuals 1,317.9 2.8 11.5 26.5
Non Duals 2,069.0 4.2 15.0 79.0
HospiceDuals 335.4 0.7 1.4 6.2
Non Duals 2,580.3 4.3 10.8 47.6
ICWPDuals 378.7 1.3 6.8 5.2
the highest office visit per member rate at 22.8. GAPP and Home Health non dual members had the next highest rate at 16.2 and 15 0 respectively
ICWPNon Duals 576.4 1.8 7.5 65.6
DeemingDuals 515.3 0.7 1.0 13.9
Non Duals 88.6 0.3 22.8 19.9
NOWDuals 61.6 0.3 3.4 2.1
Non Duals 70.2 0.4 5.5 27.8
Reu
ters
and 15.0, respectively.
• Nursing Home non duals had the highest script rate at 93.8 followed by SOURCE non duals at 82.7.
Non Duals 70.2 0.4 5.5 27.8
NursingHome
Duals 435.3 1.0 1.8 7.7
Non Duals 1,291.4 2.5 3.7 93.8
SOURCEDuals 444.2 1.6 9.4 6.0
Non Duals 701.3 2.6 10.9 82.7
©20
10 T
hom
son
y
61
Non-NursingHome/ Waiver
Duals 4.9 0.8 4.9 2.6
Non Duals 8.8 1.4 7.4 1.0
All ABDDuals 219.6 0.9 5.0 2.6
Non Duals 359.7 1.5 8.0 35.0
Data Source: DSS, Claims Incurred July 1, 2010 through June 30, 2011; paid through January 2012 and includes crossovers.

APPENDIX: High Cost Non-Nursing Home/Waiver recipients
$
ABD High Cost Non-Nursing Home/Waiver Enrollees by Age Group – Net Payments• 53% of the ABD High
$11 21
$4.18
$6.55
$9.47
Age 21 to 44
Age 13 to 20
Age 6 to 12
Age 0 to 5g
cost enrollees were over the age of 20.
• Total net payments for
$0.25
$13.93
$11.21
$0 $5 $10 $15
Over Age 75
Age 45 to 64
Age 21 to 44
Net Payments (in Millions)
Total net payments for recipients between the ages of 45 and 64 was over $13 million.$
• 99% of the ABD High cost payments were for services provided to 19
27Age 6 to 12Age 0 to 5
ABD High Cost Non-Nursing Home/Waiver Recipients by Age Group – Patients
Reu
ters
services provided to Non-Dual recipients.
137
349
19
Over Age 75Age 45 to 64Age 21 to 44Age 13 to 20
Age 6 to 12
124 Recipients had costs >$200K
©20
10 T
hom
son
62
0 20 40 60 80 100 120 140 160p $
Data Source: DSS, Claims Incurred July 1, 2010 through June 30, 2011; paid through January 2012 and includes crossovers.

APPENDIX: Definitions• Aid Category Budget Groups ABD Medicaid and ABD Medicare includes:
Reu
ters
©20
10 T
hom
son
63Data Source: DSS, Claims Incurred July 1, 2010 through June 30, 2011; paid through December 2011 and includes crossovers.

APPENDIX• Nursing Home/Waiver Population Groupings
Reu
ters
©20
10 T
hom
son
64Data Source: DSS, Claims Incurred July 1, 2010 through June 30, 2011; paid through December 2011 and includes crossovers.

APPENDIX• Service Types Groups
Reu
ters
©20
10 T
hom
son
65Data Source: DSS, Claims Incurred July 1, 2010 through June 30, 2011; paid through December 2011 and includes crossovers.
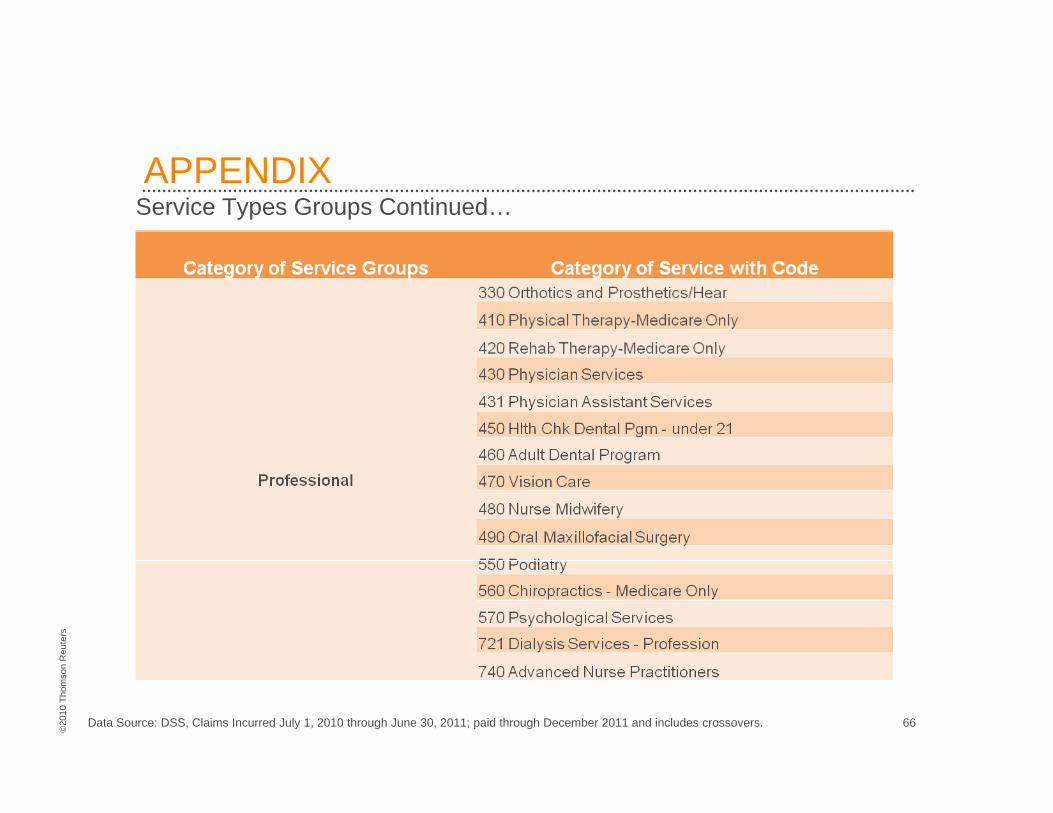
APPENDIXService Types Groups Continued…
Reu
ters
©20
10 T
hom
son
66Data Source: DSS, Claims Incurred July 1, 2010 through June 30, 2011; paid through December 2011 and includes crossovers.

APPENDIXService Types Groups Continued…
Reu
ters
©20
10 T
hom
son
67Data Source: DSS, Claims Incurred July 1, 2010 through June 30, 2011; paid through December 2011 and includes crossovers.

APPENDIXService Types Groups Continued…
Reu
ters
©20
10 T
hom
son
68Data Source: DSS, Claims Incurred July 1, 2010 through June 30, 2011; paid through December 2011 and includes crossovers.