geometricconfinement influences cellular mechanical ... · geometric confinement influences...
TRANSCRIPT
Copyright c© 2007 Tech Science Press MCB, vol.4, no.2, pp.105-118, 2007
Geometric Confinement Influences Cellular Mechanical Properties II –Intracellular Variances in Polarized Cells
Judith Su∗, Ricardo R. Brau†, Xingyu Jiang‡, George M. Whitesides§,Matthew J. Lang¶, Peter T. C. So‖
Abstract: During migration, asymmetricallypolarized cells achieve motion by coordinatingthe protrusion and retraction of their leading andtrailing edges, respectively. Although it is wellknown that local changes in the dynamics of actincytoskeleton remodeling drive these processes,neither the cytoskeletal rheological properties ofthese migrating cells are well quantified nor is itunderstand how these rheological properties areregulated by underlying molecular processes. Inthis report, we have used soft lithography to createmorphologically polarized cells in order to exam-ine rheological differences between the front andrear zone of an NIH 3T3 cell posed for migration.In addition, we trapped superparamagnetic beadswith optical tweezers and precisely placed them atspecific locations on the immobilized cells. Thebeads were then allowed to endocytose overnightbefore magnetic tweezers experiments were per-formed to measure the local rheological proper-ties of the leading and trailing edges. Our re-sults indicate that the leading edge has an approx-imately 1.9 times higher shear modulus than thetrailing edge and that this increase in shear mod-ulus correlates with a greater density of filamen-tous actin, as measured by phalloidin-staining ob-served through quantitative 3D microscopy.
∗ Department of Mechanical Engineering, MIT. Present ad-dress: Biochemistry and Molecular Biophysics Option,Caltech.
† Department of Biological Engineering, MIT‡ Department of Chemistry and Chemical Biology, Har-
vard University. Present address: National Center forNanoScience and Technology, China.
§ Department of Chemistry and Chemical Biology, HarvardUniversity
¶ Department of Biological Engineering and Department ofMechanical Engineering, MIT.
‖ Department of Biological Engineering and Department ofMechanical Engineering, MIT.
Keyword: cytoskeletal stiffness, microcontactprinting, magnetic trap, optical tweezers; migra-tion
1 IntroductionCellular locomotion is a very complex process re-quiring the concerted coordination of many bio-chemical pathways. During migration on surfacesor in tissue matrices, the cell body becomes po-larized in the direction of motion, resulting in aleading protruding edge and a trailing retractingedge. These changes in cell morphology havebeen related to changes in actin dynamics; par-ticularly in the leading and trailing edges whereactin is actively polymerized and depolymerized,respectively. Recent studies have shown that themechanical properties of cells are correlated toactin networks (1); however, the rheology of po-larized migrating cells has never been measured.In this report, we use soft lithography techniquesin combination with optical tweezers and mag-netic tweezers to control the shape of adherentcells and probe the location-dependent rheologi-cal properties of cells primed for migration.
Even though there is a rich literature on actin dy-namics as well as on the molecular biology factorsaffecting cell polarization and migration (2, 3, 4,5), there is very little known about the rheologyof migrating cells. In fact, the fundamental ques-tion of whether cells become softer or stiffer dur-ing migration is subject to considerable debate (5,6). In addition, the processes by which underly-ing molecular events give rise to changes in cellu-lar mechanical properties and coordinated motionare not well understood (5, 7). Furthermore, it isnow accepted that the interplay between mechan-ics and biochemistry, a process known as mechan-otransduction in which the mechanical state of a

106 Copyright c© 2007 Tech Science Press MCB, vol.4, no.2, pp.105-118, 2007
cell can heavily influence or trigger various sig-nal transduction cascade pathways, is crucial forcellular survival. Therefore, an improved under-standing of the rheology of migrating cells has im-plications for many biomedical problems, such asthe cause of cardiovascular diseases and the de-velopment of tissue engineering constructs wherecell migration is required to populate the artificaltissue (8, 9). Other areas to benefit from a betterunderstanding of the rheology of cellular migra-tion include a wide variety of fundamental pro-cesses ranging from wound healing to blood ves-sel formation (7).
A variety of methods, such as micropipette aspi-ration (10), cell poking (11), magnetic twistingcytometry (12), laser (13) and magnetic tweez-ers (14), atomic force microscopy (AFM) (1), andlaser tracking microrheology (15), have been em-ployed to probe the rheological properties of cells.In addition, optical tweezers have also been usedto study membrane tethers (16). These techniqueshave made enormous contributions to the fieldof cellular rheology; however, the measurementsobtained with these approaches have their ownunique limitations and differences. For exam-ple, cell poking and micropipette aspiration onlymeasure the bulk properties of cells and cannotmeasure local rheological differences within cells.Similarly, particle tracking methodologies (bothpassive and active approaches), are not suitedfor long experiments because the tracer particlelocation is random and may unexpectedly leavethe region of interest. Because cellular rheolog-ical measurements often depend on the methodemployed, there is a need to develop better ap-proaches to probe cellular mechanical properties.It is also desirable to have a more controlled as-say using micropatterning to generate geometri-cally identical cells for more consistent rheologi-cal measurements (see companion paper, (17)).
In order to better measure the local intracellularrheological properties for a cell poised for mi-gration, we use cells polarized using microfabri-cation and a magnetic microrheometer combinedwith optical tweezers. Magnetic rheometry istypically employed to study the rheology of cellbecause they are capable of accessing the high
forces, on the order of nN, needed to deform cel-lular structures. However, they are not capablyof stably trapping and placing objects at desiredlocations. Conversely, optical tweezers provideprecise positioning ability, but they are best suitedto probe the force regimes experienced by singlemolecules at the pN level and thus cannot pro-vide the high forces needed to measure the fullrange of cellular rheological properties. In ourapproach, fibronectin coated superparamagneticbeads are first trapped and positioned with opticaltweezers at the desired location of immobilizedcells. The beads are then allowed to endocytoseand later pulled upon with magnetic tweezers.
Optical tweezers offer high spatial resolution and,to the best of our knowledge, is the only reliableway to precisely place magnetic beads at specificlocations on the cell. Optical trapping of magneticbeads is challenging due to their strong scatteringand absorption properties (18, 19). This limita-tion can be overcome by trapping magnetic beadsat low powers, a desired situation because it alsolimits damage to biological samples due to ther-mal and optical effects (20). Magnetic tweezersis a complementary method that can generate thesufficiently high forces needed for local rheologi-cal measurements without permanently damagingthe cell of interest (21). Because the measuredcellular strain field decays quickly from the loca-tion of the bead (22), the combined optical andmagnetic tweezer approach provides a local as op-posed to global measure of cellular rheology.
Even though it is widely accepted that the cel-lular cytoskeleton continuously remodels duringmigration, the exact mechanism for cell move-ment remains elusive. Nevertheless, of the maincytoskeletal components, actin has been heavilyimplicated in playing a decisive role in the gener-ation of motion. It is known that actin polymeriza-tion occurs on the leading edge and depolymeriza-tion occurs on the trailing edge of a migrating cell.In addition, a variety of different models such asBrownian ratchet and motor-based motion havebeen proposed to explain how actin-based motionis generated (23, 24). However, these hypothe-ses have remained largely untested in living cellsdue to the absence of a noninvasive measurement
Geometric Confinement Influences Cellular Mechanical Properties II 107
technique capable of measuring local rheologicalproperties. (5, 25). Since much polymerizationoccurs at the leading edge, we hypothesize thatit has a higher polymerized actin density (volumeof actin/total cell volume) and therefore a higherYoung’s modulus. We focus our attention onthe actin cytoskeleton because purified networksof actin polymers exhibit a higher shear modu-lus than networks containing microtubules or in-termediate filaments and actin microfilaments arebelieved to be primarily responsible for the stiff-ness of the cell (26). In addition, AFM resultsby Haga, et al, 2000, have shown that elasticitymaps of NIH3T3 fibroblast cells correlate mainlywith the presence of the actin network. While mi-crotubules and intermediate filaments may also beinvolved in regulating cytoskeletal rheology, wehypothesize that their influences are of secondaryeffect.
It is possible to study migrating cells in 2D culturebut the motion of the cells can complicate beadplacement and rheological measurements. Fur-ther, we have recently shown micropatterning re-duces the variances in cellular mechanical prop-erty measurements by a factor of ∼4 as comparedto unpatterned cells (companion paper, (17)). Weemploy micropatterning to further increase the re-liability of our cell mechanics measurements. Arecent study by Jiang, et al (2005), has demon-strated that imposing a morphologically polarizedteardrop form on a cell using microcontact print-ing is sufficient to direct cell migration (27). Wetherefore generate a cell poised for migration bygrowing cells on teardrop shaped micropatternedislands. Because upon electrochemical desorptioncells migrate off the patterns in the direction ofthe blunt end of the teardrop (27), beads placedon the blunt edge were defined as being on theedge in the direction of migration or the leadingedge while beads on the sharp edge were definedas being on the trailing edge.
In this report, we first describe the combinationand the performance of an optical trap and a mag-netic microrheometer for cell mechanics measure-ments. We subsequently describe our study ofmicropatterned cells posed for migration usingthis system. To validate our hypothesis that re-
gional variations in the rheological properties ofmigrating cells are due to a difference in localpolymerized actin density, a quantification of re-gional polymerized actin density using confocalmicroscopy will be shown.
2 Materials and Methods
2.1 Substrate preparation
Micropatterned substrates were created as previ-ously described (28). Briefly, a 130 Å-thick layerof gold was deposited on the coverslip bottoms ofBioptechs culture dishes (Bioptechs, Butler, PA)using electron-beam vapor deposition. To pro-mote the adhesion of the gold to glass, 30Å of tita-nium was first evaporated onto the dish. To createthe polydimethylsiloxane (PDMS, Sylgard 184,Dow Corning, Midland, Michigan) stamp used formicrocontact printing, negative photoresist (SU8-2015, Microchem, Newton, MA) was spin-coatedfor 35 seconds at 1500 rpm onto a 4” siliconwafer. The photoresist was then baked on a hot-plate at 65oC for 1 minute and 95oC for 2 minutes.The photoresist was exposed to UV light for 12seconds through a transparency photomask (Out-put City, Poway, CA) containing teardrop shapesto create the photoresist master. Following expo-sure, the wafer was post-baked again at 65oC for 1minute and 95oC for 2 minutes. The unpolymer-ized photoresist was washed away with propy-lene glycol monomethyl ether acetate (PGMEA,Microchem, Newton, MA) and the wafers weresilanized for 15 minutes to prevent the PDMSfrom sticking. PDMS was poured on the bas re-lief photoresist structure and baked in an ovenfor 2 hours at 65oC. The PDMS stamp was thenpeeled off and coated with 2 mM hexadecanethiol(Sigma Aldrich, St. Louis, MO) in ethanol. Ex-cess solvent was removed by evaporation in astream of nitrogen, and the stamp was pressedonto the gold coverslip for 30 seconds. The stampwas then gently peeled off and the bottom of thedish covered with 2mM of a polyethyleneglycol(PEG)-terminated alkanethiol for 30 minutes. Af-terwards the dishes were rinsed once with ethanoland once with phosphate buffered saline (PBS)solution (Invitrogen Life Technologies, Carlsbad,

108 Copyright c© 2007 Tech Science Press MCB, vol.4, no.2, pp.105-118, 2007
CA).
2.2 Cell culturing and plating
Cells were cultured according to instructionsprovided by the American Type Culture Col-lection (ATCC). NIH 3T3 fibroblasts (ATCC,Manassas, VA) were grown using high glucoseDubecco’s Modified Eagle Medium (DMEM)supplemented with 10% v/v bovine calf serum(Invitrogen Life Technologies, Carlsbad, CA) and1% penicillin/streptomycin in 10 cm2 tissue cul-tures plates in an incubator at 37oC until 70% con-fluent. Cells were split in a laminar flow hoodwhere the media was vacuum aspirated off witha sterile pipette and 2.5 mL of trypsin-EDTA wasadded. The cells were placed back into the in-cubator for 5-7 minutes until they disassociatedfrom the bottom of the plate. An equivalentamount of serum-containing media was added toinactivate the trypsin. The solution of media andcells was gently mixed using a 5-mL pipette forseveral minutes until a homogeneous suspensionof cells was obtained. The desired quantity ofcells was added to a new tissue culture plate forcontinued propagation and placed back into theincubator.
To plate the cells, 0.5 mL of 0.25 μg/mL ofhuman plasma fibronectin (Sigma Aldrich, St.Louis, MO) in PBS was placed in each stampeddish for one hour at 37oC. The fibronectinwas aspirated out, while the desired number ofcells/mL was simultaneously loaded. Approxi-mately 30,000 cells were added per dish.
2.3 Actin staining
For imaging, cells were fixed with 3.7%formaldehyde (Z-fix, Anatech LTD, Battlecreek,MI) and their F-actin stained with Alexa Fluor488-conjugated phalloidin (Molecular Probes,Eugene, Oregon) according to protocol providedby Molecular Probes. The media was first aspi-rated and the cells were washed twice with PBS.Z-fix was added for 10 minutes and then removedby aspiration. The Bioptechs dishes were washedagain twice with PBS and a solution of 0.1% Tri-ton X-100 was added for a total of 5 minutes toallow for entry of the dye. Triton X-100 was
removed and the bioptechs dishes were washedtwice with PBS. The dishes were soaked then ina 1% bovine serum albumin (BSA) solution for30 minutes to reduce non-specific binding. Thestaining solution consisting of 200 μL of PBS and15 μL of methanolic dye solution was then addedto each dish for 20 minutes after which the disheswere washed again twice with PBS, once with dis-tilled water, and gently blown dried with nitrogen.
2.4 Magnetic bead preparation
Paramagnetic polystyrene beads (4.5 μm diame-ter, Dynal, Oslo, Norway) with a tosyl-activatedcoating were covalently conjugated to fibronectin.The solution containing the magnetic beads wasplaced on top of a magnet to draw the beads to thebottom. The storage solution was then removedby aspiration and the beads washed once in a bo-rate buffer solution with a pH of 9.4. Fibronectinwas added (15 μg/107 beads) and the solutionwas gently agitated for 10 minutes at 37oC. BSAwas added until its concentration was 0.1%, andthe entire mixture was agitated for 48 hours at37oC. The beads were washed three times with0.1% BSA in PBS, and once with Tris buffer with0.1% BSA (pH 8.5). Prior to use, the beads weremixed in 1% BSA in PBS for 5 minutes, and re-suspended in media.
2.5 Optical tweezer setup
The optical tweezers instrument (Figure 1) isbased on a custom fitted DIC inverted micro-scope and employs a 975 nm light source (Corn-ing Lasertron, Bedford, MA) as the trapping laser.Similar to previous designs (29, 30), trapping ca-pabilities were achieved by guiding the trappinglaser into the microscope objective (Nikon, 100XPlan Apo, 1.4NA) via a dichroic mirror positioneddirectly underneath the objective that reflects onlynear infrared light. In this design, double-trap ca-pabilities were achieved by splitting and recom-bining the main laser line with two polarizingbeam-slitting cubes (CVI). The amount of powerdelivered to each trap was controlled with a half-waveplate. High efficiency trapping was ensuredby adjusting the laser diameter to a size compara-ble to that of the objective pupil. All bright field

Geometric Confinement Influences Cellular Mechanical Properties II 109
��������������
Figure 2: A magnetic bead is precisely positioned by optical tweezers on the leading edge of a teardroppatterned cell. The picture on the right shows how marking of the gold substrate by burning allows for readyidentification of the cell in subsequent experiments.
imaging was done on a CCD camera.
Beads were initially placed on and bound to thecells (Figure 2) by holding the beads for approx-imately 15 minutes with a power of 1mW. Laserpowers were measured before the beam entered
Figure 1: Optical tweezers schematic. M = mir-ror, PBS = polarizing beam splitter, S = shutter,WP = half-waveplate. Two optical traps wereformed by splitting and recombining a 975 nmlaser line and guided them into the objective witha dichroic mirror. One of the traps was formedwith low power, ∼ 5 mW, and was used to trapsuperparamagnetic beads and position them onspecified surface or cellular locations. After thebeads were immobilized on cells, the other trapwas formed with high laser power, > 55 mW, andwas used to mark the substrate around the cell ofinterest for later identification and manipulationwith magnetic tweezers.
the microscope. After binding the beads to the ap-propriate cell region, a box around the cell of in-terest was drawn for later identification (and beadmanipulation with magnetic tweezers) by burningthe gold surface with at least 55 mW of power. Tocalibrate the trap stiffness, the microscope stagewas manually moved at a constant velocity, asconfirmed by an independent laser-based stageposition senor, and bead displacements from thecenter of the optical trap were monitored using acustom particle-tracking program (31). In addi-tion to optical losses through the objective, thegold and titanium-coated plate was observed toonly transmit approximately 15 % of the laserlight. The optical trap was calibrated by usingthe Stokes drag method (32) and the stiffness ofthe trap was calculated to be approximately 0.28fN/nm for 4.5 micron superparamagnetic beads at4mW of power.
2.6 Magnetic trap setup
2.6.1 General principles of a single pole mag-netic trap
A single pole magnetic trap was developed byBausch, et al in 1998 (33) and has the advantageover other techniques of being able to exert nano-Newton level forces on 4.5 micron paramagneticbeads. These high forces permit cytoskeleton de-formation in cells such as fibroblasts with elastic
110 Copyright c© 2007 Tech Science Press MCB, vol.4, no.2, pp.105-118, 2007
moduli on the order of 103 − 104Pa. The trap isan electromagnet that generates a magnetic fieldexerting a constant force �F on a paramagnetic ob-ject:
�F =12
μ0∇(�m · �H
)(1)
whereμ0 is the permeability constant, �m is themagnetization of the particle, and �H is the exter-nal magnetic field strength. Generally paramag-netic as opposed to ferromagnetic beads are cho-sen as they are only magnetized when the mag-netic field is turned on and so they do not aggre-gate (Bausch 1999). The beads are coated withfibronectin which allows them to be indirectly at-tached to the actin cortex via integrin receptorson the cell membrane. By varying the currentthrough the electromagnet, the amount of forceapplied to the bead may be controlled.
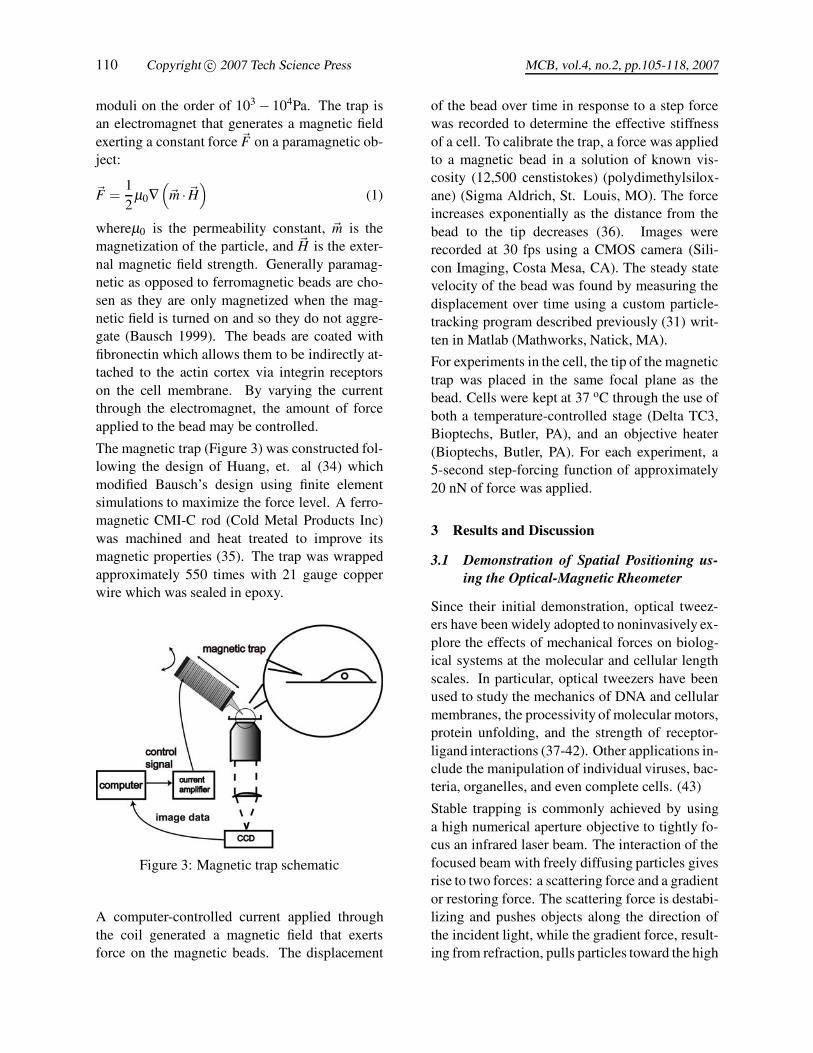
The magnetic trap (Figure 3) was constructed fol-lowing the design of Huang, et. al (34) whichmodified Bausch’s design using finite elementsimulations to maximize the force level. A ferro-magnetic CMI-C rod (Cold Metal Products Inc)was machined and heat treated to improve itsmagnetic properties (35). The trap was wrappedapproximately 550 times with 21 gauge copperwire which was sealed in epoxy.
Figure 3: Magnetic trap schematic
A computer-controlled current applied throughthe coil generated a magnetic field that exertsforce on the magnetic beads. The displacement
of the bead over time in response to a step forcewas recorded to determine the effective stiffnessof a cell. To calibrate the trap, a force was appliedto a magnetic bead in a solution of known vis-cosity (12,500 censtistokes) (polydimethylsilox-ane) (Sigma Aldrich, St. Louis, MO). The forceincreases exponentially as the distance from thebead to the tip decreases (36). Images wererecorded at 30 fps using a CMOS camera (Sili-con Imaging, Costa Mesa, CA). The steady statevelocity of the bead was found by measuring thedisplacement over time using a custom particle-tracking program described previously (31) writ-ten in Matlab (Mathworks, Natick, MA).
For experiments in the cell, the tip of the magnetictrap was placed in the same focal plane as thebead. Cells were kept at 37 oC through the use ofboth a temperature-controlled stage (Delta TC3,Bioptechs, Butler, PA), and an objective heater(Bioptechs, Butler, PA). For each experiment, a5-second step-forcing function of approximately20 nN of force was applied.
3 Results and Discussion
3.1 Demonstration of Spatial Positioning us-ing the Optical-Magnetic Rheometer
Since their initial demonstration, optical tweez-ers have been widely adopted to noninvasively ex-plore the effects of mechanical forces on biolog-ical systems at the molecular and cellular lengthscales. In particular, optical tweezers have beenused to study the mechanics of DNA and cellularmembranes, the processivity of molecular motors,protein unfolding, and the strength of receptor-ligand interactions (37-42). Other applications in-clude the manipulation of individual viruses, bac-teria, organelles, and even complete cells. (43)
Stable trapping is commonly achieved by usinga high numerical aperture objective to tightly fo-cus an infrared laser beam. The interaction of thefocused beam with freely diffusing particles givesrise to two forces: a scattering force and a gradientor restoring force. The scattering force is destabi-lizing and pushes objects along the direction ofthe incident light, while the gradient force, result-ing from refraction, pulls particles toward the high
Geometric Confinement Influences Cellular Mechanical Properties II 111
intensity focus of the laser beam. The stabilityof the trapping phenomenon hinges on the dom-inance of the restoring force over the scatteringforce (44)
Optical tweezers can trap small dielectric micro-spheres approximately 1 micron in diameter withexquisite force and position resolution, typicallyon the order of picoNewtons and nanometers, re-spectively. Although commonly used to exertforces on the order of 10 pN, they have beenshown capable of applying loads of up to 100pN in particular arrangements (45, 46). Theseforce levels are suitable for many applications,but, unfortunately, they have proven insufficientto appropriately study the full range of cellu-lar rheological properties. We therefore combinethe trapping capabilities of optical tweezers withthe high-force capabilities of magnetic tweezersprobe the rheological properties of some cells.
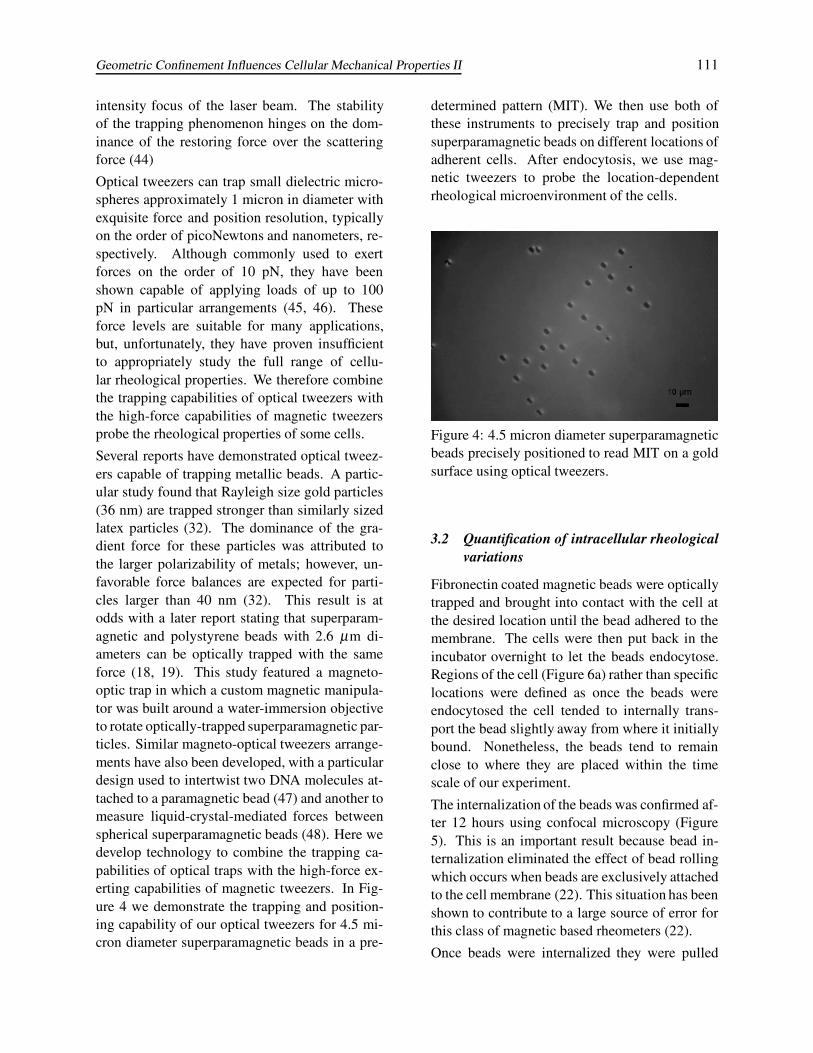
Several reports have demonstrated optical tweez-ers capable of trapping metallic beads. A partic-ular study found that Rayleigh size gold particles(36 nm) are trapped stronger than similarly sizedlatex particles (32). The dominance of the gra-dient force for these particles was attributed tothe larger polarizability of metals; however, un-favorable force balances are expected for parti-cles larger than 40 nm (32). This result is atodds with a later report stating that superparam-agnetic and polystyrene beads with 2.6 μm di-ameters can be optically trapped with the sameforce (18, 19). This study featured a magneto-optic trap in which a custom magnetic manipula-tor was built around a water-immersion objectiveto rotate optically-trapped superparamagnetic par-ticles. Similar magneto-optical tweezers arrange-ments have also been developed, with a particulardesign used to intertwist two DNA molecules at-tached to a paramagnetic bead (47) and another tomeasure liquid-crystal-mediated forces betweenspherical superparamagnetic beads (48). Here wedevelop technology to combine the trapping ca-pabilities of optical traps with the high-force ex-erting capabilities of magnetic tweezers. In Fig-ure 4 we demonstrate the trapping and position-ing capability of our optical tweezers for 4.5 mi-cron diameter superparamagnetic beads in a pre-
determined pattern (MIT). We then use both ofthese instruments to precisely trap and positionsuperparamagnetic beads on different locations ofadherent cells. After endocytosis, we use mag-netic tweezers to probe the location-dependentrheological microenvironment of the cells.
Figure 4: 4.5 micron diameter superparamagneticbeads precisely positioned to read MIT on a goldsurface using optical tweezers.
3.2 Quantification of intracellular rheologicalvariations
Fibronectin coated magnetic beads were opticallytrapped and brought into contact with the cell atthe desired location until the bead adhered to themembrane. The cells were then put back in theincubator overnight to let the beads endocytose.Regions of the cell (Figure 6a) rather than specificlocations were defined as once the beads wereendocytosed the cell tended to internally trans-port the bead slightly away from where it initiallybound. Nonetheless, the beads tend to remainclose to where they are placed within the timescale of our experiment.
The internalization of the beads was confirmed af-ter 12 hours using confocal microscopy (Figure5). This is an important result because bead in-ternalization eliminated the effect of bead rollingwhich occurs when beads are exclusively attachedto the cell membrane (22). This situation has beenshown to contribute to a large source of error forthis class of magnetic based rheometers (22).
Once beads were internalized they were pulled

112 Copyright c© 2007 Tech Science Press MCB, vol.4, no.2, pp.105-118, 2007
Figure 5: Demonstration that beads are inter-nalized on teardrop micropatterns. Cells werestained with the celltracker green. Beads were al-lowed to internalize for 12 hours after which con-focal images were taken and 3D reconstructionwas performed. The view on the right represents aside view (vertical cut) and the view on the bottomrepresents another side view (horizontal cut). Thecrosshair is positioned on one bead. This bead isseen in the orthogonal views as linked by the crosshair.
upon with 20 nN ± 1 nN of force for five sec-onds. To avoid contamination and cell morbid-ity, cells were only outside the incubator for amaximum of thirty minutes. In the actual exper-iments, contrary to the picture shown in Figure5, only one bead per cell was placed to avoid theeffects of bead-bead interactions. Each cell re-sulted in one data point. The bead displacementas a function of time was recorded and an ana-lytical expression was obtained by curve fittingto a Voigt model in series with a dashpot. Theregional shear modulus was calculated as previ-ously described (See companion paper, (17) and(49)) by assuming a bead embedded in a linear, in-finite, isotropic, viscoelastic medium where x(ω)is the bead displacement in the frequency domainis f (ω) is the applied force in the frequency do-
���
���
���
Figure 6: (a) Schematic of cell with different re-gions defined. The teardrop is 103 microns longand 30 microns in diameter at the widest part (b)Shear modulus at different locations of the cell. n= 5 for each case per cell. Error bars representthe standard error of the mean. (c) F-actin volumefraction (fraction of space occupied by actin) atdifferent locations of the cell.
Geometric Confinement Influences Cellular Mechanical Properties II 113
main.
G∗(ω) =f (ω)
6πRx(ω)(2)
Despite the close presence of the cell boundary(Figure 5), these assumptions that a bead is em-bedded in a linear, infinite, isotropic, viscoelas-tic medium are widely assumed in all bead basedrheological calculations as there exists at presentno analytic expression which takes into accountthe boundary conditions for the calculation of theshear modulus. A versatile, precise, and efficientfinite element method to account for such com-plicated boundary conditions has yet to be de-veloped. As current rheological methods are un-able to separate out the contributions of the mem-brane from the cytoskeleton, we view the shearmodulus taken from this calculation as a lumpedmodulus which takes into account all contribu-tions. Briefly, as shown in equation (2) the Fouriertransform of the step force was taken and di-vided by the Fourier transform of the analytic ex-pression for the bead displacement to calculatethe frequency dependent complex shear modulusG ∗ (ω). The real part of (2) was taken and eval-uated at 0.05 Hz to obtain a single value for theshear modulus. The value 0.05 Hz was chosen tobe much longer than the relaxation time of the cellwhich was found to be ∼ 1 s (See (17)).
The resulting shear modulus at the leading edgewas found to be a factor of ∼1.9 stiffer than thetrailing edge and a factor of ∼2.4 stiffer thanthe nucleus (Figure 6b). Earlier experiments per-formed on cells adhered to micropatterned islandsof increasing size found that their shear mod-ulus was biphasic with pattern diameter whilecell height was monotonic (See companion pa-per, (17)). From this we conclude that cell heightwhile potentially a contributor is not the determin-ing factor of cellular shear modulus. The resultthat the nucleus is softer than the leading edgequalitatively confirms AFM results by Haga andcoworkers with the exception being that AFM re-sults report that the nucleus is a factor of 10 softerthan surrounding regions. We attribute this differ-ence in part to the fact that the AFM probes thesurface whereas the optical-magnetic trap probesthe interior of the cell surrounding an endocytosed
bead.
Our results is consistent with previous AFM sur-face measurements, (1, 25) that adherent cellsare mechanically differentiated in their differ-ent regions. Work by Kole et al, 2004, hasdemonstrated using intracellular microrheologythat the leading edge of Swiss 3T3 fibroblasts isstiffer than the perinuclear region. We observein addition to the differences in stiffness betweenthe leading and trailing edge, that the nuclei ofNIH3T3 fibroblast cells are softer than the sur-rounding cytoplasm by a factor of ∼2.4. Our val-ues for the Young’s modulus at the leading edgeare on the order of 1000 Pa which agrees with themodulus needed by the Brownian ratchet model topredict the forces generated from the polymeriza-tion of actin filaments in the lamellipodia (5). Inaddition our work demonstrates that a cell posedfor migration is softer than a quiescently restingcell (stiffness values determined in companion pa-per, (17)) demonstrating the mechanical proper-ties change upon the onset of migration. Theseresults contradict with results by Kole et al, 2004,who obtained Young’s moduli on the order of10 Pa in contraction with the Brownian ratchetmodel and whose stiffness results for quiescentcells were larger than for migrating cells.
3.3 Quantification of F-actin structural pa-rameters
We hypothesize that the change in shear mod-ulus occurs as a result of changes in the vol-ume fraction of polymerized actin. To quantifythe amount of F-actin in the cell, teardrop pat-terned cells were fixed and their F-actin stainedwith AlexaFluor488-Phalloidin. Two dimen-sional slices were taken using a spinning diskconfocal microscope (Perkin Elmer Ultraview,Wellesley, MA), spanning every 100 nm and theresulting three-dimensional image stack decon-volved using Huygens Essential software to re-move the out- of-focus light. A 100x Plan ApoNikon objective with a numerical aperture of 1.45was used for imaging. The images were back-ground subtracted and a consistent threshold ap-plied to determine the presence of actin. To cal-ibrate fluorescent intensity with a value for the

114 Copyright c© 2007 Tech Science Press MCB, vol.4, no.2, pp.105-118, 2007
Figure 7: 3D reconstruction of the actin dis-tribution inside a teardrop patterned cell. Theblack represents stress fibers which appear moredensely around the edges of the cell. Image wascreated using Imaris software (Bitplane AG, St.Paul, MN).
amount of actin present in each region of the cell,a solution containing a known concentration ofactin which was labeled in the same manner asthe cells was used (See companion paper, (17)).
To get a measure of the volume fraction of actinwithin each region, the volume of the largest rect-angle that could be inscribed in each region wasused. The resulting F-actin volume fraction dataalong with the corresponding Young’s modulusfrom the magnetic trap data (Figure 8) was su-perimposed on a non-linear curve fit (Mathemat-ica, Experimental Data Analyst) of the data pre-viously obtained from cells on five different sizedcircular islands (companion paper, (17)) on an ex-ponent of 5/2 and 2. The choice of exponentsfor the non-linear curve fit was based on the bio-physical polymer model developed by Mackin-tosh and coworkers (50) which predicts a 5/2 de-pendence of the Young’s modulus on actin vol-ume fraction and the cellular solids model devel-oped by Satcher and Dewey (51) which predictsa quadratic dependence of Young’s modulus onactin volume fraction. To convert between shearmodulus (G) and Young’s modulus modulus (E)it was assumed that the cell was incompressible(E=3G).
Figure 8: Young’s modulus as a function of actinvolume fraction. The triangles denote the datafrom the leading (right side up triangle) and trail-ing (upside down triangle) edge of the teardropshaped cells. The circular (©) points refer to datataken from patterned circular cells 10, 20, 30, 40,and 50 microns in diameter (See companion pa-per, (17)). The line fits to an exponent depen-dence of 5/2. For the teardrop patterned cells,there were 5 stiffness data points taken at each lo-cation. For the circular patterned cells there were20 stiffness measurements taken at each location.For the actin density measurement, n = 20 for allcases. Error bars represent the standard error ofthe mean.
From Figure 8, the teardrop data appears to fitwith previous the circular patterned data verywell. This data together appears to validate ourhypothesis that polymerized actin density the pri-mary determinant of cell local rheology. Thepolymerized actin density alone, to the first or-der, is sufficient to predict the Young’s modulusand that the filament orientation seems to play lit-tle role in determining the cell stiffness. The in-vestigation of filament orientation by Hu, et al,2004 (52), seems to indicate that the fiber orien-tation effect is also secondary. Recently Théry etal, (53, 54), has investigated the role of adhesionarea anisotropy on fiber orientation, but not on theresulting rheological dependence. It would be in-teresting to investigate the effect of filament ori-entation but substantial improvement on our in-strumentation accuracy is needed to delineate the

Geometric Confinement Influences Cellular Mechanical Properties II 115
effect of filament orientation on cell rheology.
A potential concern of this work relates to thefact that the leading edge of the cell is substan-tially thicker (∼ factor of 2 greater) than the trail-ing edge. One may argue that the differencesin cell rheology measured are due to a differ-ent in cell height or the proximity of the mem-brane to the tracer bead. We would like to as-sert that cell height and membrane proximity bothplay only a secondary role in cell rheology ascompared to polymerized actin density. First, asdemonstrated in our companion paper, cell rheol-ogy shows biphasic behavior while cell height ismonotonic. Second, in the companion paper, weshow that the shear modulus of the cell increaseswith decreasing cell height (large cell diameter).In this study, we show that the leading edge of thecell with large cell height shows a higher shearmodulus than the trailing edge which is thinner.Finally, the excellent correlation of both cell areadata (companion paper) and region rheology dataof a migrating cell (this paper) with polymerizeactin density reinforces the validity of our hypoth-esis.
4 Conclusions
We have examined the rheological variations be-tween the leading and trailing edges of a cellposed for migration by combining the spatial pre-cision of optical tweezers with the high force ca-pabilities of magnetic tweezers. Although it isknown that the cytoskeleton reorganizes for co-ordinated cellular movement to occur, little isknown about how this reorganization translatesinto a mechanical property. It remains unknownwhether a cell softens or stiffens during migrationand a variety of hypotheses exist on how rheolog-ical changes result in whole cell movement. Ourstudy supports the fact that a migrating cell is me-chanical differentiated and has demonstrated thatthe leading edge of a polarized cell is significantlystiffer than the trailing edge. We have furthershown that the nucleus is softer than the surround-ing cytoplasm and that a cell poised for migra-tion while not actually moving can be softer thana quiescently resting cell (see companion paper).In addition, the values we obtain for the Young’s
modulus at the leading edge are on the order of1000 Pascals which is the stiffness the Brownianratchet model requires to predict the force gener-ated by actin polymerization. This particular find-ing of ours contradicts with the work of Kole, etal, 2004 that found the stiffness at the lamellipo-dia to be on the order of 10 Pascals and whichfound that a quiescent cell to be softer than a mi-grating cell. The variation in stiffness betweenthe leading and trailing edges correlates with lo-cal actin volume fraction measurements with thedependence of Young’s modulus and actin volumefraction appearing to agree with either a 5/2 powerlaw as predicted by the biopolymer physics modelor a quadratic dependence as predicted by the cel-lular solids model. Micro-mechanical models ofthe cell such as the biopolymer physics and cellu-lar solids model provide a molecular level expla-nation for more global properties such as stiffness.
Our study has also demonstrated that we can ap-ply a combination of optical-magnetic tweezers toinvestigate subcellular rheology. We would liketo note that when the beads are internalized thecell internally transports the bead an additionalamount so at this point the bead location is notprecisely pre-determined, yet this motion appearsto be small. As such, for endocytosed beads, wedefine regions of the cell (Figure 6a) rather thanspecific locations. With this technique, however,we are directly studying the cells we select ratherthan mixing cells and beads and choosing the onesavailable. This reduces randomness and interfer-ence due to other beads being present. Neverthe-less, since the height of the cell and the bead sizeis comparable to the cell thickness, it should benoted that the underlying theory underlying shearmodulus calculation is not rigorously valid. Thisis an inherent limitation with all bead based mi-crorheological techniques and as such our data isa regional Young’s modulus which includes con-tributions from the membrane as well as the cy-toskeleton. The use of finite element to more pre-cisely determine cellular shear modulus for endo-cytosed beads is a subject for future investigation(22).
116 Copyright c© 2007 Tech Science Press MCB, vol.4, no.2, pp.105-118, 2007
Acknowledgements: We would like to thankJorge Ferrer for assistance with the actin fila-ment gels. This work was supported by NIHP01HL64858 and a NSF graduate research fel-lowship (Judith Su). Ricardo Brau acknowledgesthe National Institute of General Medical Sci-ences Biotechnology Training Program and theLemelson Foundation for financial support. Thesalary of Xingyu Jiang was provided by NIHGM065364.
References
1. Haga, H.; Sasaki, S.; Kawabata, K.; Ito,E.; Sambongi, T. (2000): Ultramicroscopy,82(1-4), 253-8.
2. Lauffenburger, D. A.; Horowitz, A. F.(1996): Cell, 84, 359-369.
3. Mitchison, T. J.; Cramer, L. P. (1996):Cell, 84, 371-379
4. Pollard, T. D.; Borisy, G. G. (2003): Cell,112, 453-465.
5. Kole, T. P.; Tseng, Y.; Jiang, I.; Katz, J.L.; Wirtz, D. (2005): Molecular Biology ofthe Cell, 16, 328-338.
6. Cramer, L. P.; Briggs, L. J.; Dawe, H. R.(2002): Cell Motil. Cytoskeleton, 51, 27-38.
7. Munevar, S.; Wang, Y. L.; Dembo, M.(2003): Journal of Cell Science, 117, 85-92.
8. Chicurel, M. (2002): Cell Migration Re-search is on the Move. Science, 295(5555),606-609.
9. Ridley, A. J.; Schwartz, M. A.; Burridge,K.; Firtel, R. A.; Ginsberg, M. H.; Borisy,G.; Parsons, J. T.; Horwitz, A. R. (2003):Science, 302, 1704-1709.
10. Evans, E.; Yeung, A. (1989): BiophysicalJournal, 56, 151-160.
11. Zahalak, G. I.; McConnaughey, W. B.; El-son, E. L. (1990): J. Biomech Eng., 112(3),283-94.
12. Fabry, B.; Maksym, G. N.; Butler, J. P.;Glogauer, M.; Navajas, D.; Fredberg, J. J.(2001): Phys Rev Lett., 87(14), 148102.
13. Choquet, D.; Felsenfeld, D. P.; Sheetz, M.P. (1997): Cell, 88, 39-48.
14. Bausch, A. R.; Möller, W.; Sackmann, E.(1999): Biophysical Journal, 76, 573-579.
15. Yamada, S.; Wirtz, D.; Kuo, S. C. (2000):Biophysical Journal, 78(4), 1736-1747.
16. Dai, J.; Sheetz, M. P. (1999): BiophysicalJournal, 77(6), 3363-3370.
17. Su, J.; Jiang, X.; Welsch, R.; White-sides, G. M.; So, P. T. C. (2007): Geo-metric Confinement Influences Cellular Me-chanical Properties I – Adhesion Area De-pendence. MCB: Molecular Cellular Biome-chanics, 4(2), 87-104.
18. Sacconi, L.; Romano, G.; Ballerini, R.;Capitanio, De Pas, M.; Giuntini, M.; Dun-lap, D.; Finzi, L.; Pavone, F. S. (2001): Op-tics Letters, 26, 1359-1361.
19. Romano, G.; Sacconi, L.; Capitanio, M.;Pavone, F. S. (2003): Optics Communica-tions, 215, 323-331.
20. Neuman, K. C.; Chadd, E. H.; Liou, G.F.; Bergman, K.; Block, S. M. (1999): Bio-physical Journal, 77(5), 2856-2863.
21. Mills, J. P; Qie, L.; Dao, M.; Lim, C.T.; Suresh, S. (2004): Mech Chem Biosyst.,1(3), 169-180.
22. Karcher, H.; Lammerding, J.; Huang, H.;Lee, R. T.; Kamm, R. D.; Kaazempur-Mofrad, M. (2003): Biophysical Journal,85(5), 3336-3349.
23. Peskin, C. S.; Odell, G. M.; Oster, G. F.(1993): Biophysical Journal, 65, 315-324.
24. Mogilner, A.; Oster, G. (1996): BiophysicalJournal, 71, 3030-3045.
25. Heidemann, S. R.; Wirtz, D. (2004):Trends Cell Biol. 14, 160-166.
Geometric Confinement Influences Cellular Mechanical Properties II 117
26. Hvidt, S.; Heller, K. (1990): Physical Net-works. Polymers and Gels. (W. Burchardand S. Ross-Murphy, Ed.) London: Elsevier.
27. Jiang, X.; Bruzewicz, D.; Wong, A. P.;Piel, M.; Whitesides, G. M. (2005): Proc.Natl. Acad. Sci. USA, 102(4), 975-978.
28. Whitesides, G. M.; Ostuni, E.; Takayama,S.; Jiang, X.; Ingber, D. E. (2001): Annu.Rev. Biomed. Eng., 3, 335-73.
29. Lang, M. J.; Fordyce, P. M.; Engh, A. M.;Neuman, K. C.; Block, S. M. (2004): Na-ture Methods, 1(2), 133-139.
30. Brau, R. R.; Tarsa, P. B.; Ferrer, J. M.;Lee, P.; Lang, M. J. (2006): BiophysicalJournal, 91(3), 1069-1077.
31. Lammerding, J.; Kazarov, A. R.; Huang,H.; Lee, R. T.; Hemler, M. E. (2003): Proc.Natl. Acad. Sci. USA, 100(13), 7616-7621.
32. Svoboda, K.; Block, S. M. (1994): OpticsLetters, 19, 930-932.
33. Bausch, A. R.; Ziemann, F.; Boulbitch, A.A.; Jacobson, K.; Sackmann, E. (1998):Biophysical Journal, 75(4), 2038-2049.
34. Huang, H.; Dong, C. Y.; Kwon, H-S.;Sutin, J. D.; Kamm, R. D.; So, P. T. C.(2002): Biophysical Journal, 82(4), 2211-2223.
35. Huang, H.; Kamm, R. D.; Lee, R. T.(2004): Am J Physiol Cell Physiol, 287, C1-C11.
36. Su, T-T. J. (2004): MS thesis, MIT.
37. Wang, M. D.; Yin, Y.; Landick, R.; Gelles,J.; Block, S. M. (1997): Biophysical Jour-nal, 72, 1335-1346.
38. Raucher, D.; Sheetz, M. P. (2000): Journalof Cell Biology, 148, 127-136.
39. Asbury, C. L.; Fehr, A. N.; Block. S. M.(2003): Science, 302, 2130-2134.
40. Abbondanzieri, E. A.; Greenleaf, W. J.;Shaevitz, J. W.; Landick, R.; Block, S. M.(2005): Nature, 438, 460-465.
41. Litvinov, R. I.; Bennett, J. S.; Weisel, J.W.; Shuman, H. (2005): Biophysical Jour-nal, 89, 2824-2834.
42. Cecconi, C.; Shank, E. A.; Bustamante,C.; Marqusee, S. (2005): Science, 309:2057-2060.
43. Ashkin, A.; Dziedzic, J. M. (1987): Sci-ence, 235, 1517-1520.
44. Ashkin, A. (1992): Biophysical Journal, 61,569-582.
45. Maier, B.; Potter, L.; So, M.; Seifert, H.S.; Sheetz, M. P. (2002): Proc. Natl. Acad.Sci. USA, 99, 16012-16017.
46. Dao, M.; Lim, C. T.; Suresh, S. (2003):Journal of the Mechanics and Physics ofSolids, 51, 2259-2280.
47. Claudet, C.; Bednar, J. (2005): AppliedOptics, 44, 3454-3457.
48. Kotar, J.; Vilfan, M.; Osterman, N.;Babic, D.; Copic, M.; Poberaj, I. (2006):Physical Review Letters, 96, -.
49. Schnurr, R.; Gittes, F.; MacKintosh, F. C.;Schmidt, C. F. (1997): Macromolecules, 30,7781-7792.
50. Mackintosh F. C.; Kas, J.; Janmey, P. A.(1995): Physics Review Letters, 75(4), 4425-4428.
51. Satcher, R.; Dewey, C. F. (1996): Biophysi-cal Journal, 71, 109-118.
52. Hu, S.; Eberhard, L.; Chen, J.; Love, J.C.; Butler, J. P.; Fredberg, J. J.; White-sides, G. M.; Wang, N. (2004): Am J. Phys-iol Cell Physiol., 287, C1184-C1191.
53. Théry, M.; Racine, V; Piel, M.; PépinA.; Dimitrov, A.; Chen, Y.; Sibarita, J-B.(2006): Proc. Natl. Acad. Sci. USA, 103,19771-19776.

118 Copyright c© 2007 Tech Science Press MCB, vol.4, no.2, pp.105-118, 2007
54. Théry, M.; Jiménez-Dalmaroni, A.;Racine, V.; Borens, M.; Jülicher, F. (2007)Nature, 447, 493-496.