geology and oil and gas assessment of the fruitland total - usgs
TRANSCRIPT

Geology and Oil and Gas Assessment of the Fruitland Total Petroleum System, San Juan Basin, New Mexico and Colorado
By J.L. Ridgley, S.M. Condon, and J.R. Hatch
Chapter 6 of 7 Total Petroleum Systems and Geologic Assessment of Undiscovered Oil and Gas Resources in the San Juan Basin Province, Exclusive of Paleozoic Rocks, New Mexico and Colorado Compiled by U.S. Geological Survey San Juan Basin Assessment Team
Digital Data Series 69–F
U.S. Department of the InteriorU.S. Geological Survey
Click here to return to Volume Title Page

U.S. Department of the InteriorKEN SALAZAR, Secretary
U.S. Geological SurveyMarcia K. McNutt, Director
U.S. Geological Survey, Reston, Virginia 2013
For product and ordering information: World Wide Web: http://www.usgs.gov/pubprod Telephone: 1-888-ASK-USGS
For more information on the USGS—the Federal source for science about the Earth, its natural and living resources, natural hazards, and the environment: World Wide Web: http://www.usgs.gov Telephone: 1-888-ASK-USGS
Suggested citation: Ridgley, J.L., Condon, S.M., and Hatch, J.R., 2013, Geology and oil and gas assessment of the Fruitland Total Petro-leum System, San Juan Basin, New Mexico and Colorado, chap. 6 of U.S. Geological Survey San Juan Basin Assess-ment Team, Total petroleum systems and geologic assessment of undiscovered oil and gas resources in the San Juan Basin Province, exclusive of Paleozoic rocks, New Mexico and Colorado: U.S. Geological Survey Digital Data Series 69–F, p. 1–100.
Any use of trade, product, or firm names is for descriptive purposes only and does not imply endorsement by the U.S. Government.
Although this report is in the public domain, permission must be secured from the individual copyright owners to reproduce any copyrighted material contained within this report.
iii
Contents
Abstract ...........................................................................................................................................................1Introduction ....................................................................................................................................................1Fruitland Total Petroleum System ...............................................................................................................5
Hydrocarbon Reservoir Rocks ............................................................................................................5Pictured Cliffs Sandstone ...........................................................................................................5Fruitland Formation ......................................................................................................................6Cretaceous and Tertiary Formations ........................................................................................7
Hydrocarbon Source Rock ................................................................................................................12Fruitland Formation Source Rock Characterization .............................................................12
Vitrinite Reflectance .........................................................................................................12Geochemical Characteristics .........................................................................................13
Source Rock Maturation and Thermal History ..............................................................................18Fruitland Formation Hydrology .........................................................................................................22
Pressure Regimes in the Fruitland Formation .......................................................................22Meteoric Water Incursion ........................................................................................................22Relation of Groundwater Flow to Thermal History ...............................................................23Water Inorganic Compositions ................................................................................................25Water Dating ...............................................................................................................................25Carbon Isotopes of Dissolved Inorganic Carbon in Produced Waters .............................28
Fruitland Formation Gas ....................................................................................................................28Gas Chemistry.............................................................................................................................28
Distribution of Gas Wetness ...........................................................................................28Distribution of Methane Isotopes ..................................................................................31Carbon Dioxide Content ...................................................................................................35
Gas Generation Processes ......................................................................................................45Microbial ............................................................................................................................45Thermogenic ......................................................................................................................48
Gas Origin ....................................................................................................................................48Hydrocarbon Migration Summary ...................................................................................................50Hydrocarbon Traps and Seals ..........................................................................................................51
Assessment Unit Definitions ......................................................................................................................51Pictured Cliffs Continuous Gas Assessment Unit (50220161) ......................................................51
Introduction.................................................................................................................................51Source..........................................................................................................................................54Maturation...................................................................................................................................54Migration .....................................................................................................................................54Reservoirs ...................................................................................................................................54Traps/Seals .................................................................................................................................54Geologic Model ..........................................................................................................................54Assessment Results ..................................................................................................................54

iv
Basin Fruitland Coalbed Gas Assessment Unit (50220182) and Fruitland Fairway Coalbed Gas Assessment Unit (50220181) ........................................................................................55
Introduction.................................................................................................................................55Production Characteristics of the Basin Fruitland Coalbed Gas and Fruitla
Fairway Coalbed Gas Assessment Units ..................................................................58Water Production ..............................................................................................................58Cumulative Gas Production ............................................................................................58Normalized Gas Production ...........................................................................................65
Relations Among Gas, Water Production, Groundwater Flow, and Microbial-Gas Generation .....................................................................................................................65
Basin Fruitland Coalbed Gas Assessment Unit (50220182) ..........................................................70Introduction.................................................................................................................................70Source..........................................................................................................................................70Maturation...................................................................................................................................70Migration .....................................................................................................................................70Reservoirs ...................................................................................................................................73Traps/Seals .................................................................................................................................73Geologic Model ..........................................................................................................................73Assessment Results ..................................................................................................................73
Fruitland Fairway Coalbed Gas Assessment Unit (50220181) ......................................................74Introduction.................................................................................................................................74Source..........................................................................................................................................78Maturation...................................................................................................................................78Migration .....................................................................................................................................78Reservoirs ...................................................................................................................................78Traps/Seals .................................................................................................................................80Geologic Model ..........................................................................................................................80Assessment Results ..................................................................................................................80
Tertiary Conventional Gas Assessment Unit (50220101) ...............................................................81Introduction.................................................................................................................................81Source..........................................................................................................................................84Maturation...................................................................................................................................84Migration .....................................................................................................................................84Reservoirs ...................................................................................................................................84Traps/Seals .................................................................................................................................84Geologic Model ..........................................................................................................................84Assessment Results ..................................................................................................................84
Summary........................................................................................................................................................86Acknowledgments .......................................................................................................................................86References Cited..........................................................................................................................................86
v
Figures
1. Map showing structural elements in the San Juan Basin and the location of inferred basement structural blocks .........................................................................................2
2. Map showing boundary of the Fruitland Total Petroleum System .......................................3 3. Chart showing regional chronostratigraphic correlations in the San Juan Basin to
the base of the Jurassic, and the extent of the total petroleum systems and assessment units defined in the 2002 National Oil and Gas Assessment of the San Juan Basin Province ...................................................................................................................4
4. Cross section extending from southwest to northeast across the central San Juan Basin ...............................................................................................................................................8
5. Isopach map of net coal in the Fruitland Formation .............................................................10 6. Structure contour map drawn on top of the Pictured Cliffs Sandstone ............................11 7–9. Crossplots showing relations between 7. Gas methane δ13C and gas wetness ...............................................................................15 8. Gas methane δ13C, CO2 content, and gas wetness .......................................................16 9. Gas wetness .......................................................................................................................17 10. Burial history curves ..................................................................................................................19 11–18. Maps showing 11. Distribution of δ18O ‰ in produced Fruitland Formation waters ................................24 12. Pressure regimes in the Fruitland Formation and inferred directions of
groundwater flow ..............................................................................................................26 13. Relation between minimum 129I/I ages and distribution of δ18O ‰ in produced
Fruitland Formation waters ..............................................................................................29 14. Relation between pressure gradients and methane carbon (δ18C) isotope of
dissolved inorganic carbon in Fruitland Formation produced waters ......................30 15. Distribution of gas wetness in Fruitland Formation gases .........................................32
16. Distribution of CO2 concentration in Fruitland Formation gases ...............................33 17. Distribution of δ13C of methane to gas wetness in Fruitland Formation gases .......34 18. Relation between δ18O of produced Fruitland Formation waters and methane
carbon isotope (δ13C) in Fruitland Formation gas .........................................................36
Appendixes A. Assessment results summary for the Fruitland Total Petroleum System, San Juan
Basin Province, New Mexico and Colorado ......................................................................92 B–E. Input data form used in evaluating the Fruitland Total Petroleum System
B. Pictured Cliffs Continuous Gas Assessment Unit (50220181), San Juan Basin Province ..........................................................................................................................93 C. Basin Fruitland Coalbed Gas Assessment Unit (50220182), San Juan Basin Province ..........................................................................................................................95
D. Basin Fruitland Fairway Coalbed Gas Assessment Unit (50220181), San Juan Basin Province ................................................................................................................97 E. Tertiary Conventional Gas Assessment Unit (50220101), San Juan Basin Province ..........................................................................................................................99
vi
19. Crossplot showing relation between δ13CO2 and δ13C methane of gas in the Fruitland Formation .....................................................................................................................................37
20. Crossplot showing relation between δ13C CO2 and the CO2 content of gas in the Fruitland Formation .....................................................................................................................37
21–29. Maps showing 21. Relation between pressure gradient and CO2 concentration in Fruitland
Formation gas .....................................................................................................................38 22. Relation between net coal in the Fruitland Formation and distribution of CO2
concentration in Fruitland Formation gases ...............................................................39 23. Distribution of CO2 concentration in Fruitland Formation gases ...............................41 24. Relation between shorelines in Pictured Cliffs Sandstone and the isopach
thickness of the interval between Huerfanito Bentonite Bed of Lewis Shale and top of Pictured Cliffs Sandstone .....................................................................................43
25. Distribution of CO2 concentration in Fruitland Formation gases with respect to Pictured Cliffs Sandstone shorelines .............................................................................44
26. Relation between net coal in the Fruitland Formation and shorelines in the Pictured Cliffs Sandstone .................................................................................................46
27. Relation between δ18O of produced Fruitland Formation waters and carbon dioxide concentration in Fruitland Formation gas .......................................................47
28. Distribution of δ13C of dissolved inorganic carbon in Fruitland Formation produced waters in relationship to δ18O of produced waters ....................................49
29. Boundary of the Pictured Cliffs Continuous Gas Assessment Unit and Pictured Cliffs Sandstone gas fields ...............................................................................................52
30. Events chart showing key geologic events for the Pictured Cliffs Continuous Gas Assessment Unit .................................................................................................................53
31. Graph showing estimated ultimate recoveries of Pictured Cliffs Continuous Gas Assessment Unit gas wells divided by time of completion ..................................................56
32. Graph showing distribution of estimated ultimate recoveries of Pictured Cliffs Continuous Gas Assessment Unit gas wells ..........................................................................56
33. Map showing assessment unit boundaries for the Basin Fruitland Coalbed Gas and Fruitland Fairway Coalbed Gas Assessment Units and major gas fields Blanco and Ignacio-Blanco in Fruitland Formation ....................................................................................57
34. Map showing distribution of cumulative produced water in Fruitland Formation with respect to the Basin Fruitland Coalbed Gas and Fruitland Fairway Coalbed Gas Assessment Units .......................................................................................................................59
35. Graphs showing relation between cumulative water production and length of production ....................................................................................................................................60
36. Map showing distribution of length of production time of Fruitland Formation wells with respect to the Basin Fruitland Coalbed Gas and Fruitland Fairway Coalbed Gas Assessment Units .......................................................................................................................62
37. Graphs showing relation between cumulative gas production and length of production ....................................................................................................................................63
38. Map showing distribution of cumulative gas production of Fruitland Formation wells with respect to the Basin Fruitland Coalbed Gas and Fruitland Fairway Coalbed Gas Assessment Units ...............................................................................................64

vii
39. Map showing distribution of normalized gas production of Fruitland Formation wells with respect to the Basin Fruitland Coalbed Gas and Fruitland Fairway Coalbed Gas Assessment Units ...............................................................................................66
40. Graphs showing relation between normalized gas production and length of production ....................................................................................................................................67
41. Graphs showing relation between cumulative gas production and normalized gas production for production time .................................................................................................68
42. Map showing relation between basin structure and the Fruitland Fairway Coalbed Gas Assessment Unit .................................................................................................................69
43. Map showing the assessment unit boundaries for the Basin Fruitland Coalbed Gas AU and the Basin Fruitland gas fields .....................................................................................71
44. Events chart showing key geologic events for the Basin Fruitland Coalbed Gas Assessment Unit .........................................................................................................................72
45. Graph showing estimated ultimate recoveries of Basin Fruitland Coalbed Gas Assessment Unit gas wells divided by time of completion ..................................................75
46. Graph showing distribution of estimated ultimate recoveries of Basin Fruitland Coalbed Gas Assessment Unit gas wells ...............................................................................75
47. Map showing assessment unit boundary for the Fruitland Fairway Coalbed Gas Assessment Unit and the location of the Fruitland Fairway gas fields ..............................76
48. Map showing relation between cumulative gas production in the Fruitland Fairway Coalbed Gas Assessment Unit and distribution of δ18O in produced Fruitland Formation waters ........................................................................................................................77
49. Events chart showing key geologic events for the Fruitland Fairway Coalbed Gas Assessment Unit .........................................................................................................................79
50. Graph showing estimated ultimate recoveries of Fruitland Fairway Coalbed Gas Assessment Unit gas wells divided by time of completion ..................................................82
51. Graph showing distribution of estimated ultimate recoveries of Fruitland Fairway Coalbed Gas Assessment Unit gas wells ...............................................................................82
52. Map showing assessment unit boundary for the Tertiary Conventional Gas Assessment Unit and Tertiary gas fields ................................................................................83
53. Events chart showing key geologic events for the Tertiary Conventional Gas Assessment Unit .........................................................................................................................85
Tables
1. Some Pictured Cliffs Sandstone and Tertiary reservoir rocks characteristics and oil and gas compositions in the Fruitland Total Petroleum System ...........................................6
2. Means, standard deviations, ranges, and number of determinations for total organic carbon contents and hydrogen indices of the Fruitland Formation source rocks in the Fruitland Total Petroleum System ......................................................................13
3. Means, standard deviations, and number of chemical analyses of produced natural gases from the Fruitland Formation and Pictured Cliffs Sandstone in the Fruitland Total Petroleum System .............................................................................................................14


Abstract
The Fruitland Total Petroleum System (TPS) of the San Juan Basin Province includes all genetically related hydrocar-bons generated from coal beds and organic-rich shales in the Cretaceous Fruitland Formation. Coal beds are considered to be the primary source of the hydrocarbons. Potential reservoir rocks in the Fruitland TPS consist of the Upper Cretaceous Pictured Cliffs Sandstone, Fruitland Formation (both sand-stone and coal beds), and the Farmington Sandstone Member of the Kirtland Formation, and the Tertiary Ojo Alamo Sand-stone, and Animas, Nacimiento, and San Jose Formations.
Analysis of the geochemistry of Fruitland coal-bed gas and co-produced water suggests that hydrocarbons in Fruitland coal beds began to form early in the depositional history of the Fruitland Formation with the generation of early microbial gas. Source rocks in the Fruitland entered the oil generation zone in the late Eocene and continued to generate minor oil and large quantities of thermogenic gas into middle Miocene time. Near the end of the Miocene, thermogenic hydrocarbon generation and subsidence in the San Juan Basin ceased, and the basin was uplifted and differentially eroded. Late-stage (secondary) microbial gas has been documented in Fruitland coal-bed reservoirs and was formed by microbial reduction of carbon dioxide during introduction of groundwater in the late Pliocene and Pleistocene. Most of this late-stage microbial gas is found just downdip from the northern, western, and southern Fruitland outcrops. The northern part of the Fruitland Formation is overpressured as a result of artesian conditions established in the Pliocene or Pleistocene. South and east of the overpressured area, the Fruitland is either normally pres-sured or underpressured.
Four assessment units (AU) were defined in the Fruit-land TPS. Of the four AUs, one consists of conventional gas accumulations and the other three are continuous-type gas accumulations: Tertiary Conventional Gas AU, Pictured Cliffs Continuous Gas AU, Basin Fruitland Coalbed Gas (CBG) AU, and Fruitland Fairway CBG AU. No oil resources that have the potential for additions to reserves in the next 30 years were estimated for this TPS. Gas resources that have the potential for additions to reserves in the next 30 years are estimated at a mean of 29.3 trillion cubic feet of gas (TCFG). Of this
amount, 23.58 TCFG will come from coal-bed gas accumula-tions and 83.1 percent of this total is estimated to come from the Basin Fruitland CBG AU. The remaining 5.72 TCFG is allocated to continuous-type gas accumulations (5.64 TCFG) and conventional gas accumulations (0.08 TCFG). Although the Fruitland Fairway CBG AU has produced the most sig-nificant amount of coal-bed gas to date, the area of the AU is limited. New potentially productive wells will come from infill drilling, and the number of these wells will be limited by effective drainage area. Total natural gas liquids (NGL) that have the potential for additions to reserves in the next 30 years are estimated at a mean of 17.76 million barrels. Of this amount, 16.92 million barrels will come from the Pictured Cliffs Continuous Gas AU and the remainder from the Tertiary Conventional Gas AU.
Introduction
The Fruitland Total Petroleum System (TPS) encom-passes the central basin structural element of the San Juan Basin Province (figs. 1 and 2). The boundary of the TPS has been defined as the area enclosed by outcrops of the base of the Pictured Cliffs Sandstone. In Colorado, the Pictured Cliffs and Lewis Shale were grouped together on the digital geologic map used for this study (Green, 1992), and the TPS bound-ary is drawn at the base of the combined unit. This TPS is the youngest assessed in the San Juan Basin Province (fig. 3) and has been divided into four assessment units (AU), in ascend-ing order:
1. Pictured Cliffs Continuous,
2. Basin Fruitland Coalbed Gas (CBG),
3. Fruitland Fairway CBG, and
4. Tertiary Conventional Gas.
The four AUs in the TPS produce mostly gas and limited small amounts of natural gas liquids (NGL) sourced from coals and carbonaceous shale; their stratigraphic extents are shown in figure 3.
Geology and Oil and Gas Assessment of the Fruitland Total Petroleum System, San Juan Basin, New Mexico and Colorado
By J.L. Ridgley, S.M. Condon, and J.R. Hatch

2 Total Petroleum Systems and Geologic Assessment of Undiscovered Oil and Gas Resources in the San Juan Basin Province
UTA
HA
RIZ
ON
A
MCKINLEY
RIO ARRIBA
SANDOVAL
CIBOLA
APACHE
LA PLATA
MONTEZUMA
ARCHULETA
DOLORESMINERALHINSDALE
BERNALILLO
SAN MIGUEL
RIO GRANDE
CONEJOS
SAGUACHEOURAY
Cuba
Chama
Gallup
Mancos
Dolores
Telluride
Farmington
Dove Creek
Albuquerque
Pagosa SpringsDurango
Grants
SAN JUAN SAN JUAN
VALENCIA
Los Alamos
Nacim
iento u
plift
Acoma sag
SAN JUAN
37°
36°
35°
109° 108° 107°
00 2525 50 MILES50 MILES
00 2525 50 KILOMETERS50 KILOMETERS
Sleeping UteMtn
LaPlata Mtns
Valles caldera
Hogb
ack
mon
ocline
Archuleta arch
Zuni Uplift
Chaco slope
Central basin
Four Cornersplatform
Gallupsag
CarrizoMtns
Chama platform
COLORADONEW MEXICO
Figure 1. Map showing structural elements in the San Juan Basin and the location of inferred basement structural blocks (dashed red lines). Modified from Taylor and Huffman (1998, 2001), Fassett (2000), and Huffman and Taylor (2002). San Juan Basin Province (5022) boundary (purple line). Orange polygons are Late Cretaceous and Tertiary intrusive and extrusive igneous centers; gray polygons are areas of steep dip along monoclines; green lines outline some of the main structural elements.

Fruitland Total Petroleum System 3
Cabresto anticline
Kmp
Kcc
Kls
Toa
Kpl
Kmv
Tmb
Kpc
Kpcl
NatomisFederal-Texaco1-11
Superior Sealy 1-7
Basin axis
Ignacio anticline
antic
line
0.50
0.60
0.8
1.0
1.5
0.60.8
Cuba
Cortez
Durango
Dolores
Farmington
Pagosa Springs
1.5
Aztec
SohioSouthern Ute15-16
0 10
36°
37°
108° 107°
0 10 20 KILOMETERSS
20 MILES
Fruitland TPS boundary
NEW MEXICO
COLORADO
San Juan Basin boundary
Dulce dike swarm
NEW MEXICO
COLORADO
Figure 2. Map showing boundary of the Fruitland Total Petroleum System (TPS). Symbols for geologic map units: Toa, Tertiary Ojo Alamo Sandstone; Tmb, Tertiary Miocene volcanics; Kpc, Pictured Cliffs Sandstone; Kpcl, Pictured Cliffs Sandstone and Lewis Shale; Kls, Lewis Shale; Kcc, Crevasse Canyon Formation; Kmp, Menefee Formation and Point Lookout Sandstone; Kmv, Mesaverde Group; Kpl, Point Lookout Sandstone; thin red vertical lines and patches, dikes (Green, 1992; Green and Jones, 1997). Contours (gray) show vitrinite reflectance (Rm) values, in percent, from data in Fassett and Nuccio (1990), Law (1992), and Fassett (2000). Also shown are the locations of regional cross section A–A’ (in fig. 4), principal folds in the basin, and wells (green and black triangles) used to make the burial history curves in this report (figs. 10A–C).

4
Total Petroleum System
s and Geologic A
ssessment of U
ndiscovered Oil and G
as Resources in the San Juan Basin Province
TERTIARYEOCENEPALEO-CENE
UPPER
UPPER
LOWER
MIDDLE
CR
ET
AC
EO
US
JURASSIC
SAN JOSE FORMATIONNACIMIENTO FORMATIONOJO ALAMO SANDSTONE
ANIMAS FORMATION
Upper shale member
Lower shale memberFARMINGTON SANDSTONE MEMBERKIRTLAND SHALE MCDERMOTT
MEMBER
FRUITLAND FORMATION
PICTURED CLIFFSSANDSTONE
LEWIS SHALE
MESAVERDE GROUP
CLIFF HOUSE SANDSTONE
MENEFEE FORMATION
LA VENTANATONGUE
EL VADO SANDSTONE MBRTOCITO
SANDSTONE LENTIL
SATAN TONGUE
MULATTO TONGUEBORREGO PASS LENTIL
CLEARY COAL MEMBER
HOSTA TONGUEGIBSON COAL MEMBER
DALTON SANDSTONE MEMBERCREVASSECANYON
FORMATIONDILCO COAL MEMBER
ALLISON MEMBER
GALLUP SANDSTONE
MANCOS SHALE SEMILLA SANDSTONE MEMBER
TWOWELLS TONGUE OF DAKOTA SANDSTONE
PAGUATE TONGUE OF DAKOTA SANDSTONEGRANEROS MEMBER GREENHORN ( BRIDGE CREEK) LIMESTONE MEMBER
JUANA LOPEZ MEMBER
MANCOS SHALE
DAKOTA SANDSTONE (ENCINAL CANYON MEMBER, OAK CANYON MEMBER, AND CUBERO TONGUE)
WESTWATER CANYON MEMBER
RECAPTURE MEMBER
COW SPRINGS SANDSTONESAN RAFAEL GROUP
MORRISON FORMATION
HORSE MESA MEMBERBECLABITO MEMBER
TODILTO LIMESTONE MEMBERENTRADA SANDSTONE
BRUSHY BASIN MEMBER
JUNCTION CREEK SANDSTONE MEMBERSALT WASH MEMBER
BURRO CANYON FORMATION
WANAKAHFORMATION
Upper part
PONY EXPRESS LIMESTONE MEMBER
SECTION REMOVED BY LATE TERTIA
RY-QUATERNARY EROSIO
N
?
?
JACKPILE SANDSTONE MEMBER
POINT LOOKOUT SANDSTONE
CHACRA SANDSTONE
South North
***
FLT M-M 1 2 3 4 5 6 7 8 9 10 11 12 13 14
Total Petroleum System
Assessment Unit
Figure 3. Chart showing regional chronostratigraphic correlations in the San Juan Basin (modified from Molenaar, 1977a) to the base of the Jurassic and the extent of the total petroleum systems and assessment units defined in the 2002 National Oil and Gas Assessment of the San Juan Basin Province (022), New Mexico and Colorado. Total petroleum systems: F, Fruitland; L, Lewis; M–M, Mancos–Menefee, and T, Todilto. Assessment units: 1, Entrada Sandstone Conventional Oil; 2, Dakota-Greenhorn Conventional Oil and Gas; 3, Dakota-Greenhorn Continuous Gas; 4, Gallup Sandstone Conventional Oil and Gas; 5, Mancos Sandstone Conventional Oil and Gas; 6, Mancos Sandstone Continuous Gas; 7, Mesaverde Updip Conventional Oil; 8, Mesaverde Central-Basin Continuous Gas; 9, Menefee Coalbed Gas; 10, Lewis Continuous Gas; 11, Pictured Cliffs Continuous Gas; 12, Basin Fruitland Coalbed Gas; 13, Fruitland Fairway Coalbed Gas, and 14, Tertiary Conventional Gas. [*Chacra sandstone is an informal term used by drillers and geologists in the basin; **La Ventana Tongue of the Cliff House Sandstone.] Vertical lines, unconformities.

Fruitland Total Petroleum System 5
Cretaceous rocks, beginning with the Dakota Sandstone, comprise wedges of marine-to-continental transgressive and regressive strata that occupy the San Juan Basin (Baltz, 1967; Fassett, 1974, 1977, 2000; Molenaar, 1977b; Owen and Siemers, 1977; Posamentier and others, 1992; Nummedal and Molenaar, 1995; Wright Dunbar, 2001). Within these wedges of strata, various shorelines generally have a northwest– southeast orientation that may be controlled by basement structural blocks (fig. 1) (Taylor and Huffman, 1998, 2001; Huffman and Taylor, 2002). The configuration of the San Juan Basin, as observed today, was not present during the Creta-ceous. Instead, deposition in the basin was continuous to the northeast in the direction of deeper marine sedimentation. The Fruitland TPS consists of the last major regressive wedge of strata (Pictured Cliffs Sandstone-Fruitland Formation-Kirtland Shale) and all Tertiary strata (fig. 3). A regional unconformity separates Cretaceous and Tertiary rocks (Baltz, 1967; Sik-kink, 1987). Tertiary rocks were deposited solely in conti-nental depositional environments. Their present-day extent is confined to the northern part of the San Juan Basin Province, except for the Chuska Sandstone, which is on the west margin of the basin.
Originally, the Fruitland depositional system covered an area greater than its extent today. The source of sediment was from the south and southwest, and streams generally flowed to the northeast. Thus groundwater movement would have been in this direction at least through the Cretaceous, about 10 m.y. after deposition of the Fruitland. Uplift of the central basin margins and erosion of the Fruitland outside the central basin may have begun in the latest Cretaceous or earliest Paleocene, but the timing of this event is not everywhere well con-strained, and erosion of the Fruitland in some areas could be late Miocene and younger. The Cretaceous-Tertiary unconfor-mity in the northern part of the San Juan Basin separates the Paleocene Ojo Alamo Sandstone from the underlying Kirtland Shale, and in places along the east side of the San Juan Basin, the Fruitland is absent by erosion (Fassett, 1985, 2000). Prior to deposition of the Ojo Alamo, the basin was uplifted and tilted to the northwest (Fassett, 1985). This tectonic tilt would have resulted in erosion of the Fruitland along the southeast part of the central basin (fig. 1). If the Fruitland was still pres-ent elsewhere outside the central basin, then groundwater flow may have been to the northeast, north, or northwest (reflecting tectonic tilt).
From Paleocene through Eocene time, most of the sedi-ments were derived from the north and northwest and depos-ited by south and southeastward flowing streams (Fassett, 1985). Northward groundwater flow through the Fruitland probably ceased at this time. Southward groundwater flow through the Fruitland may have been initiated in the latter part of the Paleocene as a result of uplift of the area north of the San Juan Basin and local erosion of the Ojo Alamo Sandstone prior to deposition of the Paleocene Animas and Nacimiento Formations (Fassett, 1985). Erosion also occurred between deposition of the Paleocene Nacimiento Formation and the Eocene San Jose Formation (Fassett, 1985) along the
northern, eastern, and southern margins of the basin. However, deposition continued to be from the northwest, north, and northeast as evidenced by stratigraphic relations between the Animas and Nacimiento Formations, which are stratigraphic time equivalents. Deposition of the San Jose may have been principally from the north, although a southeast source in the Nacimiento Mountains has also been suggested (Baltz, 1967). On the northwest rim of the basin, the San Jose rests with angular unconformity on the Fruitland Formation (see discus-sion in Fassett, 1985). This configuration may have allowed for incursion of Eocene and younger meteoric waters into the Fruitland from the northwest as the basin continued to subside to the south.
Key elements that define the Fruitland TPS are 1. source rocks of sufficient thermal maturity to gener-
ate hydrocarbons, 2. reservoir rocks to host the accumulations, 3. migration pathways that allow the hydrocarbons to
move into reservoirs, 4. structural or stratigraphic traps in which hydrocar-
bons could accumulate, and 5. seals to contain the accumulations.
These key elements are described more fully below and in each assessment unit discussion. Methodologies for assessing continuous-type and conventional accumulations are discussed in Schmoker (2003) and Schmoker and Klett (2003).
Fruitland Total Petroleum System
Hydrocarbon Reservoir Rocks
Potential reservoir rocks in the Fruitland TPS consist of the Upper Cretaceous Pictured Cliffs Sandstone, Fruitland Formation (both sandstone and coal beds), and the Farmington Sandstone Member of the Kirtland Shale and the Tertiary Ojo Alamo Sandstone, and Animas, Nacimiento, and San Jose Formations (fig. 3).
Pictured Cliffs Sandstone
The Pictured Cliffs Sandstone is a marginal-marine deposit that prograded northeastward across the San Juan Basin (fig. 4A) (Fassett and Hinds, 1971). It gradationally overlies the Lewis Shale, and sandstone beds increase in thickness upward through a transition zone from the Lewis to the Pictured Cliffs. The Pictured Cliffs crops out around the perimeter of the central San Juan Basin. It ranges in thickness from 0 to about 400 ft (Fassett and Hinds, 1971) and is thick-est in the north-central part of the basin (fig. 4). It consists of very fine to medium-grained, well-sorted sandstone and siltstone and mudrock interbeds. Sandstone beds are elongated in a northwest–southeast direction, wedge out gradually to the northeast, and terminate abruptly to the southwest (Arnold,
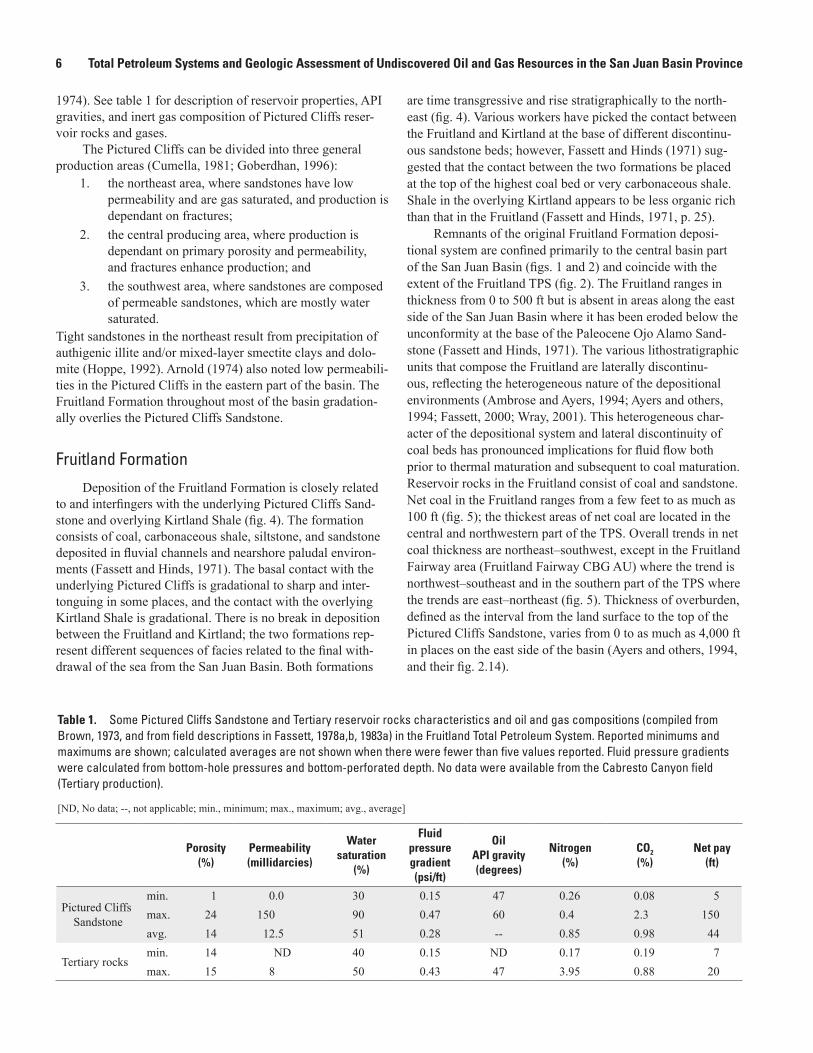
6 Total Petroleum Systems and Geologic Assessment of Undiscovered Oil and Gas Resources in the San Juan Basin Province
1974). See table 1 for description of reservoir properties, API gravities, and inert gas composition of Pictured Cliffs reser-voir rocks and gases.
The Pictured Cliffs can be divided into three general production areas (Cumella, 1981; Goberdhan, 1996):
1. the northeast area, where sandstones have low permeability and are gas saturated, and production is dependant on fractures;
2. the central producing area, where production is dependant on primary porosity and permeability, and fractures enhance production; and
3. the southwest area, where sandstones are composed of permeable sandstones, which are mostly water saturated.
Tight sandstones in the northeast result from precipitation of authigenic illite and/or mixed-layer smectite clays and dolo-mite (Hoppe, 1992). Arnold (1974) also noted low permeabili-ties in the Pictured Cliffs in the eastern part of the basin. The Fruitland Formation throughout most of the basin gradation-ally overlies the Pictured Cliffs Sandstone.
Fruitland Formation
Deposition of the Fruitland Formation is closely related to and interfingers with the underlying Pictured Cliffs Sand-stone and overlying Kirtland Shale (fig. 4). The formation consists of coal, carbonaceous shale, siltstone, and sandstone deposited in fluvial channels and nearshore paludal environ-ments (Fassett and Hinds, 1971). The basal contact with the underlying Pictured Cliffs is gradational to sharp and inter-tonguing in some places, and the contact with the overlying Kirtland Shale is gradational. There is no break in deposition between the Fruitland and Kirtland; the two formations rep-resent different sequences of facies related to the final with-drawal of the sea from the San Juan Basin. Both formations
are time transgressive and rise stratigraphically to the north-east (fig. 4). Various workers have picked the contact between the Fruitland and Kirtland at the base of different discontinu-ous sandstone beds; however, Fassett and Hinds (1971) sug-gested that the contact between the two formations be placed at the top of the highest coal bed or very carbonaceous shale. Shale in the overlying Kirtland appears to be less organic rich than that in the Fruitland (Fassett and Hinds, 1971, p. 25).
Remnants of the original Fruitland Formation deposi-tional system are confined primarily to the central basin part of the San Juan Basin (figs. 1 and 2) and coincide with the extent of the Fruitland TPS (fig. 2). The Fruitland ranges in thickness from 0 to 500 ft but is absent in areas along the east side of the San Juan Basin where it has been eroded below the unconformity at the base of the Paleocene Ojo Alamo Sand-stone (Fassett and Hinds, 1971). The various lithostratigraphic units that compose the Fruitland are laterally discontinu-ous, reflecting the heterogeneous nature of the depositional environments (Ambrose and Ayers, 1994; Ayers and others, 1994; Fassett, 2000; Wray, 2001). This heterogeneous char-acter of the depositional system and lateral discontinuity of coal beds has pronounced implications for fluid flow both prior to thermal maturation and subsequent to coal maturation. Reservoir rocks in the Fruitland consist of coal and sandstone. Net coal in the Fruitland ranges from a few feet to as much as 100 ft (fig. 5); the thickest areas of net coal are located in the central and northwestern part of the TPS. Overall trends in net coal thickness are northeast–southwest, except in the Fruitland Fairway area (Fruitland Fairway CBG AU) where the trend is northwest–southeast and in the southern part of the TPS where the trends are east–northeast (fig. 5). Thickness of overburden, defined as the interval from the land surface to the top of the Pictured Cliffs Sandstone, varies from 0 to as much as 4,000 ft in places on the east side of the basin (Ayers and others, 1994, and their fig. 2.14).
Porosity (%)
Permeability (millidarcies)
Water saturation
(%)
Fluid pressure gradient (psi/ft)
Oil API gravity (degrees)
Nitrogen (%)
CO2
(%)Net pay
(ft)
Pictured Cliffs Sandstone
min. 1 0.0 30 0.15 47 0.26 0.08 5max. 24 150 90 0.47 60 0.4 2.3 150avg. 14 12.5 51 0.28 -- 0.85 0.98 44
Tertiary rocksmin. 14 ND 40 0.15 ND 0.17 0.19 7max. 15 8 50 0.43 47 3.95 0.88 20
Table 1. Some Pictured Cliffs Sandstone and Tertiary reservoir rocks characteristics and oil and gas compositions (compiled from Brown, 1973, and from field descriptions in Fassett, 1978a,b, 1983a) in the Fruitland Total Petroleum System. Reported minimums and maximums are shown; calculated averages are not shown when there were fewer than five values reported. Fluid pressure gradients were calculated from bottom-hole pressures and bottom-perforated depth. No data were available from the Cabresto Canyon field (Tertiary production).
[ND, No data; --, not applicable; min., minimum; max., maximum; avg., average]

Fruitland Total Petroleum System 7
The coals in the Fruitland consist mostly of vitrin-ite and lesser amounts of liptinite and inertinite. The coal structure itself is not permeable and has virtually no poros-ity (Scott, 1994). The permeability in coals occurs in sets of orthogonal cleats (fractures) (Kaiser and Ayers, 1994; Tremain and others, 1994); this permeability can be quite high and vari-ous values have been reported. Permeability in the cleats can vary depending on whether the cleats are open or closed. Cleat development appears also to be related to coal rank, maceral composition, and tectonic compression (Scott and others, 1994a; Tremain and others, 1994).
The importance of understanding the role of permeability in cleats to gas production and ultimate gas recovery has been demonstrated in a 3-D seismic study of the cleats in the Cedar Hill field (Shuck and others, 1996). In their study, Shuck and others (1996) determined that the face-cleat direction, which trended northeast over a portion of the field, was not open. Instead the butt-cleat direction, which coincided with the northwest direction of maximum stress, was open. The pref-erential closing of one direction of cleats to permeability was related to tectonic stress. The field is located in the overpres-sured portion of the Fruitland Formation, and it was initially assumed that both directions of the cleats would be open to fluid movement because overpressuring would keep the cleats open. This was not the case. The loss of permeability in one direction, coupled with local faulting, enhanced compartmen-talization and resulted in local heterogeneity in gas production.
Sandstones in the Fruitland are minor reservoirs for gas; most gas production is from the Fruitland coal beds. The sandstones consist primarily of quartz and lesser amounts of feldspar and clay minerals. Calcite is the primary cement, and concretion zones have been documented (see summary in Fas-sett and Hinds, 1971). Little has been reported on lithologic characteristics of producing sandstones. Most of the descrip-tions of Fruitland reservoirs have focused on the coals. How-ever, gas is produced from sandstone beds of the Fruitland in the Glades field, San Juan County, New Mexico. Sandstones in this field have 8- to 15-percent porosity; net pay was reported as 20 ft (see discussion in Fassett, 1983). No water saturation or permeability values were reported.
Cretaceous and Tertiary Formations
The Kirtland Formation gradationally overlies the Fruitland and has been divided into a lower shale member, the Farmington Sandstone Member, and an upper unnamed shale member by Bauer (1916). Others (Fassett and Hinds, 1971; Fassett, 2000) combined the Farmington Sandstone Member and upper member into one unit. Gas and high-gravity oil have been recovered from the Farmington Sandstone Member in the northwestern part of the San Juan Basin near the towns of Aztec, Bloomfield, and Farmington (fig. 6) (Fassett, 1978a,b, 1983). The Farmington consists of isolated and stacked fluvial channels and mudrock interbeds. Sandstone beds consist of fine- to medium-grained, poorly sorted arkose (Fassett and Hinds, 1971). Typical channel dimensions are 3 ft thick and
30 ft wide, with undetermined lengths (Fassett, 1983). The Farmington is approximately 400 ft thick in areas where it produces oil or gas (Riggs, 1978). The Farmington was not quantitatively assessed in this assessment of the San Juan Basin, because it has not produced oil or gas in fields greater than the minimum sizes of 0.5 million barrels of oil or 3.0 bil-lion cubic feet of gas.
The Paleocene Ojo Alamo Sandstone unconformably overlies the Kirtland Shale in much of the basin; in places ero-sion at the unconformity has removed the Fruitland Formation and Pictured Cliffs Sandstone, and the Ojo Alamo overlies the Lewis Shale (Fassett, 1974). On the west side of the basin, the Ojo Alamo pinches out depositionally just south of the New Mexico-Colorado State line, and on the east side it extends northward to a point near the San Juan River (Fassett and Hinds, 1971). The Ojo Alamo is a fluvial sequence of coarse clastic rocks interbedded with thin mudstone beds that had its source to the north of the San Juan Basin (Fassett and Hinds, 1971; Sikkink, 1987). The unit is conglomeratic on the west side of the basin, but pebbles are rare in outcrops on the east side (Sikkink, 1987). Over the years, there have been many different interpretations of what strata should be included in the Ojo Alamo leading to different estimates of its thickness. Reported thicknesses vary from 70 to 400 ft (Craigg, 2001). Sandstones of the Ojo Alamo have produced some gas in both the western and eastern parts of the TPS.
Basal Tertiary units in much of the Colorado part of the San Juan Basin include the upper part of the Animas Forma-tion and the correlative Nacimiento Formation. The Animas can be divided into a lower conglomeratic and an upper sandstone and shale sequence (Baltz, 1953). The lower part is composed mainly of andesitic debris derived from source areas to the north of the basin and also contains metamorphic and igneous rock fragments. Thin beds of carbonaceous shale and coaly shale are also present locally (Aubrey, 1991). The upper part of the Animas is composed of sandy tuffaceous shale and coarse-grained tuffaceous sandstone, including some conglomerate. The thickness of the upper member of the Ani-mas ranges from 1,100 ft at the Animas River near Durango, Colo., to 2,670 ft in the eastern part of La Plata County, Colo. (Reeside, 1924).
The Paleocene Nacimiento Formation overlies and inter-fingers laterally with the upper member of the Animas Forma-tion in Colorado, and gradationally overlies the Ojo Alamo Sandstone in New Mexico. Most outcrops of the Nacimiento are along the west side of the central basin in New Mexico; the Animas extends farther south along the eastern outcrops. The Nacimiento has a higher proportion of sandstone at its northern outcrops and a greater proportion of mudrocks in southern exposures. Williamson and Lucas (1992) recognized several divisions of the Nacimiento along the southern rim of the central basin. The lower part consists of drab-colored sandstone, mudrocks, and thin coal or lignite beds. The middle part is mainly variegated purple, gray, and green mudrocks and less abundant sandstone. The upper part is dominantly sandstone, although mudrocks, some very carbonaceous, are

8
Total Petroleum System
s and Geologic A
ssessment of U
ndiscovered Oil and G
as Resources in the San Juan Basin Province
35
??
??
GR
Induction
InductionInduction
Induction
ConductivityConductivity
ConductivityConductivity
Conductivity
ConductivityConductivity
Conductivity Conductivity Conductivity
Gamma ray
Gamma ray
Gamma ray
Gamma ray
Gamma ray
Gamma ray
Density
Density
OUTCROP
OUTCROP
OUTCROP
OUTCROP
C32rC33r C33n
C32rC33nC32r
C33nC32r 73.50 Ma
Tertiary Cretaceous (72.4 Ma)*
(65.4 Ma)
0
1
20
1
3
4
7
5
6
0
1
2
4
5
6
7
9
10
8
0
1
11
3
2
4
5
6
7
8
9
10
12
0
1
2
3
11
13
14
15
8
9
15
16
6
7
10
11
12
13
14
17
18
10
11
12
13
14
15
16
17
18
19
20
21
22
20
12
13
14
15
16
17
18
19
22
21
26
23
24
25
12
13
14
15
16
17
18
20
22
19
21
23
24
25
18
19
22
11
12
13
14
15
16
17
20
21
23
24
25
26
18
19
20
21
22
23
24
27
16
17
25
26
28
29
30
31
32
23
24
25
26
27
28
29
30
31
32
33
34
36
37
38
39
40
41
39
40
41
42
43
24
25
26
27
28
29
30
31
32
33
34
35
36
37
38
39
40
41
26
27
28
29
30
34
36
35
31
32
33
42
43
37
38
39
40
41
30
31
32
33
34
35
36
37
38
39
44
45
46
47
48
40
41
42
43
9
10
11
12
13
14
15
16
17
18
19
20
21
22
23
24
25
26
27
26
18
19
20
21
22
23
24
25
27
28
29
30
31
32
33
34
25
26
37
35
34
27
28
29
30
31
32
33
36
38
28
29
30
31
32
33
34
38
37
35
36
39
40
41
42
43
44
3.7 3.3 4.8 4.7 4.33.7 3.73.9 3.4 2.8 5.3 3.6 4.1 5.3 6.1 5.5 6.13.54.3A A'
USGSTL 27-1
USGSAMW 6 -1
Ith-Hal-E- Wood 1
Huerfano 120
Huerfanito 97
San Juan 29-7 65Daum 4A Barron Kid 7
Rosa Unit 24
Mesa 32-4, 2-16Southern Ute 1
Vander- slice 1
FanninGovernment 1
Tanner Unit 1
1
2
6
5
7
89
10
1112
13 1415 16
17
1920
3
4
(82.1 miles)
75.76 Ma
1,076 feet
San Juan 28-7 30
Storey 4 Schwerdtfeger 13-A
Huerfanito 60-4
25
26
27
28
29
30
31
32
33
34
35
36
37
38
39
40
41
San Juan 32-5 218
Huerfanito BentoniteBed of Lewis Shale
Southwest
Northeast
NOTE
Unless otherwise indicated, curve on right side of depth track is 16-inch-normal resistivitylog and curve on left is spontaneous potential log. Datum is Huerfanito Bentonite Bed. Depths are in 100s of feet.
VERTICAL EXAGGERATION ABOUT X 24
Ojo AlamoSandstone
Farmington SandstoneMember of KirtlandFormation
lower shale member ofKirtland Formation andFruitland Formation,undivided
Pictured CliffsSandstone
Lewis Shale
* Estimate based on rate of deposition of underlying strata
DATUM
Lundean 1
Top Mesaverde Group
Top Huerfanito Bentonite Bed
Top Pictured Cliffs Sandstone
Top Point Lookout Sandstone
Top Dakota Sandstone
Topographic profile
Top Kirtland Formation0.420.43
0.610.67
0.680.73
1.040.910.93
1.15 1.27
0.79
1.95
1.85
0.75
0.60
Ro values from Fruitland and Menefee Formations in red
0.49
Tertiary rocks, undivided
2,000
4,000
6,000
1,000
New Mexico---Colorado
Main Mesaverde production
Main Pictured Cliffs production Main Basin axisSub-basin
Thrust fault from Taylor and Huffman, 1998
Area of Lewis production
Extension of Ignacio anticline
Elevation (ft)
VERTICAL EXAGGERATION ABOUT X 15
Figure 4. Cross section extending from southwest to northeast across the central San Juan Basin (modified from Fassett, 2000). Structure section at bottom of figure was produced from data from IHS Energy Group (2002). Rm values (in red) were compiled from Fassett and Nuccio (1990) and Law (1992).

Fruitland Total Petroleum System
9List of drill holes on cross section A–A'
Conglomeratic sandstone(High-energy, braided streams; northerlysource area)
Black areas within resistivity log curve are coal beds;gray areas show correlations of coal beds between holes
Unconformity at Cretaceous-Tertiary boundary; 7−8 m.y. hiatus
Fine- to medium-grained sandstones(Low-gradient intermittent small streams;southwest source area)
Fine- to medium-grained sandstones, siltstones,mudstones, carbonaceous shales and mudstonesand coals (Back shore to lower alluvial plain)
Fine- to medium-grained sandstone(Shoreface)
Mudstone, limestone concretions, rare thin fine-grained sandstone or siltstone layers(Offshore marine)
C33n
C32r Position of magnetic-polarity reversal: chron C33nis normal polarity, chron C32r is reversed polarity
Datum: Huerfanito Bentonite Bed; dotted where projected
EXPLANATION
0 10 20 30miles
Durango
Farmington
Cuba
109 108 107
37
36
COLORADO
NEW MEXICO
UTA
HA
RIZ
ON
A
PagosaSprings
FruitlandFormationoutcrop
HunterWash area
A
MAP SHOWING LINE OF SECTION
12
3 45
67
8
910
1112
1314
1516
17
18
2019 A'
Figure 4. Cross section extending from southwest to northeast across the central San Juan Basin (modified from Fassett, 2000). Structure section at bottom of figure was produced from data from IHS Energy Group (2002). Rm values (in red) were compiled from Fassett and Nuccio (1990) and Law (1992).—Continued
Hole number
Company Drill hole nameLocation
Longitude LatitudeT.N. R.W. Sec. Quarter
1 U.S.Geological Survey Tanner Lake 27-1 23 13 27 NE -108.20863 36.20174
2 U.S.Geological Survey Alamo Mesa West 6-1 23 12 6 SW -108.16351 36.25208
3 Tanner Unit 1 24 12 21 SW -108.12527 36.29552
4 H. L. Fanning Vanderslice 1 24 12 13 SW -108.0684 36.30875
5 Davis Oil Fannin Government 1 24 11 3 NW -107.99737 36.34906
6 Sun Oil Heirs Ith-Hal-E-Wood 1 25 10 19 SW -107.94365 36.38110
7 El Paso Natural Gas Lundean 1 25 10 9 NE -107.90435 36.42016
8 El Paso Natural Gas Huerfano 120 26 10 25 NW -107.84311 36.45483
9 Turner & Webb Huerfanito 60-4 26 9 4 SW -107.79830 36.51276
10 El Paso Natural Gas Huerfanito 97 27 9 24 SW -107.74418 36.55835
11 El Paso Natural Gas Schwerdtefeger 13 27 8 8 NE -107.70009 36.59342
12 El Paso Natural Gas Storey 4 28 8 34 NE -107.66434 36.62203
13 El Paso Natural Gas San Juan 28-7 30 28 7 18 SW -107.61931 36.65882
14 El Paso Natural Gas San Juan 29-7 65 29 7 22 NE -107.55481 36.71582
15 El Paso Natural Gas Daum 4-A 29 7 1 NE -107.51615 36.75915
16 El Paso Natural Gas Barron Kid 7 30 6 21 NE -107.46263 36.80087
17 El Paso Natural Gas Rosa Unit 24 31 5 32 SW -107.39026 36.85170
18 Stanolind Oil and Gas San Juan 32-5 Unit 32 5 35 SW -107.33902 36.93009
19 Phillips Petroleum Mesa Unit 32-4 2-16 32 4 16 SW -107.26464 36.98390
20 Stanolind Oil and Gas Southern Ute 1 32 3 22 NE -107.15853 37.00997
Humble Oil & Refining

10 Total Petroleum Systems and Geologic Assessment of Undiscovered Oil and Gas Resources in the San Juan Basin Province
Kmp
Kcc
Kls
Kpl
Kmv
Tmb
Kpc
Kpcl
0.50
0.60
0.8
1.0
1.5
1.50.8
0.6
Cuba
Cortez
Durango
Dolores
Farmington
Pagosa Springs
Aztec
NEW MEXICO
COLORADO
0 10
0 10 20 KILOMETERS
20 MILES
San Juan Basin boundary
Fruitland TPS boundary
0–5
5–25
25–45
45–65
65–95
Net coalthickness
(ft)
36°
37°
108° 107°
Figure 5. Isopach map of net coal in the Fruitland Formation (modified from Fassett, 2000). Shown are the boundaries of the Fruitland Total Petroleum System (TPS) (black) and Fruitland Fairway Coalbed Gas Assessment Unit (AU ) (dark blue). Symbols for geologic map units: Toa, Tertiary Ojo Alamo Sandstone; Tmb, Tertiary Miocene volcanics; Kpc, Pictured Cliffs Sandstone; Kpcl, Pictured Cliffs Sandstone and Lewis Shale; Kls, Lewis Shale; Kcc, Crevasse Canyon Formation; Kmp, Menefee Formation and Point Lookout Sandstone; Kmv, Mesaverde Group; Kpl, Point Lookout Sandstone (Green, 1992; Green and Jones, 1997). Contours (red) show vitrinite reflectance (Rm) values, in percent, from data in Fassett and Nuccio (1990), Law (1992), and Fassett (2000).

Fruitland Total Petroleum System 11
Basin axis
Ignacio anticline
antic
line
NatomisFederal-Texaco1-11
Superior, Sealy 1-7
Ignacio-Blanco
Sohio, Southern Ute 15-16
Bloomfield
Kmp
Kcc
Kls
Kpl
Kmv
Tmb
Kpc
Kpcl
0
5,50
0
5,000
6,50
0
4,500
6,000
4,000
3,500
7,000
7,500
8,00
0
3,000
55007,
500
06,500
7,500
3,500
7,000
7,00
0
6,500
8,000
6,500
7,500
7,500
7,000
7,500
7,500
3,500
7,000
8,000
7,,500
6,000
0
0.50
0.60
0.8
1.0
1.5
1.5
0.8
0.8
5,500
Cuba
CortezDurango
Dolores
Farmington
Pagosa Springs
Aztec
NEW MEXICO
COLORADO
0 10
0 10 20 KILOMETERS
20 MILES
Fruitland TPS boundary
Cabresto
anticline
San Juan Basin boundary
36°
37°
108° 107°
Figure 6. Structure contour map (black lines) drawn on top of the Pictured Cliffs Sandstone (modified from Fassett, 2000). Contour interval 500 ft; datum is mean sea level. Map showing the boundary of the Fruitland Total Petroleum System (heavy black line). Symbols for geologic map units: Toa, Tertiary Ojo Alamo Sandstone; Tmb, Tertiary Miocene volcanics; Kpc, Pictured Cliffs Sandstone; Kpcl, Pictured Cliffs Sandstone and Lewis Shale; Kls, Lewis Shale; Kcc, Crevasse Canyon Formation; Kmp, Menefee Formation and Point Lookout Sandstone; Kmv, Mesaverde Group; Kpl, Point Lookout Sandstone (Green, 1992; Green and Jones, 1997). Contours (red) show vitrinite reflectance (Rm) values, in percent, from data in Fassett and Nuccio (1990), Law (1992), and Fassett (2000). Also shown are the locations of principal folds in the basin and wells (green and black triangles) used to make the burial history curves in this report (figs. 10A–C).

12 Total Petroleum Systems and Geologic Assessment of Undiscovered Oil and Gas Resources in the San Juan Basin Province
also common. Overall, the Nacimiento ranges from about 500 to 1,800 ft thick (Baltz, 1967; Craigg, 2001) with thicker strata located in the center of the basin. The thick, mudrock-rich central basin strata are thought to have a lacustrine origin (Fassett, 1974). Small quantities of gas are produced from sandstone in the Nacimiento in both the eastern and western parts of the TPS.
The Eocene San Jose Formation is a thick, heteroge-neous, terrestrial unit that crops out over the northern and east-central parts of the basin. In Colorado, the San Jose com-monly overlies the Animas Formation, and in New Mexico it overlies the Nacimiento Formation. The San Jose has been divided into various formal and informal members in studies including those by Baltz (1967), Brimhall (1973), and Smith (1992). In general, the lower part consists of stacked fluvial sandstone channels assigned to the Cuba Mesa Member. The middle part consists of the sandstone-rich Ditch Canyon and Llaves Members and the mudrock-dominated Regina Member (Baltz, 1967; Smith, 1992). The upper part of the San Jose consists of the siltstone-dominated Tapicitos Member. These members are not all present in the same areas; the sequence of sandstone- and mudrock-dominated intervals changes depend-ing on where the San Jose is examined. Carbonaceous shale or coal/lignite beds have not been reported from any part of the San Jose. The San Jose is the uppermost rock unit in this part of the San Juan Basin, and its original thickness is unknown because of erosion. Thicknesses of less than 200 ft to more than 2,700 ft have been reported. In the area of the Cabresto Canyon gas field (see fig. 52) and the Cabresto anticline (fig. 6), the San Jose is about 2,100 ft thick.
The relatively shallow depth and high porosity of most Tertiary rocks in the basin contribute to their being water saturated in many areas, which may limit their potential for oil and gas production. According to Craigg (2001), the Ojo Alamo Sandstone is a dependable aquifer and produces water from wells and springs. The Animas and Nacimiento Forma-tions have similar water-yielding capacity—only used locally as aquifers in areas where thin, fine-grained sandstone beds predominate (mainly in the central and southern parts of the basin), but increasing in quality in the north and northeast where sandstone beds are more abundant (Craigg, 2001). The San Jose is an aquifer in many parts of the basin, decreasing its potential as a gas-bearing unit (Anonymous, 1998).
Hydrocarbon Source Rock
The Fruitland TPS has two principal sources of hydro-carbons: coal beds and carbonaceous shale in the Fruitland Formation. The coal beds are thought to be the principal source of hydrocarbons in the Pictured Cliffs Sandstone and Fruitland Formation (Rice, 1983). The Kirtland Shale contains a high percentage of shale beds; however, little is known about the hydrocarbon generative capability of these beds. One sample from the Kirtland had a total organic carbon (TOC) value of 0.17 (Threlkeld, written commun., 2001). Because of
the possible low TOC content, the shales are not considered to be a major source of hydrocarbons in sandstone beds of the Kirtland, such as the Farmington Sandstone Member, which locally has produced gas and condensate.
The Paleocene Ojo Alamo Sandstone contains local concentrations of gas on the northeast side of the basin. However, few interbedded shale beds occur in the Ojo Alamo (Fassett and Hinds, 1971; Sikkink, 1987), so the gas must have been generated in some other formation. Shale beds in the Paleocene Nacimiento Formation are of nonmarine origin and probably contain low TOC content, although a few scattered lignite and carbonaceous shale beds have been documented (Baltz, 1967). Two shale samples from the Nacimiento had TOC values less than 0.5 (Threlkeld, written commun., 2001). Shale beds in the Nacimiento are not thought to be the source of gas found in small accumulations in the Nacimiento or the overlying Eocene San Jose Formation.
Because Tertiary strata do not appear to contain shale beds capable of producing hydrocarbons in any measurable quantity, hydrocarbons found in them must have been gener-ated elsewhere. The most likely source of these hydrocarbons is the coal in the underlying Fruitland Formation. Therefore, because the Fruitland coal beds are considered to be the princi-pal source of hydrocarbons in strata above the Lewis Shale, all strata above the Lewis and all hydrocarbons, discovered or not, in these strata have been placed in the Fruitland TPS.
Fruitland Formation Source Rock Characterization
Vitrinite Reflectance
Coal beds are present throughout the Fruitland Forma-tion; they are thickest in the central and northern part and thin-nest in the east and southeast part of the TPS (fig. 5). Vitrinite reflectance values from coal samples increase from less than 0.5 percent in the southwest to over 1.5 percent in the north (fig. 5) (Rice, 1983; Fassett, 2000). The increase in reflectance values corresponds to an increase in coal rank from subbitu-minous to medium and low volatile bituminous (Rice, 1983). It has been suggested that coal will produce thermal methane at vitrinite reflectance values of 0.5 percent and greater and microbial gas at values less than this (Scott, 1994). Using this vitrinite reflectance value as a cutoff for thermal-gas generation, most of the coals in the Fruitland Formation are considered capable of producing thermogenic methane.
The vitrinite isoreflectance lines are subparallel to structure contours drawn on top of the Pictured Cliffs Sand-stone (fig. 6) and on the underlying Huerfanito Bentonite Bed (Fassett, 2000). The dominant northwest–southeast orienta-tion of the isoreflectance lines and structure contours reflect present-day structure in the basin. Because the rank of coal generally parallels the structural configuration of the basin, the pattern of thermal maturity of the coals is primarily related to past depth of burial. Overburden above the coals is thick-est in the northern part of the TPS and thins gradually to the

Fruitland Total Petroleum System 13
southwest where the Fruitland is exposed at the outcrop, as well as toward outcrops at the other basin margins (Fassett and Hinds, 1971; Scott and others, 1994b; Fassett, 2000). The most mature coal does not everywhere coincide with the area of greatest past basin subsidence or with present overburden in the basin. It has been suggested that the isolated areas of great-est thermal maturity have been influenced by emplacement of batholiths in the San Juan Mountains during the Oligocene (Rice, 1983) by a deep-seated heat source underlying the northern part of the San Juan Basin, or by a thermal convec-tive cell that channeled heated fluids vertically upward in this area (Law, 1992). Isoreflectance contours in some areas are subparallel to thick trends in net coal, whereas in other areas they crosscut net coal trends (fig. 5) (Scott and others, 1994b; Fassett, 2000).
Geochemical Characteristics
Table 2 is a summary of the principal geochemical parameters of Fruitland coal beds. Geochemical analyses of Fruitland coal beds show they have a high total organic carbon (TOC) as compared to the average carbonaceous shale, which generally has less than 10 percent TOC. The hydrogen index range, which is often used to identify source rock type, sug-gests a mixture of type-II and type-III organic matter. Based on the maceral composition and the hydrogen index range of 23–380 mg/g for the Fruitland coals, it is expected that the bulk of the hydrocarbons produced will be wet or dry gas (Jones, 1987) (table 2), although small quantities of oil and condensate have also been reported from reservoirs in the Fruitland TPS (Clayton and others, 1991).
The composition of gas produced from coals is depen-dent, in part, on the maceral composition of the coal. Coals are composed of type-III terrestrial organic matter and generally consist of various proportions of vitrinite, liptinite (exinite), and inertinite macerals. Vitrinite is derived from lignin and cellulose walls of plant matter, and liptinite is derived from pollens, resins, waxes, and fats and is hydrogen rich (Stach and others, 1982). Vitrinites are composed of structured humic material and matrix gels; the humic material tends to produce chemically dry gas, whereas, the matrix gels, because they are more hydrogen rich, tend to produce chemically wetter gas (Tissot and Welte, 1987; Rice and others, 1989, 1992;
Clayton and others, 1991; Rice, 1993). Coals from the Fruit-land Formation have been documented to contain greater than 80-percent vitrinite, composed mostly of humic material (Rice and others, 1989; Mavor and Nelson, 1997). However, matrix gels and liptinite macerals make up as much as 30 percent of some coal samples; thus, these coals are capable of producing some oil and wet gas (samples that contain more than 1–2 per-cent ethane and higher molecular weight hydrocarbons) (Rice and others, 1989; Rice, 1993).
The composition of gas produced from the coal beds is not just a function of organic matter composition but is also related to the thermal maturity of the coals in addition to any microbial-gas generation. A number of studies have discussed the variation in composition of the coal-bed gases and related these to thermal maturity patterns in the basin (Rice, 1983; Rice and others, 1989; Scott and others, 1991; Scott, 1994; Scott and others, 1994a). Fruitland coal-produced gases can be separated into two general groups:
1. overpressured and2. underpressured to normally pressured (table 3),
which are coincident with the present-day pressure distribution in the Fruitland Formation (Scott, 1994).
Generally, gas from the overpressured area is drier and contains more carbon dioxide (table 3). The overpressured area lies approximately between the 0.8- and 1.6-percent Rm vitrinite isoreflectance contours (fig. 5). Wet Fruitland gases (those with 1 percent or more of high molecular weight hydro-carbons) generally occur between the 0.49- and 0.75-percent Rm vitrinite reflectance contours (Scott, 1994). However, dry gas may occur outside the overpressured area, and wet gas has been found within the overpressured area. It has been suggested that the regional distribution in composition of the coal-derived gas is not just dependent on coal rank and coal composition, but basin hydrology is also a contributing factor because the gas wetness correlates better with pressure regimes in the Fruitland (Scott and Kaiser, 1991; Scott, 1994).
The range of gas wetness, CO2 concentration, and iso-topes of methane and carbon dioxide reported from Fruitland TPS reservoirs are summarized in table 3. An understanding of the probable distribution of wet gas, which determines the expectation of NGLs, and the distribution of CO2 concentra-tions, which affects British Thermal Unit (BTU) values, can
Interval Total organic carbon (%)Hydrogen index (mg/g)
(Rock-Eval)Expected types of HC
Fruitland Formation coal 58 ± 15
range = 24–72(n = 24)
225 ± 90range = 23–380
(n = 24)Wet and/or dry gas
Table 2. Means, standard deviations, ranges, and number of determinations for total organic carbon contents and hydrogen indices of the Fruitland Formation source rocks in the Fruitland Total Petroleum System, San Juan Basin, Colorado and New Mexico. Total organic carbon contents and hydrogen indices are summarized from samples with Tmax ≤450 °C. Data from Rice and others (1989), Clayton and others (1991), Pasley and others (1991), Michael and others (1993), Gries and others (1997), and Threlkeld (written commun., 2001).

14 Total Petroleum Systems and Geologic Assessment of Undiscovered Oil and Gas Resources in the San Juan Basin Province
be used in economic analysis of Fruitland gas. Most Fruitland wells that produce wet gas produce lower volumes of gas when compared to wells that produce dry gas. Gas wetness values and CO2 concentration in gases from underpressured and normally pressured Fruitland Formation reservoirs and the Pictured Cliffs Sandstone reservoirs are similar (table 3) (figs. 7A, 7B, 8A, and 8B). Gases from the overpressured Fruitland coal are drier (Scott, 1994) and tend to have higher CO2 contents—although these contents vary throughout the overpressured area (Scott, 1994)—compared to the underpres-sured and normally pressured Fruitland and Pictured Cliffs reservoirs. The distribution of gas wetness in the Pictured Cliffs Sandstone and Fruitland Formation appears to be independent of present depth of burial (figs. 9A and 9B). Gas wetness values in Pictured Cliffs and Fruitland generally appear to be independent of methane d13C (figs. 7A and 7B). However, gases in the Pictured Cliffs tend to be wet (wet-ness values >1 percent), whereas those in the Fruitland are either wet or dry (figs. 8A and 8B). Data used in figures 7 and 8 may not be equivalent, because carbon-isotope values of methane were not available for all samples (Threlkeld, written commun., 2001).
Because microbial processes are important in many coal-bed-methane gas systems, methane d13C can provide informa-tion on the thermal history of the source beds and on the rela-tive contribution of thermogenic and microbial processes to gas generation. The relative contribution of thermogenic and microbial processes is important to understand in the Fruitland TPS because it has been suggested that as much as 25–50 per-cent of the gas is microbially generated in Fruitland reservoirs in the Fruitland Fairway Coalbed Gas AU (Scott and oth-ers, 1991). Methane d13C varies little in either the Fruitland Formation or the Pictured Cliffs Sandstone gases, although a few samples have values as much as 10 per mil greater or less than the average value (figs. 7A and 7B). The similarity in average methane d13C values for Fruitland and Pictured
Cliffs gases suggests a common source for the gas. Late-stage (secondary) microbial methane has been reported from the northern, southern, and northwestern part of the TPS in areas influenced by meteoric recharge. Evidence for microbial activ-ity in the recent geologic past is based on heavy d13C isotopes of dissolved inorganic carbon in the waters co-produced with the coal-bed gas and from heavy d13C isotopes of carbon in carbon dioxide and lighter than expected d13C of the methane in the gas (Scott and others, 1991; Scott, 1994).
Oils (condensates) are produced from some of the Fruit-land coals (Clayton and others, 1991). These oils can be dis-tinguished from other Cretaceous, Pennsylvanian, and Jurassic oils in the basin by their isoprenoid ratios and carbon-isotope compositions. Oils produced from Fruitland coals and Pictured Cliffs Sandstone reservoirs differ in their pristane/phytane (Pr/Py) ratios. Pr/Py in condensates from the Pictured Cliffs are roughly half (0.5) that found in the Fruitland samples, which is greater than 1 (Rice and others, 1989; Clayton and others, 1991). Other differences in the characteristics of Fruitland Formation and Pictured Cliffs Sandstone oils suggest that the Pictured Cliffs Sandstone oils may have been partially sourced from the underlying Lewis Shale (Clayton and others, 1991); this represents an exception to our earlier statement that all hydrocarbons in the Fruitland TPS were sourced from the Fruitland. Gas wetness in the Pictured Cliffs Sandstone gases has been documented to increase in the east and southeast part of the TPS. In this area, the net Fruitland coal thickness decreases (fig. 5). This inverse relation suggests a contribu-tion of gas to the Pictured Cliffs from the Lewis Shale in the eastern part of the Fruitland TPS. The relative contribution of Lewis-sourced gas and oil cannot be estimated, and for the purpose of this assessment, the gas resources are treated as having been mostly derived from Fruitland source rocks. Oil in the Pictured Cliffs Continuous Gas AU is minor and values are too low to be assessed. A discussion of the Lewis TPS is found in chapter 5.
Producing intervalWetness
(%)CO2
( mole percent)δ13CCH4
(per mil)δ13CCO2
(per mil)
Fruitland Fm. coal, overpressured, 3 ± 3(n = 157)
6.4 ± 3.7(n = 157) –39.8 ± 6.9
(n = 73)avg = -42.5
12.8 ± 4.2(n = 8)Fruitland Fm. coal, underpressured
and normal pressured8 ± 4
(n = 111)1.4 ± 1.5(n = 111)
Pictured Cliffs Sandstone 10.5 ± 3.9(n = 95)
0.7 ± 0.9(n = 95)
–43.5 ± 4.5(n = 52)
avg = -42.5
6.9 ± 14.0(n = 5)
Table 3. Means, standard deviations, and number of chemical analyses of produced natural gases from the Fruitland Formation and Pictured Cliffs Sandstone, San Juan Basin, New Mexico and Colorado in the Fruitland Total Petroleum System. The Fruitland gases have been differentiated between the overpressured and normally to underpressured areas of production, because their composition differs between the two pressure regimes. Data from Rice (1983), Moore and Sigler (1987), Rice and others (1988), Scott and others (1991).
[Wetness percent = 100 x (1–[mol%C1/Σmol%C1–C5]). n, number of samples; avg., average; Fm, Formation]

Fruitland Total Petroleum System 15
C CH4δ 13 (PER MIL)
–550
5
10
15
20
25
30
WET
NES
S (P
ERCE
NT)
Pictured Cliffs Sandstone
–50 –45 –40 –35 –30
A
Fruitland Formation
C CH4δ13 (PER MIL)
–55 –50 –45 –40 –35 –300
5
10
15
20
25
30
WET
NES
S (P
ERCE
NT)
B
Figure 7. Crossplot showing relation between gas methane δ13C and gas wetness, where wetness percent = 100 x (1–[mol%C1/∑mol%C1–C5]). (A) Pictured Cliffs Sandstone, N= 45 samples; (B) Fruitland Formation, N= 68 samples. Data are from Threlkeld (written commun., 2001).

16 Total Petroleum Systems and Geologic Assessment of Undiscovered Oil and Gas Resources in the San Juan Basin Province
Wetness >1.0%Wetness <1.0%
–55 –50 –45 –40 –35 –30
13 C CH4δ (PER MIL)
0
2
4
6
8
CO2
(MO
LAR
PERC
ENT)
13 C CH4δ (PER MIL)
–55 –50 –45 –40 –35 –30
CO2 (M
OLA
R PE
RCEN
T) Wetness >1.0%Wetness <1.0%
0
2
4
6
8
Pictured Cliffs SandstoneA
Fruitland FormationB
Figure 8. Crossplot showing relation between gas methane d13C, CO2 content, and gas wetness, where wetness percent = 100 x (1–[mol%C1/∑mol%C1–C5]). Data are from Threlkeld (written commun., 2001). (A) Pictured Cliffs Sandstone; N= 45 samples. (B) Fruitland Formation; N= 68 samples.

Fruitland Total Petroleum System 17
0 5 10 15 20 25 30
WETNESS (PERCENT)
–10,000
–8,000
–6,000
–4,000
–2,000
0
DEP
TH (F
EET)
DEP
TH (F
EET)
0 10 20 30
WETNESS (PERCENT)
–10,000
–8,000
–6,000
–4,000
–2,000
0
Pictured Cliffs SandstoneA
Fruitland FormationB
Figure 9. Crossplot showing relation between gas wetness, where wetness percent = 100 x (1–[mol%C1/∑mol%C1–C5]) and present reservoir depth. Data are from Threlkeld (written commun., 2001). (A) Pictured Cliffs Sandstone; N= 95 samples. (B) Fruitland Formation; N= 85 samples.

18 Total Petroleum Systems and Geologic Assessment of Undiscovered Oil and Gas Resources in the San Juan Basin Province
Source Rock Maturation and Thermal History
The thermal history of the Fruitland coal beds is closely linked to the structural evolution of the basin. During the Late Cretaceous, about 90 Ma (million years before present), the central part of the San Juan Basin began to subside slowly. The Fruitland Formation was deposited in a span of about 1 million years, roughly from 75.5 to 74.5 Ma (Fassett, 2000), during the early stage of basin subsidence. Maximum subsidence in the deepest part of the basin, north of the Colorado-New Mexico State line, occurred during the late Oligocene. During the Mio-cene, the basin axis shifted to the area south of the Colorado-New Mexico State line. Differential uplift, erosion, and thermal cooling throughout the basin followed basin subsidence. Rocks in the San Juan Basin are generally underpressured. The exception to this is an area of overpressuring in the Fruitland Formation, which extends southeastward from the outcrops along the northern rim of the basin. The overpressuring has been attributed to artesian conditions (Scott and Kaiser, 1991; Scott, 1994).
Burial history curves can be used to examine the rela-tion between structural evolution of the basin and thermal maturation of coals for different parts of the basin. Thermal maturation studies (Bond, 1984; Law, 1992) indicate changes in the geothermal gradient in the basin at different periods of geologic time. These changes may occur at different times for different parts of the basin. The highest geothermal gradient was reached in the Oligocene (Bond, 1984). The southernmost burial curve is for the Superior Sealy 1-7 well located in the southern part of the central basin, north of the Chaco slope (figs. 1, 2, and 10A) (Law, 1992) and is peripheral to the deep part of the central basin. In this area, vitrinite reflectance values in the Fruitland are between 0.5- and 0.6-percent Rm; these values are within the early stage of thermal-methane genera-tion from coals (Scott and others, 1994b). Gas produced would likely be wet, containing several percent or more ethane and higher hydrocarbons, in addition to methane, and a gas index (C1/C1–5) less than 0.94 (Rice and others, 1992; Scott and others, 1994b). The burial reconstruction indicates that the Fruitland in this area was buried to a depth of about 4,000 ft, and it stayed at this depth for about 27 m.y. (from 40 to 13 Ma).
Two burial history curves (figs. 2, 10B, and 10C) (Bond, 1984; Law, 1992) from the northern part of the basin (and TPS) show slightly different profiles and hence, structural evolu-tion for the deep part of the basin. The composite curve for the Bakke Southern Ute 2 and Sohio Southern Ute 15-16 wells (fig. 10B) indicates that the area near the present-day axis of the basin continued to subside until the late Miocene. Maxi-mum burial in this area was in the late Miocene (~13 Ma). Although temperature profiles through this well have not been constructed, maximum temperature in the Fruitland, based on mean vitrinite reflectance values between 1.2- and 1.3-percent Rm, would only have been slightly less than those for the north-ern burial reconstruction. The duration of maximum tempera-ture would have been less than for the northern well because maximum burial occurred about 12 million years later. The
Fruitland in this area was at one time buried to depths greater than 6,000 ft; following post-Miocene uplift and erosion, the formation is now found at about 3,000 ft. Vitrinite reflectance values in the area of this well are bounded by the 1.0- and 1.5-percent Rm isoreflectance contours.
Coal beds in this area are within the medium to low volatile bituminous rank and are expected to produce both wet and dry gas. The zone of oil generation is commonly taken to extend from 0.5- to 1.3-percent Rm (Tissot and Welte, 1987), and thus, there is an expectation that most Fruitland gas from this area would be wet. However, the degree of gas wetness might be different for coal-derived gases when compared to gas derived from typical marine organic matter. Scott and others (1994b) suggested that maximum wet-gas generation in coals ceases by a vitrinite reflectance value of 0.8-percent Rm, and secondary cracking of condensate occurs between vitrin-ite reflectance values of 1.0- to 1.35-percent Rm. This well is within the area of overpressuring as defined above, and gas from the overpressured area tends to be dry. The dry nature of the gas in this area can be attributed to two factors:
1. organic matter type, and 2. length of time of high heat history or time-
temperature factors.Fruitland coals are dominantly composed of humic mate-
rial, which primarily produces dry rather than wet gas. It has been well documented that thermal gases become progres-sively drier with increased temperature and thermal maturity of organic matter (Scott, 1994). Any wet gas originally produced in this area may have thermally cracked during prolonged heat-ing through the Miocene, cumulatively producing overall dry gas. Alternatively, Bond (1984) suggested that the high temper-atures reached in Cretaceous rocks from late Eocene through late Oligocene (10- to 15-m.y. duration) were more important to thermal maturation of organic matter than the duration of the heat event in the Miocene, which was geologically short. Bond’s model does not specifically address gas composition changes in coals with temperature or time.
The northernmost burial history curve for the Natomas North America Federal-Texaco 1-11 well (figs. 1 and 10C) (Bond, 1984) indicates that subsidence of the basin in this area ceased in the late Oligocene and that uplift and erosion followed. The top of the Pictured Cliffs can be used as a proxy for the base of the Fruitland in this well. The burial reconstruc-tion indicates that the top of the Pictured Cliffs may have been buried more than 8,000 ft. Assuming the reconstruction is accu-rate, it suggests that the deep part of the San Juan Basin was at one time north of the present-day basin axis and that the axis of the basin shifted to the south as the northern part of the basin was uplifted. This shift may partially explain the high vitrinite reflectance values (>1.5-percent Rm) in the area of this well.
The area of the Natomas North America Federal-Texaco 1-11 well also coincides with a northwest–southeast trend of high Rm values in the Fruitland (fig. 1) (Law, 1992; Fassett, 2000). The localized higher Rm values along this trend are indicative of locally higher heat flow. Magnetic data does not indicate the presence of buried intrusions in the

Fruitland Total Petroleum System 19
9,000
8,000
7,000
6,000
5,000
4,000
3,000
2,000
1,000
0
100 90 80 70 60 50 40 30 20 10 0
2,500
2,000
1,500
1,000
500
0CRETACEOUS
PALEOCENE
EOCENE
OLIGOCENE
MIOCENE
PLIOCENE
DEP
TH (M
ETER
S)
DEP
TH (F
EET)
TIME (MYA)
Ps
San Jose
Nacimiento
KirtlandFruitland
Pictured Cliffs
Lewis
Cliff House
Menefee
Mancos
TocitoJuana LopezLower Mancos
Dakota
Bridge Creek Graneros
Point Lookout
Figure 10A. Burial history curve for the Superior Sealy 1-7 well in the southern part of the central San Juan Basin (modified from Law, 1992). Geologic time scale is from the Geological Society of America web page http://www.geosociety.org/science/timescale/timescl.htm, last accessed 2/1/2008. Ps, Pleistocene; MYA, million years ago.

20 Total Petroleum Systems and Geologic Assessment of Undiscovered Oil and Gas Resources in the San Juan Basin Province
Figure 10B. Composite burial history curve for the Bakke Southern Ute 2-Sohio Southern Ute 15-16 well in the northern part of the central San Juan Basin (modified from Law, 1992). Geologic time scale is from the Geological Society of America web page http://www.geosociety.org/science/timescale/timescl.htm, last accessed 2/1/2008. Ps, Pleistocene; MYA, million years ago.
12,000100 90 80 70 60 50 40 30 20 10 0
3,500
3,000
2,500
2,000
1,500
1,000
500
00
2,000
4,000
6,000
8,000
10,000
DEPT
H (M
ETER
S)
DEPT
H (F
EET)
TIME (MYA)
CRETACEOUS
PALEOCENE
EOCENE
OLIGOCENE
MIOCENE
PLIOCENE
Ps
Volcanic rocks
San Jose
Animas
KirtlandFruitlandPictured Cliffs
Lewis
Men
efee
Poin
t Loo
kout
Brid
ge C
reek
Upper MancosLower Mancos
Dakota
Graneros

Fruitland Total Petroleum System 21
16,000
020406080100
0
1
2
3
4
14,000
12,000
10,000
8,000
6,000
4,000
2,000
30 C
50 C
DEPT
H (F
EET)
GREENHORN
DEPT
H (K
ILOM
ETER
S)
100 C
DAKOTA
200
C
150
CNIOBRARA
MENEFEE
PICTURED CLIFFS
TIME (MYA)
TOP
OIL
WIN
DOW
TOP
WET
GAS
WIN
DOW
WIN
DOW
TOP
DRY
GAS
250
C
CRETACEOUS
PALEOCENE
EOCENE
OLIGOCENE
MIOCENE
PLIOCENE
LATEEARLY
Ps
Figure 10C. Burial history curve for the Natomas North America 1-11 Federal-Texaco 1-11 well in the northern part of the San Juan Basin (modified from Bond, 1984). Geologic time scale is from the Geological Society of America web page http://www.geosociety.org/science/timescale/timescl.htm, last accessed 2/1/2008. Ps, Pleistocene; MYA, million years ago.

22 Total Petroleum Systems and Geologic Assessment of Undiscovered Oil and Gas Resources in the San Juan Basin Province
area (Fassett, 2000); thus, the higher heat flow is not related to intrusive activity but is most likely a reflection of depth of burial accompanied by a higher geothermal gradient. The northwest–southeast trend of high Rm values may reflect the former position of the axis of the basin (Fassett, 2000) before it shifted to the south in the Miocene as the northern part of the basin was uplifted. The area of the present-day structural axis of the basin (fig. 6) is determined from structure contours drawn on the top of the Huerfanito Bentonite Bed (Fassett, 2000) and represents the deepest part of the San Juan Basin during the Miocene (see burial history curve, fig. 10B).
Fruitland Formation Hydrology
Pressure Regimes in the Fruitland Formation
The area of overpressure in the Fruitland Formation is found throughout most of Colorado and extreme northern New Mexico where the Fruitland is preserved (Kaiser and others, 1994; Scott and others, 1994b, their fig. 4). The overpressure is considered to be a result of artesian conditions (piston flow) that developed from the Pliocene to the present (Oldacker, 1991; Scott and others, 1994b; Cox and others, 2001). Over-pressuring under artesian conditions results when pressure in a formation, as a consequence of downward confined flow of water, rises above hydrostatic pressure for the formation at any given location (Scott and others, 1994b). When this happens, the hydraulic head rises above the land surface. It is important to determine when initial overpressure conditions were estab-lished because once these conditions (assuming no overpres-sure is a remnant of thermal-gas generation) were established along the southern part of the overpressure boundary, the younger water can displace older water efficiently only if there is leakage of pressure. The system acts like a giant piston. When pushing more water in at the updip end, this water can only migrate downdip if there are pressure leaks in the system.
If there are no leaks or if leakage is slow in the south-ern part of the overpressured system, the updip water cannot migrate very far or fast. If there are few pressure leaks, the waters can only mix slowly by diffusion. Understanding this scenario is important when evaluating the model of timing of generation of late-stage microbial gas and hence its contribu-tion to Fruitland gas production.
The overpressure conditions observed today are super-imposed on past geologic conditions, such as basin subsid-ence and tectonism, thermal maturity, coal composition, and geohydrology that initially influenced the generation and composition of coal-bed gas. The overpressuring is apparently unrelated to thermal-gas production (Scott and others, 1994b). In the geologic model presented herein and by others, most of the thermally derived coal-bed gas probably ceased forming after the early late Miocene. Generation of thermal gas may have ceased somewhat earlier north and south of the area of the present-day basin structural axis, which achieved its cur-rent configuration in the Miocene.
Meteoric Water Incursion
Water produced from the Fruitland Formation probably is of various ages. Concepts of fluid flow and distribution of stable isotopes of water in sedimentary basins suggests that the oldest post-depositional meteoric water would reside at the distal ends of the flow paths (Fritz and Fontes, 1980; Criss, 1999; Cox and others, 2001). Mixing of connate water and younger water has occurred along the flow paths. It has been proposed that meteoric waters entering the Fruitland would be younger than the period of maximum thermal-gas generation (Kaiser and Ayers, 1994; Kaiser and others, 1994; Scott and others, 1994b). The principal role of groundwater flow would be to
1. redistribute any gas that might be carried in solution; 2. affect the amount of water produced at any
particular well; 3. permit the generation of younger microbial gas by
CO2 reduction, as a consequence of the introduction of methane-producing bacteria; and
4. possibly destroy existing gas because of oxidation of methane by certain bacteria.
The rate of groundwater flow through the now overpressured area would be influenced by
1. the distribution of facies (that is geometry of coal, shale, and sandstone at any depth);
2. the development and direction of cleats and faults, which serve as the principal conduits for fluid movement;
3. the rate of pressure leakage as a consequence of discharge of water or vertical migration of fluids through faults; and
4. the regional distribution of Fruitland outcrops, throughout geologic time, as younger formations were eroded from the area of the northern part of the San Juan Basin.
In the latter case, the outcrop area that has received mete-oric water recharge has been reduced through erosion to its present-day configuration.
The areal extent of the Fruitland Formation affected by the post-deposition introduction of meteoric water can be partly observed in the regional distribution of d18O (fig. 11) and dD (deuterium) of produced waters (Cox and others, 2001; Snyder and others, 2003). The area studied corresponds approximately, but not entirely, with the area of artesian overpressure (fig. 12). Note that the inferred direction of meteoric flow, based on d18O isotopes of –16 to –13 per mil in the produced water (fig. 11), and the areal distribution of overpressure and underpressure (fig. 12) have different orientations. The overpressure area has a dominant southeast orientation in the northeastern part of the TPS, whereas in the same area, meteoric water flow is north–south, coincident with the modern drainage of the Los Pinos River (fig. 11). The maps showing d18O and dD distribution (Cox and others, 2001; Snyder and others, 2003) are not contoured on a single

Fruitland Total Petroleum System 23
horizon and therefore only provide a general picture of relative groundwater movement in the Fruitland (an important point when considering rates and times of fluid movement, timing of overpressure, and generation of late-stage microbial gas). Cox and others (2001) suggested that the distribution of the d18O isotope (fig. 11) in the produced water is related to incursion of meteoric water and that little rock-water interaction, which would alter the d18O values, has occurred. The distribution and shifts in the corresponding dD values were also considered to reflect the incursion of meteoric water, except that some sample values reflect the exchange in deuterium isotopes between the water and the coal-derived methane (Kaiser and others, 1994; Cox and others, 2001).
In the northern part of the San Juan Basin, the regional distribution of the d18O in waters produced from the Fruitland Formation (fig. 11) indicates three areas of southerly, south-easterly, and southwesterly directed flow paths of isotopically light water (–16 to –13 per mil d18O) (Cox and others, 2001). The eastern path is elongate north–south and is subparallel in part to
1. the Spring Creek anticline, a south to southeasterly plunging anticline (Harr, 1988, his fig. 3), and
2. the unnamed southeast plunging syncline that sepa-rates Spring Creek and Ignacio anticlines and the course of Los Pinos River (fig. 11).
The distribution of d18O isotopes of the middle flow path, which trends east to southeast, appears to be influenced, at least in part, by the position of the Ignacio anticline, an east- to southeast-trending structure in Colorado, and in part by the Bondad anticline (fig. 11), an east- to southwest-trending anticline (Harr, 1988, his fig. 3). The distribution of d18O iso-topes of the western flow path has a general south to southwest trend and tends to be subparallel to the courses of the Ani-mas and Florida Rivers (fig. 11) and also to a south-plunging structural low on top of the Mancos Shale (Harr, 1988, his fig. 3). Although it has been suggested that the flow of water in the Fruitland Formation corresponds to the presently defined potentiometric surfaces (fig. 12), it appears that the flow paths, as defined by d18O isotopes of Fruitland produced waters, may be influenced by the position of major subsurface folds in the Fruitland and by the position of several rivers, which may also be controlled by subsurface folds and faults.
The distribution of d18O in produced waters does not reflect the thermal maturation of the Fruitland or the present-day structural configuration of the basin, except superficially in the area of northern New Mexico, just south of the Colo-rado-New Mexico State line. In this area, the trend of d18O values are subparallel to the vitrinite reflectance isotherms and structure contours and coincide with part of the present-day basin axis (fig. 11). Fruitland waters, in this area, have d18O values between –8 and –5 per mil (Cox and others, 2001), and one Fruitland well south of the water-isotope study area has a d18O value of –5.7 per mil (Ridgley, unpub. data, 2001), thus indicating that some Fruitland waters are isotopically heavier south of the Colorado-New Mexico State line. These isotopi-cally heavier waters are probably older than the isotopically
lighter waters to the north, although the relative age difference between these waters is unknown (Cox and others, 2001). The pattern of isotopically heavier waters (–8 per mil d18O and heavier) may be closer to the original distribution of d18O in the Fruitland and therefore represent “relict” connate forma-tion waters. This interpretation is based on the pattern of waters lighter than –8 per mil to waters heavier than this. Isotopically light waters appear to “cut into” or overlap isotopically heavy waters (fig. 11), especially in the eastern part of the TPS.
Isotopically light waters (lighter than –8 per mil d18O) represent meteoric and mixed meteoric and connate forma-tion water. The isotopic distribution of the water reflects multiple periods of incursion of meteoric water (Kaiser and others, 1994) related to erosion of the Fruitland and younger formations both coincident with and outside the present boundary of the Fruitland outcrop and the present-day San Juan Basin. These multiple incursions, which are interpreted from the overlapping or superimposed d18O distributions, have obscured the original distribution of d18O in Fruitland Formation waters, leaving behind, in some areas, “lenses” of older formation waters. Although piston flow may have been important early in the history of the influx of meteoric water, the present isotopic pattern suggests that diffusion and mixing may be more important today because water cannot escape rapidly downdip from the basin margin.
Relation of Groundwater Flow to Thermal History
With deepening of the basin during the Oligocene and Miocene, it is possible that groundwater flow through the Fruitland could have been from both the north and south or may have ceased in the northern part of the basin due to deeper burial and extensive overburden. Reconstruction of the timing of erosion of the Fruitland to its present configura-tion is important because it constrains fluid movement in the Fruitland and bears on the issue of timing of microbial-gas generation (whether pre- or post-thermal-gas generation). Because most strata younger than the Mesaverde Group are absent from the area south of the central basin (figs. 1 and 2), reconstruction of the potentiometric surfaces throughout geo-logic time has uncertainty.
From the late Oligocene to the present, the basin has been differentially uplifted and eroded, and thermal cooling has occurred. Present temperatures in the Fruitland are gener-ally below 60°C based on bottom-hole temperatures of wells completed in the Fruitland. Erosion of sediments overlying the Fruitland around the northern and western margins of the basin in Colorado and New Mexico allowed the introduction of meteoric water, which has southerly, southwesterly, and southeasterly flow paths as determined by the potentiometric map of the area (fig. 12) (Oldaker, 1991; Scott and others, 1994b; Kaiser and others, 1994) and by the regional distribu-tion of d18O of waters produced from the Fruitland Formation (fig. 11) (Cox and others, 2001).
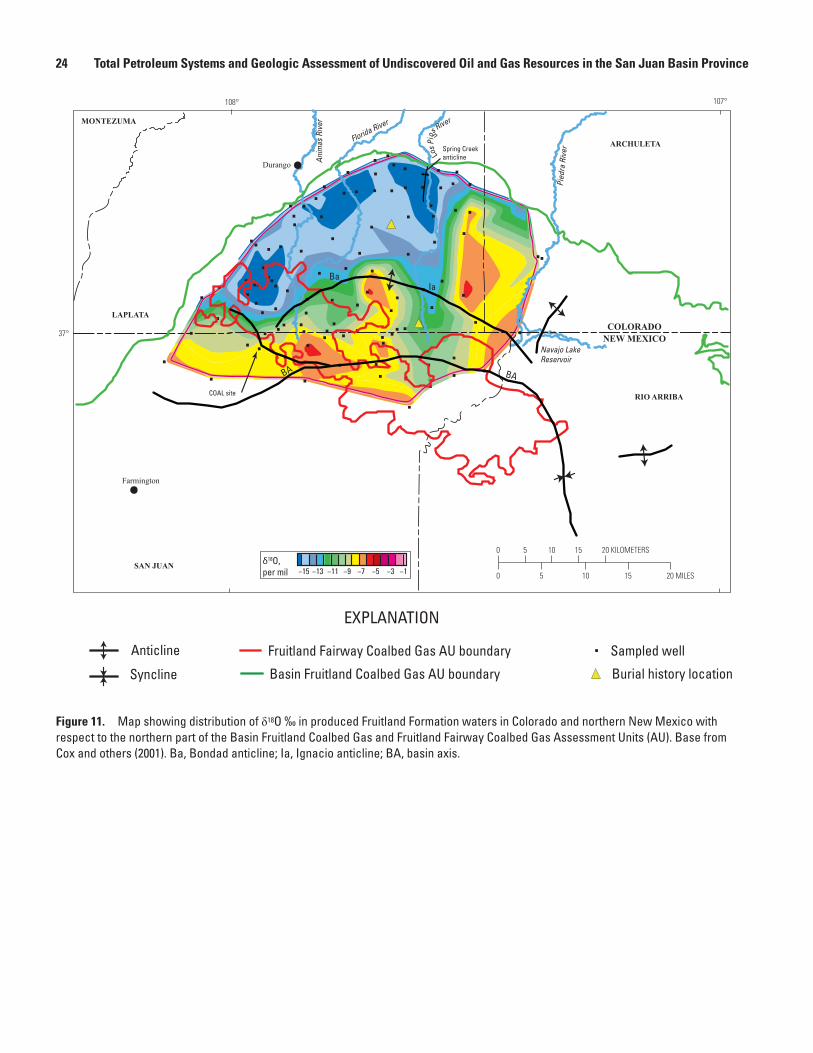
24 Total Petroleum Systems and Geologic Assessment of Undiscovered Oil and Gas Resources in the San Juan Basin Province
Figure 11. Map showing distribution of δ18O ‰ in produced Fruitland Formation waters in Colorado and northern New Mexico with respect to the northern part of the Basin Fruitland Coalbed Gas and Fruitland Fairway Coalbed Gas Assessment Units (AU). Base from Cox and others (2001). Ba, Bondad anticline; Ia, Ignacio anticline; BA, basin axis.
SAN JUAN
RIO ARRIBA
LAPLATA
ARCHULETA
MONTEZUMA
COLORADONEW MEXICO
δ18O,per mil
BaIa
COAL site
−15 −13 −11 −9 −7 −5 −3 −1
Fruitland Fairway Coalbed Gas AU boundary
Durango
Farmington
Spring Creekanticline
0 5 10 15 20 MILES
0 20 KILOMETERS5 10 15
37°
108° 107°
Anticline
Syncline
EXPLANATION
Burial history locationBasin Fruitland Coalbed Gas AU boundary
BA
Sampled well
BA
Ani
mas
Riv
er
Florida River
Los
Pi
nos
River
Pied
ra R
iver
Navajo LakeReservoir

Fruitland Total Petroleum System 25
The present structural axis of the basin (fig. 6) in New Mexico crosses isoreflectance contours ranging from 0.9-percent Rm on the west to 1.2-percent Rm on the east. In this area, the Fruitland presently is found at depths ranging from 2,500–3,500 ft and is most deeply buried in the western part. Uncorrected bottom-hole temperatures for wells com-pleted in the Fruitland Formation or underlying Pictured Cliffs Sandstone range from 36° to 50°C. This temperature range is irregularly distributed throughout the area of the structural axis of the basin. Stable isotopes of produced water are not available along the complete length of the basin axis in New Mexico, but where available, the d18O values range from –10 to –7 per mil (fig. 11). The isotopically heavier water is found along the western and extreme eastern parts of the basin axis. An area of isotopically lighter water, d18O values of –10 to –9 per mil, is found in between where it occurs at the southern terminus of north to south overlapping flow paths of younger water. These flow paths appear to be controlled, at least in part, by the position of the Los Pinos River (fig. 11).
North of the structural axis of the basin, uncorrected bottom-hole temperatures for wells completed in the Fruit-land range from 35°–60°C. Temperatures vary throughout the area and may be related to local structures. The highest temperatures are found just north of the Bondad anticline (fig. 11) and in the vicinity of a southeast-plunging syncline, which is mapped at the top of the Mancos Shale (Harr, 1988, his fig. 3). The western part of this syncline is associated with an east- to southeast-plunging plume of water whose oxygen isotopes are depleted to the west (d18O values of –14.9 per mil) and become more enriched to the south and southeast (d18O values of –6.5 to –8.0 per mil) (fig. 11) (Colorado Oil and Gas Commission, 1999a). There does not appear to be a good correlation between temperature and d18O values along this trend, implying that the temperatures are residual from earlier geologic thermal events and are not influenced by the introduction of post-depositional meteoric water.
Chloride concentrations and total dissolved solids (tds) content of the produced water within this plume vary directly with the enrichment of d18O values in the water and both become enriched to the south and southeast (Colorado Oil and Gas Commission, 1999a), although they only reach a maximum of 1940 mg/L. The highest tds concentration in the waters (10,261–10,864 mg/L) occurs along the east and south-east margins of the plume. The high tds content and relatively low chloride content implies that the waters are not sodium chloride type. Rather, like most of the Fruitland waters, the waters are probably sodium-bicarbonate waters with some percent of chloride.
Water Inorganic Compositions
Further evidence for incursion of meteoric water and mixed meteoric-connate water is the distribution of cation and anion concentrations, principally sodium, chloride, and bicarbonate. Only a few analyses of Fruitland water chemical composition have been published (Kaiser and others, 1994). In the northern part of the basin, in the overpressured area,
sodium, chloride, and bicarbonate concentrations increase from north to south along inferred flow paths (Kaiser and others, 1994, their fig. 8.13). The highest concentrations of sodium, chloride, and bicarbonate occur south of the Fruitland Fairway AU in the transition zone between overpressured (greater than 0.433 psi/ft) and underpressured areas (fig. 12) (Kaiser and others, 1994; Scott, 1994). Analyses of water samples from the southern part of the Basin Fruitland CBG AU (Kaiser and others, 1994; Threlkeld, written commun., 2001) indicate an increase in sodium, chloride, and bicarbon-ate concentrations from south to north toward the transition zone. The transition zone is a hydrogeochemical boundary (Kaiser and others, 1994) and is also an area of regional facies changes in coal that coincides with a change in potentiometric surface and pressure.
Although the data set of published chemical analyses of Fruitland Formation waters is small, the fact that the waters with the highest sodium, chloride, and bicarbonate concen-trations are found in the transition zone between overpres-sured and underpressured areas and in the northern part of the underpressured area suggests that Fruitland waters over a broader area may have at one time been characterized by high sodium and bicarbonate concentrations and relatively high chloride concentrations and that these concentrations have been modified by post-depositional influx of meteoric waters from the north and south. The time of these influxes is unknown. Thus, the transition zone may be viewed either as a zone of convergent waters that have migrated from south to north and from north to south, or as a zone of preservation of nearly connate waters.
Water Dating
It is not possible to date waters using d18O and dD values. It is only possible to discuss relative age difference between water masses using these data. A crossplot of d18O and dD values from Fruitland waters (Kaiser and others, 1994; Cox and others, 2001; Snyder and others, 2003) shows that the data points cluster around the global meteoric line, implying that the waters are dominantly of meteoric origin. This would be expected because original depositional envi-ronments of the Fruitland were dominantly fluvial; coals were deposited in swamps located landward of the coast in the alluvial plain, lower and upper delta plain, and coastal plain environments (Fassett and Hinds, 1971; Ambrose and Ayers, 1994; Ayers and Zellers, 1994; Fassett, 2000). Although a truly marine water signature of these waters would not be expected, a brackish water signature might be expected for coals deposited in proximity to the coast. Shifts in deute-rium values were attributed to hydrogen exchange between methane and water. Slight shifts from the global meteoric water line in the oxygen values were attributed to influx of slightly evaporated meteoric water. Two data points from a limited data set of oxygen and deuterium stable-isotope analysis (Kaiser and others, 1994) are isotopically similar to those in waters from the Paleocene Ojo Alamo Sandstone

26 Total Petroleum Systems and Geologic Assessment of Undiscovered Oil and Gas Resources in the San Juan Basin Province
EXPLANATION
MCKINLEY
SANDOVALSAN JUAN
RIO ARRIBA
MONTEZUMA
LAPLATA
ARCHULETA
COLORADO
NEW MEXICO
Durango
Farmington
0 5 10 15 20 MILES
0 20 KILOMETERS5 10 15
36°
37°
108° 107°
Basin Fruitland Coalbed Gas Assessment Unit
> 0.50
Pressure gradient (psi/ft)
0.55 – 0.44< 0.44
Fruitland Fairway Coalbed GasAssessment Unit
Modern-day groundwater flow path
Figure 12. Map showing pressure regimes in the Fruitland Formation and inferred directions of groundwater flow based on potentiometric surfaces. Yellow, significant overpressure; light blue, normal to slight overpressure; light tan, underpressure. Modified from Scott and others (1994b).

Fruitland Total Petroleum System 27
and Nacimiento Formation (Phillips and others, 1986); it has been suggested that these waters are Holocene age. The two Fruitland data points are from the southern part of the basin. Otherwise, dates of the Fruitland waters are conjectural (Cox and others, 2001) and are based on the erosional history of the Fruitland and the time periods when meteoric water could have been introduced.
The best ways to date Fruitland waters is with 36Cl isotope and 129I/I isotope, although 14C may be used if the waters are less than about 50,000 years old (Martini and oth-ers, 1998). 36Cl has a half-life of 300,000 years (Nolte and others, 1991) and thus can be used to date waters to about 2 million years in age (about the beginning of the Pleistocene). 129I/I isotope has a half-life of 15.7 million years and can possibly date waters between 80 and 100 million years old. Although these dating techniques have been used to date formation waters with varying success, a question remains on how reliable this technique is in dating waters in active groundwater flow systems and where multiple mixing events have occurred in the geologic past. Dating waters using the ratio 129I/I is reviewed in Fabryka-Martin and others (1985), Fehn and others (1992), Moran and others (1995), Moran (1996), and Moran and others (1998).
The only published date for Fruitland waters is a 14C age of 33,176 years (late Pleistocene) for carbon as dissolved bicarbonate in formation water (Mavor and others, 1991 as cited in Kaiser and others, 1994) at the COAL (Comple-tion Optimization and Assessment Laboratory) site (fig. 11). This age is much younger than an uncorrected 4 + Ma age (amount of error not stated) implied by 129I/I isotopes in a well to the northwest (in more d18O-depleted water of –14 per mil) or an uncorrected 20+ Ma age (amount of error not stated) implied by 129I/I isotopes in a well to the northeast (in more d18O-enriched water of –9 per mil) (Colorado Oil and Gas Commission, 1999b). The oxygen isotope of this water is unknown, but it appears to lie near the –9 per mil value (fig. 11). In a limited study, uncorrected 129I/I isotope ages of Fruitland waters in Colorado ranged from 4–45 Ma (plus or minus some error that was not stated) (Colorado Oil and Gas Commission, 1999b). With the exception of two points, which were thought to be in an area of faulting, the uncorrected 129I/I isotope ages varied directly with the d18O values; the older ages were associated with isotopically enriched waters. In an active groundwater flow system, this scenario would be expected, that is d18O-depleted water, which occurs updip and closer to the outcrop and present and past recharge areas, should be relatively younger than water found downdip.
In a recent comprehensive study designed to date Fruitland Formation waters in Colorado using 36Cl and 129I, geologically young water was found in close proximity to the outcrop and older water was found in the central part of the coal-gas producing area (Snyder and others, 2003). Three sets of water ages were determined including:
1. those with an anthropogenic (modern) signature,
2. those showing various ages reflecting different degrees of iodine enrichment and water mixing (dilution), and
3. those with an apparent modern signature due to increased levels of fissogenic 129I, but whose mini-mum age is much older.
Samples that fall in the latter category are mostly found in the area along the Colorado-New Mexico State line.
When corrected for the addition of fissiogenic 129I, some of the waters in the central part of the study area yield cor-rected ages between 70 and 75 Ma, which is near the age of deposition of the Fruitland. Waters dated using 36Cl showed two distributions:
1. those with ages less than 2 million years, which were found within 5 km of the outcrop, and
2. those in the central part of the gas-producing area that were below the detection limit of the accelerator mass spectrometer (36Cl/Cl of 1 × 10–15) (Snyder and others, 2003).
Minimum ages of Fruitland waters, using 129I/I, ranged from 5–57 Ma, with the oldest ages occurring in the basin center (Snyder and others, 2003). Uncertainties of minimum 129I/I ages ranged from 1–10 m.y.; however, most analyses have an error range of 1–5 m.y. When the 129I/I minimum dates (Snyder and others, 2003, their table 1) are plotted on a map showing the regional distribution of d18O in produced Fruitland waters, the resulting pattern is not what would be expected if the d18O was related to Pliocene and younger flow (fig. 13). Instead, except for very young water (post-nuclear testing, which produces an anthropogenic signature), the youngest dated water in the northern part of the basin is Oligocene. Most of the data points in this part of the basin have Eocene or Paleocene ages. The youngest dated waters, exclusive of those that have apparent modern ages, are found throughout the areas of the Fruitland Fairway where the coal beds are thicker. Several waters in this latter area yield minimum 129I ages of Miocene, Oligocene, and Pliocene (1 data point). This pattern of apparently young waters occur-ring south of apparently older waters can be interpreted in several ways:
1. water migrated from south to north in Oligocene and later time and was trapped in the area of thick coal where the orientation of coal beds changed from northeast–southwest to northwest–southeast;
2. water flow may have been focused upward in the area of the Fruitland Fairway in the Oligocene and Miocene, thus possibly enriching gas resources there (Scott and others, 1994b); and
3. the apparent young waters may be geologically older if ages are corrected for an increased fissiogenic iodine component (Snyder and others, 2003).
If the distribution of minimum 129I ages is valid, then the d18O distribution in the produced water might actually reflect Miocene and older hydrologic events, except near the north-ern and western basin margins. These data have important

28 Total Petroleum Systems and Geologic Assessment of Undiscovered Oil and Gas Resources in the San Juan Basin Province
implications for hydrologic modeling of the Fruitland and are not in agreement with hydrologic models that propose basin-wide migration of younger water through the Fruit-land (Kaiser and others, 1994; Cox and others, 2001). Some of the apparent differences may simply reflect differences in scale, regional flow modeling versus point location of geochemical data (which could represent areas by-passed by regional flow), as well as differences in depth for observed or inferred parameters.
The age discrepancy of the Fruitland waters points to the uncertainty in determining the timing of influx meteoric water, and hence to the generation of late-stage microbial gas and its ultimate contribution to gas resources. If recharge waters infiltrated the Fruitland during the late Miocene and Pliocene as the basin was uplifted and eroded, as has been suggested (Scott and others, 1994b), they would have been cool (lighter stable isotopes). These cool waters would have mixed with hot formation waters of 70°–100°C (heavier stable isotopes). Any methane-producing bacteria introduced with these recharge waters probably could survive at these temperatures, but they might not generate much bacterial gas until the formation temperature cooled to less than 50°–60°C in the Pleistocene. Optimal temperatures for bacterial gas generation of about 45°C were achieved relatively recently based on one burial history reconstruction (fig. 10C), and thus help constrain the length of time for late-stage microbial-gas generation.
Carbon Isotopes of Dissolved Inorganic Carbon in Produced Waters
Published d13C analyses for carbon of total dissolved carbon (DIC) in produced waters are too few to determine regional trends (fig. 14) (Scott and others, 1994b). Heavy d13C values of DIC are found in the underpressured, transi-tional pressured, and overpressured parts of the Fruitland For-mation and are usually associated with microbial-gas genera-tion. The lighter values are found closer to the outcrop, and it has been suggested (Kaiser and others, 1994) that these values represent a greater mixture of isotopically light thermogenic CO2 or CO2 formed in soils with isotopically heavier CO2 formed as a result of degradation of organic acids and reduc-tion of CO2 by methanogenic bacteria. These values could also be interpreted as a mixture of microbial gas and thermogenic CO2 that formed at various stages of carbon fractionation. All the reported d13C values of the DIC are heavy and suggest present or past contribution from microbial-gas generation, by the CO2-reduction pathway. The d13C values of the DIC may have formed at different times depending whether the chemi-cal system has been open or closed as well as on the past and present formation hydrodynamics.
Fruitland Formation Gas
Gas Chemistry
Can a knowledge of the past groundwater and thermal histories be used to evaluate the present distribution of gas and produced-water compositions and to evaluate the relative contribution of microbial gas and thermal gas to total gas pro-duced? Can these data be used more effectively to determine the relative gas richness of an area, which ultimately affects the potential resources assigned to an area? As discussed below, these data can lead to interpretations that are modifica-tions of the prevailing models, and they support the current assessment divisions of the Fruitland used in this study.
Comprehensive studies of the gas chemistry of the Fruitland Formation indicate major compositional differ-ences between the overpressured, transitional pressured, and underpressured areas (table 3) (Rice, 1983; Scott, 1994; Scott and others, 1994a,b). Gases from the Fruitland in the overpres-sured area are generally dry (C1/SC1–5>0.97) and contain up to 26.4-percent (mean of 6.5) CO2 and various amounts of nitro-gen (Scott and others, 1994b). In the underpressured areas, gases are generally wet (C1/SC1–5<0.94), contain less than 2-percent (mean of 0.9) CO2, and contain various amounts of nitrogen (Scott and others, 1994b). Gases from the transition zone have chemical analyses that fall between the two end members. There are exceptions (high and low values) to the general gas composition for each area (Scott, 1994).
Distribution of Gas Wetness
Gas produced from the region of the Fruitland that is bounded by the >0.8-percent Rm isoreflectance contours is dry, except for a few areas where C1/SC1–5<0.94 (fig. 15) (Scott, 1994, his pl. 1). The onset of intense thermogenic gas generation is considered to occur between vitrinite reflectance values 0.8–1.0 percent Rm and wet-gas generation between 0.5–0.8 percent Rm (Tissot and Welte, 1987; Scott, 1994, his table 2). Cracking of condensate to methane occurs between vitrinite reflectance values 1.0–1.35 percent Rm and maximum generation of thermogenic methane between 1.20–2.0 percent Rm (Tissot and Welte, 1987; Scott, 1994, his table 2). Maxi-mum measured vitrinite values in the Fruitland are less than 1.7 (Fassett, 2000, his fig. 37). Thus, the overall pattern of gas composition (in terms of dryness) in the Fruitland (Scott, 1994, his pl. 1) can be explained by the thermal maturity (perhaps coupled with change in organic matter type) of the Fruitland Formation, given sufficient geologic time at these temperature conditions. Scott and others (1994b) suggested that a compositional gas gradient would be expected from 0.8- to 1.35-percent Rm, and the lack of this gradient was evi-dence of the gas being a mixture of thermogenic and late-stage microbial gas. However, the original gas wetness (C1/SC1–5) data was contoured at 0.9, 0.94, and 0.97 intervals (Scott, 1994), and thus the broad intervals chosen may actually have obscured any finer regional trends to the compositional data.

Fruitland Total Petroleum System 29
SAN JUAN
RIO ARRIBA
LAPLATA
MONTEZUMA
ARCHULETA
COLORADONEW MEXICO
δ18O,per mil −15 −13 −11 −9 −7 −5 −3 −1
Fruitland Fairway Coalbed Gas AU boundary
Farmington
Durango
0 5 10 15 20 MILES
0 20 KILOMETERS5 10 15
37°
108° 107°
EXPLANATION
Basin Fruitland Coalbed Gas AU boundary
0–1.8 Ma(Modern–Pleistocene)
1.8–5.3 Ma(Pliocene)
5.3–23.8 Ma(Miocene)
23.8–33.7 Ma(Oliogene)
33.7–55.5 Ma(Eocene)
(Paleocene)55.5–65 Ma
Anim
as R
iver
Florida River
Los
Pino
s River
Pied
ra R
iver
Navajo LakeReservoir
Figure 13. Map showing relation between minimum 129I/I ages and distribution of d18O ‰ in produced Fruitland Formation waters in Colorado and northern New Mexico in the San Juan Basin. Iodine ages from Snyder and others (2003). Base from Cox and others (2001). AU, Assessment Unit; Ma, million years before present.
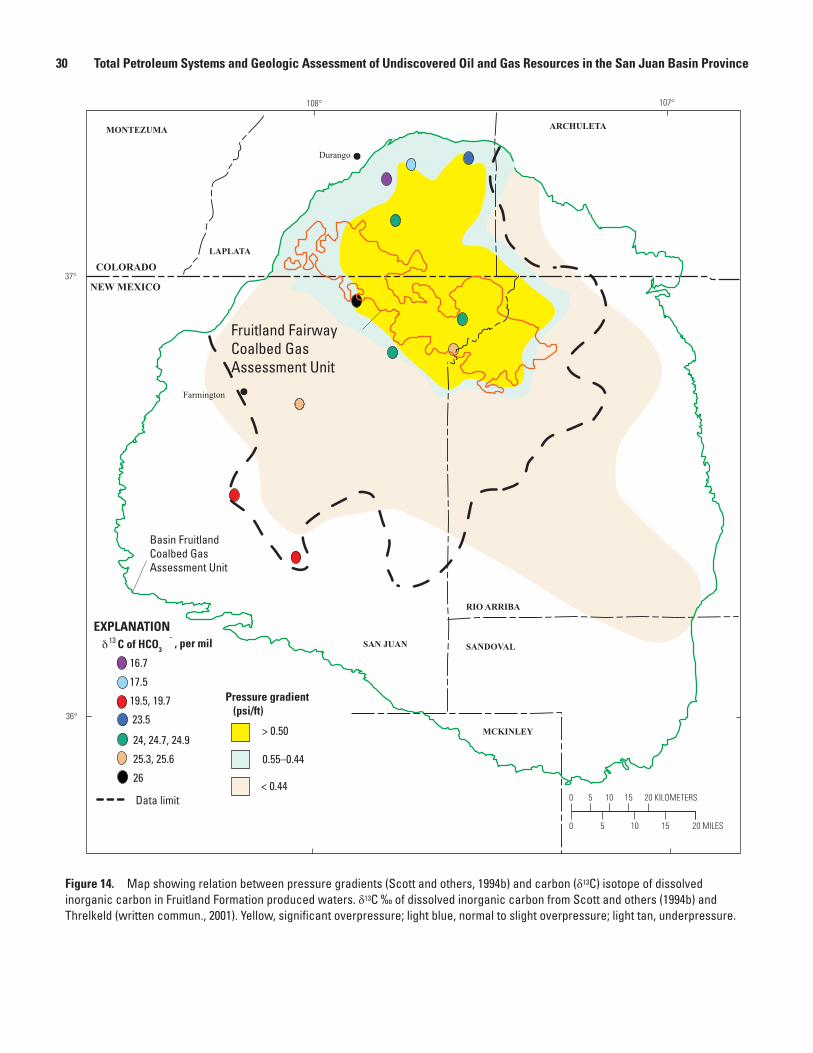
30 Total Petroleum Systems and Geologic Assessment of Undiscovered Oil and Gas Resources in the San Juan Basin Province
EXPLANATIONδ C of HCO3
13 -, per mil
Data limit
MCKINLEY
SANDOVALSAN JUAN
RIO ARRIBA
MONTEZUMA
LAPLATA
ARCHULETA
COLORADO
NEW MEXICO
Durango
Farmington
16.7
17.5
19.5, 19.7
23.5
24, 24.7, 24.9
25.3, 25.6
26
0 5 10 15 20 MILES
0 20 KILOMETERS5 10 15
Basin Fruitland Coalbed Gas Assessment Unit
> 0.50
Pressure gradient (psi/ft)
0.55–0.44
< 0.44
Fruitland Fairway Coalbed Gas Assessment Unit
36°
37°
108° 107°
Figure 14. Map showing relation between pressure gradients (Scott and others, 1994b) and carbon (δ13C) isotope of dissolved inorganic carbon in Fruitland Formation produced waters. δ13C ‰ of dissolved inorganic carbon from Scott and others (1994b) and Threlkeld (written commun., 2001). Yellow, significant overpressure; light blue, normal to slight overpressure; light tan, underpressure.

Fruitland Total Petroleum System 31
Although there has probably been some mixing of thermo-genic gas with late-stage microbial gas, the pattern of gas composition may simply reflect changes in thermal maturity of the organic matter over geologic time, or it might also reflect mixing of early microbial gas with a later thermal gas.
One exception to the regional pattern of gas composi-tion is an area of dry gas in the southwestern part of the Basin Fruitland CBG AU (fig. 15). In this area, the Fruitland gas is considered to be a mixture of microbial and thermogenic gas (Rice, 1983; Scott and others, 1994b). Another exception is an area along the east side of the Basin Fruitland CBG AU in northwestern Rio Arriba County (figs. 12 and 15) where intermediate and wet gases characteristic of the transition and underpressured areas have been documented. In this area, the gas composition does not appear to be related to the thermal maturity of the Fruitland (Scott, 1994, his pl. 1; Scott and oth-ers, 1994b) in that the compositions do not appear to conform to vitrinite isoreflectance contours. However, there are no vitrinite data reported for this area that would determine the actual shape of the isoreflectance contours. Isoreflectance con-tours just to the north appear to reflect the position of the south-east extension of the Ignacio anticline as well as the position of the axis of the San Juan Basin (Scott, 1994; Fassett, 2000) before it shifted to the south in the Miocene. In Colorado, on the east side of the overpressured area, there are too few gas and vitrinite analyses to determine the position of isoreflectance contours or the position of the dry-wet gas boundary (Scott, 1994; Scott and others, 1994b; Fassett, 2000).
The pattern of chemically wet and dry gas in the Fruit-land is not only affected by thermal maturity of the Fruitland but also by maceral type and possibly basin hydrology (Scott, 1994; Scott and other, 1994b). Wet gas, which is now confined primarily to the southern part of the Basin Fruitland CBG AU, is produced primarily from older Fruitland coal beds, whereas in the northern part of the Basin Fruitland CBG AU gas is produced from coals stratigraphically younger in the formation. This relative change in stratigraphic age might be accompanied by slight differences in maceral type, and hence, this could influence the type of hydrocarbons produced. Too few stud-ies have been conducted on Fruitland maceral composition to determine whether maceral type changes significantly areally within the Fruitland (Fassett, 2000). A change in maceral composition accompanied by variable thermal history might account for some of the observed pattern of gas wetness. The area of dry gas was interpreted to represent a mixture of ther-mogenic gas and late-stage microbial gas (Scott, 1994; Scott and others, 1994a,b). Based on the presence of very heavy 13C values of the dissolved inorganic carbon (fig. 14) (Scott and others, 1994b), some microbial gas (methane) has been produced, contributing to the overall dryness of the gas.
It has been suggested that the distribution of wet and dry gas corresponds more closely to regional overpressure than to coal rank (Scott and others, 1994b) and is closely tied to basin hydrodynamics. However, as discussed above, thermal maturity, time, maceral composition, and degree of mixing of thermogenic and microbial gas can explain some aspects of the regional distribution of gas composition. Basin hydrodynamics
is important, especially in the northern part of the overpres-sure area, but its control on gas composition may be overesti-mated. Between vitrinite reflectance values 0.7–0.8 percent Rm, tongues of dry gas extend south from the main area of dry gas (fig. 15) and can be interpreted to represent
1. original distribution of dry/wet gas that occurred within these vitrinite values, or
2. areas into which dry gas has migrated during pres-sure readjustment between the overpressured and underpressured areas.
These areas might be controlled by faults, although the detailed studies to demonstrate this control have not been conducted. The convoluted pattern of wet- and dry-gas composition may reflect pinchout of coal beds and/or their offset by faulting (Scott 1994; Scott and others, 1994b). Coals south of the overpressured area tend to be elongate parallel to the southwest to northeast regional dip, whereas coals in the southern part of the overpressured area tend to be oriented northwest–southeast parallel to Pictured Cliffs Sandstone shorelines. The convoluted pattern of wet- and dry-gas com-position (0.94 and 0.97 contours) also approximately corre-sponds to the southern boundary of the 3-percent CO2 contour (figs. 15 and 16).
Distribution of Methane Isotopes
Some studies (Scott and others, 1991; Scott and others, 1994a,b) have indicated that the various carbon isotopes of methane, carbon dioxide, and dissolved inorganic carbon in produced waters throughout the overpressured area are a result of a mixture of older thermogenic gas and younger late-stage microbial gas generated during influx of Pliocene and younger meteoric water. The carbon isotope of methane ranges from –46.7 to –34.1 per mil (table 3) (fig. 17) (Jones and others, 1985; Rice and others, 1989; Scott and others, 1991; Threlkeld, written commun., 2001). The lightest values are found in the southern part of the underpressured Basin Fruitland CBG AU as well as in a small area on the northern rim of the San Juan Basin in the overpressured area of the Basin Fruitland CBG AU (fig. 17). Between these areas the distribution of carbon isotopes varies, but in a narrow range. The heaviest values, less than –41 per mil, are mostly found in the overpressured area, both in the Fruitland Fairway and Basin Fruitland CBG AUs (fig. 17).
When overlain on the regional map of d18O of produced water, d13C of methane trends from lighter to heavier val-ues along broad groundwater flow paths as defined by the changes in the regional d18O-isotope values (fig. 18). In the area of isotopically light water (–16 to –13 per mil d18O), the d13C values of the methane are highly variable and probably represent various degrees of gas mixing or original signatures. Heavy d13C values of the methane (–41.0 to –39 per mil) are irregularly distributed but, in general, tend to occur where produced water has d18O isotopes >–10 per mil. The regional distribution of d13C of methane can be explained by mixing of various amounts of thermogenic and microbial gas (pre- or

32 Total Petroleum Systems and Geologic Assessment of Undiscovered Oil and Gas Resources in the San Juan Basin Province
Farmington
Durango
0 5 10 15 20 MILES
0 20 KILOMETERS5 10 15
36°
37°
108° 107°
Contours of C1/C1–5
Data limit
EXPLANATION
0.86–0.900.90–0.940.94–0.97> 0.97
Basin Fruitland AU boundary
Fruitland Fairway AU boundary
< 0.86
Vitrinite reflectance0.5
NEW MEXICO
COLORADO
ARCHULETA
LAPLATA
MONTEZUMA
SAN JUAN
RIO ARRIBA
SANDOVAL
MCKINLEY
0.6
0.7
0.8
0.9
1.0
1.1
1.2
1.3
1.3
1.3
1.3
1.5
1.2
1.1
0.9
0.5
0.5
>2.0
Figure 15. Map showing distribution of gas wetness (defined by C1/∑C1–5) in Fruitland Formation gases with respect to the Basin Fruitland Coalbed Gas and Fruitland Fairway Coalbed Gas Assessment Units and vitrinite reflectance. Gas wetness contour data from Scott (1994). Vitrinite reflectance data from Law (1992). Dry gas (>0.97 gas wetness) that was thermally generated is associated with the area of greater thermal maturity (vitrinite reflectance >0.8% Rm); dry gas (>0.97 gas wetness) that is associated with lower thermal maturity (vitrinite reflectance <0.6% Rm) may have a higher microbial-gas component.

Fruitland Total Petroleum System 33
COLORADO
NEW MEXICO
Durango
LA PLATA
Dulce
Cuba
MCKINLEY
SANDOVAL
SAN JUAN
0 5 10 15 20 MILES
0 20 KILOMETERS5 10 15
36°
37°
108° 107°
Farmington
CO concentration (percent)2
1−33−66−10>10
Data limit
EXPLANATION
Basin Fruitland Coalbed Gas AU boundary
Fruitland Fairway Coalbed Gas AU boundary
Vitrinite reflectance
< 1
ARCHULETAMONTEZUMA
RIO ARRIBA
0.6
0.7
0.8
0.9
1.0
1.1
1.2
1.3
1.3
1.3
1.3
1.5
1.21.1
0.9
0.5
0.5
>2.0
0.5
Figure 16. Map showing distribution of CO2 concentration in Fruitland Formation gases with respect to the Basin Fruitland Coalbed Gas and Fruitland Fairway Coalbed Gas Assessment Units and vitrinite reflectance. The highest concentration of CO2 (>6 percent) is roughly coincident with the Fruitland Fairway Coalbed Gas Assessment Unit (AU) and with areas of moderate thermal maturity (vitrinite reflectance 0.8–1.2 percent Rm). CO2 contour data from Scott (1994). Vitrinite reflectance data from Law (1992).

34 Total Petroleum Systems and Geologic Assessment of Undiscovered Oil and Gas Resources in the San Juan Basin Province
Farmington
Durango
0 5 10 15 20 MILES
0 20 KILOMETERS5 10 15
108° 107°
36°
37°
Contours of C1/C1−5
Data limit
EXPLANATIONδ13C of CH4, per mil
≥ –39
≥ –41 to < –39
≥ –43 to < –41
≥ –45 to < –43
≤ –45
0.86 – 0.900.90 – 0.940.94 – 0.97> 0.97
Basin Fruitland Coalbed Gas AU boundary
Fruitland Fairway Coalbed Gas AU boundary
< 0.86
NEW MEXICO
COLORADO
ARCHULETA
LAPLATA
MONTEZUMA
SAN JUAN
RIO ARRIBA
SANDOVAL
MCKINLEY
Figure 17. Map showing the distribution of δ13C of methane to gas wetness (defined by C1/∑C1–5) in Fruitland Formation gases. Isotopically light methane (<–45 δ13CCH4) is found in both the extreme northern and southern areas of the Basin Fruitland Coalbed Gas Assessment Unit (AU); the light isotope reflects a greater contribution of microbial methane. Contours of gas wetness from Scott (1994). Carbon-isotope data of methane from Scott and others (1994b) and Threlkeld (written commun., 2001).

Fruitland Total Petroleum System 35
post-thermal-gas generation) as well as isolated areas of what may be interpreted as original thermogenic gas and shows a more complex pattern than previously published (Scott and others, 1994b). The original distribution of carbon isotopes of thermal methane is unknown.
Carbon Dioxide Content
There is little publicly available concentration and carbon-isotope data for CO2 in Fruitland gas, although this data is important in economic resource analysis of Fruitland gas and in production practices. High content of CO2 affects the heat-ing value of the gas and the CO2 must be disposed of, thereby increasing production costs. Available analyses indicate the d13C is 12.8 ± 4.2 per mil (table 3). The heavy isotope suggests at least a partial microbial origin. A crossplot of the d13CO2 versus d13C methane (n=8) does not show any definite rela-tion between the two, but rather suggests mixing of various amounts of microbial and thermogenic CO2 (fig. 19). However, this observation is based on a small sample set and may not be representative of the broader population. There appears to be a correlation between the d13C CO2 and the CO2 content of the gas, based on a small sample set (n=7) (fig. 20). As the CO2 content in the gas increases, the carbon isotope becomes heavier, which suggests a greater fraction of microbially derived gas with increased CO2 content. This is not the trend that would be expected if the CO2 content was fixed prior to generation of late-stage microbial gas via CO2 reduction (dur-ing which CO2 is consumed) and if little or no additional CO2 was generated by other microbes. A crossplot of d13C methane versus CO2 content shows no correlation (n=68) between the two (fig. 8B). This reflects the narrow range of d13C-isotope values in the methane.
The distribution of CO2 content in Fruitland gas shows significant differences between the overpressured and under-pressured areas of the Basin Fruitland CBG AU as well as differences between these two areas and the overpressured Fruitland Fairway CBG AU (fig. 21) (Scott, 1994, his pl. 2; Scott and others, 1994b). In some areas, the data points are abundant, and the contours of CO2 content are well con-strained. In other areas, data points are sparse, and the contours should be considered as approximately located and alternative patterns should be considered. On a regional scale, the broad area of the Fruitland Fairway CBG AU is circumscribed by the 3- to 6-percent CO2 contour.
In the underpressured part of the Basin Fruitland CBG AU, CO2 content of gases is mostly less than 1 percent, except in areas in closer proximity to the southern Fruitland Fairway CBG AU boundary (fig. 21) (Scott, 1994, his pl. 2; Scott and others 1994b). In a narrow to broad convolute area border-ing the southern boundary of the Fruitland Fairway CBG AU, gases contain between 1–3 percent CO2. This area crosscuts the underpressured, transition pressured, and the overpressured area (fig. 21). There are several ways to interpret the pattern of this convolute area:
1. the area represents southward projecting tongues of gas (with 1–3 percent CO2) that migrated into this area during pressure readjustment between the over-pressured and underpressured areas,
2. the area represents gases (with 1–3 percent CO2) trapped along the leading edge of older flow paths of waters (ages unknown) that flowed northward (in the geologic past prior to the present potentiomet-ric distribution and present-day topography) perhaps from the time of deposition through the Miocene as the basin was being downwarped,
3. the area reflects changes in thickness and trends of net coal, or
4. some combination of the above.If the first hypothesis is valid, there is uncertainty why simple north to south migration would produce the observed narrow band of gas that contains 1–3 percent CO2 throughout a broad regional area. The 1–3 percent CO2 contours in the southern part of the Basin Fruitland CBG AU loosely correlate with locally thicker coal (fig. 22).
Most of the overpressured area of the Basin Fruitland CBG AU contains from 1–3 percent CO2 except for areas along the northern margin where greater and less CO2 content has been reported (fig. 21) (Scott and others, 1994b). A broad area of less than 1-percent CO2 content is found in the central-northern part of the overpressured Basin Fruitland CBG AU. This area coincides with a more thermally mature area of the Fruitland (fig. 15) and the probable location of the axis of the basin during the Oligocene. It also approximately coincides with an area of thin net coal (fig. 22). Although more data points are needed to better define this area of low CO2 content, the coincidence of low content with high thermal maturity, and hence low CO2 production, may reflect the original CO2 con-tent of Fruitland gas and thermal maturation conditions in this area. Today, this area is where Fruitland groundwater flow has d18O values around –15 to –13 per mil (fig. 11). Despite these light d18O values, here and elsewhere in the overpressured part of the Basin Fruitland CBG AU (figs. 11 and 12), it appears little CO2 is being produced by microbial activity.
Gases from most Fruitland Fairway CBG AU wells have CO2 contents greater than 6 percent and are found in two broad and nearly contiguous areas (fig. 16). Both areas have steep CO2-concentration gradients to the south and broader concentration gradients to the north. In the east half of the Fruitland Fairway CBG AU, this gradient is broader. Within the 6-percent CO2 contour, there are isolated pods where the CO2 content of the gas exceeds 10 percent (fig. 16) (Scott and oth-ers, 1994b, their fig 8). The area occupied by the wells having gases with at least 6-percent CO2 is significantly greater in the eastern part of the Fruitland Fairway AU than in the west.
The irregular northern and southern boundary of the 6-percent contour approximates regional trends in net coal thickness, and the area bounded by the six-percent CO2 contour also approximates the area of thickest coal (fig. 22). The Fruitland depositional system extended far beyond the
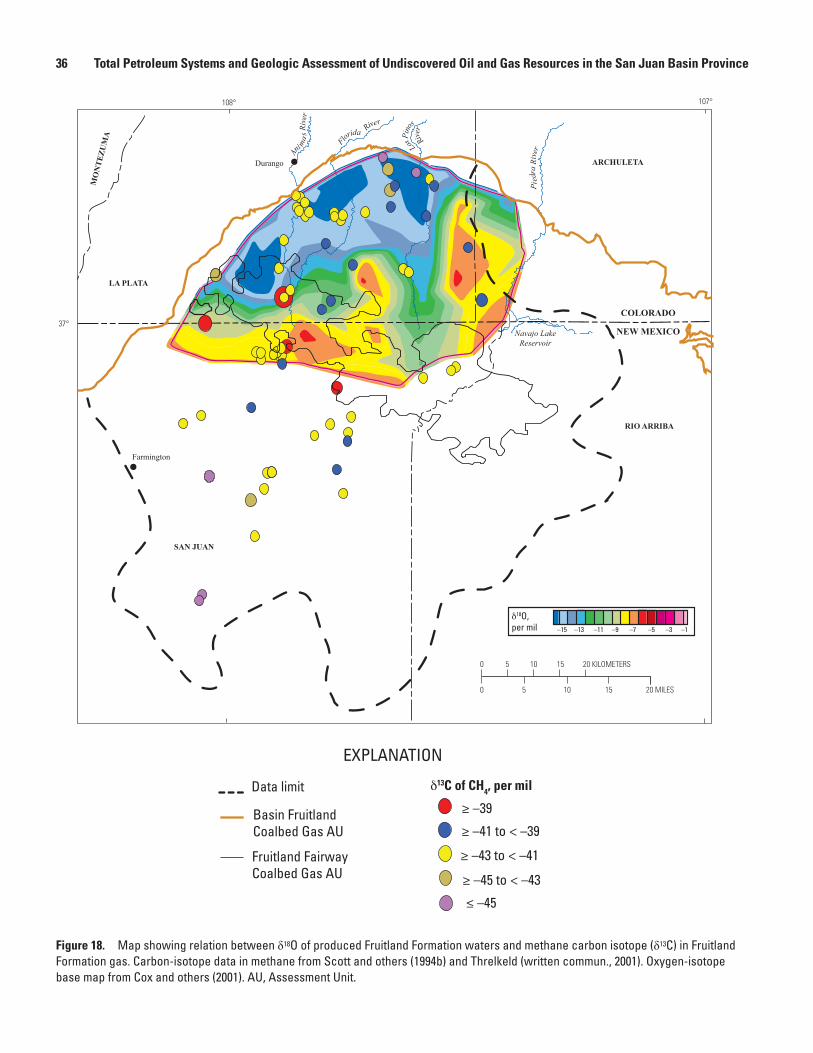
36 Total Petroleum Systems and Geologic Assessment of Undiscovered Oil and Gas Resources in the San Juan Basin Province
δ18O,per mil –15 –13 –11 –9 –7 –5 –3 –1
Durango
Farmington
0 5 10 15 20 MILES
0 20 KILOMETERS5 10 15
37°
108° 107°
EXPLANATION
δ13C of CH4, per mil
≥ –39
≥ –41 to < –39
≥ –43 to < –41
≥ –45 to < –43
≤ –45
Data limit
Basin Fruitland Coalbed Gas AU
ARCHULETA
LA PLATA
SAN JUAN
RIO ARRIBA
MO
NTE
ZUM
A
Fruitland FairwayCoalbed Gas AU
NEW MEXICO
COLORADO
Navajo LakeReservoir
Pied
ra R
iver Los
Pino
s
R
iver
Flor
ida River
Ani m
as R
iver
Figure 18. Map showing relation between δ18O of produced Fruitland Formation waters and methane carbon isotope (δ13C) in Fruitland Formation gas. Carbon-isotope data in methane from Scott and others (1994b) and Threlkeld (written commun., 2001). Oxygen-isotope base map from Cox and others (2001). AU, Assessment Unit.

Fruitland Total Petroleum System 37
0–48 –47 –46 –45 –44 –43 –42 –41
2
4
6
8
10
12
14
16
18
δ13 C CH4 (PER MIL)
δ13
C C
0 2 (P
ER M
IL)
0
1
2
3
4
5
6
7
8
0
CO2
(PER
CEN
T)
2 4 6 8 10 12 14 16 18
δ13 C C02 (PER MIL)
Figure 19. Crossplot showing relation between δ13CCO2 and δ13C methane of gas (n=8) in
the Fruitland Formation. Data from Colorado (red) and New Mexico (blue) are from Threlkeld (written commun., 2001).
Figure 20. Crossplot showing relationp between δ13CCO2 and the CO2 content of gas (n=7) in the
Fruitland Formation. Data from Colorado (red) and New Mexico (blue) are from Threlkeld, (written commun., 2001).

38 Total Petroleum Systems and Geologic Assessment of Undiscovered Oil and Gas Resources in the San Juan Basin Province
EXPLANATION
Contours of CO2 concentration
1–3 percent
3–6 percent
6–10 percent
> 10 percent
Data limit
< 1 percent
MCKINLEY
SANDOVAL
SAN JUAN
RIO ARRIBA
MONTEZUMA
LAPLATA
ARCHULETA
COLORADO
NEW MEXICO
Durango
Farmington
0 5 10 15 20 MILES
0 20 KILOMETERS5 10 15
37°
36°
108° 107°
Basin Fruitland Coalbed Gas AU
> 0.50
Pressure gradient (psi/ft)
0.55–0.44
< 0.44
Fruitland Fairway Coalbed Gas AU
Figure 21. Map showing the relation between pressure gradient (Scott and others, 1994b) and CO2 concentration in Fruitland Formation gas. CO2 contour data from Scott (1994). Yellow, significant overpressure; light blue, normal to slight overpressure; light tan, underpressure. AU, assessment unit.

Fruitland Total Petroleum System 39
Kmp
Kcc
Kls
Kpl
Kmv
Tmb
Kpc
Kpcl
Aztec
Cortez
Durango
Dolores
Farmington
Pagosa Springs
Cuba
COLORADONEW MEXICO
0.6
San Juan Basin boundary
Fruitland TPS boundary
0–5
5–25
25–45
45–65
65–95
Net coalthickness
(ft)
Basin axis
0 5 10 15 20 MILES
0 20 KILOMETERS5 10 15
108° 107°
36°
37°
BBB
Contours of CO2 concentration
1–3 percent3–6 percent6–10 percent>10 percentData limit
EXPLANATION
Anticline
Syncline
<1 percent
Figure 22. Map showing the relation between net coal in the Fruitland Formation (modified from Fassett, 2000) and distribution of CO2 concentration in Fruitland Formation gases. Contour data from Scott (1994). Symbols for geologic map units: Toa, Tertiary Ojo Alamo Sandstone; Tmb, Tertiary Miocene volcanics; Kpc, Pictured Cliffs Sandstone; Kpcl, Pictured Cliffs Sandstone and Lewis Shale; Kls, Lewis Shale; Kcc, Crevasse Canyon Formation; Kmp, Menefee Formation and Point Lookout Sandstone; Kmv, Mesaverde Group; Kpl, Point Lookout Sandstone (Green, 1992; Green and Jones, 1997). TPS, Total Petroleum System.

40 Total Petroleum Systems and Geologic Assessment of Undiscovered Oil and Gas Resources in the San Juan Basin Province
present basin boundary, and thus the present western configu-ration represents a truncation of the original geometry of the coal in the area of the outcrop. The configuration of the 6- and 10-percent contours seem to follow the net coal isopach trends and probably extended beyond the present western margin of the Fruitland Formation. Because the thick coal area bounded by the 6-percent CO2 concentration has been folded, it might be assumed that the distribution of CO2 in this area would be a result of post-deposition meteoric redistribution of CO2 down structural dip. However, the general positions of these contours appear to be controlled more by original depositional conditions (coal geometry) than by subsequent incursion of meteoric waters and structural orientation (figs. 11 and 22). This does not mean that incursion of younger meteoric waters have not had some effect in redistributing the CO2, but it may not be as important as suggested by Scott and others (1994b) in controlling the spatial distribution of high CO2 content.
In places the CO2 contours cut across structure contours drawn on top of the Huerfanito Bentonite Bed, especially along the northern and western basin margins, and the area of greater than 3-percent CO2 generally now lies within the deep-est part of the present-day basin (fig. 23A). CO2 contours also crosscut vitrinite isoreflectance contours (fig. 16) in places. The irregularity of the CO2 contours implies that controls other than basin structure or thermal maturity are responsible for irregular CO2 distribution. Differential adsorption of CO2 by coal may be one control on the irregular pattern of CO2 distribution. Carbon dioxide has been found to adsorb more tightly to coal matrix, compared to methane. Another control would be microbial generation of methane by CO2 reduction. This process could operate both pre- and post-thermogenic gas generation and generally results in lowering CO2 con-centration because CO2 is consumed in the process of meth-ane generation. Groundwater flow can also alter the spatial distribution of CO2 either through redistribution or as part of the microbial-gas-generation process. If generation of late-stage microbial gas by CO2 reduction (post-thermogenic gas generation) is an important component of gas resources, as suggested, it might be expected that CO2 content would reflect geologically recent basin groundwater flow patterns. These groundwater patterns would be younger than the structural configuration of the basin (Scott and others, 1994b).
In the area south of the Fruitland Fairway CBG AU, the apparent lack of strong correspondence between CO2 concen-tration and thermal maturity and structure contours, and the convolute nature of the CO2-concentration contours sug-gests some element of groundwater (or gas) flow from south to north in the geologic past. The convolute position of the 3–6 percent CO2 contour circumscribes the Fruitland Fairway CBG AU as well as the southern boundary of the northwest–southeast trend of thick net coal (figs. 22). The convolute pat-tern implies that groundwater flow events may have modified the original CO2 distribution, and the original CO2 content in this area was influenced by coal thickness and geometry, reservoir pressure, and thermal history. Likewise, the northern boundary of the convolute pattern of the 3–6 and 6–10 percent
CO2 contours in the Fruitland Fairway CBG AU and overpres-sured part of the Basin Fruitland CBG AU might also reflect modification of original CO2 concentration by groundwater flow from the north. It should be considered that the flow events are not time equivalent.
Although the CO2 contours do not appear to conform strongly to current basin structure or thermal maturity trends, they do show a correlation with trends in isopach thickness between the Huerfanito Bentonite Bed and the top of the Pictured Cliffs Sandstone (fig. 23B), the position of major shoreline trends as inferred from ammonite zones (figs. 24 and 25), and net coal thickness isopachs (fig. 22) (Fassett, 2000). All these features as well as the pattern of CO2 content have a strong northwest–southeast orientation, subparallel to the regional structural grain at the time of deposition. The cor-relation of broad regional patterns of CO2 content with these features suggests that geologic rather than hydrodynamic con-trols, which are more southerly or northerly directed, may be more important in controlling the distribution of CO2 content in Fruitland gas.
Regional trends in the isopach thickness of the interval between the top of the Huerfanito Bentonite Bed and the top of the Pictured Cliffs Sandstone appear to coincide with the major shorelines established for the Pictured Cliffs Sandstone (fig. 24) (Fassett, 2000). The spacing of the isopach contours reflects the rate of deposition and regression relative to the rate of subsidence. Where the contours are farther apart, regres-sion was more rapid, and where they are more closely spaced, regression was slower (Fassett, 2000). The close spacing of the 750- to 1,000-ft contours is interpreted to coincide with major buildups of sandstones of the Pictured Cliffs (see wells 16–18 on fig. 4). The Pictured Cliffs shoreline defined by the Didymoceras cheyennense ammonite zone approximately parallels the 750-ft-isopach contour (fig. 24) and is located between wells 16 and 17 (fig. 4). The Pictured Cliffs shoreline defined by the Baculites compressus ammonite zone roughly parallels the 950-ft-isopach contour (fig. 24) and is located between wells 17 and 18 (fig. 4). Thick net coal accumulated behind these sandstone buildups (see wells 15–17 on fig. 4).
The northern boundary of the 3–6 percent CO2 contour lies approximately south of the Pictured Cliffs shoreline defined by the Baculites compressus ammonite zone, and the northern boundary of the 6–10 percent CO2 contour lies roughly south of the Pictured Cliffs shoreline defined by the Didymoceras cheyennense ammonite zone (fig. 25) (Fas-sett, 2000). The ammonite zones were defined in the Lewis Shale, which intertongues with the overlying Pictured Cliffs Sandstone. The zones have been used in determining major shoreline positions in the Pictured Cliffs Sandstone (Fassett, 2000), as well as for defining the position and regional extent of stratigraphic rise of Pictured Cliffs shorelines from south-west to northeast across the basin. On a regional scale, shifts in shoreline position influence the geometry and thickness of coal and influence the pathways of subsequent groundwater movement. Major CO2 content changes that are coincident with defined shifts in shorelines suggest that geologic rather

Fruitland Total Petroleum System 41
0 5 10 15 20 MILES
0 20 KILOMETERS5 10 15
Basin axis
Ignacio anticline
antic
line
Bloomfield
Aztec
CortezDurango
Dolores
Farmington
Pagosa Springs
Cuba
Kmp
Kcc
Kls
Kpl
Kmv
Tmb
Kpc
Kpcl
0
5,50
0
5,000
6,50
0
4,500
6,000
4,000
3,500
7,000
7,500
8,00
0
3,000
5500
7,50
0
06,500
7,500
3,500
7,000
7,00
0
6,500
8,000
6,500
7,,500
7,500
7,000
7,500
7,500
3,500
7,000
8,000
7,,5006,000
0
0.50
0.60
0.8
1.0
1.5
1.5
0.8
0.8
5,500
COLORADONEW MEXICO
Fruitland TPS boundary
Cabresto
anticline
San Juan Basin boundary
108° 107°
37°
36°
CO2 concentration (percent)
1–3 percent3–6 percent6–10 percent>10 percent
Data limit
EXPLANATION
Anticline
Syncline
<1 percent
Figure 23A. Map showing distribution of CO2 concentration in Fruitland Formation gases and relation to structure contours drawn on top of Pictured Cliffs Sandstone. Contour data from Scott (1994). TPS, Total Petroleum System. Symbols for geologic map units: Toa, Tertiary Ojo Alamo Sandstone; Tmb, Tertiary Miocene volcanics; Kpc, Pictured Cliffs Sandstone; Kpcl, Pictured Cliffs Sandstone and Lewis Shale; Kls, Lewis Shale; Kcc, Crevasse Canyon Formation; Kmp, Menefee Formation and Point Lookout Sandstone; Kmv, Mesaverde Group; Kpl, Point Lookout Sandstone (Green, 1992; Green and Jones, 1997). TPS, Total Petroleum System.

42 Total Petroleum Systems and Geologic Assessment of Undiscovered Oil and Gas Resources in the San Juan Basin Province
0 5 10 15 20 MILES
0 20 KILOMETERS5 10 15
CO2 concentration (percent)
1–33–66–10>10
Data limit
EXPLANATION
Basin Fruitland Coalbed Gas AU boundary
Fruitland Fairway Coalbed Gas AU boundary
200
< 1
Thickness of isopached interval(Huerfanito Bentonite Bed to topof Pictured Cliffs Sandstone)
Contour interval = 50 ft
250
500
750
750
750
1,000
1,250
1,250
700
100
Dulce
Cuba
Durango
Farmington
RIO ARRIBA
ARCHULETA
MONTEZUMA
LA PLATA
SAN JUAN
MCKINLEY
SANDOVAL
COLORADO
NEW MEXICO
108° 107°
36°
37°
Figure 23B. Map showing distribution of CO2 concentration in Fruitland Formation gases and relation to the isopach thickness of the interval between Huerfanito Bentonite Bed of Lewis Shale and top of the Pictured Cliffs Sandstone (modified from Fassett, 2000). Contour data from Scott (1994). AU, assessment unit.

Fruitland Total Petroleum System 43
0 5 10 15 20 MILES
0 20 KILOMETERS5 10 15
EXPLANATION
Basin Fruitland Coalbed Gas AU boundary
Fruitland Fairway Coalbed Gas AU boundary
200 Thickness of isopached interval (HuerfanitoBentonite Bed to top of Pictured Cliffs Sandstone)
Contour interval = 50 ft
250
500
750
750
750
1,000
1,250
1,250
700
100Baculites scotti
Didymoceras nebrascense
Didymoceras stevensoni
Baculites compressus
Didymoceras cheyennense
Exiteloceras jenneyi
ARCHULETA
MONTEZUMA
LA PLATA
SAN JUAN
MCKINLEY
SANDOVAL
COLORADO
NEW MEXICO
Durango
Dulce
Cuba
Farmington
108° 107°
37°
36°
Figure 24. Map showing relation between shorelines (red), defined by labeled ammonite zones, in Pictured Cliffs Sandstone and the isopach thickness of the interval between Huerfanito Bentonite Bed of Lewis Shale and top of Pictured Cliffs Sandstone (modified from Fassett, 2000). AU, Assessment Unit.

44 Total Petroleum Systems and Geologic Assessment of Undiscovered Oil and Gas Resources in the San Juan Basin Province
0 5 10 15 20 MILES
0 20 KILOMETERS5 10 15
CO2 concentration (percent)
1–33–66–10>10
Data limit
EXPLANATION
Basin Fruitland Coalbed Gas AU boundary
Fruitland Fairway Coalbed Gas AU boundary
Pictured Cliffs Sandstone shorelines
< 1
Baculites scotti
Didymoceras nebrascense
Didymoceras stevensoni
Baculites compressus
Didymoceras cheyennense
Exiteloceras jenneyiFarmington
Durango
Dulce
Cuba
MONTEZUMA
ARCHULETA
LA PLATA
SAN JUAN
MCKINLEY
SANDOVAL
COLORADO
NEW MEXICO
108° 107°
37°
36°
Figure 25. Map showing distribution of CO2 concentration in Fruitland Formation gases with respect to Pictured Cliffs Sandstone shorelines, defined by labeled ammonite zones, (gray) (modified from Fassett, 2000). CO2 contour data from Scott (1994). AU, Assessment Unit.
Fruitland Total Petroleum System 45
than present-day hydrodynamic controls are more important in controlling the spatial distribution of CO2 content, especially in the area of the Fruitland Fairway CBG AU.
Superposition of the major shoreline trends, defined by ammonite zones, on net coal isopachs (fig. 26) (Fassett, 2000) shows some relation between the two, although in some areas the relation does not hold. This is probably because the coal thickness was summed over some thickness interval, and the coal was not entirely deposited in areas related to a particular shoreline. The thickest net coal lies landward of the shoreline defined by the ammonite Didymoceras cheyennense, and thick net coal is found landward of the western part of the shoreline defined by the ammonite Baculites compressus (fig. 26) (Fas-sett, 2000). These two shoreline positions were developed over periods of relatively slow sea level rise, resulting in stacking of shoreface sandstones and greater thickness of accumulation of coal in coastal and lower alluvial plain settings. These coals might have greater lateral continuity than coals deposited dur-ing periods of more rapid progradation, a factor that ultimately will influence later groundwater flow.
Superposition of CO2 contours on net coal isopachs indi-cates a relation between CO2 concentration and net coal thick-ness and trends in coal thickness (fig. 22). There are two areas of greater than 6-percent CO2 concentration that are separated by an area of greater than 3-percent but less than 6-percent CO2 that is coincident with a northeasterly trend of thin net coal (25–45 ft). This northeasterly trend in thin net coal sepa-rates two areas of thicker net coal that on a regional scale may not be in effective hydraulic communication with each other. Gases from wells in the southeast lobe of thick net coal, where the coal is thickest, have CO2 concentrations of 6 percent or higher. The northern and eastern boundaries to the 10-percent concentration in this lobe appear to be constrained by areas of thin net coal (fig. 22) and sandstone (Scott and others, 1994b). This area of high CO2 concentration also corresponds to an area where wells have very high bottom-hole pressures (Scott and others, 1994b). The high pressures in these wells have some influence on the amount of CO2 concentration because of sorption conditions. The present structural axis of the basin generally follows the same easterly and southeasterly trend of thin coal isopach (fig. 22) and further helps to isolate this area of thick net coal from later incursion of meteoric waters from the north and west, primarily because of the difference in orientation of the regional dip. This relation will be shown to be important in controlling the regional distribution of gas resources in the Fruitland Fairway CBG AU.
In the Fruitland Fairway CBG and Basin Fruitland CBG AUs, regional pressure gradients, considered by many to reflect later hydrodynamic repressuring of the Fruitland, crosscut CO2 contours, and thus it appears that repressuring events have had only minor influence on redistributing CO2 concentration (fig. 21). CO2 concentrations (greater than 6 per-cent) similar to those found in the overpressured (>0.50 psi/ft) area of the southeastern part of the Fruitland Fairway occur in less pressured (0.44–0.50 psi/ft) strata, implying that geologic factors other than pressure gradients are also important in con-trolling the CO2 concentration in the gases. Superposition of
the CO2 contours on the regional d18O-isotope pattern (fig. 27) shows little modification to the position of the contours by subsequent groundwater flow. The only exception to this is an area of recent recharge in the northern part of the basin where high CO2 in the gas might be related to active microbial action. The relations discussed above have been used in evalu-ating controls on the spatial distribution of gas resources in the Basin Fruitland and Fruitland Fairway CBG AUs.
Gas Generation Processes
Microbial
An understanding of past and ongoing methanogenic activity is important because of the contribution of late-stage microbial gas to the total gas resources (Scott and others, 1994b). Only in areas where methanogenesis is ongoing could potential resources be increased by some factor due to the generation of microbial gas. In areas where methanogenic activity has ceased, the total in-place gas resources would be fixed. Formation and retention of early formed microbial gas has probably been overlooked as a component of Fruitland gas. Scott and others (1994b) suggested that any early formed microbial gas would have been lost or not retained due to the high water content of the peat and limited sorption sites. However for at least the first 10 m.y. after deposition, ground-water flow in the Fruitland was to the north. During this time the lignite was being compacted and dewatered and over time thermally transformed from lignite to subbituminous coal.
Methane produced today in the Powder River Basin comes from thermally immature to subbituminous coals where cleats are not well developed. The gas is formed by microbial activity as groundwater encountered the coals (Gorody, 1999). The time of gas generation is unknown. It has been estimated to be from 35 to 10 Ma, when uplift and erosion of the basin began, or to have formed since the Pleistocene (Gorody, 1999). If extensive quantities of microbial gas can form in subbituminous coals under the right hydrodynamic conditions, then a similar model could be applied to the Fruitland during the first 10 m.y. after deposition. Thus, some portion of gas produced today may have early microbial origin. Mixture of early microbial gas with later thermally generated gas might account for the small range of carbon isotopes of the meth-ane and for heavy carbon isotopes of the dissolved inorganic carbon in produced waters throughout the production area. During thermogenic gas generation, the dissolved bicarbon-ate would not be used in the creation of methane, and if it was not removed in extensive mineral diagenesis (isotopi-cally heavy carbonate could be indicative of early microbial processes), it will remain if the system was closed to future groundwater flow.
The most thermally mature part of the Fruitland, as determined by vitrinite reflectance values, reached a maximum temperature of about 165ºC in the Oligocene (~25 Ma) in the northern part of the Basin Fruitland CBG AU (fig. 10C). The Fruitland in this area may have been buried up to as much as
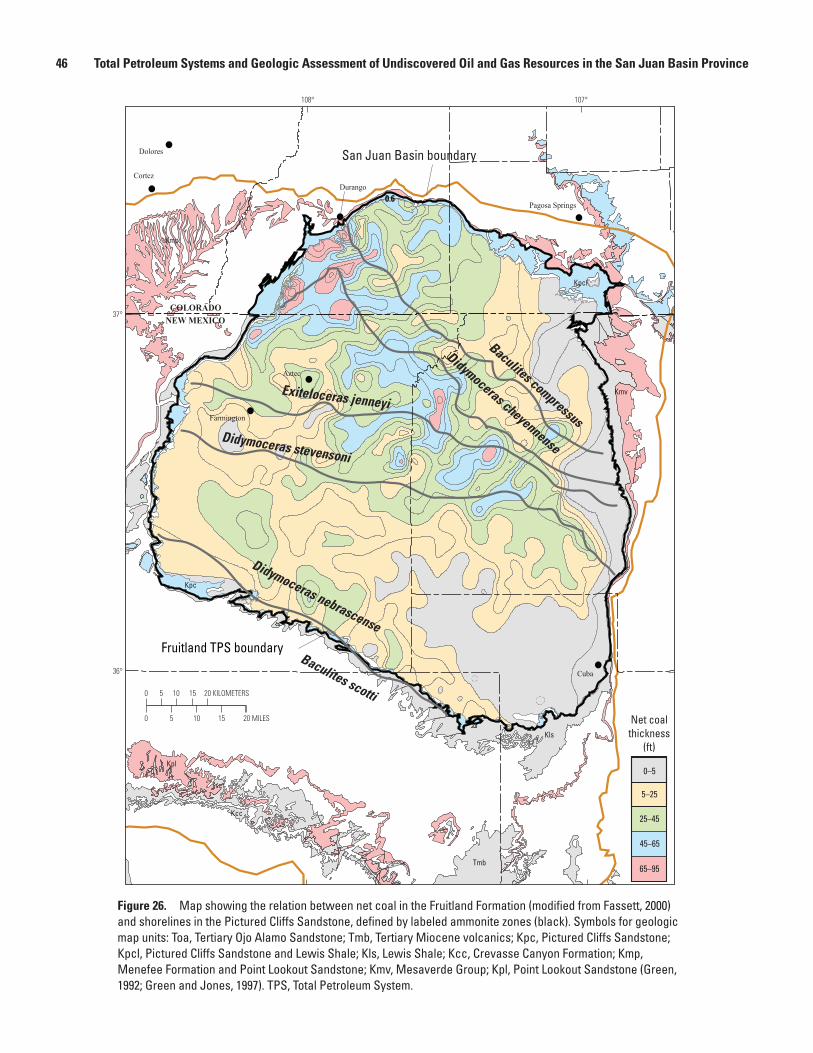
46 Total Petroleum Systems and Geologic Assessment of Undiscovered Oil and Gas Resources in the San Juan Basin Province
Kmp
Kcc
Kls
Kpl
Kmv
Tmb
Kpc
Kpcl
0.6
0 5 10 15 20 MILES
0 20 KILOMETERS5 10 15
San Juan Basin boundary
Fruitland TPS boundary
0–5
5–25
25–45
45–65
65–95
Net coalthickness
(ft)
Baculites scotti
Didymoceras nebrascense
Didymoceras stevensoni
Baculites compressus
Didymoceras cheyennense
Exiteloceras jenneyi
Aztec
Cortez
Dolores
Farmington
Pagosa Springs
Cuba
Durango
COLORADONEW MEXICO
108° 107°
36°
37°
Figure 26. Map showing the relation between net coal in the Fruitland Formation (modified from Fassett, 2000) and shorelines in the Pictured Cliffs Sandstone, defined by labeled ammonite zones (black). Symbols for geologic map units: Toa, Tertiary Ojo Alamo Sandstone; Tmb, Tertiary Miocene volcanics; Kpc, Pictured Cliffs Sandstone; Kpcl, Pictured Cliffs Sandstone and Lewis Shale; Kls, Lewis Shale; Kcc, Crevasse Canyon Formation; Kmp, Menefee Formation and Point Lookout Sandstone; Kmv, Mesaverde Group; Kpl, Point Lookout Sandstone (Green, 1992; Green and Jones, 1997). TPS, Total Petroleum System.

Fruitland Total Petroleum System 47
Navajo LakeReservoir
Pied
ra R
iver Los
Pino
s
R
iver
Flor
ida River
Ani m
as R
iver
d18O,per mil −15 −13 −11 −9 −7 −5 −3 −1
Durango
Farmington
0 5 10 15 20 MILES
0 20 KILOMETERS5 10 15
EXPLANATION
Contours of CO2 concentration
1−3 percent
3−6 percent
6−10 percent
> 10 percent
Data limit
< 1 percent Basin Fruitland Coalbed Gas AU
Fruitland FairwayCoalbed Gas AU
NEW MEXICO
COLORADO
MO
NTEZ
UMA
ARCHULETA
LAPLATA
SAN JUAN
RIO ARRIBA
37°
108° 107°
Figure 27. Map showing relation between d18O of produced Fruitland Formation waters and carbon dioxide concentration in Fruitland Formation gas. CO2 contours from Scott (1994). Oxygen-isotope base map from Cox and others (2001). AU, Assessment Unit.

48 Total Petroleum Systems and Geologic Assessment of Undiscovered Oil and Gas Resources in the San Juan Basin Province
9,000 ft (fig. 10C); although present depths of burial are about 2,200 ft. This area now falls within water flow paths having d18O values of –15 per mil (fig. 11) and present-day tempera-tures of the Fruitland in this area are near 45ºC, using uncor-rected bottom-hole temperatures from wells that are completed in the Fruitland. This latter temperature is well within the tem-perature range of 30º–80ºC for microbial-gas generation (see discussion in Gorody, 1999). The Fruitland in this area cooled to a temperature of 80ºC near the Miocene–Pliocene bound-ary (5 Ma) (fig. 10C). Thus from the middle Eocene, when temperatures in the Fruitland exceeded 80ºC, to the Pliocene, generation of any significant volume of microbial gas would have been inhibited by formation temperatures exceeding 80ºC.
Optimal temperature conditions for microbial-gas genera-tion range from 35º–45ºC (Zeikus and Winfrey, 1976), but may range as high as 60ºC (Fishman and others, 2001). In the TPS, these temperatures were not reached (post-thermal-gas genera-tion) until the onset of the Pleistocene (1.8 Ma ) (fig. 10C). Thus, optimal temperature conditions for generation of micro-bial gas throughout the Fruitland (post-thermal-gas generation) have existed only since the onset of the Pleistocene (fig. 10C). However, thermal conditions suitable for early (pre-thermal gas) microbial-gas generation (fig. 10C) existed at least through the Paleocene and possibly into the early Eocene, a time span-ning 10–25 m.y. from the time of deposition.
Thermogenic
Because there is more gas present in Fruitland Fairway coals than can be accounted for by standard coal volume cal-culations, it has been suggested that 25–50 percent of the gas produced in the Fruitland Fairway was generated in place dur-ing coalification and that the remainder migrated there in the Oligocene or was generated in place as late-stage microbial gas from the middle Pliocene to Holocene as a consequence of introduction of meteoric water (Scott and others, 1994b). The model (Scott and others, 1994b) that has been proposed to explain the high gas content in the Fruitland Fairway coals is
1. thermally generated gas that exceeded coal storage capacity migrated in the Oligocene from north to south (from the deep part of the basin toward the south into somewhat lower rank coals); this ther-mal gas was then trapped in coals just north of a possible structural hingeline, where the coal geom-etry changed;
2. in the middle Pliocene, after uplift, erosion, and ther-mal cooling, meteoric waters entered the basin from the north, bringing bacteria that produced late-stage microbial gas and carbon dioxide (and heavy carbon in bicarbonate in water due to CO2 reduction);
3. as this evolved groundwater moves southward downdip it “sweeps” or dissolves methane that later fills cleats or is resorbed by coals, which are now undersaturated due to uplift and erosion; and
4. water flows vertically upward in the area just north of the hingeline and further augments the gas content of the coals.
Gas Origin
Considering some of the data and spatial relations previ-ously presented, there are some problems with the above model. Fruitland gas is undoubtedly a mixture of variable proportions of thermogenic and microbial gas, based on the carbon isotopes of the methane, carbon dioxide, and dissolved bicarbonate. The principal question concerning the microbial part is the age of generation and the percent contribution to total gas resources. Is it all post-thermogenic as a result of introduction of microbes with meteoric water of Pliocene and younger age or generated in place by microbial communities that came back to life after dormancy? Was some or much of the microbial component generated prior to thermal-gas gen-eration? How does resolving these questions affect the evalua-tion of potential and future gas resources in the Fruitland?
Groundwater flow may be important in modifying Fruit-land gas production and has been instrumental in generation of late-stage microbial gas in some areas. However, the role of Pliocene and younger groundwater might not be construc-tive in all areas and in generating large quantities of late-stage microbial gas. In some areas, it can be a destructive process resulting in oxidation of methane (Gorody, 2001). The distri-bution of d13C of DIC, distribution of 129I/I minimum ages, d13C of methane, and CO2 content do not correspond with trends (taken to represent direction of more recent ground-water flow) in d18O content of produced water (figs. 13–16, 18, 27, and 28). These distributions also do not correspond with trends in pressure gradient. On the contrary, the distribu-tion of d13C of DIC and d13C of methane is rather uniform (within a narrow range of values) except along the northern and southwest margins of the Fruitland. CO2 content seems to more closely correspond with thicker and less mature coal. In addition, limited data indicates no linear mixing relation between CO2 concentration and the d13C of methane (fig. 8B) or between the d13C of CO2 and d13C of methane (fig. 19). Some data show a slight linear relation between d13C CO2 and CO2 concentration, and this relation seems to be different for gas in Colorado and New Mexico (fig. 20).
Isotopically heavy bicarbonate waters (figs. 14 and 28) (Scott and others, 1991) are found in the overpressured northern part of the Basin Fruitland CBG AU, in the very southwestern underpressured part of the Basin Fruitland CBG AU, and in the overpressured Fruitland Fairway CBG AU, and have been used in arguments for late-stage microbial-gas generation in these areas. However, isotopically heavy carbon as dissolved bicarbonate has been found in one Pictured Cliffs Sandstone well (18.52 per mil) and one Fruitland Forma-tion well (25.29 per mil) south of the Fruitland Fairway and northeast of Farmington, N. Mex., in the underpressured part of the Fruitland Formation (Ridgley, unpub. data, 2001). These data suggest that generation of microbial gas in the Fruitland

Fruitland Total Petroleum System 49
Durango
Farmington
0 5 10 15 20 MILES
0 20 KILOMETERS5 10 15
EXPLANATION
δ18C of dissolved inorganic carbon speciesData limit
δ18O,per mil −15 −13 −11 −9 −7 −5 −3 −1
Basin Fruitland Coalbed Gas AUFruitland Fairway Coalbed Gas AU
16.7
17.5
19.5, 19.7
23.5
24, 24.7, 24.9
25.3, 25.6
26
Navajo LakeReservoir
Pied
ra R
iver
Los
Pino
s
R
iver
Flori
da River
Ani m
as R
iver
ARCHULETA
LAPLATA
RIO ARRIBASAN JUAN
MONTEZUM
A
NEW MEXICO
COLORADO
108° 107°
37°
Figure 28. Map showing the distribution of d13C of dissolved inorganic carbon in Fruitland Formation produced waters in relation to d18O of produced waters. Oxygen-isotope base map from Cox and others (2001). d13C of dissolved inorganic carbon from Scott and others (1994b) and Threlkeld (written commun., 2001). AU, Assessment Unit.

50 Total Petroleum Systems and Geologic Assessment of Undiscovered Oil and Gas Resources in the San Juan Basin Province
is a much more common phenomena and is not a process confined to the overpressured area or to the southwest margin of the Fruitland. The time of formation, as discussed above, could vary.
Minimum 129I/I ages for the produced waters from these two wells are Eocene (Pictured Cliffs) and earliest Miocene (Fruitland) (Ridgley, unpub. data, 2001). If these ages are valid, then the heavy bicarbonate signatures of the water should be this age or older, unless microbial communities that produced microbial methane by the CO2-reduction pathway go dormant and survive high heat only to become active once the temperatures cool to an optimal range. If this is the case, there is no connection between heavy bicarbonate signatures, the age of the formation water, or later inferred flow paths.
If some produced waters in the underpressured part of the Fruitland are Miocene or older and if they originated from a part of the basin that was less thermally mature and hence in a temperature range where CO2 content might have been higher, then it is possible that (based on solubility conditions) the waters may have transported both methane and CO2 in solution. This water may also have been enriched in bicarbon-ate content if bacterial methanogenesis had occurred in the geologic past. This hypothesis is supported, in part, by the 129I/I minimum age of the water and the heavy d13C of the dissolved inorganic carbon of the previously mentioned well. In this scenario, northward flowing waters may have been trapped near the area of the Fruitland Fairway as the basin was slowly being downwarped. Trapping would have been aided by permeability barriers, such as:
1. changes in coal and sandstone geometry in the area of thick net coal, which is one characteristic of the Fruitland Fairway CBG AU (fig. 5), or
2. faults that formed during Laramide tectonism.In the area of thick net coal, contours of net coal thick-
ness are mostly oriented northwest–southeast in contrast to the dominantly northeast-trending net coal isopachs to the south. Here waters (and higher bicarbonate content) and gases would have been trapped and mixed with in-place water and in-place generated gas as the basin continued to subside to the north. Subsequently, when the basin axis shifted south to its present position, these waters and gases would be unable to migrate from the area, because of later artesian pressuring from the north coupled with the change in coal-bed geometry and structural dip of the Fruitland coal beds (structural hinge-line of Scott ,1994; Fassett, 2000) to the south. The waters and gases would be isolated from later groundwater influx, and the chemical system in this area would be closed. The gas composition would reflect a mixture of early microbial and later thermogenic gas. Therefore, the southern boundary of the overpressured area may in fact reflect overpressur-ing of these older waters trapped between younger artesian conditions to the north and a structural/geologic setting that does not permit rapid loss of water to the south that would relieve overpressuring.
Eocene, Oligocene, and Miocene minimum ages based on 129I/I ratios have been documented in Fruitland waters from
the northern part of the Fruitland Formation (fig. 13) (Colo-rado Oil and Gas Commission, 1999b; Snyder and others, 2003). The preponderance of Oligocene and Miocene mini-mum ages in the area of the southern part of the overpressured zone (Fruitland Fairway) could support
1. the migration of gas in the Oligocene from north to south (from the deep part of the basin toward the south into somewhat lower rank coals) and
2. vertically upward flow of water in the area just north of the hingeline as has been suggested by Scott and others (1994b).
However, these waters would have to somehow bypass a large area containing older waters (Paleocene and Eocene). Alterna-tively, these waters could be related to northward flow in the Fruitland during the Oligocene and Miocene as the basin was being downwarped. The absence of dated waters of Pliocene and younger age over most of the Fruitland in the northern part of the TPS suggests that the hydrologic model proposed (Kaiser and others, 1994; Cox and others, 2001) for the Fruit-land needs to be reevaluated.
Hydrocarbon Migration Summary
Hydrocarbons migrated laterally and downward from the Fruitland Formation into the Pictured Cliffs Sandstone by way of faults, fractures (cleats) in the Fruitland coals, or by diffu-sion. Pressure differences between the Fruitland and Pictured Cliffs have been proposed as the cause of diffusion from one formation to the other (Rice and others, 1988; Scott and oth-ers, 1991). Hydrocarbons have migrated upsection from the Fruitland to the Farmington Sandstone Member of the Kirtland Shale and to Tertiary rocks in the northwestern and north-eastern parts of the San Juan Basin. Migration paths have not been positively identified for the Farmington accumulations. Fractures and dike-margin discontinuities associated with the late Oligocene Dulce dike swarm (Ruf and Erslev, 2005) are thought to be the main migration pathways for gas accumula-tions in Tertiary rocks in the Cabresto Canyon producing area (see fig. 52).
The principal reservoirs in the Fruitland Formation are the coals, although sandstone channels are also reservoirs. Coals (exclusive of their cleats) have low porosity and virtu-ally no permeability, and thus, the gases are sorbed onto the coal matrix (Scott, 1994). Migration of gas from the coal, by way of cleats, into other reservoirs, such as the interbedded sandstones, can occur when pressure is decreased below the sorptive capacity of the coal at a given temperature. Pres-sure decreases usually occur during production but may also have occurred in the geologic past during periods of uplift and erosion. Migration of coal-derived gas may also occur by diffusion (Scott, 1994), and if it enters the hydrologic regime, the gas may dissolve in the water and be transported to other sites of accumulation. The regional changes in composition of Fruitland gas suggest that some migration of gases has occurred (Scott, 1994).

Fruitland Total Petroleum System 51
Permeability in coals is much higher than that of the interbedded sandstones; the permeability is confined to cleats (Scott, 1994; Cox and others, 2001). Extensive cleat devel-opment in the coals is the principal permeability pathway required for production from these reservoirs (Tremain and others, 1994; Shuck and others, 1996), but also serves as a pathway for gas to migrate away from the coals as the pres-sure changes in the reservoir. Local faults in the Fruitland also serve as conduits for gas migration as well as provide better deliverability of gas to the wellbore (Tremain and others, 1994; Shuck and others, 1996).
Hydrocarbon Traps and Seals
Stratigraphic traps are the principal trapping mechanism for gas in the Pictured Cliffs Sandstone. These traps form when sandstone lenses in the Pictured Cliffs pinch out updip into coal or mudrocks in the lower part of the Fruitland For-mation. Seals for the Pictured Cliffs are complex—a combi-nation of mudrocks in the overlying Fruitland and Kirtland Formations, coal beds into which sandstone lenses pinch out, and cementation of the reservoir rocks (Cumella, 1981; Goberdhan, 1996). Water saturation on the south margin of the basin acts as a relative permeability barrier to migration, whereas diagenesis of reservoir rocks is a sealing mechanism on the north margin (Cumella, 1981; Goberdhan, 1996).
Several types of traps can be found in Fruitland For-mation reservoirs; each varies in size or areal extent. At the smallest scale, the coals in the Fruitland serve not only as the source of the produced gas in the Fruitland, but also the trap and reservoir. Permeabilities in coals (exclusive of cleats) are virtually nonexistent, and the gases are sorbed onto the coal matrix (Scott, 1994). At larger scales, the heterogeneous character of coal-bed reservoirs tends to divide the reservoir into compartments. The compartments may form when one or possibly both cleat directions are closed or nearly closed as a result of tectonic stress (Shuck and others, 1996). The degree of development of the cleat system and direction of cleat development are primarily controlled by directions of tectonic stress; however, coal rank and coal matrix composition (mac-eral type) also have been shown to be important in forming compartments (Tremain and others, 1994). Other compart-ments may form as a result of intersecting faults or lateral pinchout of coal. Folds do not appear to be a major control on coal-gas accumulation, but fractures and faults associated with development of folds do affect permeability (Kaiser and Ayers, 1994). Seals in Fruitland reservoirs may be
1. closed cleats due to tectonic stress,2. cemented faults, 3. interbedded tightly cemented sandstone reservoirs
that are not fractured, and 4. carbonaceous shale or mudstone interbeds.Stratigraphic traps (pinchouts of fluvial channels into
overbank mudrocks) are also the primary trap type in the
Farmington Sandstone Member of the Kirtland Formation. Combination stratigraphic traps in fluvial channels and a structural trap on the crest of an anticline are trapping mecha-nisms in Tertiary formations at the Cabresto Canyon field (see fig. 52). Seals in both cases are fluvial overbank mudrocks.
Assessment Unit Definitions
Pictured Cliffs Continuous Gas Assessment Unit (50220161)
Introduction
The Pictured Cliffs Continuous Gas AU boundary was drawn to include all known and undiscovered gas accumula-tions in the Pictured Cliffs Sandstone in the San Juan Basin (fig. 29). The digital geologic maps of Colorado (Green, 1992) and New Mexico (Green and Jones, 1997) were used to draw the boundary, which was the upper contact of the Pictured Cliffs outcrop in most places (fig. 29). Along part of the eastern side of the basin, the Pictured Cliffs is absent at the surface, and in that area the top of the Lewis Shale was used as the boundary. In the 1995 National Assessment Play 2211 (Huffman, 1996), the Pictured Cliffs Sandstone Gas Play, was assessed. This same unit was assessed as the Pictured Cliffs Continuous Gas AU in this report.
Production from the Pictured Cliffs Sandstone started in 1927 with discoveries in the Blanco and Fulcher Kutz fields in New Mexico (fig. 29). The initial phase of widespread develop-ment drilling was from 1950 to 1959, but exploration slowed throughout the 1960s (IHS Energy Group, 2002). Another phase of drilling lasted from 1971 to 1980, with another slowdown from 1981 to about 1995. Drilling increased somewhat from 1995 to the present, with the exception of 1998, which saw little development drilling. Major gas fields producing from the Pic-tured Cliffs Sandstone are shown on figure 29. Production from this assessment unit as of January 2003 is about 1.1 million barrels of oil (MMBO) and 4.0 trillion cubic feet of natural gas (TCFG) (IHS Energy Group, 2003).
Currently, drilling is permitted on 160-acre spacing, and the potential for future additions to reserves may depend on decreasing the well spacing. The outer margins of the major gas fields have been fairly well defined, especially along the southwest side of the AU, where increased water saturation has resulted in a number of dry holes. Water saturation also increases along the northeast side of the gas-producing area in the AU, but some of the most recent drilling has been in this area, in the deepest part of the basin.
Areas where the reservoir rock is tightly cemented would possibly benefit by decreasing the well spacing because the pos-sibility of interference between wells is less in those areas. Key parameters of the Pictured Cliffs Continuous Gas AU are listed below and are summarized on figure 30.

52 Total Petroleum Systems and Geologic Assessment of Undiscovered Oil and Gas Resources in the San Juan Basin Province
Kmp
Kcc
Kls
Toa
Kpl
Kmv
Tmb
Kpc
Kpcl
Cuba
Aztec
Cortez
Dolores
Farmington
Pagosa Springs
Durango
Blanco South
Blanco
Ballard
Aztec
Tapacito
Kutz West
Ignacio-Blanco
Fulcher Kutz
Gavilan
WAW and Nipp
Blanco East
Rosa
Albino
Gobernador
Los Pinos South
Choza Mesa
Harper HillLa Jara
Ojo
Potwin
Twin Mounds
Gallegos South
Rio Arriba
0.50
0.60
0.8
1.0
1.5
0.6
0.8
1.5
NatomisFederal-Texaco1-11
Superior Sealy 1-7
SohioSouthern Ute15-16
0 5 10 15 20 MILES
0 20 KILOMETERS5 10 15
Fruitland TPS boundary
Pictured Cliffs Continuous GasAU boundary
San Juan Basin boundary
Basin axis
Ignacio anticline
antic
line
Cabresto anticline
COLORADO
NEW MEXICO
108° 107°
36°
37°
Figure 29. Map showing the boundary of the Pictured Cliffs Continuous Gas Assessment Unit (AU) (red polygon) and Pictured Cliffs Sandstone gas fields (shades of blue). Also shown are the locations of the regional cross section A–A’ (see fig. 4), principal folds in the basin, and wells (green and black triangles) used to make the burial history curves in this report (figs. 10A–C). Symbols for geologic map units: Toa, Tertiary Ojo Alamo Sandstone; Tmb, Tertiary Miocene volcanics; Kpc, Pictured Cliffs Sandstone; Kpcl, Pictured Cliffs Sandstone and Lewis Shale; Kls, Lewis Shale; Kcc, Crevasse Canyon Formation; Kmp, Menefee Formation and Point Lookout Sandstone; Kmv, Mesaverde Group; Kpl, Point Lookout Sandstone (Green, 1992; Green and Jones, 1997). Contours (gray) show vitrinite reflectance (Rm) values, in percent, from data in Fassett and Nuccio (1990), Law (1992), and Fassett (2000). TPS, Total Petroleum System.

Fruitland Total Petroleum System
53
PETROLEUMSYSTEM EVENTS
GEOLOGIC TIME
SCALE
MIOCENEOLIG.EOCENEPALEO. Po
CENOZOICMESOZOICTERTIARY
E LEE MM LL
QUAT.JURASSIC CRETACEOUS
Ps
01020304050607075100150200250
E L LME E L E M L
Rock units:Late Cretaceous— 1. Pictured Cliffs Sandstone 2. Fruitland Formation
ROCK UNITSOURCE ROCKRESERVOIR ROCKSEAL ROCK
OVERBURDEN ROCKTRAP FORMATION
GENERATION-ACCUMULATION
MIGRATION-
PRESERVATIONCRITICAL MOMENT
1,2
2
1
2
TRIAS.
Figure 30. Events chart that shows key geologic events for the Pictured Cliffs Continuous Gas Assessment Unit. Black arrow, critical moment (Magoon and Dow, 1994) for gas generation. TRIAS., Triassic; PALEO., Paleocene; OLIG., Oligocene; QUAT., Quaternary; Po, Pliocene; Ps, Pleistocene; E, early; M, middle; L, late. Geologic time scale is from the Geological Society of America web page http://www.geosociety.org/science/timescale/timescl.htm, last accessed 2/1/2008, and from Berggren and others, (1995).

54 Total Petroleum Systems and Geologic Assessment of Undiscovered Oil and Gas Resources in the San Juan Basin Province
Source
The major source rocks are overlying Fruitland Formation coal beds and carbonaceous shales. Shale beds in the underly-ing Lewis Shale may locally be source rocks, especially on the east side of the TPS. However, it is not possible to quantify the relative contribution of Lewis-sourced gas. The Lewis is discussed more fully in Chapter 5.
Maturation
Thermal maturation is interpreted to range from late Oligocene to early Miocene time.
Migration
Migration of gas was lateral and downward from Fruit-land coal into the Pictured Cliffs. In some areas, migration was upward from the underlying Lewis Shale. Migration is thought to have been diffuse, over a wide area, and not con-strained to specific routes along faults or structures. Natural fractures probably supplemented migration in some areas. Scott and others (1991) stated that gas in the Pictured Cliffs probably has a mixed source—from the Lewis and Fruitland. They suggested that higher reservoir pressures in the Fruit-land during generation and/or pressure decline in the Pictured Cliffs during production resulted in downward migration of gas from the Fruitland into the Pictured Cliffs.
Reservoirs
Shoreface and foreshore sandstones provide the reser-voirs, which are lenticular along depositional dip and elon-gated along depositional strike. Although the Pictured Cliffs accumulation is regarded as “continuous,” the distribution of producing wells shows a strong correlation with shoreline trends (IHS Energy Group, 2002). Wells with higher produc-tion are not associated with thicker sandstone beds of the Pictured Cliffs; rather, production is greater along trends of higher porosity and permeability, probably enhanced by natu-ral or induced fractures.
Traps/Seals
Stratigraphy is the main trapping mechanism and is due to the landward pinchout of marginal-marine sandstones into paludal shales and coals. These traps are augmented by the northward structural dip of the basin in the areas of great-est production; most gas is recovered south of the basin axis (fig. 29) as well as along the south (updip) side of sandstone lenses. Paludal shales in the lower part of the Fruitland and fluvial overbank mudrocks in the upper part of the Fruitland and in the Kirtland Formation act as seals. Overall, the Pic-tured Cliffs is relatively low in permeability, due to cementa-
tion, which reduces the potential for long-distance migration of gas into or out of the formation.
Geologic Model
Gas was generated from Fruitland coal in the late Oligo-cene to early Miocene (fig. 10C) and migrated laterally and downward into shoreface sandstones of the Pictured Cliffs Sandstone. The areas of greater gas production are where Fruitland coal is thickest. The top of the Lewis Shale (base of Pictured Cliffs) entered the zone of generation of wet gas in the late Oligocene and never was thermally mature to enter the zone of generation of dry gas (fig. 10C) in the northern part of the TPS; the Lewis also contributed gas to the Pictured Cliffs. Overlying shales in the Fruitland and Kirtland Formations act as seals, and the gas was trapped in overlapping, lenticular sandstones in the Pictured Cliffs. Gas is also prevented from migrating out of the Pictured Cliffs by updip water to the north and south of the main producing area. Cementation of the Pic-tured Cliffs prevents long-distance migration of gas. Produc-tion is greatest along northwest- to southeast-oriented trends of higher porosity and permeability, commonly along the updip sides of sandstone lenses of the Pictured Cliffs.
Assessment Results
The Pictured Cliffs Continuous Gas Assessment Unit (50220161) was assessed to have potential additions to reserves of 5,640.25 billion cubic feet of gas (BCFG) and 16.92 million barrels of natural gas liquids (MMBNGL) at the mean. The volumes of undiscovered oil, gas, and natural gas liquids estimated in 2002 for the Pictured Cliffs Continuous Gas AU are shown in appendix A. These values are higher for both gas and natural gas liquids compared to the 1995 USGS assessment (Huffman, 1996), for which the estimates were 3,264.04 BCFG and 0.10 MMBNGL at the mean. These numbers are not directly comparable, because of differences in cell size, area assessed, and projected success ratio. A sum-mary of the input data of the AU is presented on the data form in appendix B.
This AU encompasses an area of 4,206,000 acres at the median, 4,041,000 acres at the minimum, and 4,297,000 acres at the maximum. There were 6,809 tested cells (wells that have produced or had some other production test, such as initial production test, drill stem test, or core analysis). A 0.02 BCFG recovery cutoff was used per cell. Applying this cutoff, 6,352 tested cells equaled or exceeded this cutoff. There is adequate charge; favorable reservoirs, traps, and seals over most of the area; and favorable timing for charg-ing the reservoirs with greater than the minimum recovery of 0.02 BCFG. If the production history of the Pictured Cliffs Continuous Gas AU is divided into nearly three equal discov-ery time periods, plots of the estimated ultimate recoveries (EUR) indicate that the first third of discovery history had the highest median recovery per cell (0.66 BCFG) (fig. 31).

Fruitland Total Petroleum System 55
The second third had slightly lower recovery, at 0.56 BCFG per cell, and for the third period of time, recovery dropped to 0.33 BCFG per cell. Higher EUR recoveries for the first-third time period likely reflects discovery of the best sandstone res-ervoirs compared to sandstones discovered in the subsequent time periods. The EUR distribution for all producing wells in the AU (fig. 32) shows a median total recovery per cell of 0.5 BCFG. The EUR distributions were factored into the calculation of potential undiscovered resources.
Even with a large part of the AU assigned to established fields, the median untested area is 84 percent of the total median AU area. The untested areas are mainly
1. south of the producing fields to the Pictured Cliffs outcrops where the Pictured Cliffs is largely water saturated and has high water/gas ratios,
2. northeast of established producing areas where the Pictured Cliffs is tightly cemented and also displays high water/gas ratios, and
3. areas within producing fields that remain undrilled.Consequently, part of the untested area was considered
unfavorable for adding potential reserves in the next 30 years. At the minimum we estimate 14 percent of the untested area to have potential additions to reserves in the next 30 years. At the median this value is 37 percent of the untested area, and at the maximum this value is 47 percent. These values were calculated by multiplying the various percentages of untested area deemed favorable by different success ratios. New discoveries will consist of infill drilling on closer spacing, step-out drilling from existing fields, and new field discoveries from wildcat drilling—probably in the area northeast of current production. The mini-mum cutoff of 0.02 BCFG would apply to the percentage of untested cells considered to have potential additions to reserves. Total gas recovery per cell of these untested cells is estimated at 0.02 BCFG at the minimum, 0.25 BCFG at the median, and 7.0 BCFG at the maximum. The maximum of 7.0 BCFG was based on the isolated occurrences of high producing wells (fig 32).
Basin Fruitland Coalbed Gas Assessment Unit (50220182) and Fruitland Fairway Coalbed Gas Assessment Unit (50220181)
Introduction
The Fruitland Formation is divided into two assessment units because of different cumulative gas production:
1. Basin Fruitland CBG AU, which consists of over-pressured and underpressured areas, and
2. Fruitland Fairway CBG AU, which consists of an overpressured area (fig. 33).
Coal-bed-gas exploration in the Fruitland is discussed in Math-ney and Ulrich (1983) and summarized below. Gas was first identified in the Fruitland Formation in 1951 with a discovery in the Ignacio Blanco Fruitland field (fig. 33). The discovery was a
combined structural-stratigraphic trap; gas in the Fruitland was produced from sandstone beds. In 1952, gas was discovered in sandstone beds in the Fruitland Formation in the Aztec, Gal-legos, and Kutz West fields. The Los Pinos North and South fields were discovered in 1953 within the Fruitland Fairway CBG AU. In 1956, coal-bed gas was discovered in the Fruitland in the Flora Vista and Kutz fields in New Mexico, and in the Bondad field (now part of the Ignacio Blanco field) on the Bon-dad anticline in Colorado. Gas was discovered in the Fruitland at the Crouch Mesa field in 1959. No new Fruitland coal-bed-gas production was added until 1966 when the Pinion North and South fields were discovered. In 1968, Fruitland production was added from the Blanco (fig. 33) and Gallegos South fields and in 1969 coal-bed gas was discovered at the Pump Mesa field. Gas was discovered in the Fruitland in the Mt. Nebo field in 1972 and in the Sedro Canyon field in 1973. Gas production was added from the Fruitland at the Connor and Jasis fields in 1976. Most of the smaller Fruitland fields now are found within the broader area assigned to the Blanco or Ignacio-Blanco fields (fig. 33) and are not shown, because there are little data to define the old field boundaries. A review of the field descriptions (Fassett, 1978a,b) shows that most of the above fields are small, consisting of one to several wells; some of these fields no longer produce. The initial reservoir targets for production appear to have been channel sandstone and not coal, which today is the principal exploration target and producer of coal-bed gas.
This pattern of early development suggests that the initial exploration philosophy was targeted at the sandstone reservoirs and that coal as both source and reservoir of gas was not fully appreciated. An early geochemical study of gas composition in the Fruitland Formation and underlying Pictured Cliffs Sand-stone reservoirs indicated that the coals and coaly beds were the likely source of the gas (Rice, 1983); however, the Fruitland coal beds, as reservoirs, were not a major target of gas explora-tion at this time. In the 1980s, additional wells were completed in the Fruitland in various fields within both the Basin Fruitland CBG AU and the Fruitland Fairway CBG AU. It was not until the 1990s (IHS Energy, 2002) that the number of yearly well completions in the Fruitland increased to where the Fruitland Formation has become the single largest producer of natural gas in the basin.
Beginning in the late 1980s and continuing into the early 1990s, the number of geologic, geochemical, and hydrologic studies of the Fruitland increased; the results of these stud-ies provided invaluable information on the distribution and nature of the coal-bed-gas resource. Coal resources have been estimated to exceed 200 billion tons and to contain at least 50 TCFG (Kelso and other, 1987; Kelso and Wicks, 1988; Ayers and others, 1994; Rice and Finn, 1996). To date, over 4,000 wells have produced more than 8.4 TCFG from Fruitland reservoirs only (IHS Energy, 2002). This is more coal-bed gas than has been produced from any other coal-bearing formation in the nation (IHS Energy, 2002).
Coal-bed-gas production appears to be controlled by sev-eral factors that include:

56 Total Petroleum Systems and Geologic Assessment of Undiscovered Oil and Gas Resources in the San Juan Basin Province
1
10
100
1,000
10,000
0 10 20 30 40 50 60 70 80 90 100
PERCENT OF SAMPLE
ESTI
MA
TED
ULT
IMA
TE R
ECO
VERY
GA
S (M
MCF
)
Figure 31. Graph showing estimated ultimate recoveries (EUR) of Pictured Cliffs Continuous Gas Assessment Unit gas wells divided by time of completion into three nearly equal blocks of time. EUR data calculated using data from IHS Energy (2002). Data provided by T. Cook (written commun., 2002). MMCF, million cubic feet.
Figure 32. Graph showing distribution of estimated ultimate recoveries (EUR) of Pictured Cliffs Continuous Gas Assessment Unit gas wells. EUR data calculated using data from IHS Energy (2002). Data provided by T. Cook (written commun., 2002). MMCF, million cubic feet.
1
10
100
1,000
10,000
0 10 20 30 40 50 60 70 80 90 100
PERCENT OF SAMPLE
Ea r ly Avg
Middle Avg
Late AvgES
TIM
ATE
D U
LTIM
ATE
REC
OVE
RY G
AS
(MM
CF)

Fruitland Total Petroleum System 57
Fruitland TPSBoundary
Basin Fruitland Coalbed Gas AU Boundary
Fruitland Fairway Coalbed Gas AUBoundary
0 10 20 MILES
0 20 KILOMETERS10
NatomisFederal-Texaco1-11
Superior, Sealy 1-7
Sohio Southern Ute 15-16Basin axis
Ignacio anticline
antic
line
Cabresto anticline
0.50
0.60
0.8
1.0
1.5
0.60.8
1.5
Blanco
Ignacio-Blanco
San Juan Basin Boundary
Cuba
Aztec
Cortez
Dolores
Farmington
Pagosa Springs
Durango
Kmp
Kcc
Kls
Toa
Kpl
Kmv
Tmb
Kpc
Kpcl
108°108° 107°107°
36°
37°COLORADO
NEW MEXICO
Figure 33. Map showing the assessment unit (AU) boundaries for the Basin Fruitland Coalbed Gas (green line) and Fruitland Fairway Coalbed Gas (blue line) Assessment Units and major gas fields Blanco (purple) and Ignacio-Blanco (yellow) in the Fruitland Formation. Also shown are the locations of the regional cross section (see fig. 4), principal folds in the basin, and wells (green and black triangles) used to make the burial history curves in this report (figs. 10). Symbols for geologic map units: Toa, Tertiary Ojo Alamo Sandstone; Tmb, Tertiary Miocene volcanics; Kpc, Pictured Cliffs Sandstone; Kpcl, Pictured Cliffs Sandstone and Lewis Shale; Kls, Lewis Shale; Kcc, Crevasse Canyon Formation; Kmp, Menefee Formation and Point Lookout Sandstone; Kmv, Mesaverde Group; Kpl, Point Lookout Sandstone; thin red vertical lines and patches, dikes (Green, 1992; Green and Jones, 1997). Contours (gray) show vitrinite reflectance (Rm) values, in percent, from data in Fassett and Nuccio (1990), Law (1992), and Fassett (2000). TPS, Total Petroleum System.

58 Total Petroleum Systems and Geologic Assessment of Undiscovered Oil and Gas Resources in the San Juan Basin Province
1. coal-bed thickness, which is controlled by the deposi-tional history;
2. coal maturation; 3. structural history, which affects the degree of fractur-
ing and cleat development;4. composition or maceral type; and 5. hydrologic history.
These controls were previously discussed. Although natural fractures or cleats are found in all the coals, the cleat density appears to increase in areas where tectonic features such as faults, folds, or lineaments are better developed (Fassett, 1991). Wells are completed using either hydraulic fracturing or open-hole cavity techniques.
The area of overpressure is not equally gas rich through-out its extent. The most gas-rich area does, in fact, lie within the Fruitland Fairway CBG AU, and there are geologic reasons why the overpressured area north of the Fruitland Fairway is not as gas rich as the Fruitland Fairway. Thus, had the over-pressured area been treated as a single assessment unit, as was done in the 1995 USGS assessment (Rice and Finn, 1996), the current methodology, which uses a cell approach for contin-uous-type resources (Schmoker, 1996), would have probably overestimated the relative gas richness because production data from the gas-rich Fruitland Fairway would have skewed the resource model.
Production Characteristics of the Basin Fruitland Coalbed Gas and Fruitland Fairway Coalbed Gas Assessment Units
Water Production
Coal-bed-gas production and economics is affected by the quantity of water produced with the gas. The distribution of cumulative water production shows marked differences between the Basin Fruitland CBG and Fruitland Fairway CBG AUs (fig. 34), and within the Basin Fruitland CBG AU there are marked differences between the overpressured area north of the Fruitland Fairway and the underpressured and transi-tional pressured areas south and east of the Fruitland Fairway (fig. 34). Plots of cumulative water production versus total production time for both the Basin Fruitland CBG and Fruit-land Fairway CBG AUs show three populations of cumulative water production (figs. 35A and 35B). Similar population dis-tributions are observed in plots (not shown) where water pro-duction was normalized to production time. The first popula-tion is from 0 to 60 months of production, usually the time of greatest dewatering. In the Fruitland Fairway CBG AU, cumu-lative water production for this population is generally less than 100,000 barrels, whereas in the Basin Fruitland CBG AU, it is generally less than 200,000 barrels. In the Basin Fruitland CBG AU, wells with higher cumulative water production in the same population are from the overpressured area.
The greatest amount of cumulative produced water is from wells that have been on production between 85 and
220 months in the Basin Fruitland CBG and between 85 and 180 months in the Fruitland Fairway CBG AUs (figs. 35A and 35B). This is to be expected because of the longer produc-tion history. In the Basin Fruitland CBG AU, cumulative water production for this population is generally less than 1,000,000 barrels for most wells. A small number of wells have produced between 1,000,000 and 2,000,000 barrels of water; all but four of these occur in the overpressured area north of the Fruitland Fairway CBG AU (figs. 34 and 35A). Nine wells have produced in excess of 3,000,000 barrels of water; these wells lie close to the northern margin of the Basin Fruitland CBG AU (figs. 34 and 35A) within groundwater flow paths, defined by water d18O values between –16 and –15 per mil, that are most geologically recent.
In the Fruitland Fairway CBG AU, cumulative water production for the population of wells producing between 85 and 180 months is generally less than 500,000 bar-rels (fig. 35B). A small number of wells have cumulative water production between 500,000 and 1,000,000 barrels. These wells are scattered throughout the western, central, and southeastern parts of the AU. Five wells have cumula-tive water production greater than 1,000,000 and less than 3,000,000 barrels; four of these are clustered in the southeast part of the AU, at the southeast end of defined overpressure (fig. 12), and one is found in the northwest part of the AU (figs. 34 and 35B).
Except for several wells in the Basin Fruitland CBG AU, wells that have been in production more than 220 months in the Basin Fruitland CBG AU and more than 180 months in the Fruitland Fairway CBG AU have cumulative water production less than 100,000 barrels (figs. 35A and 35B). Many wells in the Basin Fruitland CBG AU for this popula-tion have reported zero produced water. Whether this is real or an artifact of reporting or past-required reporting practices for these wells is unknown. Most of these wells are located in the Aztec field, which is the oldest producing Fruitland field (fig. 34).
Cumulative Gas Production
Fruitland gas production data were examined in order to evaluate the regional variability as a function of
1. length of production time, 2. position in the Fruitland depositional system, 3. thermal maturity of the coals, 4. past and present structural position in the basin, and 5. post-depositional hydrodynamic processes.
Both cumulative and normalized (cumulative production/total months of production) data were evaluated as were the lengths of time the wells had been producing. The data were then examined within the context of
1. geographic position within the depositional system (fluvial or coastal),
2. net thickness of coal,

Fruitland Total Petroleum System 59
Fruitland Fairway Coalbed Gas AUboundary
EXPLANATION
Cummulative water production, barrels
0–5,0005,001–10,00010,001–15,00015,001–25,000
25,001–50,000
50,001–100,000100,001–1,000,0001,000,001–3,000,0003,000,001–10,000,000
0 5 10 15 20 MILES
0 20 KILOMETERS5 10 15
Farmington
Durango
Basin FruitlandCoalbed Gas AU boundary
Aztecfield
SANDOVAL
MCKINLEY
SAN JUAN
RIO ARRIBA
ARCHULETALAPLATAMONTEZUMA
COLORADONEW MEXICO
37°
108° 107°
36°
Figure 34. Map showing distribution of cumulative produced water in the Fruitland Formation with respect to the Basin Fruitland Coalbed Gas and Fruitland Fairway Coalbed Gas Assessment Units (AU). Production data from IHS Energy Group (2002).

60 Total Petroleum Systems and Geologic Assessment of Undiscovered Oil and Gas Resources in the San Juan Basin Province
PRODUCTION TIME (MONTHS)
0
1,000,000
2,000,000
3,000,000
4,000,000
5,000,000
6,000,000
7,000,000CU
MUL
ATIV
E W
ATER
PRO
DUCT
ION
(BAR
RELS
)
420 480 540 6000 60 120 180 240 300 360
A
Figure 35. Graphs showing relation between cumulative water production and length of production. Production data from IHS Energy Group (2002). (A) Basin Fruitland Coalbed Gas Assessment Unit. (B) Fruitland Fairway Coalbed Gas Assessment Unit.
0 60 120 180 240 300 360
PRODUCTION TIME (MONTHS)
500,000
1,000,000
1,500,000
2,000,000
2,500,000
3,000,000
CUM
ULA
TIVE
WA
TER
(BA
RREL
S)
0
B

Fruitland Total Petroleum System 61
3. time as related to position of the various Pictured Cliffs shorelines, and
4. geographic position with respect to the regional δ18O- and δD-isotope patterns in co-produced waters.
The various relations among gas and water production (cumu-lative, normalized, and production time) and the regional patterns of
1. oxygen and deuterium isotopes in produced waters, 2. d13C of methane and carbon dioxide in the gases,
and 3. gas wetness (C1/SC1–C5) were analyzed in order to
evaluate the model (Scott, 1994; Scott and others, 1994a,b) of late-stage microbial-gas generation and its contribution to overall gas resources.
Most Fruitland wells have produced gas from 61 to 180 months (fig. 36). A comparison of cumulative gas produc-tion versus length of production shows some interesting differ-ences between the Basin Fruitland CBG AU and the Fruitland Fairway CBG AU (figs. 37A and 37B). In both AUs, the greatest production is from wells that have been on production from 84 to 168 months. Wells that have produced for longer than 168 months are mainly in the Basin Fruitland CBG AU (fig. 37A) and do not show significant increased gas production with time. These older wells tend to be low volume gas producers, sug-gesting that the areas of production may not be as rich in gas resources as elsewhere in the Fruitland or that early wells were not completed as well as later wells. Although cumulative gas production does show an overall increase up to 168 months, there is no linear correlation between length of production and cumulative production. The lack of correlation reflects the vari-ability of the coal reservoirs and their adsorbed gas content. This variability is the ultimate control on potential gas resources and is more likely related to local geologic factors. Post-depositional hydrodynamic conditions may actually be a detriment to gas production for some wells in the overpressured part of the Basin Fruitland CBG AU because the increased volume of produced water may not allow for effective dewatering.
A map of cumulative gas production (independent of length of production) for the Basin Fruitland CBG and Fruit-land Fairway CBG AUs shows that, overall, the best producing wells (greater than 1 BCFG cumulative production) are within the Fruitland Fairway AU (fig. 38). However within the Basin Fruitland CBG AU, there are several areas where production exceeds one BCFG per well (fig. 38). Some of these wells are located adjacent to the northern, southern, and western margins of the Fruitland Fairway CBG AU and probably should have been included in that AU. However, there are several areas in the overpressured area well north of the Fruitland Fairway CBG AU in Colorado, notably along and near parts of the Animas, Florida, and Los Pinos Rivers (see fig. 11 for location) that have cumulative production exceeding 1 BCFG. The latter observa-tion suggests that gas might be carried in groundwater that eventually discharges to these rivers in the subsurface (Cox and others, 2001). Wells along these flow paths could be producing thermal gas that is desorption from coal or dissolved in ground-water, or mixed with late-stage microbial gas. These wells are
also associated with northeast trends in thick net coal (fig. 5) and most have produced for more than 120 months (figs. 36 and 38). In the Basin Fruitland CBG AU, south of the Fruitland Fair-way CBG AU, there are three areas with greater than 1 BCFG cumulative production. These areas are along the La Plata River, in the Kutz field and southeast of Farmington, N. Mex. (fig. 38). The latter areas are associated with the older Fruitland fields, such as Aztec and Kutz (IHS Energy Group, 2002).
Visual comparison of cumulative gas production between the overpressured part of the Basin Fruitland CBG AU and the Fruitland Fairway CBG AU for similar lengths of production time (figs. 36 and 38) demonstrates the enhanced gas richness of the Fruitland Fairway AU. Except for a few areas in the overpressured part of the Basin Fruitland AU, both the Fruit-land Fairway CBG AU and the overpressured part of the Basin Fruitland CBG AU have similar ranges in cumulative produced water (independent of time) (fig. 34). Areas of high cumulative gas production in the overpressured part of the Fruitland are associated with thick coal trends, although net coal thickness tends to be greater overall in the Fruitland Fairway AU. During gas generation in the Oligocene and Miocene, gas generated from coals in the overpressured part of the Basin Fruitland CBG AU would have been dry, and based on coal rank, more gas per equivalent volume of coal should have been generated compared to gas from slightly lower rank coals in the Fruitland Fairway CBG AU.
The rate of methane production from coals has been docu-mented to increase with coal rank (Das and others, 1991). Fac-tors that affect the amount of gas that can be stored, as adsorbed or free gas, in a coal seam include surface area, pore volume, and cleat and fracture development. Although high rank coals have less surface area to adsorb gas compared to low rank coals because more gas is generated at higher rank, the high rank coals are better reservoirs (Das and others, 1991). High rank coals tend to be more brittle and to develop better cleats and fractures for a given maceral composition than low rank coals, and thus, have greater area to store free gas. Moreover, carbon contents are above 91 percent and pore volume (capacity to store gas) increases in high rank coals (Das and others, 1991). Given these factors and assuming no significant change in mac-eral composition throughout the entire overpressured area, the northern part of the Basin Fruitland CBG AU should have been as rich or richer in initial gas resources as the Fruitland Fairway CBG AU in areas of similar net coal thickness. If the Fruit-land Fairway CBG AU gas production has been augmented by methane carried in solution by south-flowing waters (Scott and others, 1994b), then one might expect to see a north to south gradient in cumulative gas production for equivalent periods of production time. Maps of cumulative gas production and production time do not appear to support this general hypothesis (figs. 36 and 38).
The underpressured part of the Basin Fruitland CBG AU is found mainly in New Mexico. Except as mentioned above, most wells in the underpressured part of this AU have produced 1 BCFG or less, and of these, the majority has produced less than 0.5 BCFG (fig. 38). Production from this part of the Fruit-land occurs in low rank coals (less than 0.75-percent Rm), and

62 Total Petroleum Systems and Geologic Assessment of Undiscovered Oil and Gas Resources in the San Juan Basin Province
EXPLANATION
Number months on production
0−12
13−36
61−120 361−615
241−300
37−60
121−180
181−240
301−360
Fruitland FairwayCoalbed Gas AUboundary
Basin Fruitland Coalbed Gas AU boundary
0 5 10 15 20 MILES
0 20 KILOMETERS5 10 15
Farmington
Durango
MCKINLEY
SANDOVAL
RIO ARRIBA
SAN JUAN
ARCHULETA
LAPLATA
MONTEZUMA
COLORADO
NEW MEXICO37°
108° 107°
36°
Figure 36. Map showing distribution of length of production time of Fruitland Formation wells with respect to the Basin Fruitland Coalbed Gas and Fruitland Fairway Coalbed Gas Assessment Units (AU). Production data from IHS Energy Group (2002).

Fruitland Total Petroleum System 63
Figure 37. Graphs showing relation between cumulative gas production and length of production. Production data from IHS Energy Group (2002). MCF, thousand cubic feet. (A) Basin Fruitland Coalbed Gas Assessment Unit. (B) Fruitland Fairway Coalbed Gas Assessment Unit.
5,000,000
10,000,000
15,000,000
20,000,000
25,000,000
00 60 120 180 240 300 360 420 480 540 60012 36
PRODUCTION TIME (MONTHS)
CUM
ULAT
IVE
GAS
PROD
UCTI
ON (M
CF)
A
0 60 120 180 240 300
PRODUCTION TIME (MONTHS)
12 36
5,000,000
10,000,000
15,000,000
20,000,000
25,000,000
30,000,000
35,000,000
40,000,000
45,000,000
CUM
ULAT
IVE
GAS
PROD
UCTI
ON (M
CF)
0
B

64 Total Petroleum Systems and Geologic Assessment of Undiscovered Oil and Gas Resources in the San Juan Basin Province
EXPLANATION
Cummulative gas values, BCF
0−0.5
0.5−1.0
1.0−1.5
1.5−2.0
2.0−2.5
2.5−3.0
3.0−5.0
5.0−7.0
7.0−9.0
9.0−15.0
15.0−20.0
>20.0
Fruitland Fairway Coalbed Gas AUboundary
Basin Fruitland Coalbed Gas AU boundary
Area of LaPlataRiver
Aztecfield
Kutz Field
0 5 10 15 20 MILES
0 20 KILOMETERS5 10 15
Farmington
Durango
COLORADO
NEW MEXICO
SANDOVAL
MCKINLEY
SAN JUAN
RIO ARRIBA
ARCHULETALAPLATAMONTEZUMA
37°
108° 107°
36°
Figure 38. Map showing distribution of cumulative gas production (independent of length of production time) of Fruitland Formation wells with respect to the Basin Fruitland Coalbed Gas and Fruitland Fairway Coalbed Gas Assessment Units (AU). Production data from IHS Energy Group (2002). BCF, billion cubic feet.

Fruitland Total Petroleum System 65
overall net coal thickness is lower. The coals in this part of the Fruitland would be expected to contain less gas resources than higher rank coal beds to the north. In contrast, cumulative gas production from the overpressured part of the Basin Fruitland CBG AU is regionally more variable. Areas immediately north and northeast of the Fruitland Fairway CBG AU and along the west and north margins of the Basin Fruitland CBG AU are characterized by wells that have produced 1 BCFG or less. As in the underpressured area south of the Fruitland Fairway CBG AU, the majority of these wells have produced 0.5 BCFG or less to date. The low production may reflect length of pro-duction; most of the wells have been producing from 13 to 120 months (fig. 36). On the east side of the AU, low produc-tion may also be related to thin net coal (fig. 5).
Normalized Gas Production
Cumulative gas production data are independent of the length of time of production. In order to deal with the variabil-ity of production time, production data were normalized over the entire range of production time. This allows for a more realistic evaluation of the potential gas richness of an area. It was not possible to compute normalized monthly data for all wells, because in some cases the first production date was missing from the IHS Energy database (IHS Energy Group, 2002); therefore, the distribution of cumulative and normal-ized production data analyzed is not the same. The normalized monthly gas production data range from less than 1 MMCFG per month to nearly 0.5 BCFG per month (fig. 39). Crossplots of normalized monthly gas production versus length of pro-duction for the Basin Fruitland CBG and Fruitland Fairway CBG AUs show two distinct populations (figs. 40A and 40B), similar to the crossplots of cumulative gas production versus production time. These distinct populations correspond to 0 to 60 months and greater than 84 months of production. There is no linear correlation between normalized monthly gas produc-tion and length of production time. The lack of correlation reflects the variability of the coal reservoirs and their adsorbed gas content and water production. This variability is the ulti-mate control on potential gas resources and is related to local geologic factors.
In the Basin Fruitland CBG AU, normalized monthly gas production is commonly less than 10 MMCF, except for a few areas, mostly in the overpressured part of the AU (fig. 39). These latter areas are associated with courses of the Los Pinos, Animas, and Florida Rivers (see fig. 11 for location), and wells in this area have produced for longer periods of time. Within past groundwater flow paths as defined by d18O values, there is a tendency for normalized monthly production (and cumulative gas production) to decrease from north to south in the direction of isotopically heavier water (figs. 10, 38, and 39). An exception is the area immediately north of the west part of the Fruitland Fairway CBG AU. In this area, one well with high normalized monthly production data is in the Basin Fruitland CBG AU (but perhaps should have been included in the Fruitland Fairway AU); it has produced for 48 months.
Although there is no linear correlation between cumula-tive or normalized gas production and length of production, there is a linear correlation between cumulative gas and nor-malized gas production. This should be expected. However, rather than a single linear correlation, the data for both the Basin Fruitland AU and Fruitland Fairway AU show two dis-tinct linear correlations (figs. 41A and 41B). These correlations correspond to the 0–60 months and greater than 84 months of production. The difference in slope of the data may reflect the time of major dewatering, which generally occurs in the first 60 months of a well’s production history. During the period of major dewatering, cumulative gas production and correspond-ingly normalized monthly production should grow at a rate slower than later in the life of a well.
Relations Among Gas, Water Production, Groundwater Flow, and Microbial-Gas Generation
Cumulative and normalized gas production for wells differ significantly between the overpressured Basin Fruitland and Fruitland Fairway CBG AUs and do not show strong gradients that are coincident with groundwater flow, and hence augmentation of gas content by late-stage microbial gas, except close to the northern and western basin margins near major rivers. Ayers and others (1994) have suggested that the southern boundary of the Fruitland Fairway is bounded by a structural hingeline, which controls the southern extent of overpressure, and high water and high gas production. Water production in the overpressured part of the Basin Fruitland and Fruitland Fairway AUs is similar and quite dissimilar to the underpressured part of the Basin Fruitland CBG AU (fig. 34). This change in water production appears to correspond with a change in coal geometry (fig. 5) and is probably influenced more by paleoshoreline position in the Pictured Cliffs Sandstone rather than being influenced by any structural hingeline. The southern boundary of the Fruitland Fairway CBG AU in some areas approximates the position of the 2,400-ft contour of the Huerfanito Bentonite Bed (fig. 42) (Fassett, 2000), and thus is north of the proposed structural hingeline that subparallels the 2,600-ft contour (Ayers and others, 1994). Steepening of the Huerfanito contours occurs from 3,000 to 2,500 ft, south of the Fruitland Fairway, and might actually represent a mid-Paleocene to late Eocene Laramide tectonic event (Fassett, 2000). Between structure contour 2,400 and 2,150 ft (interpolated) (fig. 42), the pres-ent dip of the Huerfanito flattens in the eastern part of the TPS. The flattening of the gradient in this area, coupled with a significant change in sandstone and coal geometry in the Fruitland, may make it more difficult to move fluids up and out of the basin to the south. However, this argument does not hold for the western half of the Fruitland Fairway, which climbs structurally higher to the southwest. The lack of strong correspondence of the Fruitland Fairway CBG AU high gas production area to structure, as well as to later groundwater

66 Total Petroleum Systems and Geologic Assessment of Undiscovered Oil and Gas Resources in the San Juan Basin Province
0 5 10 15 20 MILES
0 20 KILOMETERS5 10 15
Farmington
Durango
Fruitland Fairway Coalbed AUboundary
Basin Fruitland Coalbed GasAU boundary
EXPLANATION
Normalized gas values, MCF/month
2–1,000
1,001–10,000
10,001–50,000
50,001–100,000
100,001–150,000
250,001–300,000
200,001–250,000
150,001–200,000
300,001–350,000
450,001–500,000
NEW MEXICO
COLORADO
MCKINLEY
SAN JUAN
SANDOVAL
RIO ARRIBA
ARCHULETA
LAPLATA
MONTEZUMA
36°
37°
108° 107°
Figure 39. Map showing distribution of normalized (cumulative gas/number of months of production) gas production of Fruitland Formation wells with respect to the Basin Fruitland Coalbed Gas and Fruitland Fairway Coalbed Gas Assessment Units (AU). Production data from IHS Energy Group (2002). MCF, thousand cubic feet.

Fruitland Total Petroleum System 67
0
50,000
100,000
150,000
200,000
250,000
300,000
350,000
400,000
450,000
NO
RMA
LIZE
D G
AS
PRO
DU
CTIO
N (M
CF/M
ON
TH)
0 60 120 180 240 300 360 420 480 540 600
PRODUCTION TIME (MONTHS)
12 36
500,000
A
PRODUCTION TIME (MONTHS)
0
50,000
100,000
150,000
200,000
250,000
300,000
0 60 120 180 240 30012 36
350,000
400,000
NO
RMA
LIZE
D G
AS
PRO
DU
CTIO
N (M
CF/M
ON
TH)
B
Figure 40. Graphs showing relation between normalized (cumulative gas/number of months of production) gas production and length of production. Production data from IHS Energy Group (2002). MCF, thousand cubic feet. (A) Basin Fruitland Coalbed Gas Assessment Unit. (B) Fruitland Fairway Coalbed Gas Assessment Unit.

68 Total Petroleum Systems and Geologic Assessment of Undiscovered Oil and Gas Resources in the San Juan Basin Province
0 50,000 100,000 150,000 200,000 250,000 300,000 350,000 400,000 450,000 500,000
NORMALIZED GAS PRODUCTION (MCF/MONTH)
0
5,000,000
10,000,000
15,000,000
20,000,000
25,000,000
30,000,000
35,000,000
40,000,000
45,000,000
CUM
ULAT
IVE
GAS
PROD
UCTI
ON (M
CF)
ACU
MUL
ATIV
E GA
S PR
ODUC
TION
(MCF
)
0 50,000 100,000 150,000 200,000 250,000 300,000 350,000 400,000
5,000,000
10,000,000
15,000,000
20,000,000
25,000,000
30,000,000
35,000,000
40,000,000
45,000,000
NORMALIZED GAS PRODUCTION (MCF/MONTH)
0
B
Figure 41. Graphs showing relation between cumulative gas production and normalized (cumulative gas/number of months of production) gas production for production time 0–60 months (green line) and >83 months (red line). Production data from IHS Energy Group (2002). MCF, thousand cubic feet. (A) Basin Fruitland Coalbed Gas Assessment Unit. (B) Fruitland Fairway Coalbed Gas Assessment Unit.

Fruitland Total Petroleum System 69
6,000
5,500
5,000
4,500
4,000
3,500
3,000
2,5002,700
2,8002,900
2,100
3,000
3,5004,000
4,5005,000
3,500
4,500
5,000 6,000
EXPLANATION
Basin Fruitland Coalbed Gas AU boundary
Fruitland Fairway Coalbed Gas AU boundary
5,000 Structure contour on top of Huerfanito Bentonite Bed
Contour interval = 500 ft, light purple linesContour interval = 100 ft, black lines
2,400
2,2002,300
2,600
Durango
Dulce
Cuba
Farmington
MONTEZUMA
LA PLATA
SAN JUAN
MCKINLEY
SANDOVAL
RIO ARRIBA
ARCHULETA
COLORADO
NEW MEXICO
0 5 10 15 20 MILES
0 20 KILOMETERS5 10 15
37°
37°
108° 107°
Figure 42. Map showing relation between basin structure, contoured on top of the Huerfanito Bentonite Bed of Lewis Shale, and the Fruitland Fairway Coalbed Gas Assessment Unit (AU) (purple). Modified from Fassett (2000).

70 Total Petroleum Systems and Geologic Assessment of Undiscovered Oil and Gas Resources in the San Juan Basin Province
flow patterns, suggests that the overall gas content in the Fruitland Fairway CBG AU is controlled by factors associated with the depositional environments. Factors such as migration of gas or generation of late-stage microbial gas, or oxidation of methane (Gorody, 2001), while important in some areas of the overpressured Basin Fruitland CBG AU, might actually be less important in the Fruitland Fairway CBG AU, except along the extreme western part.
It was suggested, herein, that some of the evidence of microbial-gas generation (for example, heavy bicarbonate waters and small range in d13C of methane) could be related to an early (pre-thermal gas) stage of microbial-gas generation. These observations, based on 129I/I ages and d18O isotopes of the produced water, are especially pertinent to areas south of the Fruitland Fairway CBG AU in the transition and underpres-sured areas as well as to areas in part of the Fruitland Fairway CBG AU. An early stage of microbial gas, formed under the right hydrodynamic and trapping conditions and mixed with later thermal-generated gas, will look similar to a late-generated microbial gas that mixed with an earlier thermal-generated gas. However, the two processes would not be time equivalent. Thus, it is possible that the late-stage microbial gas observed closer to the northern and western outcrop is unrelated to microbial-gas processes observed elsewhere in the Basin Fruitland and Fruit-land Fairway CBG AUs.
Basin Fruitland Coalbed Gas Assessment Unit (50220182)
Introduction
In previous studies, the Fruitland Formation was divided into two areas:
1. overpressured and 2. transitional pressured to underpressured (Kaiser and
others, 1994; Rice and Finn, 1996). Past studies have examined production histories and changes in gas composition between the overpressured and underpressured transition areas (Scott, 1994; Scott and others, 1994b; Rice and Finn, 1996) and have documented real dif-ferences. For this assessment, the boundary between the Basin Fruitland and the Fruitland Fairway was drawn using gas production characteristics, as discussed above, rather than using the area of overpressure. The Basin Fruitland CBG AU was drawn to include the area basinward of the Fruitland Forma-tion outcrops and includes all of the transitional pressured and underpressured reservoirs in addition to that portion of the over-pressured area not included in the Fruitland Fairway CBG AU (fig. 43). This AU differs from any single Fruitland coal-bed gas play in the 1995 USGS National Oil and Gas Assessment (Rice and Finn, 1996) in that it combines the San Juan Basin-Under-pressured Discharge Play, San Juan Basin-Underpressured Play, and the northern part of the San Juan Basin-Overpressured Play into one AU. Current well spacing is at 160 acres.
Production is mostly controlled by net coal thickness, degree of cleat development, thermal history, and, in the overpressured area, by the volume of water produced. Cumula-tive gas production is generally higher in the overpressured area compared to the underpressured area for wells producing for the same length of time, but in both areas it is much less than that observed in the Fruitland Fairway CBG AU (fig. 38). Normalized gas production is generally less than 10,000 thou-sand cubic feet (MCF) per month in the AU, except in that part of the overpressured area that is associated with thick net coal (fig. 39). Cumulative water production is significantly higher in the overpressured part of the AU compared to the underpres-sured part and is similar to that produced from the Fruitland Fairway (fig. 34). Wells with the highest cumulative water production in the overpressured area are located closer to the outcrop or courses of rivers. This high water production might have an effect on cumulative and normalized gas production value because the coals cannot be dewatered as rapidly under artesian conditions. The pattern of high water production in the overpressured area tends to correspond to areas with thicker net coal rather than to directions of inferred post-depositional groundwater flow (figs. 5, 11, and 33). Those areas with less water production correspond to areas with thinner net coal and are similar to values observed in wells in the underpressured area, which is also characterized by net coal generally <45 ft thick. Key parameters of the Basin Fruitland Continuous Gas AU are listed below and are summarized on figure 44.
Source
Fruitland coal beds
Maturation
Late Eocene to middle Miocene for thermal gas. Late Cretaceous to early middle Eocene for possible early micro-bial gas. Pliocene to Holocene for late-stage microbial gas (fig. 44).
Migration
The principal reservoirs in the Fruitland Formation are the coals, although production also occurs in sandstone channels. Coals (exclusive of cleats) have low porosity and virtually no permeability, and thus the gases are sorbed onto the coal structure (Scott, 1994). This means that initially most of the coal-bed gas is essentially generated in place and has not migrated. However, migration of gas from the coal into other reservoirs, such as the interbedded sandstones, has occurred when pressure decreased below the sorptive capac-ity of the coal at a given temperature. Usually this occurs during production but may also have occurred in the geologic past during periods of uplift and erosion. Migration of coal-derived gas may also occur by diffusion, and if it enters the

Fruitland Total Petroleum System 71
FRUITLAND TPSBOUNDARY
KmpKmp
Kcc
Kls
Toa
Kpl
Kmv
Tmb
Kpc
KpclKpcl
Superior, Sealy 1-7
Sohio Southern Ute 15-16Basin axis
Ignacio anticline
antic
line
Cabresto anticline
Cuba
Aztec
Cortez
DurangoDurango
Dolores
Farmington
Pagosa Springs
Blanco
COLORADONEW MEXICO
SAN JUAN BASIN BOUNDARY
108° 107°
36°
37°
BASIN FRUITLAND COALBEDAU BOUNDARY
BASIN FRUITLAND COALBEDAU BOUNDARY
0 5 10 15 20 MILES
0 20 KILOMETERS5 10 15
0.50
0.60
1.0
1.5
0.60.8
1.5
0.8
NatomisFederal-Texaco1-11
1
3 4
78
2
56
9
1011
1213
1415
1617
18
1920
Ignacio-Blanco
Figure 43. Map showing the assessment unit (AU) boundaries for the Basin Fruitland Coalbed Gas AU (green) and the Basin Fruitland gas fields. Ignacio Blanco gas field (yellow). Blanco gas field (lavender). Symbols for geologic map units: Toa, Tertiary Ojo Alamo Sandstone; Tmb, Tertiary Miocene volcanics; Kpc, Pictured Cliffs Sandstone; Kpcl, Pictured Cliffs Sandstone and Lewis Shale; Kls, Lewis Shale; Kcc, Crevasse Canyon Formation; Kmp, Menefee Formation and Point Lookout Sandstone; Kmv, Mesaverde Group; Kpl, Point Lookout Sandstone; thin red vertical lines and patches, dikes (Green, 1992; Green and Jones, 1997). Thermal maturity contours (gray) show vitrinite reflectance (Rm) values contoured from data in Fassett and Nuccio (1990), Law (1992), and Fassett (2000). Also shown are the locations of the regional cross section A–A’ (see fig. 4), principal folds in the basin, and location of wells (green and black triangles) used to make the burial history curves in this report (figs. 10A–C). TPS, Total Petroleum System.

72
Total Petroleum System
s and Geologic A
ssessment of U
ndiscovered Oil and G
as Resources in the San Juan Basin Province
Figure 44. Events chart that shows key geologic events for the Basin Fruitland Coalbed Gas Assessment Unit. Black arrow, critical moment (Magoon and Dow, 1994) for gas generation. TRIAS., Triassic; PALEO., Paleocene; OLIG., Oligocene; QUAT., Quaternary; Po, Pliocene; Ps, Pleistocene; E, early; M, middle; L, late. Geologic time scale is from the Geological Society of America web page http://www.geosociety.org/science/timescale/timescl.htm, last accessed 2/1/2008, and from Berggren and others (1995).
RESERVOIR ROCK
?????
Possible early microbial-generated gas
Thermal gas
Secondary microbial-generated gas
?
EXPLANATION
PETROLEUMSYSTEM EVENTS
GEOLOGIC TIME
SCALE
MIOCENEOLIG.EOCENEPALEO. Po
CENOZOICMESOZOICTERTIARY
E LEE MM LL
QUAT.JURASSIC CRETACEOUS
Ps
01020304050607075100150200250
E L LME E L E M L
CRITICAL MOMENTPRESERVATION
SOURCE ROCK
SEAL ROCK
OVERBURDEN ROCKTRAP FORMATION
GENERATION-MIGRATION-
ACCUMULATION
Stratigraphic Structural (Laramide)
TRIAS.

Fruitland Total Petroleum System 73
hydrologic regime, the gas may dissolve in the water and thus be transported to other sites of accumulation. The regional changes in composition of Fruitland gas suggest some migra-tion of gases has occurred (Scott, 1994). It has been proposed that this migrated gas might also be sorbed onto the coal matrix, under the right reservoir pressure and temperature conditions (Scott and others, 1994b).
Reservoirs
The principal reservoirs in the Fruitland Formation are the coal beds, although production may be from interbedded sandstone channel beds.
Traps/Seals
Several types of traps form in Fruitland reservoirs; each trap varies in magnitude or areal extent. At the smallest scale, the coals in the Fruitland serve not only as the source of the produced gas in the Fruitland but also as the trap and reser-voir. At larger scales, the heterogeneous character of coal-bed reservoirs tends to form compartments. The compartments may form when one or possibly both cleat directions are closed or nearly closed as a result of tectonic stress (Shuck and others, 1996). Directions of tectonic stress primarily control the degree of development of the cleat system and direction of cleat development; however, coal rank and coal matrix com-position (maceral type) also have been shown to be important (Tremain and others, 1994). Other compartments may form as a result of intersecting faults or lateral pinchout of coal beds. Folds do not appear to control coal-gas accumulation, but fractures and faults associated with development of folds do affect permeability (Kaiser and Ayers, 1994). Seals in Fruit-land reservoirs may be
1. closed cleats due to tectonic stress, 2. cemented faults, 3. interbedded tightly cemented sandstone reservoirs
that are not fractured, and 4. interbedded low permeability shale or mud-
stone beds.
Geologic Model
The Basin Fruitland Assessment Unit includes large areas that are overpressured or underpressured and some areas that are of normal pressure. The overpressured area generally is of higher thermal maturity compared to other areas. Both wet and dry gases are found in underpressured to normally pressured areas. Isotopically lighter methane gases are confined to the northern and southern basin margins. Lower CO2 content is found in both the overpressured and underpressured areas of the AU. Gas in the Basin Fruitland was generated essentially in place, although in some areas gas resources may contain a
component that is related to migration of gas in groundwater during various stages of gas generation.
Volumetrically most of the gas produced from the Basin Fruitland CBG AU is probably of thermogenic origin and mostly generated in place, with maximum generation in the late Oligocene when the basin axis was north of its present location. The period of thermal-gas generation ranged from late Eocene through middle Miocene. Gas throughout the AU, in all three pressure regimes, is a variable mixture of thermogenic and microbial (early or late; fig. 44) as evidenced by the d13C values of methane, carbon dioxide, and bicarbon-ate. Early microbial-gas generation (fig. 44) is conjectural but is supported by some geochemical evidence previously presented. There appears to be some component of northward flow in the Fruitland at least into the Paleocene and possibly as late as the Miocene and a southward flow in the overpressured area in the Paleocene or early Eocene. Late-stage microbial-gas generation (fig. 44) may be confined to the near-outcrop areas along the northern and western rims of the basin. The presence of isotopically heavy bicarbonate produced water and mixed-isotope signatures of methane and carbon diox-ide appears to be ubiquitous throughout the Fruitland. These observations don’t necessarily require a young (more recent) age for occurrence.
Assessment Results
The Basin Fruitland Coalbed Gas AU was assessed to have undiscovered resources of 19,594.74 billion cubic feet of gas (BCFG) and 0 million barrels of natural gas liquids (MMBNGL) at the mean. The volumes of undiscovered oil, gas, and natural gas liquids estimated in 2002 for the Basin Fruitland CBG AU are shown in appendix A. The Basin Fruitland Assessment Unit encompasses an area of 3,926,000 acres at the median, 3,825,000 acres at the mini-mum, and 4,027,000 acres at the maximum extent of the AU. There is adequate charge; favorable reservoirs, traps, and seals at least over most of the area; and favorable timing for charg-ing the reservoirs with greater than the minimum recovery of 0.02 BCFG. A summary of the input data of the AU is pre-sented on the data form in appendix C.
There were 4,102 tested cells (wells that have produced or had some other production test, such as initial production test, drill stem test, or core analysis). A 0.02 BCFG recovery cutoff was used per cell. Applying this cutoff, 3,690 tested cells equaled or exceeded this cutoff. If the production history of the Basin Fruitland CBG AU is divided into nearly three equal discovery time periods, plots of the estimated ultimate recoveries (EUR) indicate that the middle time period has the best EUR distribution, overall, and the best median total recovery (1.1 BCFG) per cell (fig. 45). This may reflect a bet-ter understanding of how to explore for and develop coal-bed gas resources, compared to the first time period. Recoveries have declined in the last-third time period, perhaps reflecting that the best overall producing areas have been found. The

74 Total Petroleum Systems and Geologic Assessment of Undiscovered Oil and Gas Resources in the San Juan Basin Province
EUR distribution for the Basin Fruitland CBG AU (fig. 46) shows a median total recovery per cell of 0.6 BCFG.
The untested part of the AU was evaluated geologically. In the eastern and southern part of the AU, there are areas of thin net coal (fig. 5), low permeability coals, and less well-developed cleat and fracture systems. A poorly developed cleat and fracture network coupled with thin net coal could make some areas less favorable for development because of the greater difficulty in producing the gas. Wells in this area might also produce lower volumes of gas compared to other parts of the AU. Although there are some isolated areas of gas produc-tion from coals on the east side of the AU (fig. 38), much of that area remains open for exploration. A similar case can be made in the southern part of the AU where large tracts of land have yet to be tested. Some of these areas are associated with thin net coal (fig. 5). However, as with the east side of the AU, some recent exploration and production has taken place out-side of existing fields, indicating that additional gas can poten-tially be found in the underpressured part of the formation.
Taking these geologic constraints as well as distribution of gas production volumes into consideration, we did not con-sider the entire untested area as favorable for having potential additions to reserves in the next 30 years. At the minimum we estimate 45 percent of the untested area to have potential additions to reserves in the next 30 years. At the median this value is 55 percent, and at the maximum, 60 percent. These values were obtained by multiplying the various percentages of untested area deemed favorable by different success ratios. These values are lower than those estimated for the Fruitland Fairway CBG AU (appendix A), reflecting different geologic conditions. New discoveries will come from infill drilling on closer spacing, step-out drilling from existing fields, and new field discoveries from wildcat drilling in less explored areas of the AU. The minimum cutoff of 0.02 BCFG would apply to the percentage of untested cells considered to have poten-tial additions to reserves. Total gas recovery per cell for these untested cells is estimated at 0.02 BCFG at the minimum, 0.6 BCFG at the median, and 20 BCFG at the maximum. These values are based on the EUR distributions (fig. 46) and are significantly lower than for the Fruitland Fairway CBG AU (appendix A). The maximum value of 20 BCFG was based on isolated occurrences of high producing wells, one of which has produced 40 BCFG (fig. 46).
Fruitland Fairway Coalbed Gas Assessment Unit (50220181)
Introduction
The Fruitland Fairway Coalbed Gas AU was drawn to include the area basinward of the Fruitland outcrops, exclusive of the area assigned to the Basin Fruitland Coalbed Gas AU, that is characterized by
1. overpressure and
2. wells that that have both high cumulative gas production and average daily production exceed-ing 1,000 cubic feet gas per day (Palmer and others, 1992) (fig. 47).
The boundary between high and low cumulative producing wells generally occurs between 0.5 and 1.0 BCFG (fig. 38). Within this AU, most, but not all, wells have produced at least 1 BCFG. In the Basin Fruitland CBG AU, most, but not all, wells have produced 0.5 BCFG or less. Generally wells in the latter AU that produced 0.5 BCFG or greater are isolated wells or small fields, not contiguous with the Fruitland Fairway CBG AU. The southern and eastern boundaries of the Fruit-land Fairway CBG AU were drawn between the area of very high gas and water production and areas of low gas and water production (figs. 34 and 38). Although the AU boundary is irregular, the AU roughly corresponds to the northwest–south-east trend of greatest net coal thickness (fig. 5). The eastern boundary also coincides with low net coal. Well spacing until recently was at 320 acres; this has been reduced to 160 acres. This AU differs from any single Fruitland coal-bed gas play in the 1995 USGS National Oil and Gas Assessment (Rice and Finn, 1996) in that it includes only part of the San Juan Basin-Overpressured Play.
Cumulative gas production from the Fruitland Fairway CBG AU can be divided into three areas, based on the rela-tion between overall production (independent of time) and d18O values of the produced water (fig. 48). These areas also roughly coincide with changes in net coal thickness. The northwest area (area 1 on fig. 48) includes water with d18O values that range between –16 and –8 per mil from north to south and that are defined by a series of south-plunging water masses (d18O between –16 and –13 per mil as seen in fig. 11). These water masses appear to impinge on more easterly ori-ented water masses with d18O values between –12 and –8 per mil (fig. 11). Net coal thickness of this area generally exceeds 45 ft (fig. 5).
Most of the wells in area 1 of the Fruitland Fairway CBG AU have cumulative gas production that exceeds 3 BCFG (fig. 48). Several wells exceed 20 BCFG cumulative produc-tion. There is a slight gradient of increasing cumulative gas production, from north to south; wells with the highest cumula-tive production tend to cluster along the southern boundary in this part of the AU. This suggests a slight local modification of gas production by groundwater flow, with the best wells producing from older water flow paths. Part of this apparent gradient may also be due to changes in coal thickness. Thinner coal is found along the southeast boundary of this area (fig. 5). However despite this slight production gradient, cumulative production here is uniformly high, implying that this area was probably already enriched in gas resources prior to the introduction of any later water. The contribution of late-stage microbial-generated methane (Scott, 1994; Scott and oth-ers, 1994b) is not easily determined but may actually be less than previously proposed for this area if the concept of early generation of microbial gas is considered. The carbon isotopes of the methane, carbon dioxide, and dissolved inorganic carbon

Fruitland Total Petroleum System 75
1
10
100
1,000
10,000
100,000
0 10 20 30 40 50 60 70 80 90 100
PERCENT OF SAMPLE
Early Avg
Middle Avg
Late Avg
EUR
GA
S (M
MCF
)
1
10
100
1 ,000
10 ,000
100,000
0 10 20 30 40 50 60 70 80 90 100
PERCENT OF SAMPLE
EUR
GAS
(MM
CF)
Figure 45. Graph showing estimated ultimate recoveries (EUR) of Basin Fruitland Coalbed Gas Assessment Unit (AU) gas wells divided by time of completion into three nearly equal blocks. EUR data calculated using data from IHS Energy (2002). Data provided by T. Cook (written commun., 2002). MMCF, million cubic feet.
Figure 46. Graph showing distribution of estimated ultimate recoveries (EUR) of Basin Fruitland Coalbed Gas Assessment Unit gas wells. EUR data calculated using data from IHS Energy (2002). Data provided by T. Cook (written commun., 2002). MMCF, million cubic feet.
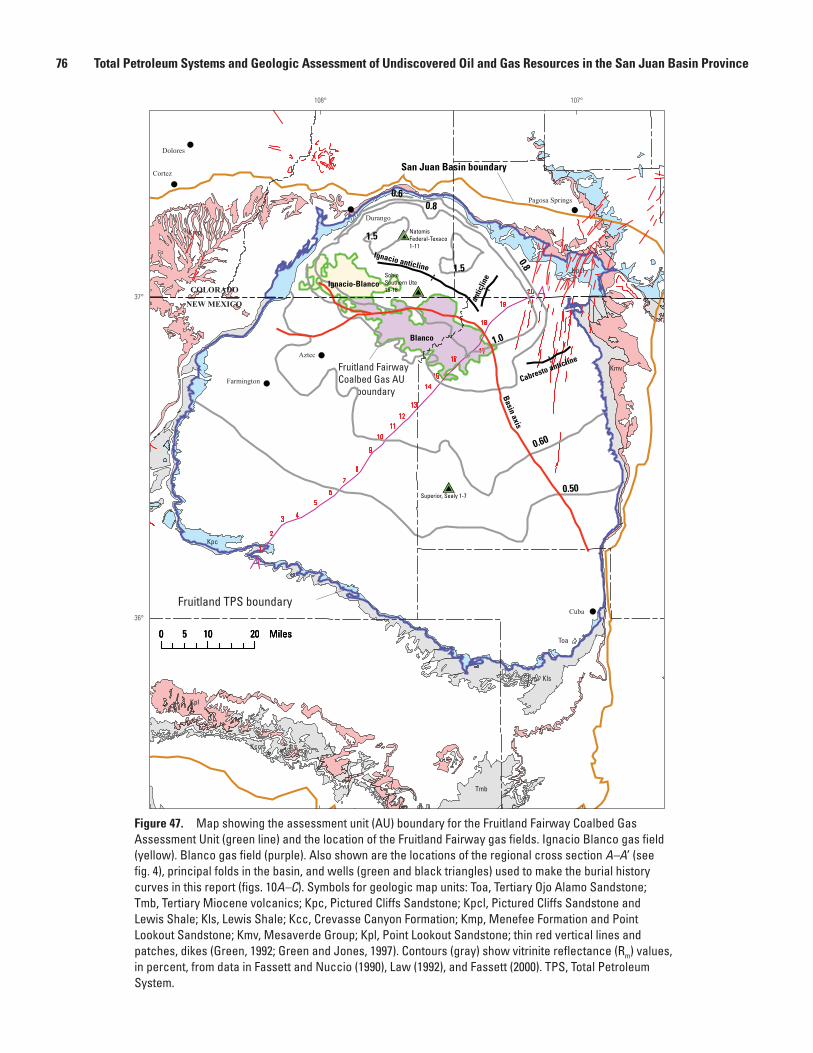
76 Total Petroleum Systems and Geologic Assessment of Undiscovered Oil and Gas Resources in the San Juan Basin Province
Kmp
Kcc
Kls
Toa
Kpl
Kmv
Tmb
Kpc
Kpcl
Fruitland Fairway Coalbed Gas AU boundary
NatomisFederal-Texaco1-11
Superior, Sealy 1-7
Sohio Southern Ute 15-16
Basin axis
Ignacio anticline
antic
line
Cabresto anticline
0.50
0.60
0.8
1.0
1.5
0.60.8
1.5
Blanco
Ignacio-Blanco
San Juan Basin boundary
Fruitland TPS boundary
0 10 205 Miles0 10 205 Miles0 10 205 Miles
Aztec
Cortez
Durango
Dolores
Farmington
Cuba
Pagosa Springs
COLORADO
NEW MEXICO
108° 107°
36°
37°
Figure 47. Map showing the assessment unit (AU) boundary for the Fruitland Fairway Coalbed Gas Assessment Unit (green line) and the location of the Fruitland Fairway gas fields. Ignacio Blanco gas field (yellow). Blanco gas field (purple). Also shown are the locations of the regional cross section A–A’ (see fig. 4), principal folds in the basin, and wells (green and black triangles) used to make the burial history curves in this report (figs. 10A–C). Symbols for geologic map units: Toa, Tertiary Ojo Alamo Sandstone; Tmb, Tertiary Miocene volcanics; Kpc, Pictured Cliffs Sandstone; Kpcl, Pictured Cliffs Sandstone and Lewis Shale; Kls, Lewis Shale; Kcc, Crevasse Canyon Formation; Kmp, Menefee Formation and Point Lookout Sandstone; Kmv, Mesaverde Group; Kpl, Point Lookout Sandstone; thin red vertical lines and patches, dikes (Green, 1992; Green and Jones, 1997). Contours (gray) show vitrinite reflectance (Rm) values, in percent, from data in Fassett and Nuccio (1990), Law (1992), and Fassett (2000). TPS, Total Petroleum System.

Fruitland Total Petroleum System 77
SAN JUAN
RIO ARRIBA
LAPLATA
ARCHULETAMONTEZUMA
COLORADO
NEW MEXICO
δ18O,per mil
BaIa
−15 −13 −11 −9 −7 −5 −3 −1
Durango
Farmington
0 5 10 15 20 MILES
0 20 KILOMETERS5 10 15
Anticline
Syncline
Fruitland Fairway Coalbed Gas AUboundary
Basin Fruitland Coalbed Gas AU boundary
EXPLANATION
Cummulative gas production, BCF
0−0.5
0.5−1.0
1.0−1.5
1.5−2.0
2.0−2.5
2.5−3.0
3.0−5.0
5.0−7.0
7.0−9.0
9.0−15.0
15.0−20.0
>20.0
Basinaxis
Area 1Area 2
Area 3
Navajo LakeReservoir
Pied
ra R
iver Los
Pino
s
R
iver
Flor
ida River
Ani m
as R
iver
37°
108° 107°
Figure 48. Map showing relation between cumulative gas production (independent of length of production time) in the Fruitland Fairway Coalbed Gas Assessment Unit (AU) and distribution of d18O in produced Fruitland Formation waters. Production data from IHS Energy Group (2002). Oxygen-isotope base map from Cox and others (2001). Ba, Bondad anticline; Ia, Ignacio anticline; BCF, billion cubic feet.

78 Total Petroleum Systems and Geologic Assessment of Undiscovered Oil and Gas Resources in the San Juan Basin Province
certainly indicate some microbial contribution to the gas, but the isotopes are not indicative of time of genesis (early or late) or of the proportion of thermal component. North of the Fruitland Fairway CBG AU boundary, cumulative gas produc-tion drops dramatically in similar or more d18O-depleted waters except in areas along the northern margin of the Basin Fruit-land CBG AU and along the courses of several rivers (figs. 11 and 38).
The middle part of the Fruitland Fairway CBG AU (area 2 on fig. 48) includes water with d18O values that range between –10 and –6 per mil and is defined by a series of east- to southeast-oriented water masses (fig. 11). Generally, wells in area 2 (fig. 48) have produced less than 3 BCFG, even though, based on d18O values, the waters would be relatively older than in area 1 of the Fruitland Fairway CBG AU to the west. This area is characterized by generally thinner net coal (less than 45 ft) (fig. 5), and the decrease in production may reflect the decrease in net coal thickness. This area of thin net coal also coincides with the position of a part of the present-day basin axis (figs. 22 and 48), an area where fluid flow rates would be slower because of the lower structural gradient. As docu-mented in the west area of the Fruitland Fairway AU, there is a slight increase in cumulative gas production from north to south in the direction of isotopically heavier water. Overall, wells with the highest cumulative production are found along the southern boundary of this part of the AU.
The eastern part of the Fruitland Fairway CBG AU (area 3 on fig. 48) is characterized by overall high cumulative gas production; the majority of the wells have produced more than 5 BCFG. Net coal thickness in this area generally exceeds 45 ft. Water-isotope chemistry is lacking for most of this part of the AU, except along the northern part where d18O values range between –10 and –7 per mil (fig. 11). However, based on regional trends, most of this part of the Fruitland Fairway should be at least this heavy and could have d18O values as heavy as –5 or –4 per mil. There is a slight gradient of increas-ing cumulative gas production from north to south; wells with the highest cumulative production tend to cluster along the southern boundary of this part of the AU. Part of this apparent gradient may be due to change in net coal thickness. Thicker coal is found along the southern boundary of the AU in this area (fig. 5). Similar to area 1 of the Fruitland Fairway, the pat-tern of cumulative gas production implies that area 3 was prob-ably already enriched in gas resources prior to the introduction of younger water or to the addition of any late-stage microbial gas. North and east of area 3 of the Fruitland Fairway CBG AU boundary, cumulative gas production drops dramatically suggesting that some geologic controls, other than groundwa-ter flow, are more important in localizing higher cumulative production in the Fruitland Fairway AU (fig. 38). The northeast and east boundaries of the AU appear to be controlled by thin net coal (fig. 5) and higher sandstone content (Scott and others, 1994b).
Normalized (monthly) gas production is significantly higher in the Fruitland Fairway CBG AU than in either the northern or southern part of the Basin Fruitland CBG AU (fig. 39). In the Fruitland Fairway CBG AU, normalized
monthly gas production is commonly between 50 and 150 MMCF. The same three area divisions of the Fruitland Fairway CBG AU are observed for normalized production (fig. 39). The western and eastern parts of the AU are more enriched than the central part, which has uniformly lower normalized gas volumes. In the western and eastern parts of the Fruitland Fairway AU, there is a slight tendency for normalized gas production to increase from north to south in the direction of isotopically heavier produced waters (figs. 11 and 39). Wells with the highest normalized gas production tend to occur in the southern half of the western and eastern parts of this AU, where net coal is thicker. Net coal thickness may be a more important control on production than any post-deposition groundwater flow. Key parameters of the Fruitland Fairway Continuous Gas AU are listed below and are summarized on figure 49.
Source
The primary petroleum source rock for this assessment unit is interpreted to be coals of the Fruitland Formation.
Maturation
Late Eocene to late Miocene maturation for thermal gas, Late Cretaceous to early middle Eocene for possible early microbial gas, and Pliocene to Holocene for late-stage microbial gas (fig. 49).
Migration
The principal reservoirs in the Fruitland Formation are the coals, although production also occurs in sandstone chan-nel beds. Coals (exclusive of cleats) have low porosity and vir-tually no permeability, and thus the gases are sorbed onto the coal matrix (Scott, 1994). This means that most of the coal-bed gas is essentially generated in place and has not migrated. However, migration of gas from the coal into other reservoirs, such as the interbedded sandstones, has occurred when pres-sure decreased below the sorptive capacity of the coal at a given temperature. Usually, this occurs during production but may also have occurred during the geologic past during peri-ods of uplift and erosion. Migration of coal-derived gas may also occur by diffusion, and, if it enters the hydrologic regime, the gas may dissolve in the water and thus be transported to other sites of accumulation. The regional changes in compo-sition of Fruitland gas suggest some migration of gases has occurred (Scott, 1994).
Reservoirs
The principal reservoirs in the Fruitland Formation are the coals, although production may also be from interbedded sandstone channels.

Fruitland Total Petroleum System
79
Figure 49. Events chart that shows key geologic events for the Fruitland Fairway Coalbed Gas Assessment Unit. Black arrow, critical moment (Magoon and Dow, 1994) for gas generation. TRIAS., Triassic; PALEO., Paleocene; OLIG., Oligocene; QUAT., Quaternary; Po, Pliocene; Ps, Pleistocene; E, early; M, middle; L, late. Geologic time scale is from the Geological Society of America web page http://www.geosociety.org/science/timescale/timescl.htm, last accessed 2/1/2008, and from Berggren and others (1995).
RESERVOIR ROCK
?????
Possible early microbial-generated gas
Thermal gas
Secondary microbial-generated gas
?
PETROLEUMSYSTEM EVENTS
GEOLOGIC TIME
SCALE
MIOCENEOLIG.EOCENEPALEO. Po
CENOZOICMESOZOICTERTIARY
E LEE MM LL
QUAT.JURASSIC CRETACEOUSPs
01020304050607075100150200250
E L LME E L E M L
CRITICAL MOMENTPRESERVATION
SOURCE ROCK
SEAL ROCK
OVERBURDEN ROCKTRAP FORMATION
GENERATION-MIGRATION-
ACCUMULATION
Stratigraphic Structural (Laramide)
TRIAS.
80 Total Petroleum Systems and Geologic Assessment of Undiscovered Oil and Gas Resources in the San Juan Basin Province
Traps/Seals
Several types of traps form in Fruitland reservoirs; each varies in magnitude or areal extent. At the smallest scale, the coals in the Fruitland serve not only as the source of the produced gas in the Fruitland but are also the trap and reser-voir. At larger scales, the heterogeneous character of coal-bed reservoirs tends to form compartments. The compartments may form when one or possibly both cleat directions are closed or nearly closed as a result of tectonic stress (Shuck and others, 1996). Directions of tectonic stress primarily control the degree and direction of cleat development; however, coal rank and coal matrix composition (maceral type) also have been shown to be important (Tremain and others, 1994). Other compartments may form as a result of intersecting faults. Folds do not appear to control coal-gas accumulation, but fractures and faults associated with development of folds do affect permeability (Kaiser and Ayers, 1994). Seals in Fruit-land reservoirs may be
1. closed cleats, due to tectonic stress,
2. cemented faults,
3. interbedded sandstone reservoirs that are not frac-tured, and
4. interbedded low-permeability shale or mudstone beds.
Geologic Model
There are several underlying geologic controls for the position of the Fruitland Fairway CBG AU, most of which have been previously discussed, but the principal controls on gas resources appear to be net coal thickness and location of these coals near the structural axis of the basin, the position of which inhibits groundwater flow out of the deepest part of the basin. The Fruitland Fairway AU is located in the southern part of the overpressured part of the Fruitland. The thick coals in the AU were deposited behind two shorelines in the Pictured Cliffs that were associated with stillstand conditions and slower rates of progradation. Isopachs of these coals have a northwest–south-east orientation compared to the northeast–southwest orientation of net coal isopachs to the north and south. These differences in orientation of coal geometry may have affected groundwater flow from the south and north throughout geologic time. The present Fruitland Fairway CBG AU may be viewed either as an area of groundwater convergence or as a remnant of an origi-nally broader area rich in gas resources.
The Fruitland Fairway CBG AU is located entirely within the overpressured part of the Fruitland in an area of higher thermal maturity compared to the underpressured to normally pressured area to the south. Both wet and dry gases are found in the AU, but most gas is dry (fig. 15). The highest CO2 content (>5.9 percent) is confined to the Fruitland Fairway CBG. Gas in the Fruitland Fairway CBG AU was generated essentially in place, although in some areas gas resources may contain a
component that is related to migration of gas in groundwater during various stages of gas generation.
Volumetrically most of the gas produced from the Fruit-land Fairway CBG AU is probably of thermogenic gas origin, and the gas was mostly generated in place. The period of thermal-gas generation ranged from late Eocene through late Miocene (fig. 49), with the maximum gas generation in early Miocene, coincident with deepening of the basin in this area. Gas throughout the AU is a variable mixture of thermogenic and microbial (early or late) as evidenced by the d13C values of methane, carbon dioxide, and bicarbonate. Early microbial-gas generation (fig. 49) is conjectural but is supported by some geo-chemical evidence previously presented. Significant late-stage microbial-gas generation (fig. 49) as a result of post-Miocene groundwater flow is difficult to support based on 129I/I dates of the formation water (Snyder and others, 2003), unless the microbial communities could have survived the high heat (up to 165°C) in the Oligocene and Miocene. The presence of isotopi-cally heavy bicarbonate produced water and mixed-isotope sig-natures of methane and carbon dioxide appears to be ubiquitous throughout the Fruitland. These observations don’t necessarily require a young (more recent) age for occurrence.
Assessment Results
The Fruitland Fairway CBG AU was assessed to have undiscovered resources of 3,981.14 billion cubic feet of gas (BCFG) at the mean. The volumes of undiscovered oil, gas, and natural gas liquids estimated in 2002 for the Fruitland Fairway CBG AU are shown in appendix A. The Fruitland Fairway Assessment Unit encompasses an area of 227,000 acres and because this area is completely surrounded by the Basin Fruitland CBG AU, its size remained the same when estimating the minimum, median, and maximum area of the assessment unit. There is adequate charge; favorable reservoirs, traps, and seals; and favorable timing for charg-ing the reservoirs with greater than the minimum recovery of 0.02 BCFG. A summary of the input data of the AU is pre-sented on the data form in appendix D.
There were 934 tested cells (wells that have produced or had some other production test, such as initial production test, drill stem test, or core analysis). A 0.02 BCFG recovery cutoff was used per cell, and applying this cutoff, 890 tested cells equaled or exceeded this cutoff. If the production history of the Fruitland Fairway CBG AU is divided into nearly three equal discovery time periods, plots of the estimated ultimate recoveries (EUR) indicate that the middle time period has a slightly better EUR distribution than the first time period and the best median total recovery (13 BCFG) per cell (fig. 50). This may reflect a better understanding of how to explore for and develop coal-bed gas resources, compared to the first time period. Recoveries have declined in the last-third time period, perhaps reflecting that the best overall producing areas have been found. The EUR distribution for the Fruit-land Fairway AU (fig. 50) shows a median total recovery per

Fruitland Total Petroleum System 81
cell of 9.5 BCFG. The EUR distributions were factored into calculation of potential additions to reserves.
The Fruitland Fairway CBG AU has been extensively drilled. At the minimum we estimate 93 percent of the untested area (areas not drilled) to have potential additions to reserves in the next 30 years. At the median, this value is 95 percent, and at the maximum, this value is 97 percent. The high percentage of the untested area considered to have poten-tial additions to reserves in the next 30 years reflects a cir-cumscribed area that has been geologically well defined, and the average production is well known based on drilling. No unfavorable areas in the AU were identified. New discoveries will essentially be infill drilling on closer-acre spacing, testing for smaller compartments that are not in communication with each other. New Mexico recently adopted a 160-acre spac-ing. The minimum cutoff of 0.02 BCFG would apply to the percentage of untested cells considered to have potential addi-tions to reserves. Total gas recovery per cell for these untested cells is estimated at 0.02 BCFG at the minimum, 9.5 BCFG at the median, and 40 BCFG at the maximum. These values are based on the EUR distributions (fig. 51).
Tertiary Conventional Gas Assessment Unit (50220101)
Introduction
The Tertiary Conventional Gas Assessment Unit boundary was drawn to include all possible gas accumulations in Tertiary rocks in the San Juan Basin. The digital geologic maps of Colo-rado (Green, 1992) and New Mexico (Green and Jones, 1997) were used to draw the boundary, which was the basal contact of the Animas Formation in the north and the Ojo Alamo Sand-stone in the south (fig. 52). The AU thus consists of the geo-graphic area encompassing the Animas Formation, Ojo Alamo Sandstone, Nacimiento Formation, and San Jose Formation. Significant Tertiary conventional gas had not yet been devel-oped in 1995, so this assessed unit is new for this report.
A few gas and oil shows have been discovered in Tertiary rocks in the basin since the late 1950s. The Lee M. Crane, Mar-tin No. 1 well in San Juan County, New Mexico (fig. 52), was spudded in 1957 and has produced over 4,000 bbl oil and nearly 90,000 MCF gas. Well data from PI/Dwights (IHS Energy Group, 2002) indicates that the well was originally tested for the Farmington Sandstone Member of the Kirtland Shale at a depth of 901 to 1,130 ft. All oil and gas production has been from the Ojo Alamo Sandstone whose base is at 887 ft. This well doesn’t appear to be associated with any obvious structural high, but is just updip from an area where the Mesaverde Formation pro-duces gas and condensate.
Gas was produced for 25 years from one well in the Nacimiento in the Arch field (fig. 52), west of Cabresto Can-yon field. This discovery was made in 1975 by accident while drilling a Pictured Cliffs development well (Emmendorfer, 1983). Production was from a channel sandstone complex in the Nacimiento on the northeast flank of a small anticline.
Emmendorfer (1983) speculated that the source of the gas in this well could have come from either a casing failure of a nearby Pictured Cliffs well or from coal within the Nacimiento adjacent to the producing sandstone bed. Casing failure was eliminated as a source of the gas by testing the nearby wells. No coal was actually identified in the Nacimiento at this location. The Animas/Nacimiento has Rm values between about 0.7 per-cent and 1.0 percent in this general area (Law, 1992), and the possibility exists that thin coal, carbonaceous shale, or lacus-trine rocks within the Tertiary section generated the more than 60,000 MCF gas recovered from this well. Gas migration from deeper in the basin also cannot be ruled out.
Kiffen field (fig. 52) is near the Arch field, and it produced over 12,000 MCF gas from 1977 to 1986 from one well in the Nacimiento. The producing interval in this well was also shal-low, less than 800 ft. (Riggs, 1983). Production was thought to be from either a thin, fractured sandy interval or a porous and permeable sandstone in the Nacimiento (Riggs, 1983). The producing well is on the north side of a small anticline. Riggs (1983) did not speculate as to the source of the gas in this well, but tests on all adjacent wells eliminated casing failure as a source. Migration upsection from the Fruitland to a combination trap in the Nacimiento, coal or lacustrine rocks in the Nacimiento, or updip migration from older units are possibilities.
A Nacimiento well in the Ignacio-Blanco field (fig. 52) in southern Colorado produced over 43,000 MCFG from 1986 to 1988. This well currently produces from the Dakota Sandstone and the Menefee Formation, and is on a small anticline trend-ing southeastward into the deepest part of the basin. The depth of Nacimiento production is not known, but the top of the Ojo Alamo here is at 2,170 ft (IHS Energy Group, 2002), and the Nacimiento is above that.
The Gavilan field (fig. 52), southeast of the Cabresto Can-yon field, had minor production from the Nacimiento from the early 1980s to as late as 1997, but these wells are now inactive. This production was also on the east flank of a small anticline. Production at Gavilan is mainly from the Pictured Cliffs Sand-stone, but sandstones of the Fruitland and Kirtland Formations also have gas shows in this area (Conyers, 1978).
Just southeast of the Gavilan field, a few wells formerly produced from the Ojo Alamo Sandstone in what was known as the Schmitz Torreon-Puerco field (Needham, 1978). This area is now included in the Blanco South field (fig. 29), and production is attributed to the Pictured Cliffs Sandstone. Production was from some lenticular sandstones in the middle of the Ojo Alamo Sandstone and from the lower part of the Ojo Alamo.
The Synergy Operating LLC, 29-4 Carson 20 well, located southwest of Cabresto Canyon field (fig.52), has produced over 24,000 MCFG from the Nacimiento from 1997 through August 2001. This wildcat well is a workover of a Fruitland well that no longer produces from the Fruitland.
Nearly all of the gas produced from Tertiary rocks in the San Juan Basin has been from the Cabresto Canyon field (fig. 52) and surrounding area (IHS Energy Group, 2002). Limited data is published on this accumulation, key reports being Hoppe (1992) and Anonymous (1998). The field has been
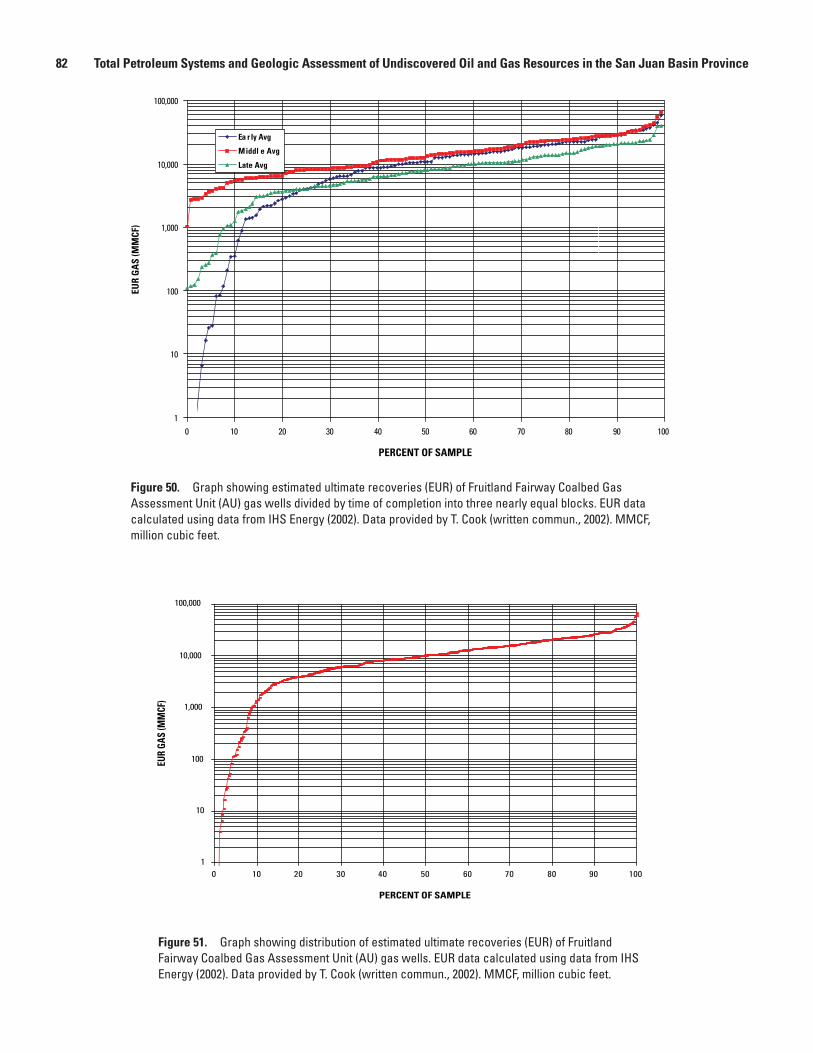
82 Total Petroleum Systems and Geologic Assessment of Undiscovered Oil and Gas Resources in the San Juan Basin Province
1
10
100
1,000
10,000
100,000
0 10 20 30 40 50 60 70 80 90 100
PERCENT OF SAMPLE
Ea r ly Avg
Middl e Avg
Late Avg
EUR
GA
S (M
MCF
)
0 10 20 30 40 50 60 70 80 90 100
PERCENT OF SAMPLE
1
10
100
1,000
10,000
100,000
EUR
GAS
(MM
CF)
Figure 50. Graph showing estimated ultimate recoveries (EUR) of Fruitland Fairway Coalbed Gas Assessment Unit (AU) gas wells divided by time of completion into three nearly equal blocks. EUR data calculated using data from IHS Energy (2002). Data provided by T. Cook (written commun., 2002). MMCF, million cubic feet.
Figure 51. Graph showing distribution of estimated ultimate recoveries (EUR) of Fruitland Fairway Coalbed Gas Assessment Unit (AU) gas wells. EUR data calculated using data from IHS Energy (2002). Data provided by T. Cook (written commun., 2002). MMCF, million cubic feet.

Fruitland Total Petroleum System 83
0 5 10 15 20 MILES
0 20 KILOMETERS5 10 15
Cuba
Aztec
Cortez
Durango
Dolores
Farmington
Pagosa Springs
Kmp
Kcc
Kls
Toa
Kpl
Kmv
Tmb
Kpc
Kpcl
Tsj
Tn
TKa
Toa
36°
36°
108° 107°
Dulcedikeswarm
COLORADONEW MEXICO
Fruitland TPS boundary
San Juan Basin boundary
Gavilan
Arch
Kiffen
NatomisFederal-Texaco1-11
Superior, Sealy 1-7
Ignacio-Blanco
Sohio, Southern Ute 15-16
0.50
0.60
0.8
1.0
1.5
0.60.8
Ignacio-Blanco
Tertiary Conventional GasAU boundary
1.5
Lee M. Crane, Martin No. 1
Synergy, 29-4 Carson 20Cabresto Canyon
A
A'
Figure 52. Map showing the assessment unit boundary for the Tertiary Conventional Gas Assessment Unit (AU) (red line) and Tertiary gas fields (cross-hatched pattern). Symbols for geologic map units: Tsj, San Jose Formation; Tn, Nacimiento Formation; Toa, Tertiary Ojo Alamo Sandstone; Tka, Animas Formation; Tmb, Tertiary Miocene volcanics; Kpc, Pictured Cliffs Sandstone; Kpcl, Pictured Cliffs Sandstone and Lewis Shale; Kls, Lewis Shale; Kcc, Crevasse Canyon Formation; Kmp, Menefee Formation and Point Lookout Sandstone; Kmv, Mesaverde Group; Kpl, Point Lookout Sandstone; thin red vertical lines and patches, dikes (Green, 1992; Green and Jones, 1997). Thermal maturity contours (gray) show vitrinite reflectance (Rm) values contoured from data in Fassett and Nuccio (1990), Law (1992), and Fassett (2000). Also shown is the location of the regional cross section A–A’ (in fig. 4), principal folds in the basin, location of wells (green and black triangles) used to make the burial history curves in this report (figs. 10A–C), and the general area of the Dulce dike swarm. TPS, Total Petroleum System.

84 Total Petroleum Systems and Geologic Assessment of Undiscovered Oil and Gas Resources in the San Juan Basin Province
drilled and developed since 1997. As of January, 2003, produc-tion from Cabresto Canyon field has been less than 5,000 bar-rels of oil and about 48.5 billion cubic feet of gas (IHS Energy Group, 2003). Reservoirs are sandstones in the Ojo Alamo Sandstone, and Nacimiento and San Jose Formations.
Tertiary rocks in other areas of the San Juan Basin would also seem to have attributes favorable for gas accumula-tion; however, there has been very limited production or even shows in other places. Mallon Resources, main operator of the Cabresto Canyon field, noted that the Ojo Alamo is an aquifer in many parts of the San Juan Basin, and does not produce gas on other Mallon properties (Anonymous, 1998). All of the Tertiary rock units are sources of water in the basin, and produce under both water-table and artesian conditions (Brimhall, 1973; Lev-ings and others, 1990; Thorn and others, 1990). Water saturation of Tertiary rocks in most of the San Juan Basin is considered the main reason for the lack of gas accumulations in those rocks. Areas with potential for future discoveries are probably on structures in the region of the Dulce dike swarm (Ruf and Erslev, 2005) (fig. 52) in a setting similar to that at the Cabresto Canyon field. Key parameters of the Tertiary Conventional Gas AU are listed below and are summarized on figure 53.
Source
The primary petroleum source rock for this assessment unit is interpreted to be coals of the Fruitland Formation.
Maturation
Thermal maturation is interpreted to range from late Oligocene to early Miocene time (fig. 53).
Migration
Upward migration occurs along fractures and dike-margin discontinuities associated with dikes that intrude the Tertiary section, then laterally into fluvial sandstones of Tertiary formations.
Reservoirs
Known reservoirs are the Paleocene Ojo Alamo Sandstone and Nacimiento Formation, and Eocene San Jose Formation.
Traps/Seals
Overbank mudstones act as seals; traps are a combination of stratigraphic pinchouts of lenticular fluvial sandstones and an anticline at Cabresto Canyon field (fig. 52). Structure may also play a role at the Gavilan field, south of Cabresto Canyon, and at some small, single-well areas in the northern part of the basin.
Geologic Model
Laramide tectonics in the Late Cretaceous to Eocene caused deepening of the San Juan Basin and uplift of sur-rounding areas. Tertiary units were sourced from the surround-ing uplifted areas and accumulated in the basin. Deposition of Tertiary rocks contributed to maturation of the Fruitland coal source rock; intrusion of the Dulce dike swarm (fig. 52) in the late Oligocene probably also resulted in elevated tempera-ture gradients, at least in local areas. Laramide tectonics also developed a number of small anticlines and synclines on the overall basin structure.
In the late Oligocene to early Miocene, gas generated from the Fruitland could have migrated upward in fracture zones on anticlines, or in the area of the dikes and associated fractures and/or faults. Once gas reached the permeable sand-stones of the Ojo Alamo, Nacimiento, and San Jose, it moved laterally into these units. Interbedded mud rocks provide seals, and stratigraphic pinchouts and structural highs on small anti-clines, sometimes in combination, form the traps.
The area of the Dulce dike swarm (in the Cabresto Can-yon field) has a number of favorable geologic conditions that led to the accumulation of gas in that region:
1. source rocks of sufficient thickness, quality, and maturity;
2. migration pathways along the dikes and possibly through fractures enhanced by structure;
3. permeable reservoir rocks that are intruded by the dikes; and
4. seals and traps that preserved the gas accumulations.
Assessment Results
The Tertiary Conventional Gas AU (50220101) covers 3,522,254 acres and was estimated to have undiscovered resources of 79.98 BCFG and 0.84 MMBNGL at the mean. The volumes of undiscovered oil, gas, and natural gas liquids estimated in 2002 for the Tertiary Conventional Gas AU are shown in appendix A. A summary of the input data of the AU is presented on the data form in appendix E, which for this AU estimates the numbers and sizes of undiscovered accumula-tions. There is adequate charge; favorable reservoirs, traps, seals, and access; and favorable timing of generation and migration of hydrocarbons, indicating a geologic probabil-ity of 1.0 for finding at least one additional field with a total recovery greater than the stated minimum of 3 BCFG (grown). This unit was not assessed in the 1995 USGS National assess-ment (Huffman, 1996), because the area of highest production, at Cabresto Canyon, had not yet been developed.
This assessment unit produces mainly gas and minor natural gas liquids (condensate) (IHS Energy Group, 2002), but its production does not appear in the NRG Associates database used for this assessment, because development of the AU occurred largely after the database was published. As of January 2003, gas production from the AU was over 48 BCFG

Fruitland Total Petroleum System
85
PETROLEUMSYSTEM EVENTS
GEOLOGIC TIME
SCALE
MIOCENEOLIG.EOCENEPALEO. Po
CENOZOICMESOZOICTERTIARY
E LEE MM LL
QUAT.JURASSIC CRETACEOUS
Ps
01020304050607075100150200250
E L LME E L E M L
Rock units:Late Cretaceous— 1. Fruitland FormationTertiary— 2. Ojo Alamo Sandstone (Paleocene) 3. Nacimiento Formation (Paleocene) 4. San Jose Formation (Eocene)
ROCK UNITSOURCE ROCKRESERVOIR ROCKSEAL ROCK
OVERBURDEN ROCKTRAP FORMATION
GENERATION-ACCUMULATION
MIGRATION-
PRESERVATIONCRITICAL MOMENT
2,3 4
1
2,3,4
2,3, 4
1
TRIAS.
Figure 53. Events chart that shows key geologic events for the Tertiary Conventional Gas Assessment Unit. Black arrow, critical moment (Magoon and Dow, 1994) for gas generation. TRIAS., Triassic; PALEO., Paleocene; OLIG., Oligocene; QUAT., Quaternary; Po, Pliocene; Ps, Pleistocene; E, early; M, middle; L, late. Geologic time scale is from the Geological Society of America web page http://www.geosociety.org/science/timescale/timescl.htm, last accessed 2/1/2008, and from Berggren and others, (1995).
86 Total Petroleum Systems and Geologic Assessment of Undiscovered Oil and Gas Resources in the San Juan Basin Province
(IHS Energy Group, 2003), mostly from the Cabresto Canyon field. Dates of first production from the AU were mainly in 1998 to 2001, with a considerable drop-off in wells coming online in 2002 (IHS Energy Group, 2003).
Estimating undiscovered gas resources in the Tertiary Conventional Gas AU is difficult because of the lack of historical production data for the unit and because production has been mainly in one area, to date. A key factor that limits the potential for new gas discoveries is water saturation of the reservoir rocks in much of the AU. The northeast part of the AU was considered to have the best combination of migration pathways and favorable traps, seals, and reservoir rocks for gas accumulations, although this area does not have Fruitland source rocks in the same volume as other parts of the AU. Using these considerations, it was estimated that a mini-mum of one gas accumulation, above the minimum cutoff of 3 BCFG, could be discovered. It was estimated that a median of five accumulations and a maximum of ten accumulations could be discovered. Sizes of undiscovered accumulations were estimated as 3 BCFG at the minimum, 12 BCFG at the median, and 120 BCFG at the maximum.
Summary
The Fruitland Total Petroleum System includes all geneti-cally related hydrocarbons generated from coal and organic-rich shales in the Cretaceous Fruitland Formation. Four assessment units were defined in the TPS. Of the four assessment units, three were assessed as continuous-type gas accumulations and one as a conventional gas accumulation. The continuous-type assessment units are
1. Pictured Cliffs Continuous Gas AU,
2. Basin Fruitland Coalbed Gas AU, and
3. Fruitland Fairway Coalbed Gas AU. The conventional accumulation assessment unit is the Tertiary Conventional Gas AU. Total gas resources from this TPS that have the potential for additions to reserves are estimated at a mean of 29.3 TCFG. Of this amount, 23.58 TCFG will come from coal-bed gas accumulations. Total natural gas liquids that have the potential for additions to reserves are estimated at a mean of 17.76 million barrels. Of this amount, 16.92 million barrels will come from the Pictured Cliffs Continuous Gas AU and the remainder from the Tertiary Conventional Gas AU.
Acknowledgments
The authors thank T.S. Collett and A.C. Huffman, Jr., for their thoughtful reviews and T.A. Cook and T.R. Klett for inter-pretations and graphs of production data. Useful discussions and input were also provided by the U.S Geological Survey (USGS) National Oil and Gas Assessment Team consisting of
R.R. Charpentier, T.A. Cook, R.A. Crovelli, T.R. Klett, and C.J. Schenk.
References Cited
Ambrose, W.A., and Ayers, W.B., Jr., 1994, Geologic controls on coalbed methane occurrence and production in the Fruit-land Formation, Cedar Hill field and the COAL site, in Ayers, W.B., Jr., and Kaiser, W.R., eds., Coalbed methane in the Upper Cretaceous Fruitland Formation, San Juan Basin, New Mexico and Colorado: New Mexico Bureau of Mines and Mineral Resources Bulletin 146, p. 41–61.
Anonymous, 1998, Multiwell Ojo Alamo development advanc-ing in San Juan Basin: Oil and Gas Journal, v. 96, no. 17, p. 77.
Arnold, E.C., 1974, Oil and gas development and production, eastern San Juan Basin, in Seimers, C.T., ed., Ghost Ranch—Central-northern New Mexico: New Mexico Geological Society Guidebook, p. 323–328.
Aubrey, W.M., 1991, Geologic framework of Cretaceous and Tertiary rocks in the Southern Ute Indian Reservation and adjacent areas in the northern San Juan Basin, southwestern Colorado: U.S. Geological Survey Professional Paper 1505–B, p. B1–B24.
Ayers, W.N., Jr., and Zellers, S.D., 1994, Coalbed methane in the Fruitland Formation, Navajo Lake area; geologic con-trols on occurrence and producibility, in Ayers, W.B., Jr., and Kaiser, W.R., eds., Coalbed methane in the Upper Cretaceous Fruitland Formation San Juan Basin, New Mexico and Colo-rado: New Mexico Bureau of Mines and Mineral Resources Bulletin 146, p. 63–85.
Ayers, W.N., Jr., Ambrose, W.A., and Yeh, J.S., 1994, Coalbed methane in the Fruitland Formation, San Juan Basin: depo-sitional and structural controls on occurrence and resources: New Mexico Bureau of Mines and Mineral Resources Bul-letin 146, p. 13–40.
Baltz, E.H., Jr., 1953, Stratigraphic relations of Cretaceous and early Tertiary rocks of a part of northwestern San Juan Basin: U.S. Geological Survey Open-File Report [no number], 80 p.
Baltz, E.H., Jr., 1967, Stratigraphy and regional tectonic implications of part of Upper Cretaceous and Tertiary rocks, east-central San Juan Basin, New Mexico: U.S. Geological Survey Professional Paper 552, 101 p.
Bauer, C.M., 1916, Stratigraphy of a part of the Chaco River valley: U.S. Geological Survey Professional Paper 98–P, p. 271–278.

Fruitland Total Petroleum System 87
Berggren, W.A., Kent, D.V., Swisher, C.C., III, and Aubry, M., 1995, A revised Cenozoic geochronology and chronostratig-raphy, in Berggren, W.A., Kent, D.V., Aubry, M., and Harden-bol, J., eds., Geochronology, time scales and global strati-graphic correlation: Society for Sedimentary Geology, SEPM Special Publication No. 54, p. 129–212.
Bond, W.A., 1984, Application of Lopatin’s method to deter-mine burial history, evolution of the geothermal gradient, and timing of hydrocarbon generation in Cretaceous source rocks in the San Juan Basin, northwestern New Mexico and southwestern Colorado, in Woodward, J., Meissner, F.F., and Clayton, J.L., eds., Hydrocarbon source rocks of the greater Rocky Mountain Region: Rocky Mountain Association of Geologists Guidebook, p. 433–447.
Brimhall, R.M., 1973, Groundwater hydrology of the San Juan Basin, New Mexico, in Fassett, J.E., ed., Cretaceous and Tertiary rocks of the southern Colorado Plateau: Four Corners Geological Society Guidebook, p. 197–207.
Brown, C.F., 1973, A history of the development of the Pictured Cliffs Sandstone in the San Juan Basin of north-western New Mexico, in Fassett, J.E., ed., Cretaceous and Tertiary rocks of the southern Colorado Plateau: Four Corners Geological Society Guidebook, p. 178–184.
Clayton, J.L., Rice, D.D., and Michael, G.E., 1991, Oil-gener-ating coals of the San Juan Basin, New Mexico and Colo-rado, U.S.A.: Organic Geochemistry, v. 17, p. 735–742.
Colorado Oil and Gas Commission, 1999a, Cause 112, exhibits 11–13.
Colorado Oil and Gas Commission, 1999b, Cause 112, exhibit 16.
Conyers, W.P., 1978, Gavilan Pictured Cliffs, in Fassett, J.E., ed., Oil and gas fields of the Four Corners area, volume I: Four Corners Geological Society, p. 320–322.
Cox, D., Onsager, P., Thomson, J., Reinke, R., Gianinny, G., Vliss, C., Hugh, J., and Janowiak, M., 2001, San Juan Basin groundwater modeling study: Groundwater-surface water interactions between Fruitland coalbed methane develop-ment and rivers: Colorado Oil and Gas Conservation Com-mission San Juan Basin Study Report, 124 p.
Craigg, S.D., 2001, Geologic framework of the San Juan structural basin of New Mexico, Colorado, Arizona, and Utah, with emphasis on Triassic through Tertiary rocks: U.S. Geological Survey Professional Paper 1420, 70 p.
Criss, R.E., 1999, Principals of stable isotope distribution: New York, Oxford University Press, 254 p.
Cumella, S.P., 1981, Sedimentary history and diagenesis of the Pictured Cliffs Sandstone, San Juan Basin, New Mexico and Colorado: Texas Petroleum Research Committee, University Division, Austin, Texas, Report UT 81–1, 219 p.
Das, B.M., Nikols, D.J., Das, Z.U., and Hucka, V.J., 1991, Factors affecting rate and total volume of methane desorp-tion from coalbeds, in Schwochow, S.D., Murray, D.K., and Fahy, M.F., eds., Coalbed methane of western North Amer-ica: Rocky Mountain Association of Geologists, p. 69–76.
Emmendorfer, A.P., 1983, Arch Nacimiento, in Fassett, J.E., ed., Oil and gas fields of the Four Corners area, volume III: Four Corners Geological Society, p. 931–933.
Fabryka-Martin, J., Bentley, H., Elmore, D., and Airey, P.L., 1985, Natural iodine-129 as an environmental tracer: Geo-chimica et Cosmochimica Acta, v. 49, p. 337–347.
Fassett, J.E., 1974, Cretaceous and Tertiary rocks of the eastern San Juan Basin, New Mexico and Colorado, in Seimers, C.T., ed., Ghost Ranch—Central-northern New Mexico: New Mexico Geological Society Guidebook, p. 225–230.
Fassett, J.E., 1977, Geology of the Point Lookout, Cliff House and Pictured Cliffs Sandstones of the San Juan Basin, New Mexico and Colorado, in Fassett, J.E., ed., San Juan Basin III: New Mexico Geological Society Guidebook, p. 193–197.
Fassett, J.E., ed., 1978a, Oil and gas fields of the Four Corners area, volume I: Four Corners Geological Society, 368 p.
Fassett, J.E., ed., 1978b, Oil and gas fields of the Four Cor-ners area, volume II: Four Corners Geological Society, p. 369–727.
Fassett, J.E., ed., 1983, Oil and gas fields of the Four Cor-ners area, volume III: Four Corners Geological Society, p. 729–1143.
Fassett, J.E., 1985, Early Tertiary paleogeography and paleotec-tonics of the San Juan Basin area, New Mexico and Colorado, in Flores, R.M., and Kaplan, S.S., eds., Cenozoic paleogeog-raphy of west-central United States: Rocky Mountain Section, SEPM (Society for Sedimentary Geology), p. 317–334.
Fassett, J.E., 1991, Oil and gas resources of the San Juan Basin, New Mexico and Colorado, in Gluskoter, H.J., Rice, D.D., and Taylor, R.B., eds., Economic geology: Geological Society of America, The Geology of North America Series, v. P–2, p. 357–372.
Fassett, J.E., 2000, Geology and coal resources of the Upper Cretaceous Fruitland Formation, San Juan Basin, New Mexico and Colorado, chap. Q of Kirschbaum, M.A., Rob-erts, L.N.R., and Biewick, L.R.H., eds., Geologic assessment of coal in the Colorado Plateau: Arizona, Colorado, New Mexico, and Utah: U.S. Geological Survey Professional Paper 1625–B, p. Q1–Q132.
Fassett, J.E., and Hinds, J.S., 1971, Geology and fuel resources of the Fruitland Formation and Kirtland Shale of the San Juan Basin, New Mexico and Colorado: U.S. Geological Survey Professional Paper 676, 76 p.

88 Total Petroleum Systems and Geologic Assessment of Undiscovered Oil and Gas Resources in the San Juan Basin Province
Fassett, J.E., and Nuccio, V.F., 1990, Vitrinite reflectance values of coal from drill-hole cuttings from the Fruitland and Mene-fee Formations, San Juan Basin, New Mexico: U.S. Geologi-cal Survey Open-File Report 90-290, 21 p.
Fehn, U., Peters, E.K., Tullai-Fitzpatrick, S., Kubik, P.W., Sharma, P., Teng, R.T.D., Gove, H.E., and Elmore, D., 1992, 129I and 36Cl concentrations in waters of the eastern Clear Lake area, California: Residence times and sources ages of hydrothermal fluids: Geochimica et Cosmochimica Acta, v. 56, p. 2069–2079.
Fishman, N.S., Ridgley, J.L., and Hall, D.L., 2001, Timing of gas generation in the Cretaceous Milk River Formation, southeastern Alberta and southwestern Saskatchewan —Evi-dence from authigenic carbonates, in Summary of inves-tigations 2001, vol. 1: Saskatchewan Geological Survey, Saskatchewan Energy and Mines, Miscellaneous Report 2001–4.1, p. 125–136.
Fritz, P., and Fontes, J C., eds., 1980, Handbook of environmen-tal isotope geochemistry: Amsterdam, Elsevier, 545 p.
Goberdhan, H.C., 1996, Diagenesis and petrophysics of the Upper Cretaceous Pictured Cliffs Formation of the San Juan Basin, northwest New Mexico and southwest Colorado: Col-lege Station, Texas A & M University, M.S. thesis, 143 p.
Gorody, A.W., 1999, The origin of natural gas in the Tertiary coal-seams on the eastern margin of the Powder River Basin, in Coalbed methane and the Tertiary geology of the Powder River Basin, Wyoming and Montana: Wyoming Geological Association Guidebook, 50th Field Conference, p. 89–101.
Gorody, A.W., 2001, The origin of dissolved gas in shallow aquifers overlying the San Juan Basin’s Ignacio Blanco gas field near Bayfield, La Plata County, Colorado, in Stilwell, D.P., Wyoming gas resources and technology: Wyoming Geological Association 52nd Field Conference, p. 9–21.
Green, G.N., 1992, The digital geologic map of Colorado in ARC/INFO format: U.S. Geological Survey Open-File Report 92–507, http://pubs.er.usgs.gov/usgspubs/ofr/ofr92507A; last accessed 2/1/2008.
Green, G.N., and Jones, G.E., 1997, The digital geologic map of New Mexico in ARC/INFO Format: U.S. Geological Survey Open-File Report 97–0052, http://pubs.er.usgs.gov/usgspubs/ofr/ofr9752; last accessed 2/1/2008.
Gries, R.R., Clayton, J.L., and Leonard, China, 1997, Geol-ogy, thermal maturation, and source rock geochemistry in a volcanic covered basin: San Juan sag, south central Colorado: American Association of Petroleum Geologists Bulletin, v. 81, p. 1133–1160.
Harr, C.L., 1988, The Ignacio Blanco gas field, northern San Juan Basin, Colorado, in Fassett, J.E., ed., Geology and coal-bed methane resources of the northern San Juan Basin, Colorado and New Mexico: Rocky Mountain Association of Geologists Guidebook, p. 205–219.
Hoppe, W.F., 1992, Hydrocarbon potential and stratigraphy of the Pictured Cliffs, Fruitland, and Ojo Alamo Formations in the northeastern San Juan Basin, New Mexico, in Lucas, S.G., Kues, B.S., Williamson, T.E., and Hunt, A.P., eds., San Juan Basin IV: New Mexico Geological Society Guidebook, p. 359–371.
Huffman, A.C., Jr., 1996, San Juan Basin Province (22), in Gautier, D.L., Dolton, G.L., Takahashi, K.I., and Varnes, K.L., eds., 1995 NationalAassessment of United States oil and gas resource—Results, methodology, and support-ing data: U.S. Geological Survey Digital Data Series 30, release 2.
Huffman, A.C., Jr., and Taylor, D.J., 2002, Fractured shale reservoirs and basement faulting, San Juan Basin, New Mexico and Colorado: American Association of Petroleum Geologists Rocky Mountain Section Meeting, Laramie, Wyo., p. 30.
IHS Energy Group, 2002, PI/Dwights Plus US Well Data [data current as of June 2002]: Englewood, Colo., IHS Energy Group; database available from IHS Energy Group, 15 Inverness Way East, D205, Englewood, CO 80112, U.S.A.
IHS Energy Group, 2003, PI/Dwights Plus US Production Data [data current as of January 2003]: Englewood, Colo., IHS Energy Group; database available from IHS Energy Group, 15 Inverness Way East, D205, Englewood, CO 80112, U.S.A.
Jones, A.H., Kelkar, S., Bush, D., Hanson, J., Rakop, K., Ahmed, U., Holland, M., Tibbitt, G., Owen, L.B., and Bowman, K.C., 1985, Methane production characteristics of deeply buried coalbed reservoirs: Gas Research Institute Final Report 85/0033, 176 p.
Jones, R.W., 1987, Organic facies, in Brooks, J. and Welte, D., eds., Advances in petroleum geochemistry, v. 2: London, Academic Press, p. 1–90.
Kaiser, W.R., and Ayers, W.B., Jr., 1994, Coalbed methane production, Fruitland Formation, San Juan Basin: geologic and hydrologic controls: New Mexico Bureau of Mines and Mineral Resources Bulletin 146, p. 187–207.
Kaiser, W.R., Swartz, T.E., and Hawkins, G.J., 1994, Hydrologic framework of the Fruitland Formation, San Juan Basin: New Mexico Bureau of Mines and Mineral Resources Bulletin 146, p. 133–163.

Fruitland Total Petroleum System 89
Kelso, B.S., Decker, A.D., Wicks, D.E., and Horner, D.M., 1987, GRI geologic and economic appraisal of coal-bed methane in the San Juan Basin, in Proceedings, the 1987 coal-bed methane symposium, November 16–19, 1987, The University of Alabama, Tuscaloosa, Alabama: Gas Research Institute, The University of Alabama and the Department of Labor, sponsors, p. 119–130.
Kelso, B.S., and Wicks, D.E., 1988, A geologic analysis of the Fruitland Formation coal and coal-bed methane resources of the San Juan Basin, southwestern Colorado and northwest-ern New Mexico, in Fassett, J.E., ed., Geology and coal-bed methane resources of the northern San Juan Basin, Colorado and New Mexico: Rocky Mountain Association of Geolo-gists Guidebook, p. 69–79.
Law, B.E., 1992, Thermal maturity patterns of Cretaceous and Tertiary rocks, San Juan Basin, Colorado and New Mexico: Geological Society of America Bulletin, v. 104, p. 192–207.
Levings, G.W, Craigg, S.D., Dam, W.L., Kernodle, J.M., and Thorn, C.R., 1990, Hydrogeology of the San Jose, Nacimiento, and Animas Formations in the San Juan struc-tural basin, New Mexico, Colorado, Arizona, and Utah: U.S. Geological Survey Hydrologic Investigations Atlas 720–A.
Magoon, L.B., and Dow, W.G., 1994, The petroleum system, in Magoon, L.B., and Dow, W.G., eds., The petroleum sys-tem—from source to trap: American Association of Petro-leum Geologists Memoir 60, p. 3–24.
Martini, A.M., Walter, L.M., Budai, J.M., Ku, T.C.W., Kaiser, C.J., and Schoell, M., 1998, Genetic and temporal relations between formation waters and biogenic methane—Upper Devonian Antrim Shale, Michigan Basin, USA: Geochimica et Cosmochimica Acta, v. 62, p. 1699–1720.
Matheny, M.L., and Ulrich, R.A., 1983, A history of the petro-leum industry in the Four Corners area, in Fassett, J.E., ed., Oil and gas fields of the Four Corners area, volume III: Four Corners Geological Society, p. 804–810.
Mavor, M., and Nelson, C.R., 1997, Coalbed reservoir gas-in-place analysis: Chicago, Ill., Gas Research Institute, GRI Report no. GRI-97/0263, 134 p.
Mavor, M.J., Close, J.C., and Pratt, T.J., 1991, Western Cretaceous coal seam project summary of the Completion Optimization and Assessment Laboratory (COAL) site: Gas Research Institute Topical Report GRI-91/0377, 120 p.
Michael, G.E., Anders, D.E., and Law, B.E., 1993, Geochemi-cal evaluation of Upper Cretaceous Fruitland Formation coals, San Juan Basin, New Mexico and Colorado: Organic Geochemistry, v. 20, p. 475–498.
Molenaar, C.M., 1977a, San Juan Basin time-stratigraphic nomenclature chart, in Fassett, J.E., James, H.L., and Hodg-son, H.E., eds., San Juan Basin III: New Mexico Geological Society Guidebook, p. xii.
Molenaar, C.M., 1977b, Stratigraphy and depositional history of Upper Cretaceous rocks of the San Juan Basin area, New Mexico and Colorado, with a note on economic resources, in Fassett, J.E., ed., San Juan Basin III: New Mexico Geo-logical Society Guidebook, p. 159–166.
Moore, B.J., and Sigler, Stella, 1987, Analyses of natural gases, 1917–85: U. S. Bureau of Mines Information Circu-lar 9129, 1197 p.
Moran, J., 1996, Origin of iodine in the Anadarko Basin, Okla-homa: An 129I study: American Association of Petroleum Geologists Bulletin, v. 80, p. 685–694.
Moran, J., Fehn, U., and Hanor, J.S., 1995, Determination of source ages and migration patterns of brines from the U.S. Gulf Coast Basin using 129I: Geochimica et Cosmochimica Acta, v. 59, no. 24, p. 5055–5069.
Moran, J., Fehn, U., and Teng, R.T.D., 1998, Variations in 129I/127I ratios in recent marine sediment: Evidence for a fossil organic component: Chemical Geology, no. 152, p. 193–203.
Needham, C.N., 1978, Schmitz Torreon-Puerco, in Fassett, J.E., ed., Oil and gas fields of the Four Corners area, volume II: Four Corners Geological Society, p. 482–485.
Nolte, E., Krauthan, P., Korschinek, G., Maloszewski, P., Fritz, P., and Wolf, M., 1991, Measurements and interpretations of 36Cl in groundwater, Milk River aquifer, Alberta, Canada: Applied Geochemistry, v. 6, p. 435–447.
Nummedal, D., and Molenaar, C.M., 1995, Sequence stratig-raphy of ramp-setting strand plain successions: the Gal-lup Sandstone, New Mexico, in Van Wagoner, J.C., and Bertram, G.T., eds., Sequence stratigraphy of foreland basin deposits: American Association of Petroleum Geologists Memoir 64, p. 277–310.
Oldacker, P.R., 1991, Hydrogeology of the Fruitland For-mation, San Juan Basin, Colorado and New Mexico, in Schwochow, S.D., ed., Coalbed methane of Western North America: Rocky Mountain Association of Geologists, p. 61–66.
Owen, D.E., and Siemers, C.T., 1977, Lithologic correlation of the Dakota Sandstone and adjacent units along the eastern flank of the San Juan Basin, New Mexico, in Fassett, J.E., ed., San Juan Basin III: New Mexico Geological Society Guidebook, p. 179–183.

90 Total Petroleum Systems and Geologic Assessment of Undiscovered Oil and Gas Resources in the San Juan Basin Province
Palmer, I.D., Mavor, M.J., Seidle, J.P., Spitler, J.L., and Voltz, R.F., 1992, Open hole cavity completions in coalbed methane wells in the San Juan Basin: Society of Petroleum Engineers Paper SPE 24906, p. 501–516.
Pasley, M.A., Gregory, W.A., and Hart, G.F., 1991, Organic matter variations in transgressive and regressive shales: Organic Geochemistry, v. 17, p. 483–509.
Phillips, F.M., Peeters, L.A., Tansey, M.K., and Davis, S.N., 1986, Paleoclimatic inferences from an isotopic investiga-tion of groundwater in the central San Juan Basin, New Mexico: Quaternary Research, v. 26, p. 179–193.
Posamentier, H.W., Allen, G.P., James, D.P., and Tesson, M., 1992, Forced regressions in a sequence stratigraphic frame-work; concepts, examples, and exploration significance: American Association of Petroleum Geologists Bulletin, v. 76, p. 1687–1709.
Reeside, J.B., Jr., 1924, Upper Cretaceous and Tertiary forma-tions of the western part of the San Juan Basin, Colorado and New Mexico: U.S. Geological Survey Professional Paper 134, 117 p.
Rice, D.D., 1983, Relation of natural gas composition to ther-mal maturity and source rock type in San Juan Basin, north-western New Mexico and southwestern Colorado: American Association of Petroleum Geologist Bulletin, v. 67, no. 8, p. 1199–1218.
Rice, D.D., 1993, Composition and origins of coalbed gas: Proceedings International Coalbed Methane Symposium, v. 1993, p. 577–588.
Rice, D.D., Clayton, J.L., Flores, R.M., Law, B.E., and Stan-ton, R.W., 1992, Some geologic controls of coalbed gas generation, accumulation, and production, Western United States: U.S. Geological Survey Circular 1074, p. 64.
Rice, D.D., Clayton, J.L., and Pawlewicz, M.J., 1989, Char-acterization of coal-derived hydrocarbons and source-rock potential of coal beds, San Juan Basin, New Mexico and Colorado, U.S.A.: International Journal of Coal Geology, v. 13, p. 597–626.
Rice, D.D., and Finn, T.M., 1996, Coal-bed gas plays, in Gautier, D.L., Dolton, G.L., Takahashi, K.I., and Varnes, K.L., eds., 1995 National assessment of United States oil and gas resources—Results, methodology, and support-ing data: U.S. Geological Survey Digital Data Series 30, release 2.
Rice, D.D., Threlkeld, C.N., Vuletich, A.K., and Pawlewicz, M.J., 1988, Identification and significance of coal-bed gas, San Juan Basin, northwestern New Mexico and southwest-ern Colorado, in Fassett, J.E., ed., Geology and coal bed methane resources of the northern San Juan Basin, Colorado and New Mexico: Denver, Colo., Rocky Mountain Associa-tion of Geologists, p. 51–59.
Riggs, E.A., 1978, Bloomfield Farmington, in Fassett, J.E., ed., Oil and gas fields of the Four Corners area, volume I: Four Corners Geological Society, p. 243–244.
Riggs, E.A., 1983, Kiffen Nacimiento, in Fassett, J.E., ed., Oil and gas fields of the Four Corners area, volume III: Four Corners Geological Society, p. 972–974.
Ruf, J.C., and Erslev, E.A., 2005, Origin of Cretaceous to Holocene fractures in the northern San Juan Basin, Colo-rado and New Mexico: Rocky Mountain Geology, v. 40, no. 1, p. 91–114.
Schmoker, J.W., 1996, Methodology for assessing continuous-type (unconventional) hydrocarbon accumulations, in Gautier, D.L., Dolton, G.L., Takahashi, K.I., and Varnes, K.L., eds., 1995 National assessment of United States oil and gas resources—Results, methodology, and support-ing data: U.S. Geological Survey Digital Data Series 30, release 2.
Schmoker, J.W., 2003, U.S. Geological Survey assess-ment concepts for continuous petroleum accumulations, chap. 17 of USGS Uinta-Piceance Assessment Team, Petroleum systems and geologic assessment of oil and gas in the Uinta-Piceance Province, Utah and Colorado: U.S. Geological Survey Digital Data Series 69–B, 7 p. [http://pubs.usgs.gov/dds/dds-069/dds-069-b/chapters.html, last accessed 04/2008]
Schmoker, J.W., and Klett, T.R., 2003, U.S. Geological Survey assessment concepts for conventional petroleum accumula-tions, chap. 19 of USGS Uinta-Piceance Assessment Team, Petroleum systems and geologic assessment of oil and gas in the Uinta-Piceance Province, Utah and Colorado: U.S. Geological Survey Digital Data Series 69–B, 6 p. [http://pubs.usgs.gov/dds/dds-069/dds-069-b/chapters.html, last accessed 04/2008]
Scott, A.R., 1994, Coalbed gas composition, Upper Cre-taceous Fruitland Formation, San Juan Basin, Colorado and New Mexico: Colorado Geological Survey Open-File Report 94–2, 28 p.
Scott, A.R., and Kaiser, W.R., 1991, Relation between basin hydrology and Fruitland gas composition, San Juan Basin, Colorado and New Mexico: Quarterly Review of Methane Coal Seams Technology, v. 9, no. 1, p. 10–18.

Fruitland Total Petroleum System 91
Scott, A.R., Kaiser, W.R., and Ayers, W.B., Jr., 1991, Compo-sition, distribution, and origin of Fruitland Formation and Pictured Cliffs Sandstone gases, San Juan Basin, Colorado and New Mexico, in Schwochow, S.D., Murray, D.K., and Fahy, M.F., eds., Coalbed methane of western North America: Denver, Colo., Rocky Mountain Association of Geologists, p. 93–108.
Scott, A.R., Kaiser, W.R., and Ayers, W.B., Jr., 1994a, Thermal maturity of Fruitland coal and composition of Fruitland Formation and Pictured Cliffs Sandstone gases, in Ayers, W.B., Jr., and Kaiser, W.R., eds., Coalbed methane in the Upper Cretaceous Fruitland Formation San Juan Basin, New Mexico and Colorado: New Mexico Bureau of Mines and Mineral Resources Bulletin 146, p. 165–186.
Scott, A.R., Kaiser, W.R., and Ayers, W.B., Jr., 1994b, Ther-mogenic and secondary biogenic gases, San Juan Basin, Colorado and New Mexico—Implications for coalbed gas producibility: American Association of Petroleum Geolo-gists Bulletin, v. 78, no. 8, p. 1186–1209.
Shuck, E.L, Davis, T.L., and Benson, R.D., 1996, Multicom-ponent 3-D characterization of a coalbed methane reservoir: Geophysics, v. 61, no. 2, p. 315–330.
Sikkink, P.G.L., 1987, Lithofacies relationships and depositional environment of the Tertiary Ojo Alamo Sandstone and related strata, San Juan Basin, New Mexico and Colorado, in Fas-sett, J.E., and Rigby, J.K., Jr., eds., The Cretaceous-Tertiary boundary in the San Juan and Raton Basins, New Mexico and Colorado: Geological Society of America Special Paper 209, p. 81–104.
Smith, L.N., 1992, Stratigraphy, sediment dispersal, and paleo-geography of the lower Eocene San Jose Formation, San Juan Basin, New Mexico and Colorado, in Lucas, S.G., Kues, B.S., Williamson, T.E., and Hunt, A.P., eds., San Juan Basin IV: New Mexico Geological Society Guidebook, p. 297–309.
Snyder, G.T., Riese, W.C., Franks, S., Fehn, U., Pelzmann, W.L., Gorody, A.W., and Moran, J.E., 2003, Origin and his-tory of waters associated with coalbed methane:129I, 36Cl, and stable isotope results from the Fruitland Formation, Colorado and New Mexico: Geochimica et Cosmochimica Acta, v. 67, no. 23, p. 4529–4544.
Stach, E., Mackowsky, M. T., Teichmuller, M., Taylor, G.H., Chandra, D., and Teichmuller, R., 1982, Stach’s textbook of coal petrology, 3d revised and enlarged version: Berlin, Gebruder Borntraeger, 569 p.
Taylor, D.J., and Huffman, A.C., Jr., 1998, Map showing inferred and mapped basement faults, San Juan Basin and vicinity, New Mexico and Colorado: U.S. Geological Survey Geological Investigations Series I-2641, scale 1:500,000.
Taylor, D.J., and Huffman, A.C., Jr., 2001, Seismic evaluation study report —Jicarilla Apache Indian Reservation: U.S. Department of Energy Report DE-AI26-98BC15026R10 (CD-ROM).
Thorn, C.R., Levings, G.W., Craigg, S.D., Dam, W.L., and Kernodle, J.M., 1990, Hydrogeology of the Ojo Alamo Sand-stone in the San Juan structural basin, New Mexico, Colo-rado, Arizona, and Utah: U.S. Geological Survey Hydrologic Investigations Atlas 720–B.
Tissot, B., and Welte, D., 1987, Petroleum formation and occur-rence; a new approach to oil and gas exploration: Berlin, Springer-Verlag, 521 p.
Tremain, C.M., Laubach, S.E., and Whitehead, N.H., III, 1994, Fracture (cleat) patterns in Upper Cretaceous Fruit-land Formation coal seams, San Juan Basin: New Mexico Bureau of Mines and Mineral Resources Bulletin 146, p. 87–118.
Williamson, T.E., and Lucas, S.G., 1992, Stratigraphy and mammalian biostratigraphy of the Paleocene Nacimiento Formation, southern San Juan Basin, New Mexico, in Lucas, S.G., Kues, B.S., Williamson, T.E., and Hunt, A.P., eds., San Juan Basin IV: New Mexico Geological Society Guidebook, p. 265–296.
Wray, L.L., 2001, Geologic mapping and subsurface well log correlations of the Late Cretaceous Fruitland Forma-tion coal beds and carbonaceous shales—The stratigraphic mapping component of the 3M project, San Juan Basin, La Plata County, Colorado: Colorado Oil and Gas Conserva-tion Commission San Juan Basin Study Report, 15 p.
Wright Dunbar, R., 2001, Outcrop analysis of the Cretaceous Mesaverde Group—Jicarilla Apache Indian Reservation, New Mexico: U.S. Department of Energy Report DE-AI26-98BC15026R9 (CD-ROM).
Zeikus, J.G., and Winfrey, M.R., 1976, Temperature limita-tions of methanogenesis in aquatic sediments: Applied Environmental Microbiology, v. 31, p. 99–107.

92
Total Petroleum System
s and Geologic A
ssessment of U
ndiscovered Oil and G
as Resources in the San Juan Basin Province
Appendix A. Assessment results summary for the Fruitland Total Petroleum System, San Juan Basin Province, New Mexico and Colorado.
[MMBO, million barrels of oil; BCFG, billion cubic feet of gas; MMBNGL, million barrels of natural gas liquids. Results shown are fully risked estimates. For gas fields, all liquids are included under the NGL (natural gas liquids) category. F95 denotes a 95 percent chance of at least the amount tabulated. Other fractiles are defined similarly. Fractiles are additive only under the assumption of perfect positive correlation. CBG, coalbed gas. Gray column indicates not assessed or applicable]
Assessment Units (AU)
Field Type
Total Undiscovered Resources
Oil (MMBO) Gas (BCFG) NGL (MMBNGL)
F95 F50 F5 Mean F95 F50 F5 Mean F95 F50 F5 Mean
Conventional Oil and Gas Resources
Tertiary Conventional Gas AU Gas 25.76 74.40 152.91 79.98 0.23 0.73 1.83 0.84Continuous Gas Resources
Fruitland Fairway Coal-Bed Gas AU CBG 3,081.06 3,937.16 5,031.14 3,981.14 0.00 0.00 0.00 0.00Basin Fruitland Coal-Bed Gas AU CBG 17,342.26 19,543.12 22,023.27 19,594.74 0.00 0.00 0.00 0.00Pictured Cliffs Continuous Gas AU Gas 3,865.41 5,510.68 7,856.23 5,640.25 9.07 15.95 28.06 16.92Total 24,288.73 28,990.96 34,910.64 29,216.13 9.07 15.95 28.06 16.92

Fruitland Total Petroleum System 93
Page 1
Appendix B. Input data form used in evaluating the Fruitland Total Petroleum System, Pictured Cliffs Continuous Gas Assessment Unit (50220161), San Juan Basin Province.
Assessment Geologist:… S.M. Condon Date: 9/23/2002Region:…………………… North America Number: 5Province:…………………. San Juan Basin Number: 5022Total Petroleum System:. Fruitland Number: 502201Assessment Unit:………. Pictured Cliffs Continuous Gas Number: 50220161Based on Data as of:…… PI/Dwights 2001, Four Corners Geological SocietyNotes from Assessor…..
Assessment-Unit type: Oil (<20,000 cfg/bo) or Gas (>20,000 cfg/bo) GasWhat is the minimum total recovery per cell?… 0.02 (mmbo for oil A.U.; bcfg for gas A.U.)Number of tested cells:.………… 6809Number of tested cells with total recovery per cell > minimum: ……... 6352Established (>24 cells > min.) X Frontier (1-24 cells) Hypothetical (no cells)Median total recovery per cell (for cells > min.): (mmbo for oil A.U.; bcfg for gas A.U.)
1st 3rd discovered 0.66 2nd 3rd 0.56 3rd 3rd 0.33
Assessment-Unit Probabilities: Attribute Probability of occurrence (0-1.0)
1. CHARGE: Adequate petroleum charge for an untested cell with total recovery > minimum …… 1.02. ROCKS: Adequate reservoirs, traps, seals for an untested cell with total recovery > minimum. 1.03. TIMING: Favorable geologic timing for an untested cell with total recovery > minimum……….. 1.0
Assessment-Unit GEOLOGIC Probability (Product of 1, 2, and 3):………........……. 1.0
4. ACCESS: Adequate location for necessary petroleum-related activities for an untested cell with total recovery > minimum ……………………………………………………………… 1.0
1. Total assessment-unit area (acres): (uncertainty of a fixed value)minimum 4,041,000 median 4,206,000 maximum 4,297,000
2. Area per cell of untested cells having potential for additions to reserves in next 30 years (acres):(values are inherently variable)
calculated mean 96 minimum 40 median 90 maximum 200
3. Percentage of total assessment-unit area that is untested (%): (uncertainty of a fixed value)minimum 76 median 84 maximum 88
4. Percentage of untested assessment-unit area that has potential for additions to reserves innext 30 years (%): ( a necessary criterion is that total recovery per cell > minimum)(uncertainty of a fixed value) minimum 14 median 37 maximum 47
IDENTIFICATION INFORMATION
FORSPAN ASSESSMENT MODEL FOR CONTINUOUSACCUMULATIONS--BASIC INPUT DATA FORM (NOGA, Version 8, 8-16-02)
NO. OF UNTESTED CELLS WITH POTENTIAL FOR ADDITIONS TO RESERVES IN THE NEXT 30 YEARS
CHARACTERISTICS OF ASSESSMENT UNIT
Appendix B. Input data form used in evaluating the Fruitland Total Petroleum System, Pictured Cliffs Continuous Gas Assessment Unit (50220161), San Juan Basin Province.

94 Total Petroleum Systems and Geologic Assessment of Undiscovered Oil and Gas Resources in the San Juan Basin Province
Page 2
Appendix B. Input data form used in evaluating the Fruitland Total Petroleum System, Pictured Cliffs Continuous Gas Assessment Unit (50220161), San Juan Basin Province—Continued.
Total recovery per cell for untested cells having potential for additions to reserves in next 30 years:(values are inherently variable)(mmbo for oil A.U.; bcfg for gas A.U.) minimum 0.02 median 0.25 maximum 7
Oil assessment unit: minimum median maximum Gas/oil ratio (cfg/bo)………………………...……. NGL/gas ratio (bngl/mmcfg)………………….….
Gas assessment unit: Liquids/gas ratio (bliq/mmcfg)….…………..…… 1 3 5
Oil assessment unit: minimum median maximum API gravity of oil (degrees)…………….…………. Sulfur content of oil (%)………………………...… Drilling depth (m) ……………...…………….…… Depth (m) of water (if applicable)……………….
Gas assessment unit: Inert-gas content (%)……………………….....….. 0.20 1.00 4.00 CO2 content (%)………………………………..….. 0.05 1.00 2.50 Hydrogen-sulfide content (%)……………...……. 0.00 0.00 0.00 Drilling depth (m)…………………………………. 530 650 1360 Depth (m) of water (if applicable)……………….
Success ratios: calculated mean minimum median maximumFuture success ratio (%)..... 85 75 85 93
Historic success ratio, tested cells (%). 93
(values are inherently variable)SELECTED ANCILLARY DATA FOR UNTESTED CELLS
AVERAGE COPRODUCT RATIOS FOR UNTESTED CELLS, TO ASSESS COPRODUCTS
TOTAL RECOVERY PER CELL
(uncertainty of fixed but unknown values)

Fruitland Total Petroleum System 95
Page 1
Appendix C. Input data form used in evaluating the Fruitland Total Petroleum System, Basin Fruitland Coalbed Gas Assessment Unit (50220182), San Juan Basin Province.
Assessment Geologist:… J.L. Ridgley Date: 9/23/2002Region:…………………… North America Number: 5Province:…………………. San Juan Basin Number: 5022Total Petroleum System:. Fruitland Number: 502201Assessment Unit:………. Basin Fruitland Coalbed Gas Number: 50220182Based on Data as of:…… PI/Dwights 2001Notes from Assessor…..
Assessment-Unit type: Oil (<20,000 cfg/bo) or Gas (>20,000 cfg/bo) GasWhat is the minimum total recovery per cell?… 0.02 (mmbo for oil A.U.; bcfg for gas A.U.)Number of tested cells:.………… 4102Number of tested cells with total recovery per cell > minimum: ……... 3690Established (>24 cells > min.) X Frontier (1-24 cells) Hypothetical (no cells)Median total recovery per cell (for cells > min.): (mmbo for oil A.U.; bcfg for gas A.U.)
1st 3rd discovered 1 2nd 3rd 1.1 3rd 3rd 0.8
Assessment-Unit Probabilities: Attribute Probability of occurrence (0-1.0)
1. CHARGE: Adequate petroleum charge for an untested cell with total recovery > minimum …… 1.02. ROCKS: Adequate reservoirs, traps, seals for an untested cell with total recovery > minimum. 1.03. TIMING: Favorable geologic timing for an untested cell with total recovery > minimum……….. 1.0
Assessment-Unit GEOLOGIC Probability (Product of 1, 2, and 3):………........……. 1.0
4. ACCESS: Adequate location for necessary petroleum-related activities for an untested cell with total recovery > minimum ……………………………………………………………… 1.0
1. Total assessment-unit area (acres): (uncertainty of a fixed value)minimum 3,825,000 median 3,926,000 maximum 4,027,000
2. Area per cell of untested cells having potential for additions to reserves in next 30 years (acres):(values are inherently variable)
calculated mean 107 minimum 20 median 100 maximum 240
3. Percentage of total assessment-unit area that is untested (%): (uncertainty of a fixed value)minimum 80 median 89 maximum 95
4. Percentage of untested assessment-unit area that has potential for additions to reserves innext 30 years (%): ( a necessary criterion is that total recovery per cell > minimum)(uncertainty of a fixed value) minimum 45 median 55 maximum 60
IDENTIFICATION INFORMATION
FORSPAN ASSESSMENT MODEL FOR CONTINUOUSACCUMULATIONS--BASIC INPUT DATA FORM (NOGA, Version 8, 8-16-02)
NO. OF UNTESTED CELLS WITH POTENTIAL FOR ADDITIONS TO RESERVES IN THE NEXT 30 YEARS
CHARACTERISTICS OF ASSESSMENT UNIT
Appendix C. Input data form used in evaluating the Fruitland Total Petroleum System, Basin Fruitland Coalbed Gas Assessment Unit (50220182), San Juan Basin Province.

96 Total Petroleum Systems and Geologic Assessment of Undiscovered Oil and Gas Resources in the San Juan Basin Province
Page 2
Appendix C. Input data form used in evaluating the Fruitland Total Petroleum System, Basin Fruitland Coalbed Gas Assessment Unit (50220182), San Juan Basin Province—Continued.
Total recovery per cell for untested cells having potential for additions to reserves in next 30 years:(values are inherently variable)(mmbo for oil A.U.; bcfg for gas A.U.) minimum 0.02 median 0.6 maximum 20
Oil assessment unit: minimum median maximum Gas/oil ratio (cfg/bo)………………………...……. NGL/gas ratio (bngl/mmcfg)………………….….
Gas assessment unit: Liquids/gas ratio (bliq/mmcfg)….…………..…… 0 0 0
Oil assessment unit: minimum median maximum API gravity of oil (degrees)…………….…………. Sulfur content of oil (%)………………………...… Drilling depth (m) ……………...…………….…… Depth (m) of water (if applicable)……………….
Gas assessment unit: Inert-gas content (%)……………………….....….. 1.00 3.00 18.00 CO2 content (%)………………………………..….. 0.00 0.20 3.00 Hydrogen-sulfide content (%)……………...……. 0.00 0.00 0.00 Drilling depth (m)…………………………………. 70 750 1200 Depth (m) of water (if applicable)……………….
Success ratios: calculated mean minimum median maximumFuture success ratio (%)..... 80 70 80 90
Historic success ratio, tested cells (%). 90
(values are inherently variable)SELECTED ANCILLARY DATA FOR UNTESTED CELLS
AVERAGE COPRODUCT RATIOS FOR UNTESTED CELLS, TO ASSESS COPRODUCTS
TOTAL RECOVERY PER CELL
(uncertainty of fixed but unknown values)

Fruitland Total Petroleum System 97
Page 1
Appendix D. Input data form used in evaluating the Fruitland Total Petroleum System, Fruitland Fairway Coalbed Gas Assessment Unit (50220181), San Juan Basin Province.
Assessment Geologist:… J.L. Ridgley Date: 9/23/2002Region:…………………… North America Number: 5Province:…………………. San Juan Basin Number: 5022Total Petroleum System:. Fruitland Number: 502201Assessment Unit:………. Fruitland Fairway Coalbed Gas Number: 50220181Based on Data as of:…… PI/Dwights 2001Notes from Assessor…..
Assessment-Unit type: Oil (<20,000 cfg/bo) or Gas (>20,000 cfg/bo) GasWhat is the minimum total recovery per cell?… 0.02 (mmbo for oil A.U.; bcfg for gas A.U.)Number of tested cells:.………… 934Number of tested cells with total recovery per cell > minimum: ……... 890Established (>24 cells > min.) X Frontier (1-24 cells) Hypothetical (no cells)Median total recovery per cell (for cells > min.): (mmbo for oil A.U.; bcfg for gas A.U.)
1st 3rd discovered 9 2nd 3rd 13 3rd 3rd 8
Assessment-Unit Probabilities: Attribute Probability of occurrence (0-1.0)
1. CHARGE: Adequate petroleum charge for an untested cell with total recovery > minimum …… 1.02. ROCKS: Adequate reservoirs, traps, seals for an untested cell with total recovery > minimum. 1.03. TIMING: Favorable geologic timing for an untested cell with total recovery > minimum……….. 1.0
Assessment-Unit GEOLOGIC Probability (Product of 1, 2, and 3):………........……. 1.0
4. ACCESS: Adequate location for necessary petroleum-related activities for an untested cell with total recovery > minimum ……………………………………………………………… 1.0
1. Total assessment-unit area (acres): (uncertainty of a fixed value)minimum 227,000 median 227,000 maximum 227,000
2. Area per cell of untested cells having potential for additions to reserves in next 30 years (acres):(values are inherently variable)
calculated mean 163 minimum 20 median 160 maximum 320
3. Percentage of total assessment-unit area that is untested (%): (uncertainty of a fixed value)minimum 21 median 33 maximum 45
4. Percentage of untested assessment-unit area that has potential for additions to reserves innext 30 years (%): ( a necessary criterion is that total recovery per cell > minimum)(uncertainty of a fixed value) minimum 93 median 95 maximum 97
IDENTIFICATION INFORMATION
FORSPAN ASSESSMENT MODEL FOR CONTINUOUSACCUMULATIONS--BASIC INPUT DATA FORM (NOGA, Version 8, 8-16-02)
NO. OF UNTESTED CELLS WITH POTENTIAL FOR ADDITIONS TO RESERVES IN THE NEXT 30 YEARS
CHARACTERISTICS OF ASSESSMENT UNIT
Appendix D. Input data form used in evaluating the Fruitland Total Petroleum System, Basin Fruitland Fairway Coalbed Gas Assessment Unit (50220181), San Juan Basin Province.

98 Total Petroleum Systems and Geologic Assessment of Undiscovered Oil and Gas Resources in the San Juan Basin Province
Page 2
Appendix D. Input data form used in evaluating the Fruitland Total Petroleum System, Fruitland Fairway Coalbed Gas Assessment Unit (50220181), San Juan Basin Province—Continued.
Total recovery per cell for untested cells having potential for additions to reserves in next 30 years:(values are inherently variable)(mmbo for oil A.U.; bcfg for gas A.U.) minimum 0.02 median 8 maximum 40
Oil assessment unit: minimum median maximum Gas/oil ratio (cfg/bo)………………………...……. NGL/gas ratio (bngl/mmcfg)………………….….
Gas assessment unit: Liquids/gas ratio (bliq/mmcfg)….…………..…… 0 0 0
Oil assessment unit: minimum median maximum API gravity of oil (degrees)…………….…………. Sulfur content of oil (%)………………………...… Drilling depth (m) ……………...…………….…… Depth (m) of water (if applicable)……………….
Gas assessment unit: Inert-gas content (%)……………………….....….. 0.00 2.40 25.00 CO2 content (%)………………………………..….. 0.00 1.00 15.00 Hydrogen-sulfide content (%)……………...……. 0.00 0.00 0.00 Drilling depth (m)…………………………………. 300 750 1200 Depth (m) of water (if applicable)……………….
Success ratios: calculated mean minimum median maximumFuture success ratio (%)..... 95 93 95 97
Historic success ratio, tested cells (%). 95
(values are inherently variable)SELECTED ANCILLARY DATA FOR UNTESTED CELLS
AVERAGE COPRODUCT RATIOS FOR UNTESTED CELLS, TO ASSESS COPRODUCTS
TOTAL RECOVERY PER CELL
(uncertainty of fixed but unknown values)

Fruitland Total Petroleum System 99
Page 1
Appendix E. Input data form used in evaluating the Fruitland Total Petroleum System, Tertiary Conventional Gas Assessment Unit (50220101), San Juan Basin Province.
SEVENTH APPROXIMATIONDATA FORM FOR CONVENTIONAL ASSESSMENT UNITS (NOGA, Version 5, 6-30-01)
Assessment Geologist:…….. S.M. Condon Date: 9/23/2002Region:……………………….. North America Number: 5Province:……………………… San Juan Basin Number: 5022Total Petroleum System:…… Fruitland Number: 502201Assessment Unit:…………… Tertiary Conventional Gas Number: 50220101Based on Data as of:………. PI/Dwights 2001, NRG 2001 (data current through 1999)Notes from Assessor……….
CHARACTERISTICS OF ASSESSMENT UNIT
Oil (<20,000 cfg/bo overall) or Gas (>20,000 cfg/bo overall):… Gas
What is the minimum accumulation size?………. 0.5 mmboe grown(the smallest accumulation that has potential to be added to reserves in the next 30 years)
No. of discovered accumulations exceeding minimum size:………… Oil: 0 Gas: 1Established (>13 accums.) Frontier (1-13 accums.) X Hypothetical (no accums.)
Median size (grown) of discovered oil accumulation (mmbo):1st 3rd 2nd 3rd 3rd 3rd
Median size (grown) of discovered gas accumulations (bcfg):1st 3rd 2nd 3rd 3rd 3rd
Assessment-Unit Probabilities: Attribute Probability of occurrence (0-1.0)
1. CHARGE: Adequate petroleum charge for an undiscovered accum. > minimum size……………… 1.02. ROCKS: Adequate reservoirs, traps, and seals for an undiscovered accum. > minimum size…… 1.03. TIMING OF GEOLOGIC EVENTS: Favorable timing for an undiscovered accum. > minimum size 1.0
Assessment-Unit GEOLOGIC Probability (Product of 1, 2, and 3):……...…….....…. 1.0
4. ACCESSIBILITY: Adequate location to allow exploration for an undiscovered accumulation > minimum size……………………………………………………..………………..……..………… 1.0
UNDISCOVERED ACCUMULATIONSNo. of Undiscovered Accumulations: How many undiscovered accums. exist that are > min. size?:
(uncertainty of fixed but unknown values)
Oil Accumulations:…………………min. no. (>0) 0 median no. 0 max no. 0Gas Accumulations:……………….min. no. (>0) 1 median no. 5 max no. 10
Sizes of Undiscovered Accumulations: What are the sizes (grown) of the above accums?: (variations in the sizes of undiscovered accumulations)
Oil in Oil Accumulations (mmbo):…...…min. size median size max. sizeGas in Gas Accumulations (bcfg):…..…min. size 3 median size 12 max. size 120
IDENTIFICATION INFORMATION
Appendix E. Input data form used in evaluating the Fruitland Total Petroleum System, Tertiary Conventional Gas Assessment Unit (50220101), San Juan Basin Province.

100 Total Petroleum Systems and Geologic Assessment of Undiscovered Oil and Gas Resources in the San Juan Basin Province
Page 2
Appendix E. Input data form used in evaluating the Fruitland Total Petroleum System, Tertiary Conventional Gas Assessment Unit (50220101), San Juan Basin Province— Continued.
AVERAGE RATIOS FOR UNDISCOVERED ACCUMS., TO ASSESS COPRODUCTS(uncertainty of fixed but unknown values)
Oil Accumulations: minimum median maximum Gas/oil ratio (cfg/bo)………………………...……… NGL/gas ratio (bngl/mmcfg)…………………....….
Gas Accumulations: minimum median maximum Liquids/gas ratio (bliq/mmcfg)….…………..…….. 5 10 20 Oil/gas ratio (bo/mmcfg)………………………….…
SELECTED ANCILLARY DATA FOR UNDISCOVERED ACCUMULATIONS(variations in the properties of undiscovered accumulations)
Oil Accumulations: minimum median maximum API gravity (degrees)…………………….…………. Sulfur content of oil (%)………………………...….. Drilling Depth (m) ……………...…………….…….. Depth (m) of water (if applicable)……………...…..
Gas Accumulations: minimum median maximum Inert gas content (%)……………………….....…… 0.1 2 4 CO2 content (%)……………………………….....… 0.1 0.5 1 Hydrogen-sulfide content (%)………………...……. 0.1 0.7 2 Drilling Depth (m)…………………………………… 80 510 1020 Depth (m) of water (if applicable)………………….
Click here to return to Volume Title Page