geographically based hydrogen technical report
TRANSCRIPT

A national laboratory of the U.S. Department of EnergyOffice of Energy Efficiency & Renewable Energy
National Renewable Energy Laboratory Innovation for Our Energy Future
Geographically Based Hydrogen Consumer Demand and Infrastructure Analysis Final Report M. Melendez and A. Milbrandt
Technical Report NREL/TP-540-40373 October 2006
NREL is operated by Midwest Research Institute ● Battelle Contract No. DE-AC36-99-GO10337

Geographically Based Hydrogen Consumer Demand and Infrastructure Analysis Final Report M. Melendez and A. Milbrandt
Prepared under Task No. HF65.8310
Technical Report NREL/TP-540-40373 October 2006
National Renewable Energy Laboratory1617 Cole Boulevard, Golden, Colorado 80401-3393 303-275-3000 • www.nrel.gov
Operated for the U.S. Department of Energy Office of Energy Efficiency and Renewable Energy by Midwest Research Institute • Battelle
Contract No. DE-AC36-99-GO10337

NOTICE
This report was prepared as an account of work sponsored by an agency of the United States government. Neither the United States government nor any agency thereof, nor any of their employees, makes any warranty, express or implied, or assumes any legal liability or responsibility for the accuracy, completeness, or usefulness of any information, apparatus, product, or process disclosed, or represents that its use would not infringe privately owned rights. Reference herein to any specific commercial product, process, or service by trade name, trademark, manufacturer, or otherwise does not necessarily constitute or imply its endorsement, recommendation, or favoring by the United States government or any agency thereof. The views and opinions of authors expressed herein do not necessarily state or reflect those of the United States government or any agency thereof.
Available electronically at http://www.osti.gov/bridge
Available for a processing fee to U.S. Department of Energy and its contractors, in paper, from:
U.S. Department of Energy Office of Scientific and Technical Information P.O. Box 62 Oak Ridge, TN 37831-0062 phone: 865.576.8401 fax: 865.576.5728 email: mailto:[email protected]
Available for sale to the public, in paper, from: U.S. Department of Commerce National Technical Information Service 5285 Port Royal Road Springfield, VA 22161 phone: 800.553.6847 fax: 703.605.6900 email: [email protected] online ordering: http://www.ntis.gov/ordering.htm
Printed on paper containing at least 50% wastepaper, including 20% postconsumer waste

Table of Contents Executive Summary........................................................................................................................ 1
Background ..................................................................................................................................... 1
Research Methodology ................................................................................................................... 2
Demographics ............................................................................................................................. 2
Attribute Scores and Weights ..................................................................................................... 3
Hydrogen Vehicle Demand—Consumer Baseline Strategy ....................................................... 8
Stakeholder Review and Sensitivity Analyses.......................................................................... 10
Hydrogen Vehicle and Fuel Demand at Various Penetration Rates ......................................... 13
Regional Analysis ......................................................................................................................... 15
Conclusion .................................................................................................................................... 16
Future Work .............................................................................................................................. 16
Appendix A: Attributes in the U.S. 20-mile by 20-mile Grid ...................................................... 18
Appendix B: Monte Carlo Simulation Probability Functions....................................................... 23
Appendix C: Sample Regional Hydrogen Vehicle Demand—Consumer Strategy Baseline
Scenario................................................................................................................................... 24
Appendix D: Bibliography............................................................................................................ 29
iii

Executive Summary Infrastructure development analysis plays a critical role in understanding the best methods and techniques to use in the nascent hydrogen economy to foster hydrogen use in transportation. Most alternative fuel experts agree that infrastructure issues have been among the top barriers to transitioning to alternative transportation fuels. Matching emerging hydrogen vehicle demand with emerging infrastructure is critical to a successful transition. Because demand varies spatially, using a geographic information system (GIS) method to differentiate demand across the country is advantageous in assisting hydrogen stakeholders in targeting key markets. Using literature relating to alternative fuel deployment, along with the transportation sector's experience and expertise in this area, key attributes of consumers and policies were identified as critical for market acceptance of hydrogen vehicles. Consumer attributes are those that describe the consumer themselves, such as income, education level, and the number of vehicles they own. Policy attributes are those that are the result of external factors that influence the market for hydrogen vehicles, such as government incentives and local air quality. These attributes lay the foundation for a national look at how these efforts combine, resulting in the most preferred or likely locations for hydrogen demand to grow. The attributes were spatially quantified using GIS. Each attribute was quantified and combined with other attributes to achieve a relative demand for hydrogen in areas measuring 20 miles by 20 miles covering the entire United States. The analytical results indicate that the most suitable areas for early hydrogen market acceptance are in metropolitan areas, with rural areas being least desirable for initial deployment of hydrogen vehicles. The metropolitan areas with the greatest relative likelihood of adopting hydrogen vehicles include: 1) New York—Northern NJ—Long Island 2) Los Angeles—Riverside—Orange County 3) San Francisco—Oakland—San Jose 4) Boston—Worcester—Lawrence 5) Philadelphia—Wilmington—Atlantic City 6) Chicago—Gary—Kenosha 7) Washington—Baltimore 8) Sacramento—Yolo 9) San Diego 10) Dallas—Fort Worth
11) Houston—Galveston—Brazoria 12) Hartford 13) Minneapolis—St. Paul 14) Atlanta 15) Detroit—Ann Arbor—Flint 16) Phoenix—Mesa 17) Denver—Boulder—Greeley 18) Cleveland—Akron 19) Providence—Fall River—Warwick 20) Rochester
The results of this national-level analysis led to an initial analysis of some of these metropolitan areas to identify infrastructure that is most suitable within the metropolitan area. Similar methods were used to the national analysis. However, in metropolitan areas the attributes were examined on a census tract basis. These results demonstrate how demand varies within a given metropolitan area. The shape or breakdown of metro area demand varies widely from one city to another. Future work will examine emerging demand by region, including the incorporation of additional attributes such as traffic and existing infrastructure. Background Infrastructure development analysis explores the benefits and drawbacks of various options for installing hardware to serve a developing hydrogen demand. Most alternative fuel experts agree that infrastructure issues have been among the top barriers to transitioning to alternative transportation fuels. Therefore,
1

infrastructure analysis is a key component in the development of a hydrogen transportation system. Understanding consumer demand on a geographic basis is an important part of this analysis. Matching emerging hydrogen demand with emerging infrastructure is critical to a successful transition. In fiscal years (FY) 2004 and 2005, the National Renewable Energy Laboratory (NREL) developed a proposed minimal infrastructure to support nationwide deployment of hydrogen vehicles by offering infrastructure scenarios that facilitated interstate travel. The current (FY 2006) project aims to identify key metropolitan areas and regions on which to focus infrastructure efforts during the early hydrogen transition.
The objectives of this analysis are the following: 1. Quantify projected hydrogen vehicle demand across the country and in targeted metropolitan
areas. 2. Quantify the projected hydrogen fuel demands corresponding with different levels of hydrogen
vehicle demand to inform infrastructure analyses such as citing hydrogen fueling stations and selecting between centralized and distributed hydrogen production.
Research Methodology There are two general types of vehicle purchasers: consumers and fleets. Both groups have unique characteristics that affect how they choose vehicles to purchase and drive. This study examines how hydrogen vehicles could be deployed nationwide based on the consumer market. Various factors influence a consumer’s vehicle purchase decision, including purchaser characteristics (e.g., income and age) and external factors (e.g., vehicle rebates, interest rates, and tax incentives). To match emerging consumer demand for hydrogen vehicles with transitional hydrogen infrastructure, the spatial/geographic component of consumer demand must be understood. This analysis projects consumer demand for hydrogen vehicles based on geographic distribution and suggests how this demand would affect infrastructure requirements. The analysis consists of the following steps:
• Define Demographics: Key attributes affecting consumer acceptance of hydrogen vehicles are identified and spatially analyzed using geographic information systems (GIS).
• Score and Weight Each Attribute: Values are assigned to each attribute, and a total “score” is identified representing the likelihood of a consumer purchasing/operating a hydrogen vehicle.
• Conduct Stakeholder Review and Sensitivity Analyses: Stakeholder review and sensitivity analyses ensure that scores assigned for each demographic/characteristic are acceptable.
• Suggest Vehicle and Fuel Demand Scenarios at Various Penetration Rates: Hydrogen vehicle and fuel demands are evaluated for various rates of hydrogen vehicle penetration (e.g., 1%, 5%, and 10%).
Demographics Key attributes affecting hydrogen vehicle penetration into the consumer market were identified through a literature search (from FY 2004 and 2005 work) and interviews with vehicle technology transition experts, then reviewed and ranked by a focus group consisting of NREL personnel with expertise in advanced technology vehicle deployment (Table 1). These assumptions were also confirmed by various market studies and analyses related to hybrid and hydrogen vehicles conducted by researchers at UC Davis and Synovate.
2

Table 1. Attributes Affecting Hydrogen Vehicle Adoption by Consumers Attribute Impact Rationale
Households with Two or More Vehicles High Households with multiple vehicles more likely to adopt
hydrogen vehicles Education Medium Higher education leads to earlier adoption Household Income High Higher incomes lead to earlier adoption
Commute Distance Medium More time spent in a vehicle commuting interests consumers in newer and more efficient vehicles
State Incentives Medium Alternative fuel vehicle incentives could indicate future or existing hydrogen incentives
Clean Cities Coalitions Medium Coalitions pull funding opportunities together and create alternative fuel awareness
Air Quality Medium Low air quality leads to educated consumers and incentives Hybrid Vehicle Registrations Medium Early adopters of new gasoline vehicle technologies could be
early adopters of new hydrogen vehicle technologies Zero-Emission Vehicle (ZEV) Sales Mandate Medium Hydrogen vehicles qualify for these mandates
These attributes apply to a strategy in which the general public consumer is the primary focus of early hydrogen vehicle deployment, and they apply to the contiguous United States. Alternative or additional attributes might be considered for a strategy focusing on an early transition to fleets or for a targeted metropolitan area analysis for which more detailed data can be considered. Hydrogen vehicle demand can be described as a function of these attributes:
Equation 1. Consumer hydrogen vehicle demand = F (attributes)
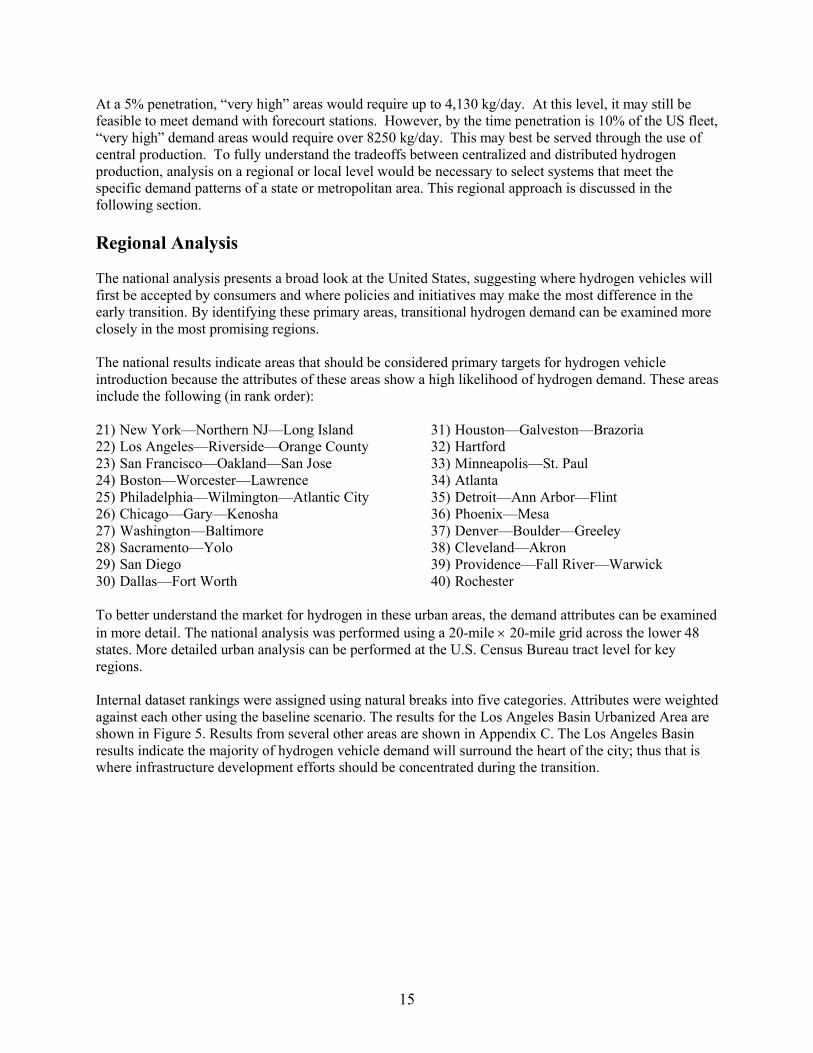
The data to support analysis of these attributes were collected from various sources, including the U.S. Census Bureau, the U.S. Department of Energy’s (DOE) Clean Cities Alternative Fuels Data Center (AFDC), and the Environmental Protection Agency. Attribute Scores and Weights The original datasets of each attribute have varying spatial presentations—some are at census tract level, whereas others are at county or state levels or actual locations. All these datasets were aggregated to a nationwide grid with cell size 20 miles by 20 miles using two standard GIS techniques: area-weighting and dominant component. Area-weighting is a common form of quantitative aggregation. Data values are multiplied by the percentage of the area a component covers and then divided by the total of the area percentages. Dominant component is applied to qualitative datasets such as air quality and state incentives. It takes the data value for the component covering the largest area of the cell and assigns that value to the entire cell. Appendix A shows the attributes in the U.S. 20-mile × 20-mile grid.
As outlined in Table 1, not all the attributes have an equal impact on hydrogen vehicle demand. To incorporate these inequalities into the analysis, preferences were incorporated into the corresponding model developed in ArcGIS 9.1 Model Builder. The Model Builder Spatial Analyst extension evaluates multiple attributes through classification, ranking, and weighted-overlay techniques to produce the results for each demand scenario. The Model Builder is very flexible. Models can be saved and rerun with different parameters. In addition, data can be added or replaced, and other modules can be attached. To perform the analysis effectively, attribute datasets were first ranked internally to value the data within the dataset. The attributes were then weighted in relation to other attributes.
3

Internal Dataset Ranking—There is no single best data classification method; each has advantages and disadvantages depending on the nature of the data and the type of information and analysis desired. In general, a classification method should maximize the between-class differences and minimize the within-class differences. The natural breaks classification was chosen for this study. This method identifies break points by looking for groupings and patterns inherent in the data. ArcGIS uses a complex statistical formula (Jenk’s Optimization) to identify break points by choosing the class breaks that best group similar value and maximize the differences between classes. The features are divided into classes with boundaries set where there are relatively big jumps in the data values. The major disadvantage is that the concept behind the classification may not be easily understood by all map users, and the legend values for the class breaks may not be intuitive. The advantage, however, is that it is one of the best ways to classify data that model natural human behaviors and patterns. The natural break method best applies to hydrogen vehicle demand because hydrogen vehicle demand patterns are not uniform by nature. Using the natural break classification method, we created seven classes within each data layer. The selection of seven groups was chosen because of the depth of analysis and the refinement of results it would provide. Then, we employed a ranking system of 1 to 7 to rate the values within each class used in the hydrogen demand model. A class was ranked 1 if its values had a “very low” influence on the chosen strategy (e.g., people with the lowest income would generate the lowest hydrogen vehicle demand). A class was ranked 7 if its values had a “very high” influence (e.g., people with the highest income would generate the highest hydrogen vehicle demand). Attribute Descriptions, Rankings, and Weightings—Based on the transportation experts’ valuing of the attributes (Table 1), attributes were weighted in relation to each other in ArcGIS in terms of low, medium, or high impact on hydrogen vehicle adoption. These are normalized so the weightings of all the attributes are equal to 100%. The following section describes each attribute as well as the attribute classification, ranking, and weighting for the consumer strategy baseline scenario. The results of this scenario are described below.
• Households with Two or More Vehicles o Data origin: 2000 U.S. Census o Data representation: number of households that have two or more vehicles o Rationale: Initial customers for hydrogen vehicles will be those in households that have at
least two vehicles because of limited hydrogen range and refueling opportunities. The NREL focus group considered this to be the most important factor in predicting hydrogen vehicle demand
4

Table 2. Households with Two or More Vehicles
Attribute
Values and Classification
(number of households)
Scoring of Classification Weighting
0 – 8,064 2 8,065 – 30,239 3 30,240 – 68,542 4 68,543 – 118,940 5 118,941 – 179,418 6 179,419 – 312,470 7
Two or More Vehicles per Household
312,471 – 516,079 7
15% (High)
• Education
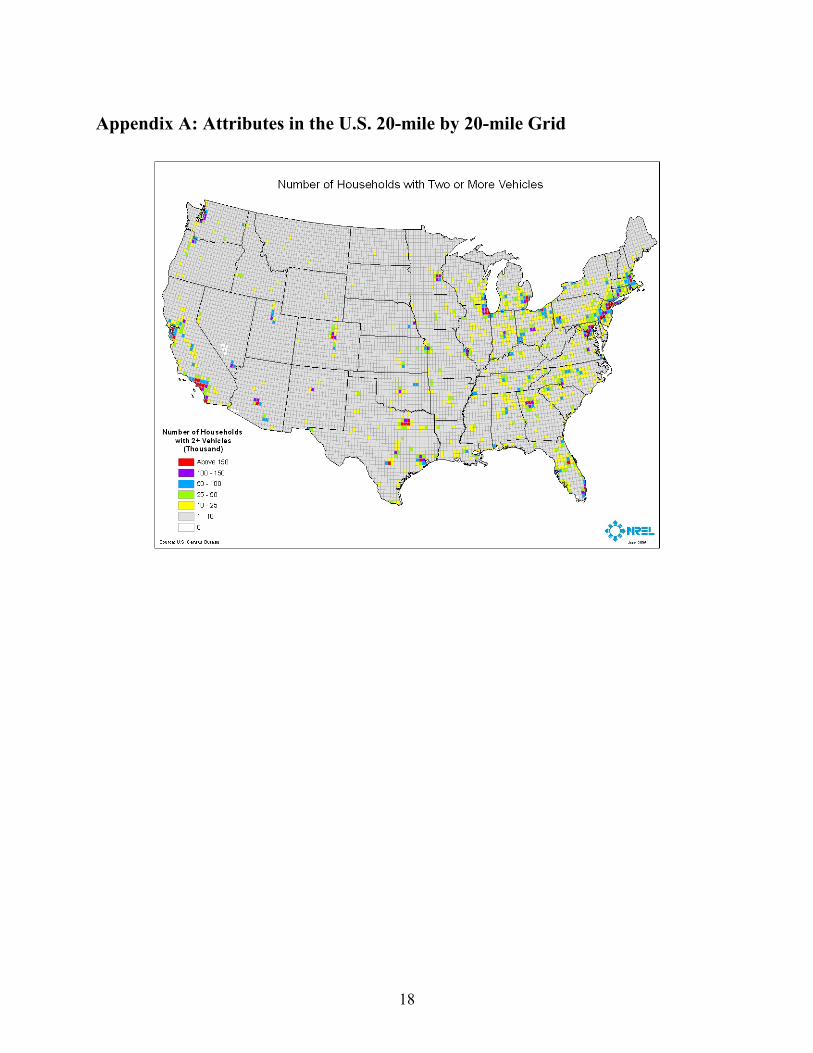
o Data origin: 2000 U.S. Census o Data representation: number of people with Bachelor degree or higher o Rationale: Initial customers for hydrogen vehicles will be those with higher education levels
Table 3. Education
Attribute Values and
Classification (number of people)
Scoring of Classification Weighting
0 – 14,106 2 14,107 – 51,562 3 51,563 – 123,778 4 123,779 – 228,464 5 228,465 – 415,520 6 415,521 – 943,876 7
Education
943,877 – 1,770,650 7
10% (Medium)
• Household Income
o Data origin: 2000 U.S. Census o Data representation: Median household income o Rationale: Initial customers for hydrogen vehicles will be those with higher income levels
Table 4. Household Income
Attribute
Values and Classification
(median income, $U.S.)
Scoring of Classification Weighting Score
0 – 15,404 1 15,405 – 24,747 2 24,748 – 30,672 3 30,673 – 36,151 4 36,152 – 43,108 5 43,109 – 54,954 6
Household Income
54,955 – 86,901 7
15% (High)
5
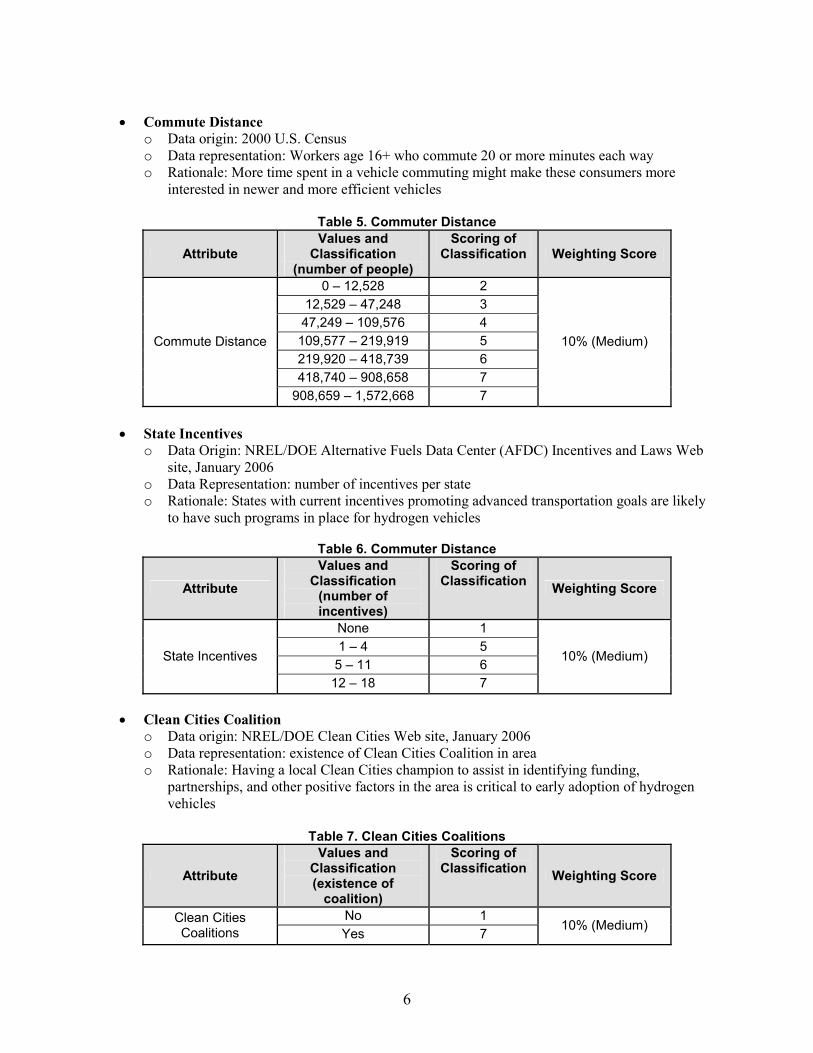
• Commute Distance
o Data origin: 2000 U.S. Census o Data representation: Workers age 16+ who commute 20 or more minutes each way o Rationale: More time spent in a vehicle commuting might make these consumers more
interested in newer and more efficient vehicles
Table 5. Commuter Distance
Attribute Values and
Classification (number of people)
Scoring of Classification Weighting Score
0 – 12,528 2 12,529 – 47,248 3 47,249 – 109,576 4 109,577 – 219,919 5 219,920 – 418,739 6 418,740 – 908,658 7
Commute Distance
908,659 – 1,572,668 7
10% (Medium)
• State Incentives
o Data Origin: NREL/DOE Alternative Fuels Data Center (AFDC) Incentives and Laws Web site, January 2006
o Data Representation: number of incentives per state o Rationale: States with current incentives promoting advanced transportation goals are likely
to have such programs in place for hydrogen vehicles
Table 6. Commuter Distance
Attribute
Values and Classification
(number of incentives)
Scoring of Classification Weighting Score
None 1 1 – 4 5
5 – 11 6 State Incentives
12 – 18 7
10% (Medium)
• Clean Cities Coalition
o Data origin: NREL/DOE Clean Cities Web site, January 2006 o Data representation: existence of Clean Cities Coalition in area o Rationale: Having a local Clean Cities champion to assist in identifying funding,
partnerships, and other positive factors in the area is critical to early adoption of hydrogen vehicles
Table 7. Clean Cities Coalitions
Attribute
Values and Classification (existence of
coalition)
Scoring of Classification Weighting Score
No 1 Clean Cities Coalitions Yes 7 10% (Medium)
6

• Air Quality o Data origin: U.S. Environmental Protection Agency, 2004 o Data representation: non-attainment status of area (for one or more pollutants) o Rationale: Issues with local air pollution make consumers more aware of the impacts of
vehicles on air pollution and can lead to additional funding or programs for consumers to purchase cleaner vehicles
Table 8. Air Quality
Attribute Values and
Classification (level of non-attainment)
Scoring of Classification Weighting Score
None 1 Marginal 5 Moderate 6 Air Quality
Severe 7
10% (Medium)
• Hybrid Vehicle Registrations
o Data origin: R.L. Polk, 2005 o Data representation: number of hybrid vehicles registered o Rationale: Early adopters of new gasoline vehicle technologies could also be the early
adopters of new hydrogen vehicle technologies
Table 9. Registered Hybrid Vehicles
Attribute Values and
Classification (number of vehicles)
Scoring of Classification Weighting Score
0 – 11 1 12 – 67 2 68 – 168 3 169 – 371 4 372 – 685 5
686 – 1,550 6
Registered Hybrid Vehicles
1,551 – 2,875 7
10% (Medium)
• ZEV Sales Mandate
o Data origin: NREL/DOE AFDC Incentives and Laws Web site, January 2006 o Data representation: existence of state ZEV mandate o Rationale: This regulation will increase the likelihood that hydrogen vehicles are offered by
manufacturers in these states
Table 10. Registered Hybrid Vehicles
Attribute
Values and Classification (existence of
mandate)
Scoring of Classification Weighting Score
No 1 ZEV Sales Mandate Yes 7 10% (Medium)
7
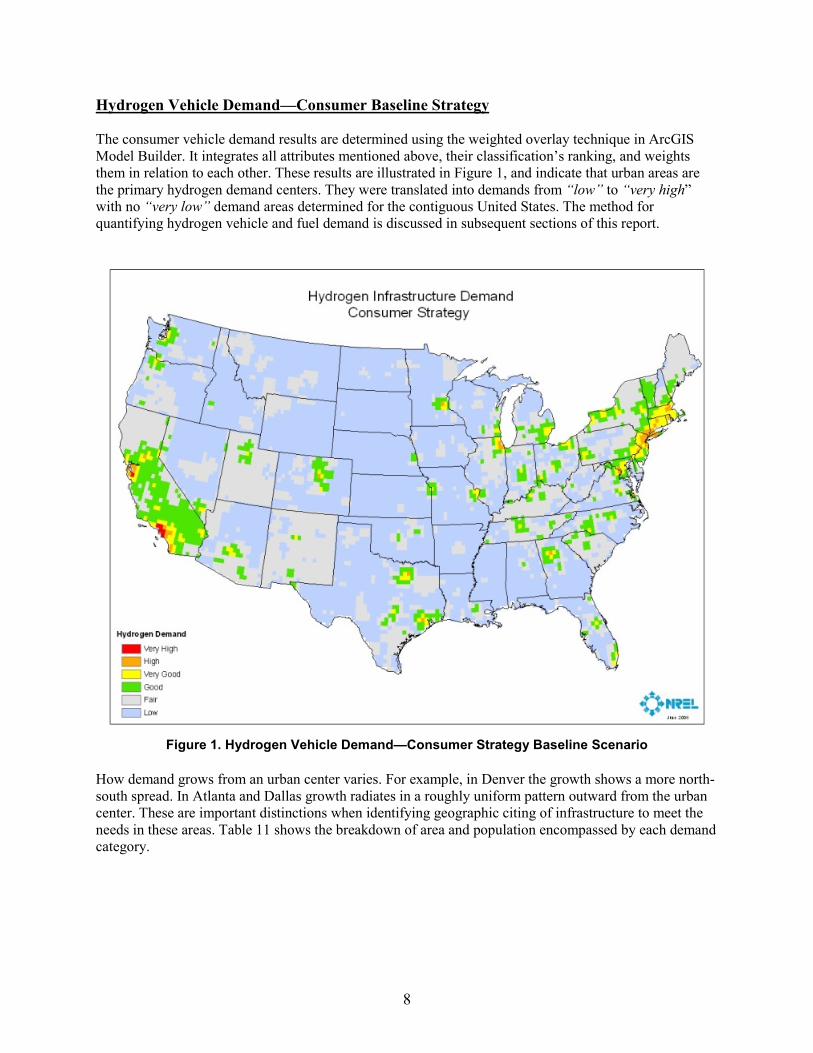
Hydrogen Vehicle Demand—Consumer Baseline Strategy The consumer vehicle demand results are determined using the weighted overlay technique in ArcGIS Model Builder. It integrates all attributes mentioned above, their classification’s ranking, and weights them in relation to each other. These results are illustrated in Figure 1, and indicate that urban areas are the primary hydrogen demand centers. They were translated into demands from “low” to “very high” with no “very low” demand areas determined for the contiguous United States. The method for quantifying hydrogen vehicle and fuel demand is discussed in subsequent sections of this report.
Figure 1. Hydrogen Vehicle Demand—Consumer Strategy Baseline Scenario
How demand grows from an urban center varies. For example, in Denver the growth shows a more north-south spread. In Atlanta and Dallas growth radiates in a roughly uniform pattern outward from the urban center. These are important distinctions when identifying geographic citing of infrastructure to meet the needs in these areas. Table 11 shows the breakdown of area and population encompassed by each demand category.
8
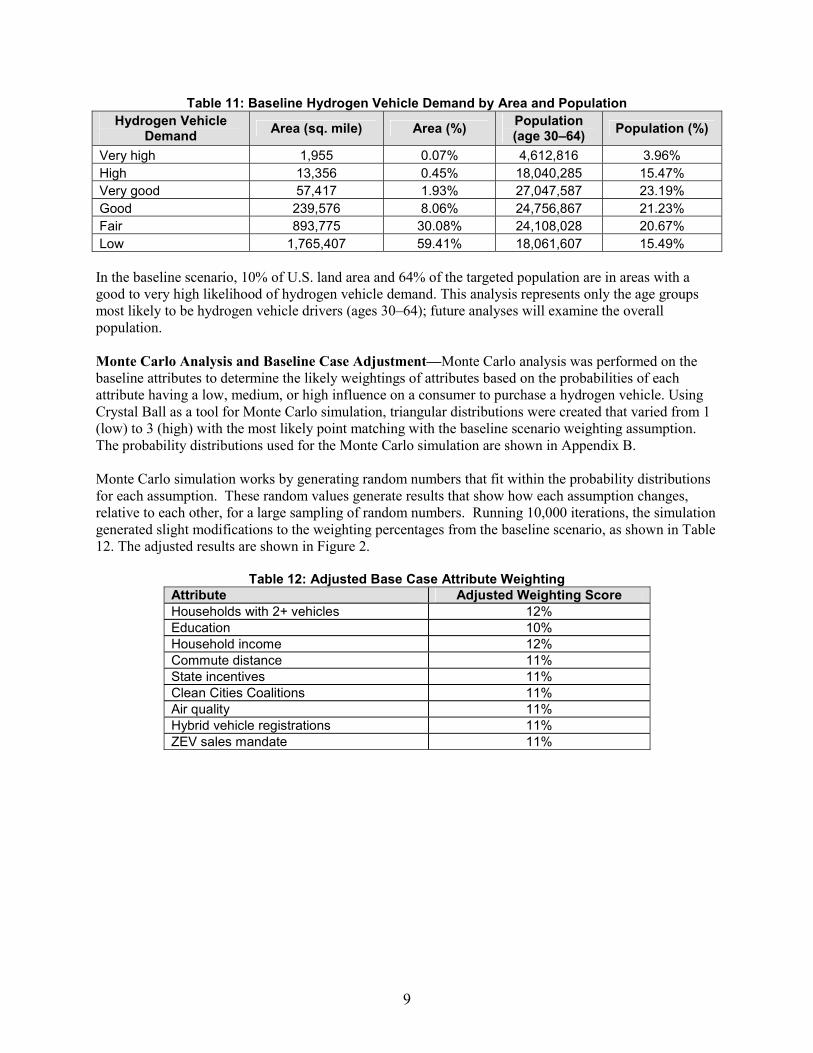
Table 11: Baseline Hydrogen Vehicle Demand by Area and Population Hydrogen Vehicle
Demand Area (sq. mile) Area (%) Population (age 30–64) Population (%)
Very high 1,955 0.07% 4,612,816 3.96% High 13,356 0.45% 18,040,285 15.47% Very good 57,417 1.93% 27,047,587 23.19% Good 239,576 8.06% 24,756,867 21.23% Fair 893,775 30.08% 24,108,028 20.67% Low 1,765,407 59.41% 18,061,607 15.49%
In the baseline scenario, 10% of U.S. land area and 64% of the targeted population are in areas with a good to very high likelihood of hydrogen vehicle demand. This analysis represents only the age groups most likely to be hydrogen vehicle drivers (ages 30–64); future analyses will examine the overall population. Monte Carlo Analysis and Baseline Case Adjustment—Monte Carlo analysis was performed on the baseline attributes to determine the likely weightings of attributes based on the probabilities of each attribute having a low, medium, or high influence on a consumer to purchase a hydrogen vehicle. Using Crystal Ball as a tool for Monte Carlo simulation, triangular distributions were created that varied from 1 (low) to 3 (high) with the most likely point matching with the baseline scenario weighting assumption. The probability distributions used for the Monte Carlo simulation are shown in Appendix B. Monte Carlo simulation works by generating random numbers that fit within the probability distributions for each assumption. These random values generate results that show how each assumption changes, relative to each other, for a large sampling of random numbers. Running 10,000 iterations, the simulation generated slight modifications to the weighting percentages from the baseline scenario, as shown in Table 12. The adjusted results are shown in Figure 2.
Table 12: Adjusted Base Case Attribute Weighting Attribute Adjusted Weighting Score Households with 2+ vehicles 12% Education 10% Household income 12% Commute distance 11% State incentives 11% Clean Cities Coalitions 11% Air quality 11% Hybrid vehicle registrations 11% ZEV sales mandate 11%
9

Figure 2. Hydrogen Vehicle Demand—Consumer Strategy Adjusted Baseline Scenario
Stakeholder Review and Sensitivity Analyses Stakeholder review was performed to validate attributes and their characteristics. Review meetings with hydrogen stakeholders—including representatives from automotive original equipment manufacturers and fuel companies—have resulted in attribute refinements. For example, the representation of the attribute households with two or more vehicles was changed from a percentage of households with two or more vehicles to an absolute number of households with two or more vehicles; this change shifts predicted demand more toward urban areas. Also, the attribute ZEV sales mandate was created by breaking it out of the state incentives attribute; stakeholder feedback indicated that ZEV mandates have a particularly strong effect on vehicle manufacturers’ ZEV compliance and sales plans. These and other stakeholder suggestions are incorporated into the attribute descriptions above. Sensitivity analyses were conducted to explore the sensitivity of hydrogen vehicle demand projections to changes in attribute weighting scores. Two scenarios—the demographic emphasis scenario and the policy emphasis scenario—were created and are described below. Demographic Emphasis Scenario—Under this scenario, attributes related to the consumers themselves were given the highest weighting. In this case, “who the consumer is” was very important, whereas their environment (e.g., air quality or government policies) was assigned less importance. The weightings are shown in Table 13, and the resulting demand is shown in Figure 3.
10
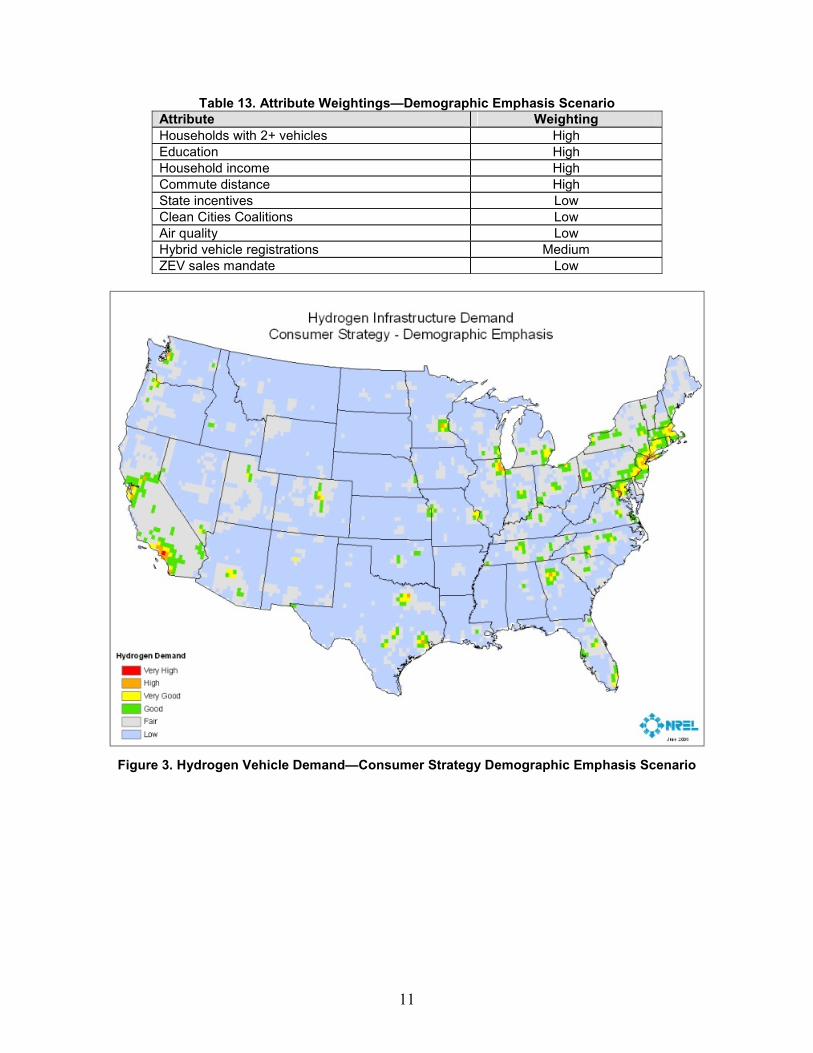
Table 13. Attribute Weightings—Demographic Emphasis Scenario Attribute Weighting Households with 2+ vehicles High Education High Household income High Commute distance High State incentives Low Clean Cities Coalitions Low Air quality Low Hybrid vehicle registrations Medium ZEV sales mandate Low
Figure 3. Hydrogen Vehicle Demand—Consumer Strategy Demographic Emphasis Scenario
11

Under this scenario, demand is more concentrated in areas with high population, i.e., in urban centers. The spread of demand from these urban centers is less than it is when policies and other external factors (air quality and Clean Cities Coalitions) have a higher influence on consumer hydrogen vehicle demand Table 14 shows the breakdown of area and population encompassed by each demand category.
Table 14. Demographic Emphasis Scenario Hydrogen Vehicle Demand by Area and Population
Hydrogen Vehicle Demand Area (sq. miles) Area (%) Population (age 30–64) Population (%)
Very high 356 0.01% 898,742 0.77% High 8,895 0.30% 17,330,758 14.86% Very good 34,015 1.14% 24,914,511 21.36% Good 108,184 3.64% 24,434,580 20.95% Fair 719,476 24.21% 28,746,209 24.65% Low 2,100,560 70.69% 20,302,390 17.41%
In the demographic emphasis scenario, 5% of U.S. land area and 58% of the targeted population are covered in areas with a good to very high likelihood of hydrogen vehicle demand. Policy Emphasis Scenario—Under this scenario, attributes related to or leading to government policy were considered most important, whereas the importance of consumer demographic information was minimized. The exception was households with two or more vehicles, which was considered to be the most important attribute in all scenarios and a virtual prerequisite for consumer hydrogen vehicle demand. Attribute weightings are shown in Table 15, and the resulting demand is shown in Figure 4. The results show the effect that government policies and incentives, if effective in influencing consumers, can have on hydrogen vehicle demand. Table 16 shows the breakdown of area and population encompassed by each demand category.
Table 15. Attribute Weightings—Policy Emphasis Scenario Attribute Weighting Households with 2+ vehicles High Education Low Household income Low Commute distance Low State incentives High Clean Cities Coalitions High Air quality High Hybrid vehicle registrations Medium ZEV sales mandate High
12

Figure 4. Hydrogen Vehicle Demand—Consumer Strategy Policy Emphasis Scenario
Table 16. Policy Emphasis Scenario Hydrogen Vehicle Demand by Area and Population Hydrogen Vehicle Demand Area (sq. miles) Area (%)
Population (age 30–64) Population (%)
Very high 2,885 0.10% 8,016,523 6.87% High 20,439 0.69% 15,846,827 13.59% Very good 111,105 3.74% 30,420,350 26.08% Good 317,461 10.68% 20,469,898 17.55% Fair 751,636 25.29% 20,885,021 17.91% Low 1,767,960 59.50% 20,988,571 18.00%
In the policy emphasis scenario, 15% of U.S. land area and 64% of the targeted population is covered in areas with a good to very high likelihood of hydrogen vehicle demand. Hydrogen Vehicle and Fuel Demand at Various Penetration Rates This analysis identifies the top 20 urban areas for likely penetration of hydrogen vehicles in the near-term, i.e., the urban areas most likely to have high numbers of early technology adopters for hydrogen vehicles. Following are the top areas, ranked in order of projected hydrogen vehicle penetration:
13
1) New York—Northern NJ—Long Island 11) Houston—Galveston—Brazoria 2) Los Angeles—Riverside—Orange County 12) Hartford 3) San Francisco—Oakland—San Jose 13) Minneapolis—St. Paul 4) Boston—Worcester—Lawrence 14) Atlanta 5) Philadelphia—Wilmington—Atlantic City 15) Detroit—Ann Arbor—Flint 6) Chicago—Gary—Kenosha 16) Phoenix—Mesa 7) Washington—Baltimore 17) Denver—Boulder—Greeley 8) Sacramento—Yolo 18) Cleveland—Akron 9) San Diego 19) Providence—Fall River—Warwick 10) Dallas—Fort Worth 20) Rochester To translate the relative demand weightings into actual quantities of hydrogen fuel demand in kilograms, the calculated values (very high, high, very good, good, fair, and low) were applied to the penetration of vehicles across the country. Using the U.S. Energy Information Administration estimate for passenger vehicles in the United States in 2030—281 million vehicles—hydrogen vehicles were distributed nationwide based on the relative demand weightings in each area of the country and penetration rates of 1%, 5%, and 10% using the following methodology.
Equation 2.
leetUSVehicleFetrationVehiclePen
ingCellWeightCellslowrCellVehiclesPe
VeryHigh
Low
×
×=
∑#)(
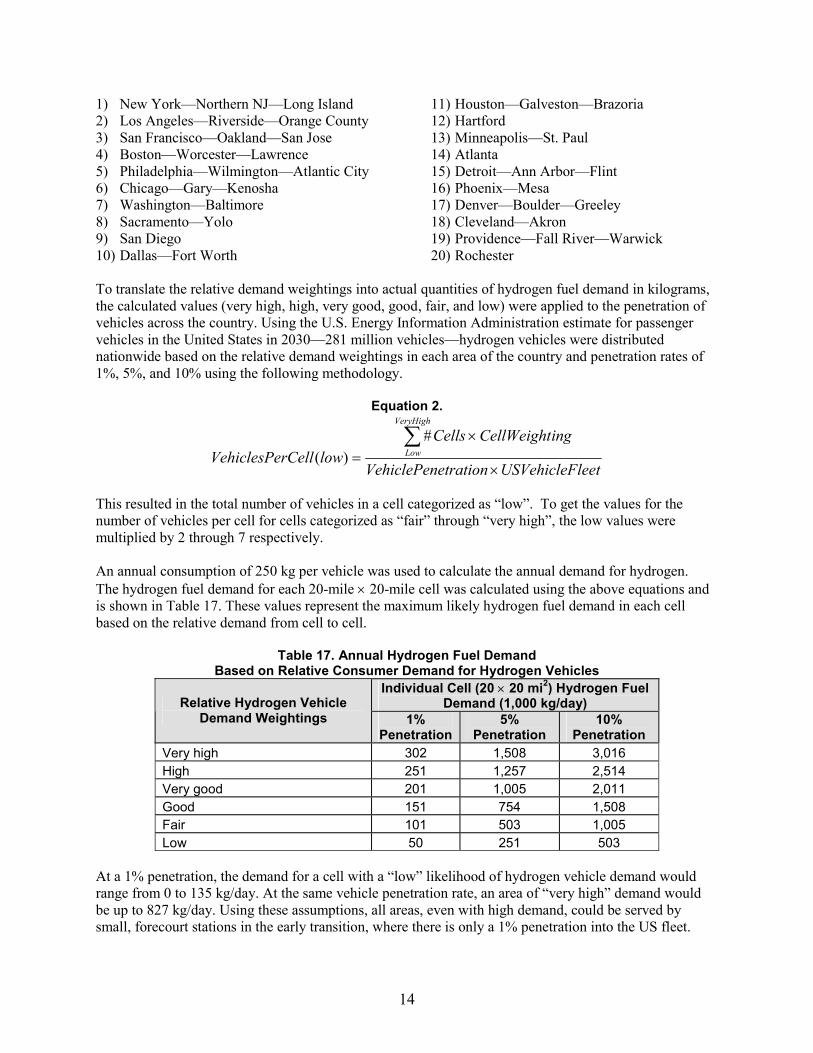
This resulted in the total number of vehicles in a cell categorized as “low”. To get the values for the number of vehicles per cell for cells categorized as “fair” through “very high”, the low values were multiplied by 2 through 7 respectively. An annual consumption of 250 kg per vehicle was used to calculate the annual demand for hydrogen. The hydrogen fuel demand for each 20-mile × 20-mile cell was calculated using the above equations and is shown in Table 17. These values represent the maximum likely hydrogen fuel demand in each cell based on the relative demand from cell to cell.
Table 17. Annual Hydrogen Fuel Demand Based on Relative Consumer Demand for Hydrogen Vehicles
Individual Cell (20 × 20 mi2) Hydrogen Fuel Demand (1,000 kg/day) Relative Hydrogen Vehicle
Demand Weightings 1% Penetration
5% Penetration
10% Penetration
Very high 302 1,508 3,016 High 251 1,257 2,514 Very good 201 1,005 2,011 Good 151 754 1,508 Fair 101 503 1,005 Low 50 251 503
At a 1% penetration, the demand for a cell with a “low” likelihood of hydrogen vehicle demand would range from 0 to 135 kg/day. At the same vehicle penetration rate, an area of “very high” demand would be up to 827 kg/day. Using these assumptions, all areas, even with high demand, could be served by small, forecourt stations in the early transition, where there is only a 1% penetration into the US fleet.
14
At a 5% penetration, “very high” areas would require up to 4,130 kg/day. At this level, it may still be feasible to meet demand with forecourt stations. However, by the time penetration is 10% of the US fleet, “very high” demand areas would require over 8250 kg/day. This may best be served through the use of central production. To fully understand the tradeoffs between centralized and distributed hydrogen production, analysis on a regional or local level would be necessary to select systems that meet the specific demand patterns of a state or metropolitan area. This regional approach is discussed in the following section. Regional Analysis The national analysis presents a broad look at the United States, suggesting where hydrogen vehicles will first be accepted by consumers and where policies and initiatives may make the most difference in the early transition. By identifying these primary areas, transitional hydrogen demand can be examined more closely in the most promising regions. The national results indicate areas that should be considered primary targets for hydrogen vehicle introduction because the attributes of these areas show a high likelihood of hydrogen demand. These areas include the following (in rank order): 21) New York—Northern NJ—Long Island 22) Los Angeles—Riverside—Orange County 23) San Francisco—Oakland—San Jose 24) Boston—Worcester—Lawrence 25) Philadelphia—Wilmington—Atlantic City 26) Chicago—Gary—Kenosha 27) Washington—Baltimore 28) Sacramento—Yolo 29) San Diego 30) Dallas—Fort Worth
31) Houston—Galveston—Brazoria 32) Hartford 33) Minneapolis—St. Paul 34) Atlanta 35) Detroit—Ann Arbor—Flint 36) Phoenix—Mesa 37) Denver—Boulder—Greeley 38) Cleveland—Akron 39) Providence—Fall River—Warwick 40) Rochester
To better understand the market for hydrogen in these urban areas, the demand attributes can be examined in more detail. The national analysis was performed using a 20-mile × 20-mile grid across the lower 48 states. More detailed urban analysis can be performed at the U.S. Census Bureau tract level for key regions. Internal dataset rankings were assigned using natural breaks into five categories. Attributes were weighted against each other using the baseline scenario. The results for the Los Angeles Basin Urbanized Area are shown in Figure 5. Results from several other areas are shown in Appendix C. The Los Angeles Basin results indicate the majority of hydrogen vehicle demand will surround the heart of the city; thus that is where infrastructure development efforts should be concentrated during the transition.
15

Figure 5. Hydrogen Vehicle Demand—Consumer Strategy Baseline Scenario, Los Angeles Basin
This detailed urban area analysis is also beneficial because additional attributes for which datasets are difficult to obtain on a national basis can be incorporated and used specifically to site hydrogen infrastructure. Examples of additional attributes include traffic volumes, retail centers, and existing conventional refueling stations. These attributes have been considered and infrastructure proposed in a related NREL project. The details of that project are being documented and published in parallel with this project. Conclusion This analysis shows that projected consumer demand for hydrogen vehicles and fuel is not uniform. It also shows how projected demand can be affected geographically by various demographic and policy-related attributes. The resulting spatial demand calculations are an asset to other models and analyses that depend on demand to evaluate feasibility and costs. Using these analyses, specific infrastructure can be proposed and evaluated based on expected demand on a regional or local basis. Future Work Further development of the regional approach to infrastructure selection to meet consumer demand will be conducted in FY 2007. This work will examine key metropolitan statistical areas and the regions surrounding and connecting them to determine the best placement of infrastructure to meet consumer
16

needs. Pending FY 2007 funding, consumer refueling habits and market research regarding consumer refueling also will be considered and incorporated into this analysis. This project addresses emerging near-term hydrogen demand for the general public consumer. However, another key strategy in the near-term is the use of fleets as a seed for further hydrogen market development. For an infrastructure to serve fleet customers and public consumers, it is important to understand where hydrogen demand will develop and where the needs of consumers and fleets overlap. Additional funding will be required in FY 2007 for collection of fleet data and analysis of fleet demand using the methods described in this FY 2006 analysis.
17
Appendix A: Attributes in the U.S. 20-mile by 20-mile Grid
18
19

20

21

22
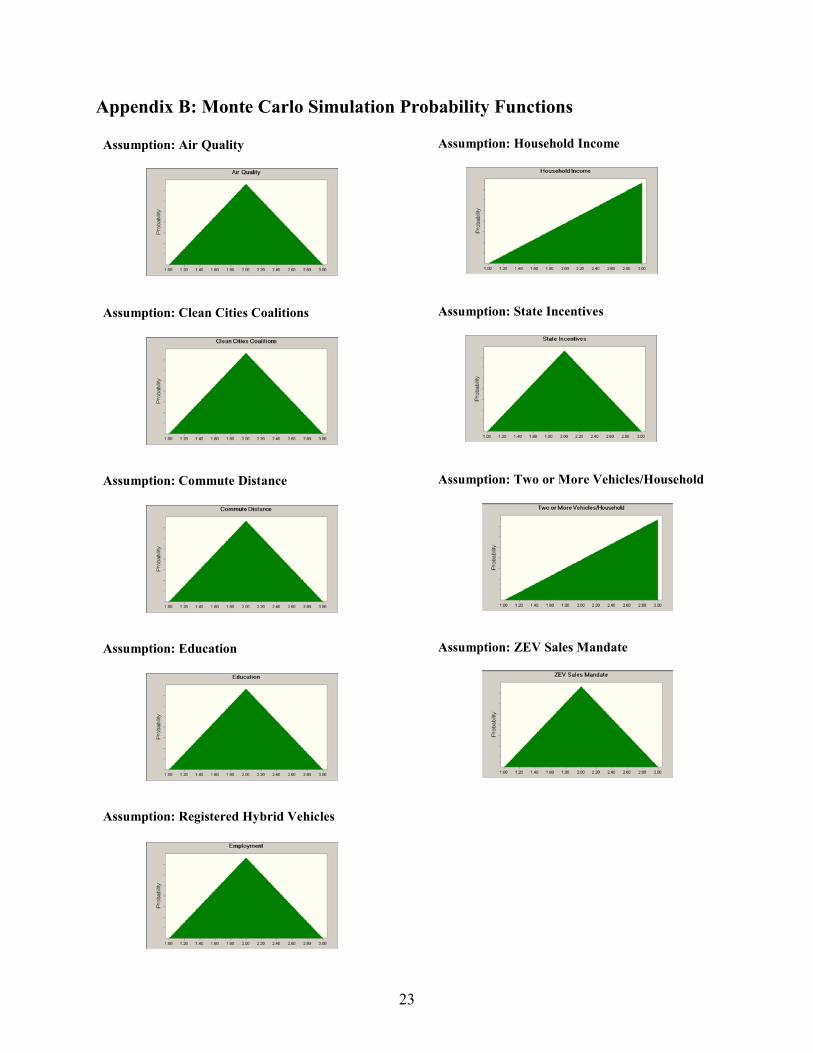
Appendix B: Monte Carlo Simulation Probability Functions
Assumption: Air Quality
Assumption: Clean Cities Coalitions
Assumption: Commute Distance
Assumption: Education
Assumption: Registered Hybrid Vehicles
Assumption: Household Income
Assumption: State Incentives
Assumption: Two or More Vehicles/Household
Assumption: ZEV Sales Mandate
23
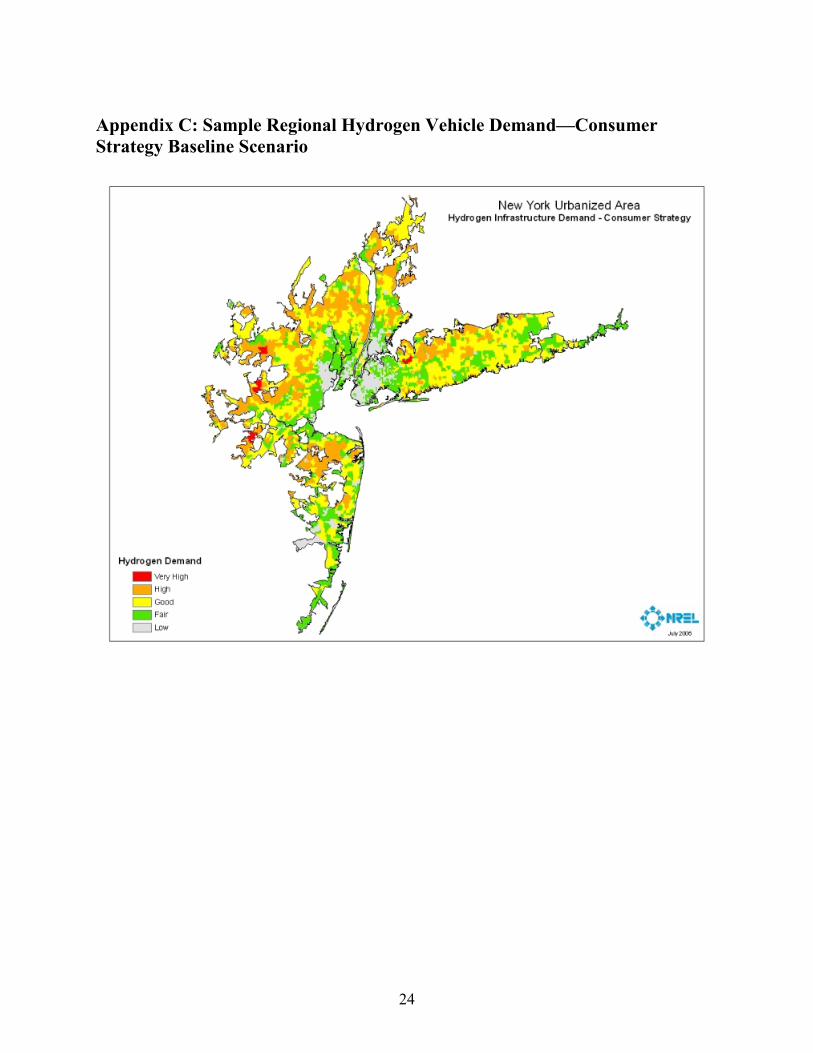
Appendix C: Sample Regional Hydrogen Vehicle Demand—Consumer Strategy Baseline Scenario
24

25

26

27

28
Appendix D: Bibliography
Baxley, P.; Verdugo-Peralta, C.; Weiss, W. California Hydrogen Highway Network Rollout Strategy Topic Team. Sacramento, CA: California Hydrogen Highway Network, November 2004.
Baxter-Clemmons, S. “California Hydrogen Highway Network Rollout Strategy” [Presentation]. Sacramento, CA: California Environmental Protection Agency, 2005.
Brown, M.H.; Breckenridge, L. State Alternative Fuel Vehicle Incentives: A Decade and More of Lessons Learned. Item #4151. Denver, CO: National Conference of State Legislatures, February 2001.
California Environmental Protection Agency. California Hydrogen Blueprint Plan, Volume 1. Sacramento, CA: California Environmental Protection Agency, May 2005.
Code of Federal Regulations, 10 CFR Part 490. Alternative Fuel Transportation Program: Private and Local Government Fleet Determination. Washington, DC: U.S. Government Printing Office, January 2004.
CONEG Policy Research Center. Refueling Alternative Fuel Vehicles: Lessons Learned from the Marketplace. Washington, DC: Coalition of Northeastern Governors, 1995.
DeCicco, J.; Bernow, S.; Gordon, D.; Goldstein, D.; Holtzclaw, J.; Ledbetter, M.; Miller, P.; Sachs, H. “Transportation on a Greenhouse Planet: A Least-Cost Transition Scenario for the United States.” T931. Washington, DC: American Council for an Energy-Efficient Economy, 1993.
DeCicco, J.M. “Fuel Cell Vehicles: Technology, Market, and Policy Issues.” Future Car Congress; June 2002, Hyatt Crystal City, Virginia. 2002-01-1973. Warrendale, PA: Society of Automotive Engineers, June 2002.
DeCicco, J.M. “The ‘Chicken or Egg’ Problem Writ Large: Why a Hydrogen Fuel Cell Focus is Premature,” Chapter 15. Sperling, D., Cannon, J., eds. The Hydrogen Energy Transition. St. Louis, MO: Elsevier Academic Press, 2004.
Jackson, M.D.; Kaahaaina, N.; Fable, S. “Lessons Learned from Past Strategies to Reduce Petroleum Dependence.” Presentation to the California Air Resources Board—California Energy Commission Staff Workshop on California Strategy on Petroleum Dependence, Sacramento, CA, September 2001.
Leiby, P.; Rubin, J. “Transition Modeling of AFVs and Hybrids: Lessons Learned.” Presentation at the Asilomar Conference Center, Pacific Grove, CA, July 2005.
Leiby, P.; Rubin, J. “Understanding the Transition to New Fuels and Vehicles: Lessons Learned from Analysis and Experience of Alternative Fuel and Hybrid Vehicles,” Chapter 14. Sperling, D., Cannon, J., eds. The Hydrogen Energy Transition. St. Louis, MO: Elsevier Academic Press, 2004.
McCormick, G.L.; Russell, R.B. Alternative Bus Fuels: What Have We Learned. Camp Hill, PA: Gannett Fleming.
McNutt, B.; Rodgers, D. “Lessons Learned from 15 Years of Alternative Fuels Experience, 1988 to 2003,” Chapter 12. Sperling, D., Cannon, J., eds. The Hydrogen Energy Transition. St. Louis, MO: Elsevier Academic Press, 2004.
29
Miller, Scott; “Consumer Requirements for a Hydrogen Fueling Infrastructure: Findings from a Six Month In-Market Simulation”, Presentation to EVS 20, December 2003.
Nesbitt, K.; Sperling, D. Myths Regarding Alternative Fuel Vehicle Demand by Light-Duty Vehicle Fleets. UCD-ITS-REP-98-09. Davis, CA: University of California, Davis Institute of Transportation Studies, July 1998.
Parish, R. “Implementing Alternative Fuels in Transportation Vehicles” [Abstract]. Golden, CO: National Renewable Energy Laboratory, 2005.
Patterson, P.; Alson, J.; Lance, L.; Brown, K.; Hawkins, D.; Ditlow, C.; Dana, G. “Lessons from 30 Years of Automotive Energy and Air Quality Policy: An Interactive Round Table.” Davis, CA: University of California, Davis Institute of Transportation Studies, 1999.
Research Reports International. The Market for Alternative Fuel Vehicles. Evergreen, CO: Research Reports International, 2004.
Robertson, B.I.; Beard, L.K. “Lessons Learned in the Deployment of Alternative Fueled Vehicles,” Chapter 13. Sperling, D., Cannon, J., eds. The Hydrogen Energy Transition. St. Louis, MO: Elsevier Academic Press, 2004.
Santini, D.J.; Vyas, A.D. “How is Technology Adopted? A Discussion of Hybrid-Electric and Diesel Technology Consumer Preferences.” Argonne, IL: Argonne National Laboratory, 2004.
Schulte, I.; Hart, D.; van der Vorst, R. “Issues Affecting the Acceptance of Hydrogen Fuel.” International Journal of Hydrogen Energy; Vol. 29, 2003; p. 677.
Kurani, Ken; Heffner, Reid; Turrentine, Tom, “Consumers and Hybrids”, Presentation to SAE Hybrid Vehicle Technology Forum, February 2006.
U.S. Department of Energy. A National Vision of America's Transition to a Hydrogen Economy - to 2030 and Beyond. Washington, DC: U.S. Department of Energy, February 2002.
U.S. Department of Energy. Clean Cities 2004 Roadmap. Washington, DC: U.S. Department of Energy, 2004.
Wells, J. “Alternative Motor Fuels Impact on the Transportation Sector.” Testimony before Committee on Finance, U.S. Senate, July 10, 2001.
Wells, J. “Research and Development, Lessons Learned from Previous Research Could Benefit FreedomCar Initiative.” Testimony before the U.S. House of Representatives, June 6, 2002.
Wells, J. Energy Policy Act of 1992: Limited Progress in Acquiring Alternative Fuel Vehicles and Reaching Fuel Goals. GAO/RCED-00-59. Washington, DC: U.S. General Accounting Office, February 2000.
Zhao, J.; Melaina, M.W. “Transition to Hydrogen-Based Transportation in China: Lessons Learned from Alternative Fuel Vehicle Programs in the United States and China.” Energy Policy; Vol. 34, 2006; p. 1299.
30
REPORT DOCUMENTATION PAGE Form Approved OMB No. 0704-0188
The public reporting burden for this collection of information is estimated to average 1 hour per response, including the time for reviewing instructions, searching existing data sources, gathering and maintaining the data needed, and completing and reviewing the collection of information. Send comments regarding this burden estimate or any other aspect of this collection of information, including suggestions for reducing the burden, to Department of Defense, Executive Services and Communications Directorate (0704-0188). Respondents should be aware that notwithstanding any other provision of law, no person shall be subject to any penalty for failing to comply with a collection of information if it does not display a currently valid OMB control number. PLEASE DO NOT RETURN YOUR FORM TO THE ABOVE ORGANIZATION. 1. REPORT DATE (DD-MM-YYYY)
October 2006 2. REPORT TYPE
Technical Report 3. DATES COVERED (From - To)
5a. CONTRACT NUMBER
DE-AC36-99-GO10337
5b. GRANT NUMBER
4. TITLE AND SUBTITLE Geographically Based Hydrogen Consumer Demand and Infrastructure Analysis: Final Report
5c. PROGRAM ELEMENT NUMBER
5d. PROJECT NUMBER NREL/TP-540-40373
5e. TASK NUMBER HF65.8310
6. AUTHOR(S) M. Melendez and A. Milbrandt
5f. WORK UNIT NUMBER
7. PERFORMING ORGANIZATION NAME(S) AND ADDRESS(ES) National Renewable Energy Laboratory 1617 Cole Blvd. Golden, CO 80401-3393
8. PERFORMING ORGANIZATION REPORT NUMBER NREL/TP-540-40373
10. SPONSOR/MONITOR'S ACRONYM(S) NREL
9. SPONSORING/MONITORING AGENCY NAME(S) AND ADDRESS(ES)
11. SPONSORING/MONITORING AGENCY REPORT NUMBER
12. DISTRIBUTION AVAILABILITY STATEMENT National Technical Information Service U.S. Department of Commerce 5285 Port Royal Road Springfield, VA 22161
13. SUPPLEMENTARY NOTES
14. ABSTRACT (Maximum 200 Words) In FY 2004 and 2005, NREL developed a proposed minimal infrastructure to support nationwide deployment of hydrogen vehicles by offering infrastructure scenarios that facilitated interstate travel. This report identifies key metropolitan areas and regions on which to focus infrastructure efforts during the early hydrogen transition.
15. SUBJECT TERMS Hydrogen; transportation; consumer demand; infrastructure; U.S. Department of Energy; NREL
16. SECURITY CLASSIFICATION OF: 19a. NAME OF RESPONSIBLE PERSON a. REPORT
Unclassified b. ABSTRACT Unclassified
c. THIS PAGE Unclassified
17. LIMITATION OF ABSTRACT
UL
18. NUMBER OF PAGES
19b. TELEPONE NUMBER (Include area code)
Standard Form 298 (Rev. 8/98) Prescribed by ANSI Std. Z39.18