technical potential of salt caverns for hydrogen storage
TRANSCRIPT

1
Technical Potential of Salt Caverns for Hydrogen Storage in Europe
Dilara Gulcin Caglayan,1,2 Nikolaus Weber,1,3 Heidi Heinrichs,1 Jochen Linßen,1 Martin
Robinius,1 Peter A. Kukla3 and Detlef Stolten1,2
1 Institute of Energy and Climate Research - Electrochemical Process Engineering (IEK-3)
Forschungszentrum Juelich GmbH, 52425 Juelich, Germany
2 RWTH Aachen University, Chair for Fuel Cells, Faculty of Mechanical Engineering,
Kackertstraße 9, D-52072 Aachen, Germany
3 Geological Institute, Energy and Mineral Resources, RWTH Aachen University, 52056
Aachen, Germany
[email protected], [email protected], [email protected],
[email protected], [email protected], [email protected],
ABSTRACT
The role of hydrogen in a future energy system with a high share of variable renewable energy
sources (VRES) is regarded as crucial in order to balance fluctuations in electricity generation.
These fluctuations can be compensated for by flexibility measures such as the expansion of
transmission, flexible generation, larger back-up capacity and storage. Salt cavern storage is the
most promising technology due to its large storage capacity, followed by pumped hydro storage.
For the underground storage of chemical energy carriers such as hydrogen, salt caverns offer the
most promising option owing to their low investment cost, high sealing potential and low cushion
gas requirement. This paper provides a suitability assessment of European subsurface salt
structures in terms of size, land eligibility and storage capacity. Two distinct cavern volumes of
500,000 m3 and 750,000 m3 are considered, with preference being given for salt caverns over
bedded salt deposits and salt domes. The storage capacities of individual caverns are estimated on
the basis of thermodynamic considerations based on site-specific data. The results are analyzed
using three different scenarios: onshore and offshore salt caverns, only onshore salt caverns and
only onshore caverns within 50 km of the shore. The overall technical storage potential across
Europe is estimated at 84.8 PWhH2, 27% of which constitutes only onshore locations. Furthermore,
this capacity decreases to 7.3 PWhH2 with a limitation of 50 km distance from shore. In all cases,
Germany has the highest technical storage potential, with a value of 9.4 PWhH2, located onshore
only in salt domes in the north of the country. Moreover, Norway has 7.5 PWhH2 of storage
potential for offshore caverns, which are all located in the subsurface of the North Sea Basin.
Keywords: Salt caverns, salt structures, technical storage potential, hydrogen storage.
Preprints (www.preprints.org) | NOT PEER-REVIEWED | Posted: 16 October 2019 doi:10.20944/preprints201910.0187.v1
© 2019 by the author(s). Distributed under a Creative Commons CC BY license.
Peer-reviewed version available at International Journal of Hydrogen Energy 2020; doi:10.1016/j.ijhydene.2019.12.161

2
1 INTRODUCTION
The current increase in the share of variable renewable energy sources (VRES) in the energy mix
[1] attests to the significant role of these platforms in the decarbonization of the energy sector.
Their intermittency [2]–[5], however, is an obstacle in the transition towards a high share of VRES
in the energy system. Mechanical storage technologies such as pumped hydro storage and
compressed air energy storage could in principle compensate for these fluctuations; nevertheless,
the low storage density of water and compressed air remains a drawback to large-scale
implementation, especially for seasonal storage [6]. Unlike mechanical energy storage, storage
using chemical energy carriers such as hydrogen or natural gas provides an approximately 100
times higher energy density than compressed air energy storage for the same storage volume1 [7].
An alternative energy carrier is hydrogen, which can be produced using the “Power to Gas”
concept [8] by means of electrolysis utilizing renewable electricity. In addition to using hydrogen
in fuel cell electric vehicles (FCEVs), it can also be fed into fuel cells to generate electricity to
compensate for low generation periods (“Power to Power”). Underground formations (e.g.,
depleted gas fields, aquifers, salt caverns, etc.), pipelines or vessels can be considered viable
storage options for the seasonal storage of hydrogen [9]. Pellow et al. [10] state that for seasonal
storage, underground salt caverns are more favorable than above-ground storage technologies,
such as pipeline storage or vessels.
Natural gas storage in underground cavities has been practiced for decades. The knowledge gained
by this can be easily transferred to the case of hydrogen storage due to the similarities in cavern
design, construction and operation [11]. Materials in access wells, cavern head and transmission
infrastructure are the main differences between hydrogen and natural gas storage [11], [12]. In the
case of hydrogen, embrittlement due to long-term diffusion can cause leakage and failures,
especially in the steel components. The storage of hydrogen in depleted oil and gas reservoirs has
the advantage of reducing the geological exploration efforts resulting from the former use of such
sites for oil and gas production. However, the cushion gas requirement for depleted oil and gas
field to prevent reservoir rock breakdown is approximately 50% [13]. As a result of the
contamination caused by the previous hydrocarbon extraction, contamination control and gas
upgrade units for purification may be required. In deep seated aquifers, stored gas can be
contaminated by sulfate, reducing bacteria [14]. Cushion gas requirements for aquifers may exceed
those necessary for depleted oil and gas reservoirs; moreover, gas leakage is inevitable.
Salt caverns are currently considered to offer the most promising underground storage option
owing to their low cushion gas requirement, the large sealing capacity of rock salt and the inert
nature of salt structures, preventing the contamination of the stored hydrogen [13], [15]–[17].
Moreover, flexible operation with high injection rates and withdrawal cycles are considered
another advantage of salt cavern storage options [18].
1 When 280 kWh m-3 is assumed as the energy density of hydrogen stored in salt caverns.
Preprints (www.preprints.org) | NOT PEER-REVIEWED | Posted: 16 October 2019 doi:10.20944/preprints201910.0187.v1
Peer-reviewed version available at International Journal of Hydrogen Energy 2020; doi:10.1016/j.ijhydene.2019.12.161
3
Currently, only a few sites for hydrogen storage in salt caverns exist in the United Kingdom (e.g.,
Teesside) and the United States (e.g., Clemens Dome, Spindletop, Moss Bluff) [19]. Hydrogen
storage in elliptically-shaped salt caverns at a depth of 350-450 m and with a total volume of
210,000 m3 has been operation in Teeside since the 1970s [19]. The salt caverns at Clemens Dome
and Moss Bluff are built in salt domes at a depth of 800 m (top of the cavern), with volumes of
approximately 580,000 m3 [19]. Clemens Dome and Moss Bluff have operated since 1983 and
2007, respectively [19]. These projects have unequivocally demonstrated for decades that
underground hydrogen storage is a technically-feasible option.
Tarkowski [20] has investigated the potential for hydrogen storage in underground formations,
including salt caverns, depleted oil and natural gas reservoirs in Poland, with a focus on providing
suitable storage locations but not estimating the storage potential. A further analysis by Tarkowski
and Czapowski [21] focuses on potential sites for hydrogen storage in salt domes in the country.
As a result of this evaluation, 7 of 27 analyzed salt domes were found to be favorable. The use of
salt caverns for hydrogen storage was also investigated by Iordache et al. [22] in a scenario for
Romania. Despite discussing 4 specific cavern sites, precise storage potential values are not
mentioned. Michalski et al. [23] analyzed the role of hydrogen production by means of
electrolyzers and the underground storage of hydrogen, with a focus on Germany. For this analysis,
the data of existing natural gas and liquid product storage facilities were examined [23]. Estimated
hydrogen storage capacity in three regions (northern North-Rhine Westphalia, northwestern
Germany and central Germany) is 26.5 TWh in total [23]. In the HyUnder study [24], a case study
for 5 European countries proposes the total number of caverns required for 2050, of which 74, 43,
24, 21 and 1 are located in Germany, the Netherlands, Spain, the United Kingdom and Romania
respectively. Assessments are performed by assuming a standard cavern with a volume of 500,000
m3, corresponding to a storage capacity of 133 GWh.
A study on the potential energy storage capacity of compressed air in the Cheshire Basin, located
in the United Kingdom, suggested approximately 1,600 caverns be placed in the basin with a depth
range of 500-1500 m [25]. A cavern height of 100 m was determined for the analysis in order to
be consistent with one of the only two existing compressed air energy storage facilities worldwide,
located in Huntorf, Germany [25].
The studies cited above mainly focus on potential cavern sites at a national or subnational level
and lack a technical storage potential analysis, which is the main focus of this study. As the major
role of hydrogen in the low-carbon economy is clearly emphasized by Staffel et al. [26], an
evaluation of European salt basins is necessary in accordance with the hydrogen storage suitability
criteria. Therefore, the main purpose of this study is to provide a broad analysis of the technical
potential of salt caverns for hydrogen storage so that it can be used by stakeholders and scientists
to develop future energy system designs on the basis of these results. Moreover, consideration of
the geospatial availability of suitable salt structures such as salt domes, salt pillows and salt walls
is given by applying a land eligibility analysis, which incorporates restricted locations such as
settlements or protected areas to be excluded for cavern construction. The storage capacity of
Preprints (www.preprints.org) | NOT PEER-REVIEWED | Posted: 16 October 2019 doi:10.20944/preprints201910.0187.v1
Peer-reviewed version available at International Journal of Hydrogen Energy 2020; doi:10.1016/j.ijhydene.2019.12.161

4
individual caverns, which are distributed over eligible areas, is estimated in accordance with
thermodynamic considerations and site-specific parameters. The results of this analysis are
anticipated to be of use to a variety of stakeholders in future energy system policies and designs.
The new approach taken in this work derives from a thorough analysis of the storage potential
across Europe by defining suitable cavern sites, which are determined by a land eligibility
assessment. Moreover, as the caverns are located in different geological basins, the thermodynamic
properties of these are taken into account for estimating the storage capacity. For the analysis,
onshore and offshore salt caverns were investigated, whilst the main focus lies on onshore
locations. It is intended that the outcomes of this study (such as changing the compressibility
factor, which is used in the estimation of the storage capacity of individual caverns) can be utilized
by the energy industries and governments in Europe for designing the energy system to incorporate
different products in their specific regions. With the fully transparent methodology used in this
analysis, the technical storage potential of different chemical species such as natural gas or biogas
can also be derived. Nevertheless, it must be noted that the suitability of salt formations must be
taken into account for such an assessment. Finally, the results of this work can be used to identify
locations that can supply brine, which is extracted during cavern leaching.
The methodology involves the estimation of the usable area of salt structures, designs and the
placement of individual caverns and calculation of the storage potential, and is described in
Section 2. Suitable salt structures for hydrogen storage, the results of land availability with regard
to these and national storage potentials for three different cases are presented in Section 3. Finally,
the main findings and suggestions are addressed in Section 4.
2 METHODOLOGY
Determining the technical potential for salt cavern development requires an analysis of the geology
of salt formations and a decision in which salt formation type caverns can be preferentially
developed. Following this, available areas in suitable salt formations where potential salt caverns
can be constructed must be determined, which can be conducted by the methodology explained in
Section 2.1. By using two different cavern designs for bedded salt deposits and salt domes, a
distribution analysis of these caverns is performed across eligible areas. Then, the technical
potential of salt caverns for hydrogen storage is estimated by using these locations and calculating
their storage potential under thermodynamic considerations. Figure 1 shows the “Concept of
Potential”, including different types of technical and non-technical potentials, as laid out by
Lütkehus et al. [27]. Within the context of this work, the “Theoretical Potential” includes the total
hydrogen storage capacity of all possible salt caverns, whilst the “Technical Potential” takes the
limitations (i.e., cushion gas) into account. “Economic” and “Ecological Potentials” consider
corresponding criteria that might be derived from given scenarios. Finally, the “Realizable
Potential” is the combination of technical, ecological and economic criteria with additional
considerations (i.e., social acceptance). It must be noted that the potential values derived in this
work cannot be fully utilized; moreover, the extent to which they should be deployed can be
Preprints (www.preprints.org) | NOT PEER-REVIEWED | Posted: 16 October 2019 doi:10.20944/preprints201910.0187.v1
Peer-reviewed version available at International Journal of Hydrogen Energy 2020; doi:10.1016/j.ijhydene.2019.12.161

5
determined in conjunction with the energy system design. In other words, the technical potential
of salt caverns differs from their realizable potential.
Figure 1. “Concept of potential” with different potential types, adapted from Lütkehus [27].
2.1 Land eligibility
A salt cavern, the bottom tip of which is located approximately 2,000 m below ground, spans an
area of 13 km2 with an angle of 35°-45° between the bottom of the cavern and its surface. The
caverns can be affected by convergence phenomena because of the inherent mobility of salts.
Although this is a very safe and mature industry, problems can include unexpected structures and
deviations from the designed cavern shape, cavern and gallery convergence, as well as ground
subsidence, high pressure brine and gas pockets, borehole closure, cementing problems, casing
collapse and cavern abandonment, in addition to engineering issues not directly related to salt. In
rare cases, roof loss and cavern collapse has occurred [28], [29] and therefore cavern migration,
microseismicity [30], land subsidence [31] and long-term subsidence predictions [32] are common
issues in solution mining. This places constraints on the safe and sustainable design of solution
mining salt cavern development, as shown by Lux [33]. Consequently, areas with eligible salt
deposits have been investigated in order to determine their potential for salt cavern development.
For this purpose, an open source model, Geospatial Land Availability for Energy Systems
(GLAES), developed by Ryberg et al. [34], is employed as the tool for land availability analyses.
By using GLAES, exclusion constraints have been applied to the areas that contain subsurface salt
deposits. A resolution of 100 m is used for the eligibility assessment, as it is the lowest resolution
in the data used for the analysis (Prior Datasets). The exclusion constraints are shown in Table 1.
These have been applied with the buffer distances defined based on a literature analysis for
Preprints (www.preprints.org) | NOT PEER-REVIEWED | Posted: 16 October 2019 doi:10.20944/preprints201910.0187.v1
Peer-reviewed version available at International Journal of Hydrogen Energy 2020; doi:10.1016/j.ijhydene.2019.12.161

6
underground storage and compressed air energy storage. A common exclusion algorithm is applied
to each salt structure, which begins with a two-dimensional overlay of the structure’s boundary
onto a geospatial reference frame (bird’s eye view). All areas within the salt structure’s boundaries
are initially considered to be ‘included’, although after each application of the constraints of Table
1, the amount of available area decreases. For example, the first constraint, “Urban Areas”, will
exclude up to 2,500 m (buffer distance) around the edge of all urban settlements zones. Once all
exclusion constraints have been applied the areas which remain as eligible will be considered
eligible areas for placement of potential salt caverns.
Table 1. Constraints used in the land eligibility analysis for salt cavern construction.
Criteria Excludes Source
Urban areas below 2,500 m [34]
Rural areas below 2,000 m [34]
Major fault zones below 200 m [35]
Natural protected areas, water bodies below 200 m [34]
Railway, major roads and gas pipelines below 200 m [34], [36]
Geological correction factor (distance from the salt
edge):
- Bedded salt
- Salt domes
below
2,000 m
500 m
Own
data
A detailed geometric outline of a subsurface salt deposit is not possible to obtain without extensive
geological exploration using geophysical surveys, wells and further geological information.
Because of the lack of such information in many areas, a buffer distance of 500 m for salt domes
and 2000 m for bedded salt deposits has been applied from the structure or formation edge of each
salt deposit to ensure salt cavern construction in the most pure salt locations [2]. This prerequisite
(“exclusion” in Table 1) mainly serves as a safety buffer for cavern construction purposes.
2.2 Salt cavern design and placement
Designing a salt cavern highly depends on the properties of the salt deposit to be considered [33];
therefore, there are a number of factors that must be taken into account in order to maintain the
sustainable and safe operation of the cavern. Figure 2 illustrates a representation of a salt cavern
with related technical terms and the pressure gradients as a function of depth. In order to ensure
the geo-mechanical safety of caverns, thicknesses of salt layers in the hanging wall and foot wall
(above and below) the cavern must be defined and considered (Figure 2). The Minimum thickness
of these layers for safe operation is expressed as a function of cavern diameter. For example, the
minimum thickness of the hanging wall is suggested as 75% of the cavern diameter, whereas this
value is 20% of the cavern diameter for the foot wall [37]. Moreover, a minimum limit for the
height-to-diameter ratio for salt caverns is defined as 0.5 for salt caverns in a bedded salt deposit
[37].
Preprints (www.preprints.org) | NOT PEER-REVIEWED | Posted: 16 October 2019 doi:10.20944/preprints201910.0187.v1
Peer-reviewed version available at International Journal of Hydrogen Energy 2020; doi:10.1016/j.ijhydene.2019.12.161

7
Ozarslan [11] state that capsule-shaped salt caverns are more stable with decreased stress risk in
comparison to caverns with an elliptical or cylindrical shape under 1200 m depth and 270 bar
overburden pressure. Therefore, the capsule shape is selected for the calculations of cavern
volume, as well as for the determination of the appropriate construction and operation parameters
of the caverns. For bedded salt deposits, a cavern volume of 500,000 m3 is applied with a diameter
of 84 m and cavern height of 120 m; whereas 750,000 m3 for cavern volume, 58 m diameter and
300 m for height are assumed for caverns in salt domes. For bedded salt deposits, only salt
structures with a salt thickness greater than 200 m are assumed to be suitable. Therefore, following
the suggested ratios for the hanging wall and foot wall [37], the cavern height is calculated as 120
m. The height limitation is not pronounced in the salt domes due to higher salt thickness; thus, the
height indicated by Ozarslan [11] (300 m) is chosen for caverns with 750,000 m3 volume.
Figure 2. A simplified representation of an exemplary cavern and estimated pressure limits as a
function of depth, adapted from Stolzenburg et al. [38] (Calculation of pressure is explained in
Section 2.3).
In order to evaluate the technical potential, salt cavern placement has been performed across all
eligible areas with a separation distance of 4 times the cavern diameter between the vertical cavern
axis (bird’s eye view). This corresponds to a separation distance of 232 m for salt domes and 336
m for bedded salt deposits when the aforementioned cavern designs are used.
2.3 Calculation of cavern storage capacity
The average operation temperature of hydrogen within the salt cavern is assumed to match the
temperature of the surrounding salt rock. However, temperature in a sedimentary basin varies with
respect to the depth; therefore, a gradient of 25 °C km-1 is assumed up to approximately 5 km depth
Preprints (www.preprints.org) | NOT PEER-REVIEWED | Posted: 16 October 2019 doi:10.20944/preprints201910.0187.v1
Peer-reviewed version available at International Journal of Hydrogen Energy 2020; doi:10.1016/j.ijhydene.2019.12.161

8
[39]. Because of their respective heights, the variation in the temperature results in a difference of
3 °C between the top and bottom of a small cavern and 7.5 °C for a large salt cavern. Therefore,
the average temperature of the gas is calculated using Equation 1, assuming a surface temperature
of 288 K (15 °C). 𝑇𝑎𝑣𝑒𝑟𝑎𝑔𝑒 stands for average gas temperature in K2, 𝑑𝑒𝑝𝑡ℎ in m and
𝑐𝑎𝑣𝑒𝑟𝑛𝐻𝑒𝑖𝑔ℎ𝑡 for height of the cavern in m, which are 120 m and 300 m for bedded and domal-
salt caverns, respectively.
𝑇𝑎𝑣𝑒𝑟𝑎𝑔𝑒 = 288 + 0.025 ∗ (𝑑𝑒𝑝𝑡ℎ − 𝑐𝑎𝑣𝑒𝑟𝑛𝐻𝑒𝑖𝑔ℎ𝑡/2) Equation 1
Salt caverns are exposed to overburden pressure (sometimes referred to as lithostatic pressure).
This pressure can be determined by Equation 2, which is a function of rock density (𝜌𝑟𝑜𝑐𝑘) in kg m-
3, gravitational acceleration (g, assumed as 9.81 m s-2), depth and cavern height in m. The depth,
shown in both Equation 1 and Equation 2, refers to the bottom tip of the salt cavern. However,
scaled to the center of the cavern by subtracting half of its height in order to estimate the average
pressure, which is between the overburden pressures at the top and bottom tips of the cavern.
𝑃𝑜𝑣𝑒𝑟𝑏𝑢𝑟𝑑𝑒𝑛 = 𝜌𝑟𝑜𝑐𝑘 ∗ 𝑔 ∗ (𝑑𝑒𝑝𝑡ℎ − 𝑐𝑎𝑣𝑒𝑟𝑛𝐻𝑒𝑖𝑔ℎ𝑡) Equation 2
Due to concerns about geotechnical safety, maximum and minimum gas operation pressures are
limited, respectively, to 80% and 24% of overburden pressure. Exceeding the maximum gas
operation pressure may result in salt rock fractures because of the high pressure exerted on the
cavern walls [24], while the low pressure limitation is for maintaining gas injection and withdrawal
as well as the stability of the cavern [40]. As empirical operating pressure values for hydrogen
storage in salt caverns are not accessible, pressure ranges are largely derived from natural gas
storage operations [24]. These upper and lower limits for the gas operation pressure are used in
the density calculation at the corresponding pressure level, which is shown in Equation 3. The
density of the gas (𝜌) in kg m-3 is calculated using the real gas law, in which compressibility factor
(Z), pressure (P) in Pa, molar mass of the species (M) in kg mol-1, universal gas constant (R),
which is equal to 8.314 J K-1 mol-1 and temperature (T) in K are used. The compressibility factor
is calculated by a Python Module called CoolProp [41].
𝜌𝐻2=
𝑃 ∗ 𝑀
𝑍 ∗ 𝑅 ∗ 𝑇 Equation 3
The minimum and maximum limits for density are used in the calculation of the mass of working
gas, shown in Equation 4. 𝑚𝑤𝑜𝑟𝑘𝑖𝑛𝑔𝐺𝑎𝑠 stands for the mass of working gas in kg, 𝜌 for density in
kg m-3, 𝑉𝑐𝑎𝑣𝑒𝑟𝑛 for cavern volume in m3, and finally 𝜃𝑠𝑎𝑓𝑒𝑡𝑦 for a safety factor, which is assumed
to be 70% and accounts for the loss of storage capacity to the sump and brine at the bottom of the
2 Conversion of temperature between Kelvin and Celsius is performed with the following equation: T (K) = T (°C) + 273.15.
Preprints (www.preprints.org) | NOT PEER-REVIEWED | Posted: 16 October 2019 doi:10.20944/preprints201910.0187.v1
Peer-reviewed version available at International Journal of Hydrogen Energy 2020; doi:10.1016/j.ijhydene.2019.12.161

9
cavern, as well as unplanned construction circumstances during the leaching of the cavern.
Subscripts of minimum and maximum are calculated at their corresponding pressure limit:
𝑚𝑤𝑜𝑟𝑘𝑖𝑛𝑔𝐺𝑎𝑠 = (𝜌𝐻2,𝑚𝑎𝑥𝑖𝑚𝑢𝑚 − 𝜌𝐻2,𝑚𝑖𝑛𝑖𝑚𝑢𝑚) ∗ 𝑉𝑐𝑎𝑣𝑒𝑟𝑛 ∗ 𝜃𝑠𝑎𝑓𝑒𝑡𝑦 Equation 4
Finally, the storage capacity of a salt cavern is determined by using the lower heating value and
mass of working gas calculated through specifications of the cavern and location, which is shown
in Equation 5. 𝑐𝑎𝑣𝑒𝑟𝑛𝐶𝑎𝑝𝑎𝑐𝑖𝑡𝑦 is calculated in GWh, while the lower heating value of the gas
(LHV) is defined in GWh kg-1.
𝑐𝑎𝑣𝑒𝑟𝑛𝐶𝑎𝑝𝑎𝑐𝑖𝑡𝑦 = 𝑚𝑤𝑜𝑟𝑘𝑖𝑛𝑔𝐺𝑎𝑠 ∗ 𝐿𝐻𝑉𝑔𝑎𝑠 Equation 5
Given the lack of projects using hydrogen-filled caverns, the validation of the methodology for
salt cavern capacity uses a dataset compiled from natural gas storage sites already in operation
[42]. This dataset contains 94 cavern sites for natural gas storage in salt caverns across Europe.
However, when caverns without available information on depth, cavern volume or capacity are
excluded, only 40 sites remain. As the composition of natural gas varies and is not reported for
each cavern site, an average sample composition of natural gas is assumed to be 94% methane
(CH4), 4% ethane (C2H6) and 2% propane (C3H8) [43]. The volume and depth of the salt caverns
obtained from the dataset are used for storage capacity calculations. A comparison of capacities
given in the dataset and calculated by the current approach is shown in Figure 3. In some cases,
the dataset involves a range for the depth instead of a single value. Therefore, assuming that all
the caverns can be placed either at the upper or lower boundary, it can be said that the actual cavern
capacity must be within these minimum and maximum capacity values. For example, in the
“Nüttermoor L” facility located in Germany, the depth range is given as 950-1300 m. Therefore,
as can be seen in Figure 3, there is a lower and higher estimated storage capacity for that facility.
The gray line in the figure indicates a 100% match between the reported and calculated values,
while a further point plotted from this gray line means a higher error in the estimation of the
capacity. As can be seen from the figure, in general there is good agreement across most of the
results. Deviations in the estimations can be caused by several factors, such as different
compositions for natural gas, different operating pressure limits, especially for cushion gas
andgeological conditions altering the temperature and pressure environments. As well as slight
deviations from the gray line, there are large differences in the estimated and reported capacities
for the two cavern sites (the Etrez site in France and the Nüttermoor L-Gas site in Germany). More
detailed data on the two outliers does not exist on the website of the operators; thus, they are
assumed to be outliers.
Preprints (www.preprints.org) | NOT PEER-REVIEWED | Posted: 16 October 2019 doi:10.20944/preprints201910.0187.v1
Peer-reviewed version available at International Journal of Hydrogen Energy 2020; doi:10.1016/j.ijhydene.2019.12.161

10
Figure 3. Comparison of reported and estimated storage capacities of natural gas salt caverns,
the gray line indicating a 0% error between the actual and estimated values (the reported values
are extracted from existing natural gas storage facilities in Europe [42]).
3 RESULTS & DISCUSSION
The results of the analysis, which were obtained through the application of the methodology
described in Section 2, will be presented in this section. After an initial suitability assessment on
the salt formations in Section 3.1, a geospatial eligibility analysis is performed on the suitable salt
formations with uniform constraints in Section 3.2. In the following, the distribution of salt caverns
across eligible salt formations is proposed (Section 3.3), to be followed by a final assessment of
the storage capacity of each cavern (Section 3.4).
3.1 European Salt Basins Suitable for Underground Hydrogen Storage
As a result of the assessment, suitable salt structures, as well as suitable bedded salt deposits, are
shown in Figure 4, with the respective salt basins denoted. The assumption was made that all
encountered salt bodies that are not identified as bedded salt deposits were to be classified as salt
structures (encompassing salt domes, salt pillows, salt walls, etc.). As a geological suitability
assessment would require individual evaluation for a vast number of salt structures distributed all
over Europe, the assumption was made that all salt structures were to be suitable for underground
hydrogen storage instead of excluding all from the potential analysis from the very beginning.
Therefore, the geological suitability assessment is exclusively applied to bedded salt deposits and
briefly discussed in the following. Bedded salt deposits that do not fulfill the thickness and
chemical requirements for UHS construction, or for which no reliable information concerning
geological properties could be found, were dismissed and not considered in the further process of
Preprints (www.preprints.org) | NOT PEER-REVIEWED | Posted: 16 October 2019 doi:10.20944/preprints201910.0187.v1
Peer-reviewed version available at International Journal of Hydrogen Energy 2020; doi:10.1016/j.ijhydene.2019.12.161

11
the potential analysis. A minimum salt thickness of 200 m and a range of minimum to maximum
depth of 500 m to 2,000 m were selected as being suitable for salt cavern construction.
Within the framework of this analysis, assumptions of highly idealized salt deposits can be made;
however, this does not necessarily correspond to the actual shape and conformity of the salt
formations in reality. Bedded salts are assumed to be perfectly layered with equal thickness and
equal depth ranges spanning the entire geographical extent of the salt deposit. The geometrical
shape of the salt structures were assumed to be positioned upright as cylindrical shaped bodies
without any inclination or tectonically-induced modifications of the salt.
Due to the geological formation conditions of the salt structures, which always originate from
bedded salt deposits, all regions with a high abundance of salt structures often also correlate with
the presence of remnant bedded salt deposits, forming base salt. In these cases, salt structures are
favored over bedded salt deposits, due to their higher storage capacity and the unfavorable
thickness of the remaining bedded salt deposits for cavern construction.
The Tertiary (Cenozoic) sub-basins (1-4) in France contain thick evaporite sequences reaching up
to 1,800 m, with overall low sulfate concentrations in thick salt layers [44]. The thickness of the
Mesozoic salt deposits in Northwestern France shows high insoluble content within the salt
formation (such as anhydrite/clay interbeds or gypsum), which is in contrast to the aforementioned
Tertiary deposits, and which rules out the suitability of these Mesozoic deposits for cavern
construction. In Italy, Tertiary salt deposits in the Crotone Basin of Calabria and in Western Sicily
are also not suitable due to high insoluble content, as well as the lower thickness of the salt layer
[44], [45]. In Spain, Mesozoic evaporite deposits cover large areas of the subsurface and extend
from the Betic Cordillera over the Iberian Range to the northern coast of Spain, up to the Bay of
Biscay; however, top salt exceeds depths of 2,000 m. Tertiary evaporitic formations are present in
the Ebro, Duero and Tagus Basin. These halite beds have a considerable thickness, but show highly
folded facies and high amounts of anhydrite and gypsum concentration [46]. The Cardona Saline
Formation (14) is included in this analysis, as the thickness of salt in some areas is proven to attain
approximately 300 m at reasonable depths of below 2,000 m for cavern construction [46].
Major periods of salt deposition in central Europe took place during the Paleozoic (Permian) and
Mesozoic eras. The European Permian Basin (EPB) of central Europe belongs to the largest
sedimentary paleobasins of the world and contains a considerable amount of bedded salt deposits
and diapiric salt structures, reaching from the eastern United Kingdom up to the North Sea, the
Netherlands, Denmark and Northern Germany, down to the central basins of Poland [47]–[53]. At
the margin of the EPB, bedded Zechstein salt deposits are thinned out and buried at depths
shallower than 2,000 m. These deposits are found on the east coast of the UK (17), western, eastern
and central Germany (5-8) and as far south as Upper Silesia in Poland (8-12).
Outside of the EPB, Mesozoic salt, which formed during the early Triassic period, can be found in
northwestern England, Northern Ireland and southern Germany. The Cheshire Basin, amongst
other Triassic basins in the UK, shows promise for salt cavern construction, as it fulfills ideal
geological prerequisites, such as depth and thickness (16, 18, 19) [48], [51].
Preprints (www.preprints.org) | NOT PEER-REVIEWED | Posted: 16 October 2019 doi:10.20944/preprints201910.0187.v1
Peer-reviewed version available at International Journal of Hydrogen Energy 2020; doi:10.1016/j.ijhydene.2019.12.161

12
Amongst the youngest salt deposits in the central and eastern European region are the Badenian
Tertiary deposits, reaching from the Carpathian Foredeep in southern Poland to the Transylvanian
Basin in Romania. Apart from the Ocnele Mari salt deposit (13), where salt lies at depths of 650 m
and can attain a thickness of 500 m, the Tertiary salt deposits do not qualify for cavern
construction, as the salt strata is highly folded and imbricated, or is not favored over the presence
of salt structures [54], [55]. Ukraine and Belarus (15) are excluded from this analysis due to the
lack of data for urban and rural areas necessary for the following surface eligibility assessment
[56], [57].
Figure 4. Map of European salt deposits and salt structures as a result of suitability assessment
for underground hydrogen storage (1. Alsace Basin; 2. Bresse Basin; 3. Greoux Basin; 4.
Valence Basin; 5. Lower Rhine Basin; 6. Hessen Werra Basin; 7. Sub-Hercynian Basin; 8.
Lausitz Basin; 9. Leba Salt; 10. Fore-Sudetic Monocline; 11. Carpathian Foredeep; 12. Lublin
Trough; 13. Ocnele Mari; 14. Cardona Saline Formation; 15. Pripyat Basin; 16. Cheshire Basin;
17. UK Permian Zechstein Basin; 18. Larne Salt Field; 19. Wessex Basin).3
3.2 Eligibility Assessment and Cavern Placement
The application of the eligibility constraints and item placement algorithm, as shown in Section 2.2
and Section 2.3, produces possible cavern locations. Figure 5 illustrates the results of a land
3 A detailed list of publications containing geological maps that were used for the visualization and
digitization of the layered and domal salt bodies can be found in the appendix. The suitable salt formations
were determined by the literature review [44], [45], [60]–[64], [47]–[49], [53]–[57].
Preprints (www.preprints.org) | NOT PEER-REVIEWED | Posted: 16 October 2019 doi:10.20944/preprints201910.0187.v1
Peer-reviewed version available at International Journal of Hydrogen Energy 2020; doi:10.1016/j.ijhydene.2019.12.161

13
eligibility assessment applied to the salt formations. Additionally, an exemplary representation of
a salt cavern distribution field across different types of salt structures is shown for an area in central
Germany. This area consists of both salt domes and bedded salt deposits. As part of the
methodology, in a case where there is an overlap between salt domes and bedded salt deposits, the
overlapping area is processed following the designs for salt domes (large cavern size). The larger
and smaller salt caverns represent different volumes of caverns, with 750,000 m3 and 500,000 m3
placed in salt domes and bedded salt deposits, respectively. As mentioned earlier (Section 2.2), the
separation distance of smaller and larger caverns are different due to different diameters used in
the cavern design. It must be noted that these cavern placements are used in order to calculate the
technical potential for hydrogen storage. In other words, these cavern placements correspond to
all possible locations where a salt cavern can be built, yet the extent to which these locations should
be utilized is not within the scope of this study. Nevertheless, social, economic and environmental
concerns are not taken into account here. Therefore, the results of these placements can be further
used in the design of energy systems, as well as in analyses taking social acceptance into
consideration in the related area.
Figure 5. Land eligibility results with an exemplary representation of cavern placement in
central Germany (extent of exemplary placement: 51.9°-52.0° N, 10.0°-10.1° E).
Preprints (www.preprints.org) | NOT PEER-REVIEWED | Posted: 16 October 2019 doi:10.20944/preprints201910.0187.v1
Peer-reviewed version available at International Journal of Hydrogen Energy 2020; doi:10.1016/j.ijhydene.2019.12.161

14
3.3 Distribution of Volumetric Energy Density across Europe
By using individual cavern placement depths, the storage capacity of each cavern is calculated on
the basis of properties such as cavern volume and temperature (see Section 2.3). However, the
direct comparison of storage capacities can be misleading because of two cavern designs having
different volumes. Instead, energy density, which is calculated as a cavern’s storage potential
divided by its volume, is employed for comparison. The energy density distribution of the potential
hydrogen salt cavern locations across Europe is shown in Figure 6. The energy density of caverns
in salt domes does not vary (whether northern Germany, Portugal or southern Spain, etc.), which
is due to the assumption of the same placement depths and cavern design applied to all caverns.
Nevertheless, variation in the energy density of salt caverns placed in the bedded salt deposits is
evident owing to different depths possessing specific thermodynamic and storage conditions. The
energy density of all salt caverns varies between 214 and 458 kWh m-3. Examining the distribution
of the volumetric energy density, the lowest energy density is estimated in the Cheshire Basin (the
United Kingdom) and Ocnele Mari (Romania) due to salt lying in shallow geological
environments. The maximum depth in the Cheshire Basin and Ocnele Mari are approximately 700
m and 650 m, respectively; whereas the assumed maximum depth for salt caverns in the domal
salt is 1,400 m. Given that the amount of working gas increases as a function of depth, these results
are thought to be consistent. When energy density is translated into storage capacity (by
multiplying the energy density by the cavern volume), the capacity of salt caverns in domal salt
structures is estimated to be nearly 210 GWh, whereas it varies between 65 and 160 GWh for the
caverns placed in bedded salt deposits. As is discussed in Section 2.3, the depth of the salt structure
determines the maximum and minimum operating pressures, which are then used in estimating the
amount of working gas. Deeper salt structures can accommodate an increase in the amount of
working gas (storage capacity), which can also be seen in Figure 2. A deeper look at the energy
densities reveals that having a suitable salt formation is not enough to determine the storage
potential. In addition to the quantity, in terms of salt caverns placed in eligible and suitable salt
areas, the depth of the salt structure, thermodynamic gas storage behavior and cavern design are
required to estimate a well-founded storage capacity. As can be seen in the United Kingdom, for
example, different characteristics can be observed even on a national scale due to different salt
depths and, consequently, different geomechanical and thermodynamic storage conditions.
Preprints (www.preprints.org) | NOT PEER-REVIEWED | Posted: 16 October 2019 doi:10.20944/preprints201910.0187.v1
Peer-reviewed version available at International Journal of Hydrogen Energy 2020; doi:10.1016/j.ijhydene.2019.12.161

15
Figure 6. Distribution of potential salt cavern sites across Europe with their corresponding
energy densities (cavern storage potential divided by the volume).
3.4 National Storage Potential
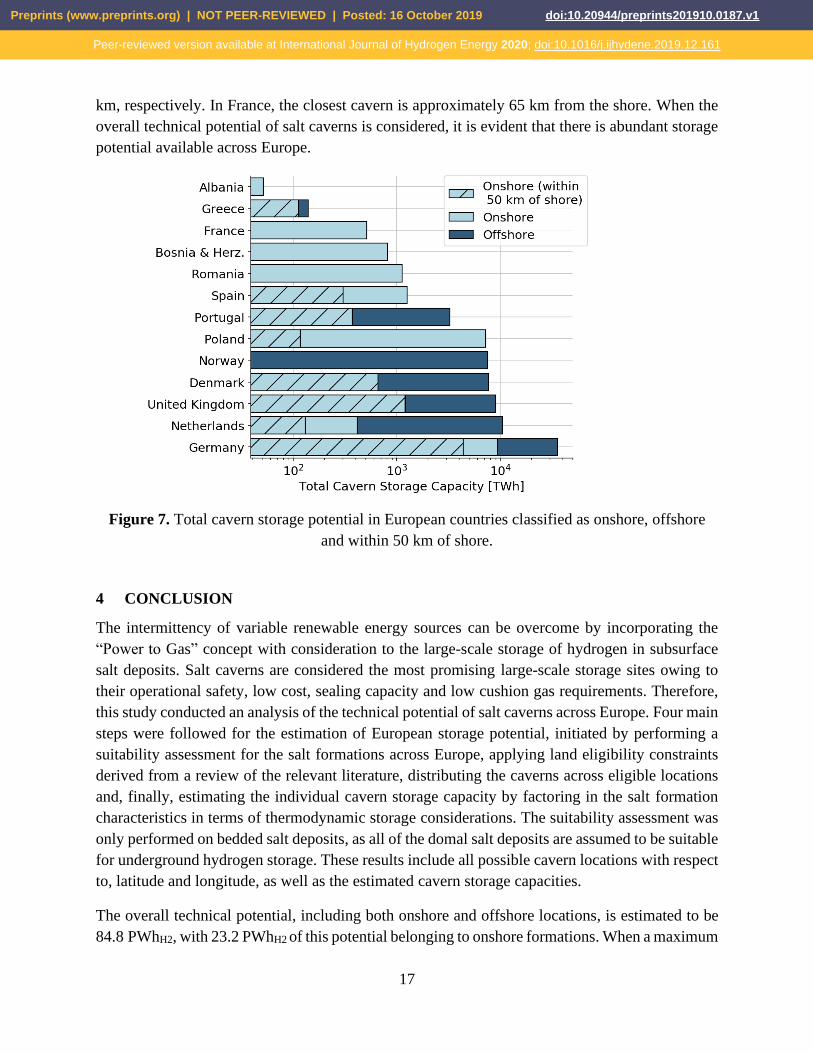
Overall national storage capacities are shown in Figure 7, with three classifications: onshore,
onshore constrained and offshore. The countries are sorted by their total storage potential. Cavern
capacities labeled as “Offshore” stand for caverns placed in salt domes under the North Sea,
whereas the “Onshore” ones refer to the remaining caverns located on land (after the application
of eligibility constraints). Finally, an additional constraint of 50 km distance from shore has been
included in the calculation of the storage potential of onshore salt caverns, and defined as
“Constrained”. This constraint is added in order to take into account the economic and
environmental constraints regarding brine solution disposal during cavern construction, as
disposing of the solution in lakes and rivers is not possible due to its high salt content.
Overall, the storage potential considering offshore and onshore salt caverns constitutes 84.8
PWhH2, 42% of which belongs to Germany. This is followed by the Netherlands and the United
Kingdom, with 10.4 and 9.0 PWhH2, respectively. Most of the countries have both onshore and
offshore salt caverns options, the exception being Norway, which only has offshore salt cavern
potential.
Preprints (www.preprints.org) | NOT PEER-REVIEWED | Posted: 16 October 2019 doi:10.20944/preprints201910.0187.v1
Peer-reviewed version available at International Journal of Hydrogen Energy 2020; doi:10.1016/j.ijhydene.2019.12.161

16
When offshore salt caverns are excluded, Germany has the largest storage potential of the countries
considered in this analysis, constituting 41% of the total. Overall, European storage potential for
salt caverns located in onshore areas is estimated to be 23.2 PWh, 19.0 PWh of which is located
in salt domes. Due to the lack of data on the potential analysis of European salt caverns, the results
presented are compared against pumped hydropower potential. Gimeno-Gutiérrez and Lacal-
Arántegui [58] report that the storage potentials of pumped hydropower to be 0.054 and 0.123
PWh (two different topologies) with a regional definition slightly different from that presented
here. In their report, the Netherlands and Denmark are not included, yet Turkey and Iceland are.
The highest potential is observed in Germany (9.45 PWh), followed by Poland and Spain (7.24
PWh and 1.26 PWh). These three countries account for 77% of the total onshore storage potential.
Despite the widespread bedded-salt deposits seen in France, the onshore storage potential is
estimated at 510 TWh, which is only 2% of the overall storage potential. This is mainly because
the salt deposits are mostly located around densely populated areas. Limited areas for cavern
construction can especially be seen in northern Alsace and all the salt basins of the Rhone valley
in southern France.
Hydrogen storage potential in Lower Saxony, a German state, is estimated to be nearly 390 TWh
(2320 potential caverns sites) by Fichtner [59]. The assessment by Fichtner [59] is performed with
an average gas density of 10 kgH2 m-3 and assumes a cavern size of 500,000 m3, separated by a
distance of 280 m. Moreover, the use of a cavern safety factor (30%), geological uncertainty factor
(50%) and a factor for urban and rural area exclusion (23%) significantly decreases the estimated
capacity. In addition, protected areas are excluded from the potential cavern sites. In the presented
work, geological uncertainty and urban and rural exclusion factors are not used; instead, an
extensive land eligibility analysis is performed to take the settlement areas into account. Moreover,
the salt structures in Lower Saxony are mostly salt domes, with an assumed cavern size of 750,000
m3. Considering these differences in the assumptions (especially the geological uncertainty factor),
a calculated estimate difference of 880 TWh is regarded as acceptable.
Proximity to the coast is considered to obtain up to approximately 50 km in order to still
economical in terms of brine disposal [50], [59]. This constraint is assumed to be a socio-economic
factor rather than a technical one; thus, it is not applied in the eligibility analysis, after which the
technical potential of salt caverns will be determined. Nevertheless, it is noted in order to observe
the variation in the storage potential with respect to the proximity to the coast. In the “constrained”
case, a maximum distance of 50 km for cavern construction is defined as incorporating the
economic and ecological disposal of brine in the sea, resulting from cavern leaching. Even though
the storage capacity is decreased to a total of 7.3 PWh, Germany has the largest share,
corresponding to 60%. Furthermore, some of the countries, such as the United Kingdom, Denmark,
Greece and Portugal retain all their storage potential owing to the proximity of their suitable salt
formations to the shore. In contrast, the storage potential in Poland decreases by 98% with this
constraint, as most of its salt structures are located in the center of the country. There is no storage
potential in France, Bosnia or Romania in the constrained scenario. The minimum distances
between the shore and salt caverns in Bosnia and Romania are estimated to be 140 km and 340
Preprints (www.preprints.org) | NOT PEER-REVIEWED | Posted: 16 October 2019 doi:10.20944/preprints201910.0187.v1
Peer-reviewed version available at International Journal of Hydrogen Energy 2020; doi:10.1016/j.ijhydene.2019.12.161
17
km, respectively. In France, the closest cavern is approximately 65 km from the shore. When the
overall technical potential of salt caverns is considered, it is evident that there is abundant storage
potential available across Europe.
Figure 7. Total cavern storage potential in European countries classified as onshore, offshore
and within 50 km of shore.
4 CONCLUSION
The intermittency of variable renewable energy sources can be overcome by incorporating the
“Power to Gas” concept with consideration to the large-scale storage of hydrogen in subsurface
salt deposits. Salt caverns are considered the most promising large-scale storage sites owing to
their operational safety, low cost, sealing capacity and low cushion gas requirements. Therefore,
this study conducted an analysis of the technical potential of salt caverns across Europe. Four main
steps were followed for the estimation of European storage potential, initiated by performing a
suitability assessment for the salt formations across Europe, applying land eligibility constraints
derived from a review of the relevant literature, distributing the caverns across eligible locations
and, finally, estimating the individual cavern storage capacity by factoring in the salt formation
characteristics in terms of thermodynamic storage considerations. The suitability assessment was
only performed on bedded salt deposits, as all of the domal salt deposits are assumed to be suitable
for underground hydrogen storage. These results include all possible cavern locations with respect
to, latitude and longitude, as well as the estimated cavern storage capacities.
The overall technical potential, including both onshore and offshore locations, is estimated to be
84.8 PWhH2, with 23.2 PWhH2 of this potential belonging to onshore formations. When a maximum
Preprints (www.preprints.org) | NOT PEER-REVIEWED | Posted: 16 October 2019 doi:10.20944/preprints201910.0187.v1
Peer-reviewed version available at International Journal of Hydrogen Energy 2020; doi:10.1016/j.ijhydene.2019.12.161

18
distance of 50 km to the coast is applied to the onshore salt caverns in order to take into account
the economic and ecological aspects of brine disposal pipelines, onshore potential decreases down
to 7.3 PWhH2. Germany has the highest storage potential in both onshore and offshore contexts,
with only onshore and constrained cases with capacities of 35.7, 9.4 and 4.4 PWhH2, respectively.
Although the capacity in Germany does not significantly change with the introduction of a 50 km
constraint, countries such as France, Bosnia and Romania do not retain their capacity due to large
distances to shore. In contrast, the capacities of the United Kingdom, Denmark, Greece and
Portugal do not change, owing to the shore proximity of the salt deposits.
Even in the most restricted scenario, a large difference of one order of magnitude is evident
compared to the technical storage potential of pumped hydropower (with a maximum value of
0.123 PWh). However, a more in-depth analysis must be performed with higher resolution
geological data. With the available data including urban and rural areas for Ukraine and Belarus,
the analysis can be extended to these countries in order to estimate the technical potential of
underground hydrogen storage in salt caverns. Furthermore, techno-economic or techno-
ecological potentials can be derived from the technical potential of salt caverns proposed in this
analysis by considering detailed economic and ecological aspects. How much of the presented
storage potential can or will be utilized and where to locate the possible cavern sites can be further
investigated by an energy system analysis that can account for locations with high demand and
generation profiles, as well as public acceptance.
ACKNOWDLEGMENTS
This work was supported by the Helmholtz Association under the Joint Initiative, “EnergySystem
2050: A Contribution of the Research Field Energy”. The authors gratefully acknowledge the
support and data about the salt structures provided by DEEP.KBB GmbH.
REFERENCES
[1] IRENA, “Renewable capacity statistics 2018,” Abu Dhabi, 2018.
[2] M. Lehtveer, N. Mattsson, and F. Hedenus, “Using resource based slicing to capture the
intermittency of variable renewables in energy system models,” Energy Strateg. Rev., vol.
18, pp. 73–84, Dec. 2017.
[3] M. H. Albadi and E. F. El-Saadany, “Overview of wind power intermittency impacts on
power systems,” Electr. Power Syst. Res., vol. 80, no. 6, pp. 627–632, 2010.
[4] S. Mesfun et al., “Power-to-gas and power-to-liquid for managing renewable electricity
intermittency in the Alpine Region,” Renew. Energy, vol. 107, pp. 361–372, Jul. 2017.
[5] M. D. A. Al-falahi, S. D. G. Jayasinghe, and H. Enshaei, “A review on recent size
optimization methodologies for standalone solar and wind hybrid renewable energy
system,” Energy Convers. Manag., vol. 143, pp. 252–274, Jul. 2017.
[6] M. Reuß, T. Grube, M. Robinius, P. Preuster, P. Wasserscheid, and D. Stolten, “Seasonal
storage and alternative carriers: A flexible hydrogen supply chain model,” Appl. Energy,
vol. 200, pp. 290–302, Aug. 2017.
Preprints (www.preprints.org) | NOT PEER-REVIEWED | Posted: 16 October 2019 doi:10.20944/preprints201910.0187.v1
Peer-reviewed version available at International Journal of Hydrogen Energy 2020; doi:10.1016/j.ijhydene.2019.12.161

19
[7] D. Hart et al., “Scenarios for deployment of hydrogen in contributing to meeting carbon
budgets and the 2050 target,” London, 2015.
[8] S. Schiebahn, T. Grube, M. Robinius, V. Tietze, B. Kumar, and D. Stolten, “Power to gas:
Technological overview, systems analysis and economic assessment for a case study in
Germany,” Int. J. Hydrogen Energy, vol. 40, no. 12, pp. 4285–4294, Apr. 2015.
[9] M. Robinius et al., “Linking the Power and Transport Sectors—Part 1: The Principle of
Sector Coupling,” Energies, vol. 10, no. 7, p. 956, Jul. 2017.
[10] M. A. Pellow, C. J. M. Emmott, C. J. Barnhart, and S. M. Benson, “Hydrogen or batteries
for grid storage? A net energy analysis,” Energy Environ. Sci., vol. 8, no. 7, pp. 1938–
1952, 2015.
[11] A. Ozarslan, “Large-scale hydrogen energy storage in salt caverns,” Int. J. Hydrogen
Energy, vol. 37, no. 19, pp. 14265–14277, Oct. 2012.
[12] F. Crotogino, S. Donadei, U. Bünger, and L. H., “Large-Scale Hydrogen Underground
Storage for Securing Future Energy Supplies: 18th World Hydrogen Energy Conference
2010 - WHEC 2010, May 16.-21. 2010, Essen,” Schriften des Forschungszentrums Jülich
Reihe Energie & Umwelt. Forschungszentrum IEF-3, Jülich, p. 506, 2010.
[13] H. Landinger et al., “HyUnder:Update of Benchmarking of large scale hydrogen
underground storage with competing options,” 2014.
[14] C. Hemme and W. van Berk, “Potential risk of H2S generation and release in salt cavern
gas storage,” J. Nat. Gas Sci. Eng., vol. 47, pp. 114–123, Nov. 2017.
[15] T. F. Barron, “Regulatory, Technical Pressures Prompt More U.S. Salt-Cavern Gas
Storage,” Oil Gas J., vol. 92, no. 37, 1994.
[16] T. M. Letcher, “Storing energy: With special reference to renewable energy sources.”
Elsevier, Amsterdam, p. 11, 2016.
[17] D. Stolten and B. Emonts, Hydrogen Science and Engineering: Materials, Processes,
Systems and Technology, 2nd ed. Berlin: Wiley-VCH Verlag GmbH & Co. KGaA, 2016.
[18] H. Blanco and A. Faaij, “A review at the role of storage in energy systems with a focus on
Power to Gas and long-term storage,” Renew. Sustain. Energy Rev., vol. 81, pp. 1049–
1086, Jan. 2018.
[19] H. Landinger and F. Crotogino, “The role of large-scale hydrogen storage for future
renewable energy utilisation,” in Second International Renewable Energy Storage
Conference (IRES II), 2007.
[20] R. Tarkowski, “Perspectives of using the geological subsurface for hydrogen storage in
Poland,” Int. J. Hydrogen Energy, vol. 42, no. 1, pp. 347–355, Jan. 2017.
[21] R. Tarkowski and G. Czapowski, “Salt domes in Poland – Potential sites for hydrogen
storage in caverns,” Int. J. Hydrogen Energy, vol. 43, no. 46, pp. 21414–21427, Nov.
2018.
[22] I. Iordache, D. Schitea, A. V Gheorghe, and M. Iordache, “Hydrogen underground storage
in Romania, potential directions of development, stakeholders and general aspects,” Int. J.
Hydrogen Energy, vol. 39, no. 21, pp. 11071–11081, Jul. 2014.
Preprints (www.preprints.org) | NOT PEER-REVIEWED | Posted: 16 October 2019 doi:10.20944/preprints201910.0187.v1
Peer-reviewed version available at International Journal of Hydrogen Energy 2020; doi:10.1016/j.ijhydene.2019.12.161

20
[23] J. Michalski et al., “Hydrogen generation by electrolysis and storage in salt caverns:
Potentials, economics and systems aspects with regard to the German energy transition,”
Int. J. Hydrogen Energy, vol. 42, no. 19, pp. 13427–13443, May 2017.
[24] the A. and R. B. C. for L. S. and L. T. S. of R. E. by H. U. S. in E. Assessment of the
Potential, Ed., “HyUnder Project.” p. 18, 2014.
[25] D. Parkes, D. J. Evans, P. Williamson, and J. D. O. Williams, “Estimating available salt
volume for potential CAES development: A case study using the Northwich Halite of the
Cheshire Basin,” J. Energy Storage, vol. 18, pp. 50–61, Aug. 2018.
[26] I. Staffell et al., “The role of hydrogen and fuel cells in the global energy system,” Energy
Environ. Sci., vol. 12, no. 2, pp. 463–491, 2019.
[27] I. Lütkehus et al., “Potenzial der Windenergie an Land,” Dessau-Roßlau, 2013.
[28] I. Contrucci, E. Klein, N.-T. Cao, X. Daupley, and P. Bigarré, “Multi-parameter
monitoring of a solution mining cavern collapse: First insight of precursors,” Comptes
Rendus Geosci., vol. 343, no. 1, pp. 1–10, Jan. 2011.
[29] I. Contrucci, E. Klein, P. Bigarré, A. Lizeur, A. Lomax, and M. Bennani, “Management of
Post-mining Large-scale Ground Failures: Blast Swarms Field Experiment for Calibration
of Permanent Microseismic Early-warning Systems,” Pure Appl. Geophys., vol. 167, no.
1–2, pp. 43–62, Feb. 2010.
[30] P. Renoux, E. Fortier, and C. Maisons, “Microseismicity induced within hydrocarbon
storage in salt caverns,” in Solution Mining Research Institute (SMRI) Conference, 2013.
[31] Z. Perski, R. Hanssen, A. Wojcik, and T. Wojciechowski, “InSAR analyses of terrain
deformation near the Wieliczka Salt Mine, Poland,” Eng. Geol., vol. 106, no. 1–2, pp. 58–
67, May 2009.
[32] J. N. Breunese, R. M. H. E. van Eijs, S. de Meer, and I. C. Kroon, “Observation and
prediction of the relation between salt creep and land subsidence in solution mining. The
Barradeel case.,” in Solution Mining Research Institute (SMRI) Conference, 2003.
[33] K.-H. Lux, “Design of salt caverns for the storage of natural gas, crude oil and
compressed air: Geomechanical aspects of construction, operation and abandonment,”
Geol. Soc. London, Spec. Publ., vol. 313, no. 1, pp. 93–128, 2009.
[34] D. S. Ryberg, Z. Tulemat, M. Robinius, and D. Stolten, “Geospatial Land Availability for
Energy Systems (GLAES).” 2017.
[35] “European database of active faults and seismogenic SHARE.” [Online]. Available:
http://www.share-eu.org/node/70. [Accessed: 10-Oct-2018].
[36] A. Natural Gas Pipelines in Europe Africa & Middle East, “Harvard WorldMap.” .
[37] T. Wang, C. Yang, H. Ma, J. J. K. Daemen, and H. Wu, “Safety evaluation of gas storage
caverns located close to a tectonic fault,” J. Nat. Gas Sci. Eng., vol. 23, no. Volume 21,
Bundle 22, pp. 281–293, Mar. 2015.
[38] H. R. Stolzenburg K. Wietschel M., Geneose F., Michaelis J., Lehmann J., Miege A.,
Krause S., Donadei S., Crotogino F., Acht A., Horvath P-L., H. R. Stolzenburg K.
Wietschel M., Geneose F., Michaelis J., Lehmann J., Miege A., Krause S., Donadei S.,
Preprints (www.preprints.org) | NOT PEER-REVIEWED | Posted: 16 October 2019 doi:10.20944/preprints201910.0187.v1
Peer-reviewed version available at International Journal of Hydrogen Energy 2020; doi:10.1016/j.ijhydene.2019.12.161
21
Crotogino F., Acht A., Horvath P-L., and H. R. Stolzenburg K. Wietschel M., Geneose F.,
Michaelis J., Lehmann J., Miege A., Krause S., Donadei S., Crotogino F., Acht A.,
Horvath P-L., “Integration von Wind-Wasserstoff-Systemen in das Energiesystem:
Abschlussbericht,” Berlin, 2014.
[39] J. A. DiPietro, “Landscape Evolution in the United States: An Introduction to the
Geography, Geology, and Natural History,” in Landscape Evolution in the United States:
An Introduction to the Geography, Geology, and Natural History, 2012.
[40] Y. Wang, J. Kowal, M. Leuthold, and D. U. Sauer, “Storage System of Renewable Energy
Generated Hydrogen for Chemical Industry,” Energy Procedia, vol. 29, pp. 657–667,
2012.
[41] I. H. Bell, J. Wronski, S. Quoilin, and V. Lemort, “Pure and Pseudo-pure Fluid
Thermophysical Property Evaluation and the Open-Source Thermophysical Property
Library CoolProp,” Ind. Eng. Chem. Res., vol. 53, no. 6, pp. 2498–2508, Feb. 2014.
[42] Gas Infrastructure Europe, “GIE Storage Map,” GIE Storage Map Dataset in Excel-
Format, 2016. [Online]. Available: https://www.gie.eu/index.php/gie-
publications/databases/storage-database. [Accessed: 11-Jun-2017].
[43] Uniongas, “Chemical Composition of Natural Gas.” [Online]. Available:
https://www.uniongas.com/about-us/about-natural-gas/chemical-composition-of-natural-
gas. [Accessed: 09-Sep-2018].
[44] A. Gillhaus, F. Crotogino, and S. Albes D. Leo v., “Compilation and Evaluation of
Bedded Salt Deposits and Bedded Salt Cavern Characterisitcs Important to Successful
Cavern Sealing and Abandonment,” Solut. Min. Res. Insitute KBB Undergr. Technol.
GmbH, vol. 2006, p. 257, 2006.
[45] A. Le Duigou, A.-G. Bader, J.-C. Lanoix, and L. Nadau, “Relevance and costs of large
scale underground hydrogen storage in France,” Int. J. Hydrogen Energy, vol. 42, no. 36,
pp. 22987–23003, Sep. 2017.
[46] F. Gutiérrez, J. M. Calaforra, F. Cardona, F. Ortí, J. J. Durán, and P. Garay, “Geological
and environmental implications of the evaporite karst in Spain,” Environ. Geol., vol. 53,
no. 5, pp. 951–965, Jan. 2008.
[47] Nordic CCS Competence Centre, “Geology and stratigraphy.” [Online]. Available:
https://data.geus.dk/nordiccs/geology.xhtml#s2. [Accessed: 11-Jun-2018].
[48] H. Doornenbal, Petroleum geological atlas of the southern Permian Basin Area. Houten,
the Netherlands: EAGE Publications BV, 2010.
[49] Bundesanstalt für Geowissenschaften und Rohstoffe, “Geoviewer (InSpEE
Salzstrukturen).” .
[50] C. Noack et al., “Studie über die Planung einer Demonstrationsanlage zur Wasserstoff-
Kraftstoffgewinnung durch Elektrolyse mit Zwischenspeicherung in Salzkavernen unter
Druck: Ludwig Bölkow Systemtechnik GmbH (LBST), Fraunhofer Institut für Solare
Energiesysteme (ISE), KBB,” 2014.
[51] D. J. Evans and S. Holloway, “A review of onshore UK salt deposits and their potential
for underground gas storage,” Geol. Soc. London, Spec. Publ., vol. 313, no. 1, pp. 39–80,
Preprints (www.preprints.org) | NOT PEER-REVIEWED | Posted: 16 October 2019 doi:10.20944/preprints201910.0187.v1
Peer-reviewed version available at International Journal of Hydrogen Energy 2020; doi:10.1016/j.ijhydene.2019.12.161

22
2009.
[52] G. Czapowski and K. Bukowski, “Geology and resources of salt deposits in Poland: The
state of the art,” Geol. Q., vol. 54, no. 4, pp. 509–518, 2010.
[53] J. Ślizowski, L. Lankof, K. Urbańczyk, and K. Serbin, “Potential capacity of gas storage
caverns in rock salt bedded deposits in Poland,” J. Nat. Gas Sci. Eng., vol. 43, pp. 167–
178, Jul. 2017.
[54] K. Bukowski, “Salt Sources and Salt Springs in the Carpathian Zone: Explorations in salt
archaeology in the Carpathian zone Chapter: Salt sources and salt springs in the
Carpathian zone,” Archaeolingua, p. 9, 2013.
[55] C. Krézsek and A. W. Bally, “The Transylvanian Basin (Romania) and its relation to the
Carpathian fold and thrust belt: Insights in gravitational salt tectonics,” Mar. Pet. Geol.,
vol. 23, no. 4, pp. 405–442, May 2006.
[56] M. D. Cocker, G. J. Orris, and P. Dunlap, “Geology and Undiscovered Resource
Assessment of the Potash-Bearing Pripyat and Dnieper-Donets Basins, Belarus and
Ukraine: Global Mineral Resource Assessment - Scientific Investigations Report 2010-
5090-BB,” U.S. Geol. Surv., p. 130, 2010.
[57] S. . Stovba and R. . Stephenson, “Style and timing of salt tectonics in the Dniepr-Donets
Basin (Ukraine): implications for triggering and driving mechanisms of salt movement in
sedimentary basins,” Mar. Pet. Geol., vol. 19, no. 10, pp. 1169–1189, Dec. 2002.
[58] M. Gimeno-Gutiérrez and R. Lacal-Arántegui, “Assessment of the European potential for
pumped hydropower energy storage,” 2013.
[59] Fichtner, “Erstellung eines Entwicklungskonzeptes Energiespeicher in Niedersachsen,”
2014.
[60] T. Velaj, “The structural style and hydrocarbon exploration of the subthrust in the Berati
Anticlinal Belt, Albania,” J. Pet. Explor. Prod. Technol., vol. 5, no. 2, pp. 123–145, Jun.
2015.
[61] A. Gillhaus, “Underground Salt Deposits of Portugal and Spain - Geological Potential to
Meet Future Demand for Natural Gas Storage?,” Solut. Min. Res. Insitute, p. 20, 2008.
[62] F. C. Lopes, A. J. Pereira, and V. M. Mantas, “Mapping of salt structures and related fault
lineaments based on remote-sensing and gravimetric data: The case of the Monte Real salt
wall (onshore west-central Portugal),” Am. Assoc. Pet. Geol. Bull., vol. 96, no. 4, pp. 615–
634, Apr. 2012.
[63] P. Fernandes, B. Rodrigues, M. Borges, V. Matos, and G. Clayton, “Organic maturation of
the Algarve Basin (southern Portugal) and its bearing on thermal history and hydrocarbon
exploration,” Mar. Pet. Geol., vol. 46, pp. 210–233, Sep. 2013.
[64] J. I. Soto, J. F. Flinch, and G. Tari, Permo-Triassic Salt Provinces of Europe, North Africa
and the Atlantic Margins, 1st ed. Elsevier, 2017.
Preprints (www.preprints.org) | NOT PEER-REVIEWED | Posted: 16 October 2019 doi:10.20944/preprints201910.0187.v1
Peer-reviewed version available at International Journal of Hydrogen Energy 2020; doi:10.1016/j.ijhydene.2019.12.161