geographic data mining and knowledge discovery
TRANSCRIPT

J. P. Wilson and A. S. Fotheringham (eds.) Handbook of Geographic Information Science, in press.
Geographic Data Mining and Knowledge Discovery
Harvey J. Miller Department of Geography
University of Utah 260 S. Central Campus Dr. Room 270
Salt Lake City, UT 84112-9155 [email protected]
1. Introduction Geographic information science exists in an increasingly data-rich and computation-rich environment. The coverage and volume of digital geographic datasets are extensive and growing. High spatial, temporal and spectral resolution remote sensing systems and other environmental monitoring devices gather vast amounts of geo-referenced digital imagery, video, and sound. Geographic data collection devices linked to location-aware technologies (LATs) such as the global positioning system allow field researchers to collect unprecedented amounts of data. Other LATs such as cell phones, in-vehicle navigation systems and wireless Internet clients can capture data on individual movement patterns. Information infrastructure initiatives such as the U. S. National Spatial Data Infrastructure are facilitating data sharing and interoperability. The growth of computing power is widely expected to continue the exponential rate implied by Moore’s Law for at least two or three more decades.
Traditional spatial analytical methods were developed when data collection was expensive and computational power was weak. The increasing volume and diverse nature of digital geographic data easily overwhelm techniques that are designed to tease information from small, scientifically sampled and homogenous datasets. Traditional statistical methods, particularly spatial statistics, have high computational burdens. They are also confirmatory and require the researcher to have a priori hypotheses, meaning that they cannot discover unexpected or surprising information (Miller and Han 2001). This chapter discusses the process of geographic knowledge discovery (GKD) and one of its central components, namely, geographic data mining. GKD is based on a belief that there is novel and useful geographic knowledge hidden in the unprecedented amount and scope of digital geo-referenced data being collected, archived and shared by researchers, public agencies and the private sector. This knowledge cannot be revealed using traditional methods that require a priori hypotheses or cannot be scaled to handle massive data. Since GKD is an extension of a broader trend in computer science, we will first review the more general problem of knowledge discovery from databases (KDD) and related data mining techniques. We will then discuss why GKD is a meaningful extension of KDD, as well as identify major geographic data mining techniques. This chapter concludes with a discussion of research frontiers in GKD. It is important to make a distinction between geographic data, GKD, geographic data mining on one hand and the closely related but broader field of spatial databases, knowledge discovery and data mining. “Spatial” concerns any phenomena where the data objects can be embedded within some formal space that generates implicit relationships among the objects. Examples include genetics and astronomy (Shekhar and

Chawla 2001). “Geographic” refers to the specific case where the data objects are georeferenced and the embedding space relates (at least conceptually) to locations on or near the Earth’s surface. Although many spatial databases and related techniques can be applied to the specific problem of GKD, these techniques can also be applied more widely. 2. Knowledge discovery from databases 2.1. The knowledge discovery process Data mining is only one step of the knowledge discovery from databases (KDD) process. Data mining involves the application of techniques for distilling data into information or facts implied by the data. KDD is the higher level process of obtaining facts through data mining and distilling this information into knowledge or ideas and beliefs about the mini-world described by the data. This generally requires a human-level intelligence to guide the process and interpret the results based on pre-existing knowledge (Miller and Han 2001). The data miner is the critical interface between the syntactic knowledge or patterns generated by machines and the semantic knowledge required by humans for reasoning about the real world (Gahegan et al 2001).
The KDD process does not seek any arbitrary pattern from a database; rather, data mining seeks only those that are interesting. These patterns are valid (a generalizable pattern, not simply a data anomaly), novel (unexpected), useful (relevant) and understandable (can be interpreted and distilled into knowledge) (Fayyad, Piatetsky-Shapiro and Smyth 1996). In addition to the scale of the data involved, the requirement for novelty distinguishes data mining from traditional statistics oriented towards hypothesis confirmation rather than generation. From a KDD perspective, anything that can be hypothesized a priori is not novel and therefore not interesting.
The KDD process typically involves the following major steps grouped into larger activity categories (Fayyad, Piatetsky-Shapiro and Smyth 1996; Han and Kamber 2001; Qi and Zhu 2003).
1. Background 1.1.Developing an understanding of the application domain; this is often
referred to as background knowledge. 2. Data pre-processing
2.1.Data selection, or determining a subset of the records or variables in the database for focusing the search for interesting patterns.
2.2 Data cleaning, including removal of noise and outliers. 2.3 Data reduction, including transformations, projections and aggregations to
find useful representations for the data. 3. Data mining
3.1.Choosing the data mining task. This involves selecting the generic type of pattern sought through data mining; this is the language for expressing facts in the database. Generic pattern types include classes, associations, rules, clusters, outliers and trends (discussed in more detail below).
3.2.Choosing the data mining technique for discovering patterns of the generic type selected in the previous step. Since data mining algorithms are often heuristics (due to scalability requirements), there are typically several techniques available for a given pattern type, with different techniques
2

concentrating on different properties or possible relationships among the data objects.
3.3.Data mining: applying the data mining technique to search for interesting patterns.
4. Knowledge construction 4.1 Interpreting the mined patterns, often through visualization. 4.2.Consolidating the discovered knowledge, either by incorporating the
knowledge into a computational system (such as a knowledge-based database) or through documenting and reporting the knowledge to interested parties.
The KDD process is not necessarily sequential: it is likely that the analyst will re-sequence and even revisit steps based on the knowledge sought and the nature of the information uncovered within the process. The data pre-processing steps of selection, cleaning and reduction can be applied in different sequences and iteratively. The four data mining steps are also highly flexible and often iterative. The analyst can also jump back and forth between major tasks such as background knowledge, pre-processing, mining and knowledge construction.
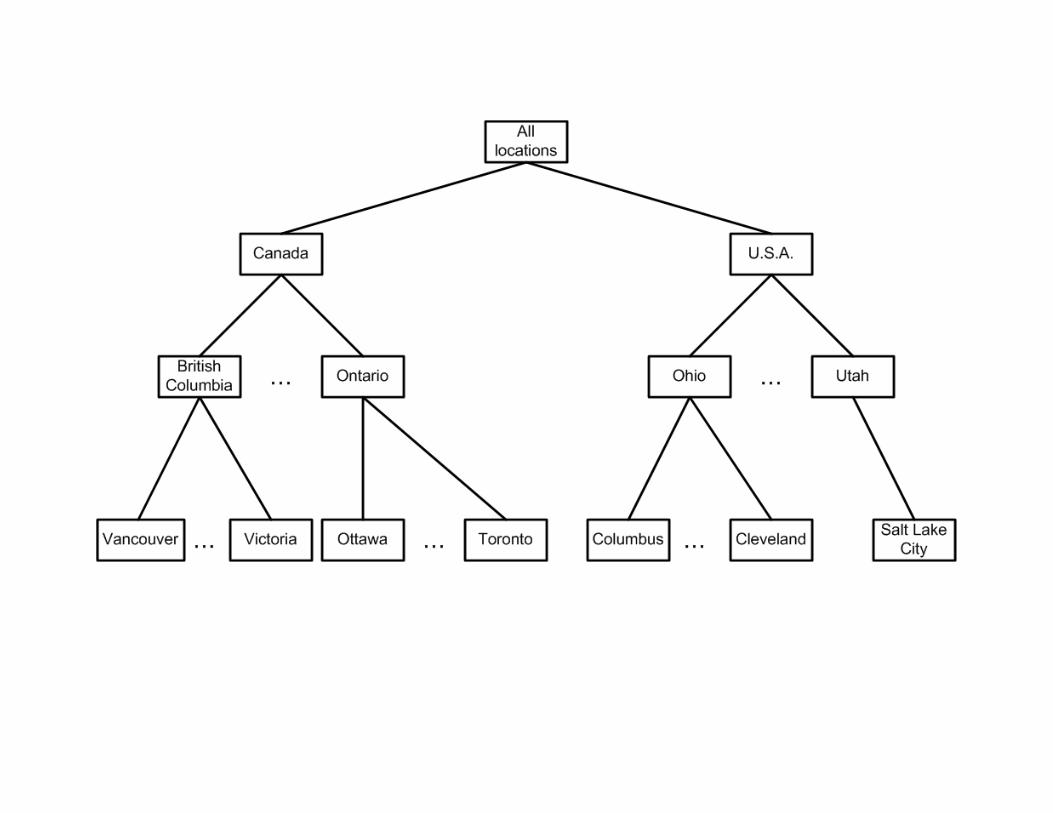
Although human-level intelligence is required to guide the complex KDD process, it is possible to support the process through computational representations of background knowledge and the interestingness measures. Concept hierarchies are simple but powerful representations of multilevel background knowledge. Each node represents a concept at some level of abstraction, and a tree arranges these levels of abstraction from the highest level (at the root) to its lowest levels (at the leaves). Concept hierarchies support rolling up (generalization) and drilling down (specialization) of data for the mining process; this allows the user to explore and interpret patterns at different semantic levels. Figure 1 illustrates a concept hierarchy for the geographic concept location within a particular knowledge domain (Han and Kamber 2001).
Figure 1: A concept hierarchy for location (based on Han and Kamber 2001, Figure 2.7).
A data mining technique can generate an overwhelmingly large number of
patterns. Interestingness measures attempt to quantify the concept of interesting to limit the candidate patterns presented to the analyst. Types of interestingness measures include simplicity (such as rule length), certainty (confidence measures), utility (database support; the number of objects for which it is true) and novelty (redundancy with patterns already stored in the database). Most measures require specified relevancy threshold values (Han and Kamber 2001). 2.2. Data warehousing and related technologies Data warehouses are critical, enabling technologies underlying the data mining and knowledge discovery process. A data warehouse is a non-transactional (non-editable) database, comprising read-only historical copies of one or more of the transactional databases used in an organization or enterprise. Data warehouses integrate and represent these data in a manner that supports very efficient querying and processing.
3

Consequently, the design principles for data warehouses are different from transactional databases. Transactional databases should be normalized or converted into the simplest logical representation in order to avoid inconsistencies associated with multiple users editing replicated data within the same database. In contrast, data warehouses need to be as connected as possible to support efficient query processing; this implies redundant data. Data warehouse design scheme include the star design, the snowflake design and fact constellations (Han and Kamber 2001). Data warehouses are not necessarily centralized; they can be distributed, multi-tiered and federated. For example, some systems can include data marts or smaller scale data warehouses specific to particular departments or divisions within a larger enterprise (Bédard, Merrett and Han 2001). Data warehouses include tools for quick multi-dimensional and multi-level data summaries. Online analytical processing (OLAP) tools allow users to manipulate simple database summaries and explore the data associated with these views. This can support data mining and other stages of the KDD process by allowing a synoptic sense of the database before applying more computationally intensive techniques. A common OLAP technique is the data cube; this reports all possible cross-tabulations of database attributes in the format of a m dimensional hypercube, where m is the number of attributes (Gray et al. 1997). Figure 2 illustrates a simple data cube for traffic data attributed according to the date (D), time of day (T) and traffic counter station (S). Figure 2: A data cube for traffic data attributed by date, time of day and station (Shekhar et al. 2002) 2.3. Seeking interesting patterns through data mining Most data mining techniques are heuristics tailored to discover patterns of a generic type. Generic patterns include classes, associations, rules, clusters and outliers (Han and Kamber 2001). Since these techniques are heuristics, there is no single optimal algorithm for discovering patterns of a given type; different techniques highlight different aspects of the information space implied by the database at the expense of other characteristics. The following discussion defines these patterns and some associated techniques. Classification involves mapping data into specified classes or meaningful categories whose cardinality is much less than the number of data objects. The mapping can be achieved through data characterization (classification based on shared characteristics) or data discrimination (methods that highlight differences among records). Characterization techniques include attribute-oriented induction: this compresses data into increasingly general relations through aggregating attributes based on the generalization operators or concept hierarchies (Han and Fu 1996). Discrimination techniques generate statistical and visual summaries intended to highlight differences among user-specified classes such as those based on data cubes. Association analysis. Association rules show dependency relationships between attributes in a database. These are typically expressed in the form where X, Y are disjoint sets of database attributes, c is the confidence or the conditional probability
( rcYX ,⇒ )
( XYP ) and r is support or the probability ( )YXP ∪ . Algorithms for association
4
analysis include breadth-first and depth-first search heuristics based on concept hierarchies (Hipp, Günyzer and Nakhaeizadeh 2000). Classification and prediction involves finding simple functions or models that can distinguish between data classes or concepts. Classification and prediction are also common in traditional statistics, but data mining demands highly scalable techniques that can be applied in an exploratory rather than a confirmatory manner. Techniques include decision tree induction, fitted linear or curvilinear relationships, Bayesian classification and artificial neural networks (Han and Kamber 2001). Cluster analysis includes techniques for classifying data objects into similar groups. Unlike concept description techniques, clusters are not pre-specified but rather emerge from the inherent similarity and dissimilarity among objects. Clustering is a computationally intensive problem and it is only recently that efficient techniques for massive databases have emerged in the literature. Clustering techniques have different objectives that affect the resulting cluster morphology. Important data characteristics include the type of data (nominal, ordinal, numeric), data dimensionality (since some techniques perform better in low-dimensional spaces) and error (since some techniques are sensitive to noise) (Han, Kamber and Tung 2001). Outlier analysis. Outliers are data objects that appear inconsistent with respect to the remainder of the database (Barnett and Lewis 1994). While in many cases these can be anomalies or noise, sometimes these represent rare or unusual events to be investigated further. For example, outlier analysis has been used in detecting credit fraud, determining voting irregularities or severe weather prediction (Shekhar et al 2003). Most tools for data mining can also be used in outlier detection since they typically also generate exceptions to the discovered patterns. However, using standard data mining techniques in outlier detection can be restrictive (since outliers are defined indirectly as observations that do not meet some specified pattern) and computationally inefficient (since finding patterns can require more effort than finding outliers). Direct methods for outlier detection include distribution-based, depth-based and distance-based approaches. Distribution-based approaches use standard statistical distributions, depth-based techniques map data objects into an m-dimensional information space (where m is the number of attributes) and distance-based approaches calculate the proportion of database objects that are a specified distance from a target object (Ng 2001). 2.4. Visualization and knowledge discovery Visualization is a powerful strategy for leveraging the visual orientation of sighted human beings. Sighted humans are extraordinarily good at recognizing visual patterns, trends and anomalies; these skills are valuable at all stages of the knowledge discovery. Visualization can be used in conjunction with OLAP to aid the user’s synoptic sense of the database. Visualization can also be used to support data preprocessing, the selection of data mining tasks and techniques, interpretation and integration with existing knowledge (Keim and Kriegel 1994). Visualization creates an opportunity for machines and humans to cooperate in ways that exploit the best abilities of both (fast but dumb
5

calculation and record-keeping versus slow but smart recognition and interpretation, respectively) (Gahegan et al. 2001). Methods for visual data mining and exploratory analysis include map-based, chart-based, projection, pixel, iconographic and network techniques. Map-based techniques allow the user to interactively represent georeferenced data in cartographic form. Chart-based techniques plot data using graphs and charts such as scatterplots and pie charts. Projection techniques use statistical transformations to represent data in alternative (non-Euclidean) spaces. Pixel techniques map data values to individual pixels that are in some meaningful order or position on the screen (such as temporal ordering or similarity-based clusters). Iconographic techniques used complex symbols (such as stick figures) to give the viewer a sense of the whole while highlighting some differentiation in the data. Network methods organize visual representation based on specified logical structures such as trees (Gahegan 2000). 3. Geographic knowledge discovery 3.1. Why geographic knowledge discovery? Geographic knowledge discovery (GKD) is the process of extracting information and knowledge from massive geo-referenced databases. The nature of geographic entities, relationships and data means that standard KDD techniques are not sufficient (Shekhar et al. 2003). Specific reasons include the nature of geographic space, the complexity of spatial objects and relationships as well as their transformations over time, the heterogeneous and sometimes ill-structured nature of geo-referenced data, and the nature of geographic knowledge.
Objects in aspatial databases are typically discrete with explicitly defined relationships codified into the database. In contrast, spatial objects by definition are embedded in a continuous space that serves as a measurement framework for all other attributes. This framework generates a wide spectrum of implicit distance, directional, and topological relationships, particularly if the objects are greater than one dimension (such as lines, polygons and volumes). Also, although most mapping techniques and spatial analysis assume Euclidean space for this framework, there are many physical and human geographic processes that exhibit non-Euclidean spatial properties (examples include migration, disease propagation and travel times in congested urban areas). Exploring alternative geo-spaces for representing geographic data is a form of data pre-processing that could substantially enhance the GKD process. It is also possible to calculate relationships through attributed geographic space that represents terrain, land cover, velocity fields or other cost fields that condition movement (Miller and Wentz 2003).
Geographic data often exhibits the properties of spatial dependency and spatial heterogeneity. Spatial dependency is the tendency of observations that are more proximal in geographic space to exhibit greater degrees of similarity or dissimilarity (depending on the phenomena). Proximity can be defined in highly general terms, including distance, direction and/or topology. Spatial heterogeneity or the non-stationarity of the process with respect to location is often evident since many geographic processes are local. Spatial dependency and heterogeneity can be evidence of misspecification (such as missing variables) but can also reflect the inherent nature of the
6

geographic process. Either way, these relationships are information-bearing (Miller and Wentz 2003; Shekhar et al. 2003).
Data objects in typical KDD applications can be reduced to points in some multidimensional space without information loss. In contrast, many geographic entities cannot be reduced to point objects without significant information loss. Characteristics such as the size and morphology of geographic entities can have non-trivial influences on geographic processes. Geographic objects can also be measurement artifacts; aggregate spatial units such as census districts are often chosen for administrative reasons or convenience rather than reality. The sensitivity of model results to the spatial measurement units is a well-known quandary often referred to as the modifiable areal unit problem (MAUP) in spatial analysis (see Fortheringham and Wong 1991). The implications of arbitrary spatial zoning and aggregation should be explored within the GKD process to determine if a discovered pattern is robust or simply an artifact of the spatial measurement units. Including time introduces additional complexity to the GKD process. A simple strategy that treats time as an additional spatial dimension is not sufficient. Time has different semantics than space: time is directional, has unique scaling and granularity properties, and can be cyclical and even branching with parallel local time streams (Roddick and Lees 2001). Spatial transformations are also complex: for example, a formal model of possible transformations in spatial objects with respect to time includes the operators create, destroy, kill, reincarnate, evolve, spawn, identity, aggregate, disaggregate, fusion and fission (see Frank 2001). Roddick and Lees (2001) argue that the potential complexity of spatio-temporal patterns may require meta-mining techniques that search for higher-level patterns among the large number of patterns generated from spatio-temporal mining. Digital geographic databases are also expanding to include more heterogeneous data types, including ill-structured data. Traditional logical data models for spatial data include vector (spatial objects in an embedding space) and raster (discrete representations of continuous spatial fields using a grid-cell tessellation). Real-time environmental monitoring systems such as intelligent transportation systems and location-based services are generating geo-referenced data in the form of dynamic flows and space-time trajectories. Georeferenced multimedia include audio, imagery, video and text that can be related unambiguously to a location on the Earth’s surface based on the location of the data collection or its content (see Câmara and Raper 1999). Despite the ill-structured nature of these data, they contain a potential wealth of information about particular places and times, including secondary (interpreted) information.
The complexity of spatial objects and relationships in geo-referenced data, as well as the computationally intensity of many spatial algorithms, means that geographic background knowledge can play an important role in managing the GKD process. Geographic concept hierarchies are particularly useful for guiding knowledge discovery at different levels of spatial aggregation (and therefore levels of computational complexity due to the spatial representations and data volumes) Figure 1 illustrated a simple geographic concept hierarchy. More sophisticated hierarchies are available from formal theories such as central place theory as well as the qualitative knowledge in traditional regional geography (we will discuss this in more detail in the conclusion).
7

3.2. Spatial data warehousing Spatial data warehouses (SDWs) are data warehouses that also include both spatial and aspatial data. SDWs often include geo-referenced data, abut other non-geographic data (such as medical imagery) can be archived using SDW techniques. Examples of geographic SDWs include the U.S. Census database, Sequoia 2000, and archives from transportation operations centers (Shekhar and Chawla 2003). Functional differences between SDW and standard data warehouses include capabilities for visualization and spatial aggregation. Conventional OLAP methods such as the data cube generate summary cross-tabs in tables; spatial data requires capabilities for data summaries in cartographic form. Conventional OLAP tools also have clear standards for aggregation and cross-tabulation, namely, the one-dimensional attributes associated with each data object. Conversely, spatial aggregation is more complex, and standards for aggregation operators on geometric data types have not yet emerged (Shekhar and Chawla 2003). In addition to purely spatial aggregations, SDW must also support non-spatial aggregations (such as those involving administrative or political units treated as nominal categories), spatial-to-non-spatial aggregations (where data are spatial at low aggregation levels but aspatial at some higher level and beyond; an example is aggregating polygons representing states or provinces that eventually become nominal categories such as regions or countries). These spatial and hybrid aggregation operators can require background knowledge in the form of concept hierarchies such as the one illustrated in Figure 1. Spatial aggregation and related measures can also be computationally-demanding; the SDW designer can choose whether to compute these on-the fly, selectively pre-compute some measures, or use filter and refine methods (Bédard, Merrett and Han 2001).
Shekhar et al (2001) develop the map cube as a spatial analog of the data cube. A map cube includes standard summaries and cross-tabulations as well as spatial summaries at different levels of aggregation with pointers to the corresponding spatial objects. The map cube includes geographic visualizations of these summaries and cross-tabulations: it generates an album of maps corresponding to all possible aspatial and spatial summaries of the data based on a specified spatial aggregation hierarchy. Figure 3 and Figure 4 illustrate map cube visualizations based on the traffic data cube in Figure 2. Figure 3 illustrates a visualization of cross-tabulation by date, time of day and station, and Figure 4 illustrates visualization by date, time of day and geographic location. Figure 3: Traffic map cube visualization by date, time of day and station (Shekhar et al. 2002). Figure 4: Traffic map cube visualization by date, time of day and geographic location 3.3. Spatial data mining Pattern types such as classes, associations, rules, clusters, outliers and trends all have spatial expressions since these patterns can be conditioned by the morphology as well as spatial relationships among these objects. This section review major techniques and applications of spatial data mining.
8

Spatial classification. These techniques map spatial objects into meaningful categories that consider the distance, direction or connectivity relationships and/or the morphology of these objects. Koperski et al (1998) use spatial buffers to classify objects based on attribute similarity and distance-based proximity. Ester et al. (1997) generalize this approach through a spatial classification learning algorithm that considers spatial relationships defined as path relationships among objects in a defined neighborhood of a target object. These paths are highly general and can be defined using any spatial relationship (see Ester, Kriegel and Sander (2001) for a generalization of this approach to other data mining tasks). Spatial association. Spatial association rules are association rules as defined above that also contain spatial predicates in their precedent or antecedent. Koperski and Han (1995) pioneered this concept, providing detailed descriptions of their formal properties as well as a top-down tree search technique that exploits background knowledge in the form of a geographic concept hierarchy. A specific type of association rule is a co-location pattern: these are subsets of spatial objects that are frequently located together. Huang, Shekhar and Xiong (2002) develop a multi-resolution filtering algorithm for discovering co-location patterns in spatial data. Spatial classification and prediction. Malebra et al (2001) use inductive learning algorithms to extract information from general purpose topographic maps such as the type produced by national surveying and cartographic organizations. A search heuristic builds logical predicates based on the spatial objects, background knowledge, defined higher-level concepts and a performance criterion. Qi and Zhu (2003) apply a decision tree induction algorithm to extracting knowledge about complex soil-landscape processes. Their system combines background knowledge in the form of a soil survey map with other environmental data to extract the expert’s judgments underlying the subjective map. Gopal, Liu and Woodcock (2001) use a type of artificial neural known as adaptive resonance theory networks to extract knowledge from a remotely sensed imagery. They also illustrate the use of visualization to support interpretation and insights into neural network performance. Spatial clustering. Spatial clustering algorithms exploit spatial relationships among data objects in determining inherent groupings of the input data. Since finding the optimal set of k clusters is intractable (where k is some integer much smaller than the cardinality of the database), a large number of heuristic methods for clustering exist in the literature. Many of these can be adapted to or are specially tailored for spatial data (Han, Tung and Kamber 2001). Traditional partitioning methods such as k-means and the expectation-maximization (EM) method can capture simple distance relationships and are therefore available for massive spatial databases. Hierarchical methods build clusters through top-down (by splitting) or bottom-up (through aggregation) methods. Density-based methods define clusters as regions of space with a relatively large number of spatial objects; unlike other methods, these can find arbitrarily-shaped clusters. Grid-based methods divide space into a raster tessellation and clusters objects based on this structure. Model-based methods find the best fit of the data relative to specific functional forms. Constraints-based methods can capture spatial restrictions on clusters or the relationships that define
9

these clusters. An example is the clustering with obstructed distance algorithm that can account for geographic obstacles such as rivers, borders and mountains. Spatial outlier analysis. Shekhar, Lu and Zhang (2003) define a spatial outlier as a spatially-referenced object whose non-spatial attributes appear inconsistent with other objects within some spatial neighborhood. Note that, unlike aspatial outliers, this definition does not imply that the object is significantly different than the overall database as a whole: it is possible for a spatial object to appear consistent with the other objects in the entire database but nevertheless appear unusual with a local neighborhood. They develop a unified modeling framework and identify efficient computational structures and strategies for detecting these types of spatial outliers based on a single (non-spatial) attribute. More generally, geographic objects can also exhibit unusual spatial properties such as size and shape. Ng (2001) uses distance-based measures to detect unusual paths in two-dimensional space traced by individuals through a monitored environment. These measures allow the identification of unusual trajectories based on entry/exit points, speed and geometry; these trajectories may correspond to unwanted behaviors such as theft. 3.4. Geographic visualization and knowledge discovery Geographic visualization (GVis), or the integration of scientific visualization with traditional cartography, is highly complementary to the GKD process and can be exploited at all stages, including data pre-processing, data mining and knowledge construction (see Gahegan et al 2001). In addition to the data volumes involved, a unique challenge is the extraordinary richness of geographic data with respect to the number and types of attributes that can be associated with geographic locations, particularly when diverse datasets are integrated based on place (Gahegan et al. 2001). The problem is how to preserve the richness of this information space when restricted to the low dimensional information spaces that can be easily related to geographic space by the user (these being two or three spatial dimensions, and possibly time through animation). For example, dense and complex symbols and colors within low dimensionality spaces can create visual interaction effects that are poorly understood and can confound knowledge discovery and communication (Gahegan 1999). 4. Conclusion: GKD Research Frontiers GKD is a dynamic field that is only just beginning at the time of this writing. GKD will continue to grow as the scope and volume of digital geo-referenced data expands and geographic information scientists develop new techniques to exploit these data as well as the increasing power of computational platforms. This section concludes the chapter by identifying some particularly important research frontiers in GKD. Representation and integration of background geographic knowledge. There is a rich source of existing geographic models, theories, laws and knowledge that can be codified to serve as background knowledge for the GKD process. For example, central place theory offers a hierarchy of market centers that can be applied at scales from local to global. Other theories such as spatial interaction theory suggest general principles regarding the role of spatial separation and complementary attributes of origins and
10

destinations in conditioning the movement of materials or information, as well as related spatial processes. Qualitative and subjective knowledge about regional geography at all geo-scales from local to global could also be represented as concept hierarchies or other semantic networks. Physical geography also contains sophisticated geographic concept hierarchies based on geomorphology, river networks, biotic regimes and so on. A critical research frontier is extracting and representing this rich geographic background knowledge to guide GKD. Knowledge discovery from georeferenced multimedia. A multimedia database system stores and manages large collections of multimedia objects such as audio, image, video and text, including metadata about where and when the media was collected, or the locations and times described by the media. Multimedia data mining is challenging since these data are implicit and the media must be processed to extract even its most basic features and structures (Han and Kamber 2001). Mining georeferenced multimedia encompasses these challenges plus the difficulties associated with geographic data mining and knowledge discovery. Parallel algorithms and distributed infrastructures for geographic data mining. Parallel processing and distributed computational platforms such as grid computing environments can be exploited in GKD. Spatial data mining techniques can sometimes be decomposed into parallel tasks. Even if task parallelism is impossible, geo-referenced data can often be divided into spatial subsets for parallel processing (see Healy et al 1998; Wang and Armstrong 2003). Developing and testing parallel and distributed algorithms and architectures for GKD is an important research frontier. Spatio-temporal knowledge discovery. As mentioned earlier in this chapter, including time in GKD greatly increased its logical complexity. There is a critical need to develop formal representations, database designs, data mining techniques and visualization methods that can extract meaningful information from these data. A particularly challenging frontier is developing representation and methods for data on mobile objects. LATs and wireless network-based location-based services (LBS) are a potentially rich source of knowledge about human activities in space and time, as well as emergent spatio-temporal phenomena such as traffic jams, urban dynamics and migration patterns (see Smyth 2001; Wolfson 2002). Physical phenomena such as weather, predator-prey dynamics, invasive species, disease propagation and environmental change also have emergent spatio-temporal properties that are notoriously difficult to analyze using traditional methods (see Mesorobian et al 1994, 1996). New questions for geographic research. A critical and broad research question for geographic information scientists and geographers is: “What are the questions that we could not ask before?” Geographic and other domain scientists should articulate fundamental and daunting research questions and challenges to guide the development of new GKD techniques. There are also needs for benchmarking and proof-of-concepts to demonstrate that these techniques can discovery interesting geographic knowledge.
11

Integrating discovered knowledge into spatial analysis and GIS. Most existing spatial analysis techniques and GIS databases use simple representations of geographic knowledge such as primitive distance and topological relationships. Discovered geographic knowledge should be used to develop knowledge-based geographic information systems as well as intelligent spatial analytical techniques. There is also a need to develop user-friendly interfaces for these techniques and software so they can be exploited by domain scientists. Acknowledgements Figure 4 is courtesy of Prof. Shashi Shekhar and Mr. Pusheng Zhang, Spatial Databases Group, University of Minnesota (http://www.cs.umn.edu/research/shashi-group/) Literature Cited Barnett, V. and Lewis, T. (1994) Outliers in Statistical Data, John Wiley. Bédard, Y., Merrett, T. and Han, J. (2001) “Fundamentals of spatial data warehousing for
geographic knowledge discovery,” in H. J. Miller and J. Han (eds.) Geographic Data Mining and Knowledge Discovery, London: Taylor and Francis, 53-73
Câmara, A. S. and Raper, J. (1999) (eds.) Spatial Multimedia and Virtual Reality,
London: Taylor and Francis. Ester, M., Kriegel, H.-P. and Sander, J. (1997) "Spatial data mining: A database
approach," M. Scholl and A, Voisard (eds.) Advances in Spatial Databases, Lecture Notes in Computer Science 1262, Berlin: Springer, 47-66.
Ester, M., Kriegel, H.-P.and Sander, J. (2001) “Algorithms and applications for spatial
data mining,” in H. J. Miller and J. Han (eds.) Geographic Data Mining and Knowledge Discovery, London: Taylor and Francis, 160-187.
Fayyad, U. M., Piatetsky-Shapiro, G. and Smyth, P. (1996) “From data mining to
knowledge discovery: An overview” in U.M. Fayyad, G. Piatetsky-Shapiro, P. Smyth and R. Ulthurusamy (eds.) Advances in Knowledge Discovery and Data Mining, Cambridge, MA: MIT Press, 1-34.
Fotheringham, A. S. and Wong, D. W. S. (1991) "The modifiable areal unit problem
in multivariate statistical analysis," Environment and Planning A, 23, 1025-1044. Frank, A. (2001) “Socio-economic units: Their life and motion,” in A. Frank, J. Raper
and J.-P. Cheylan (eds.) Life and Motion of Socio-economic Units, London: Taylor and Francis, GISDATA 8, 21-34.
Gahegan, M. (1999) “Four barriers to the development of effective exploratory
visualisation tools for the geosciences,” International Journal of Geographical Information Science 13 289-309
12

Gahegan, M. (2000) "On the application of inductive machine learning tools to geographical analysis," Geographical Analysis, 32, 113-139
Gahegan, M., Wachowicz, M. Harrower, M. and Rhyne, T.-M (2001) “The integration of
geographic visualization with knowledge discovery in databases and geocomputation,” Cartography and Geographic Information Systems, 28, 29-44.
Gopal, S., Liu, W. and Woodcock, X. (2001) “Visualization based on fuzzy ARTMAP
neural network for mining remotely sensed data,” in H. J. Miller and J. Han (eds.) Geographic Data Mining and Knowledge Discovery, London: Taylor and Francis, 315-336.
Gray, J., Chaudhuri, S., Bosworth, A., Layman, A., Reichart, D., Venkatrao, M., Pellow,
F. and Pirahesh, H. (1997) "Data cube: A relational aggregation operator generalizing group-by, cross-tab and sub-totals," Data Mining and Knowledge Discovery, 1, 29-53.
Han, J. and Kamber, M. (2003) Data Mining: Concepts and Techniques, San Francisco:
Morgan Kaufman. Han, J., Kamber, M. and Tung, A. K. H. (2001) “Spatial clustering methods in data
mining: A survey,” in H. J. Miller and J. Han (eds.) Geographic Data Mining and Knowledge Discovery, London: Taylor and Francis, 188-217.
Healy, R., Dowers, S., Gittings, B. and Mineter, M. (1998) (eds.) Parallel Processing
Algorithms for GIS, London: Taylor and Francis. Hipp, J., Güntzer, U. and Nakhaeizadeh, G. (2000) "Algorithms for association rule
mining: A general survey and comparison," SIGKDD Explorations, 2, 58-64. Huang, Y. Shekhar, S. and Xiong, H. (2000) “Discovering co-location patterns from
spatial datasets: A general approach,” Draft manuscript available at http://www.cs.umn.edu/research/shashi-group/
Keim, D. A. and Kriegel, H.-P. (1994) "Using visualization to support data mining of
large existing databases, " in J. P. Lee and G. G. Grinstein (eds.) Database Issues for Data Visualization, Lecture Notes in Computer Science 871, 210-229.
Koperski, K., Han, J., and Stefanovic N. (1998) “An efficient two-step method for
classification of spatial data,” Proceedings of the Spatial Data Handling Conference, Vancouver, Canada.
Mesrobian, E, Muntz, R., Santos, J. R., Shek, E., Mechoso, C. R., Farrara, J. D. and
Stolorz, P. (1994) "Extracting spatio-temporal patterns from geoscience datasets, IEEE Workshop on Visualization and Machine Visualization, Los Alamitos, CA: IEEE Computer Society Press, 92-103.
13

Mesrobian, E, Muntz, R., Shek, E., Nittel, S., La Rouche, M., Kriguer, M., Mechoso, C.,
Farrara, J., Stolorz, P. and Nakamura, H. (1996) "Mining geophysical data for knowledge," IEEE Expert, 11(5), 34-44.
Miller, H. J. and Han, J. (2001) Geographic data mining and knowledge discovery: An
overview," in H. J. Miller and J. Han (eds.) Geographic Data Mining and Knowledge Discovery, London: Taylor and Francis, 3-32.
Miller, H. J. and Wentz, E. A. (2003) “Representation and spatial analysis in geographic
information systems,” Annals of the Association of American Geographers, 93, 574-594.
Ng, R. (2001) “Detecting outliers from large datasets,” in H. J. Miller and J. Han (eds.)
Geographic Data Mining and Knowledge Discovery, London: Taylor and Francis, 218-235.
Qi, F. and Zhu, A.-X. (2003) “Knowledge discovery from soil maps using inductive
learning,” International Journal of Geographical Information Science, 17, 771-795.
Roddick, J. F. and Lees, B. (2001) “Paradigms for spatial and spatio-temporal data
minig,” in H. J. Miller and J. Han (eds.) Geographic Data Mining and Knowledge Discovery, London: Taylor and Francis, 33-49.
Shekhar, S. and Chawla, S. (2003) Spatial Databases: A Tour, Upper Saddle River, N. J.:
Prentice-Hall. Shekhar, S., Lu, C. T., Tan, X., Chawla, S. and Vatsavai, R. R. (2001) “Map cube: A
visualization tool for spatial data warehouses,” in H. J. Miller and J. Han (eds.) Geographic Data Mining and Knowledge Discovery, London: Taylor and Francis, 74-109.
Shekhar, S. Zhang, P., Huang, Y. and Vatsavai, R. (2003) “Trends in spatial data
mining,” in H. Kargupta, A. Joshi, K. Sivakumar, and Y. Yesha (eds.), Data Mining: Next Generation: Challenges and Future Directions, AAAI/MIT Press, in press
Shekhar, S., Lu, C. T. and Zhang, P. (2003) “A unified approach to detecting spatial
outliers,” GeoInformatica, 7, 139-166. Shekhar, S., Lu, C. T., Zhang, P. and Liu, R. (2002) “Data mining for selective
visualization of large spatial datasets,” Proceedings of 14th IEE International Conference on Tools with Artificial Intelligence (ICTAI '02), IEEE Press.
14

Smyth, C. S. (2001) “Mining mobile trajectories,” in H. J. Miller and J. Han (eds.) Geographic Data Mining and Knowledge Discovery, London: Taylor and Francis, 337-361.
Wang, S. and Armstrong, M.P. (2003) “A quadtree approach to domain decomposition
for spatial interpolation in grid computing environments,” Parallel Computing, 29, 1481-1504.
Wolfson, O. (2002) “Moving objects information management: The database challenge,”
Proceedings, 5th workshop on Next Generation Information Technologies and Systems, Caesarea, Israel, June 25-26.
15

List of figures Figure 1: A concept hierarchy for location (based Han and Kamber (2001), Figure 2.7). Figure 2: A data cube for traffic data attributed by date, time of day and station (Shekhar et al. 2002) Figure 3: Traffic map cube visualization by date, time of day and station (Shekhar et al. 2002). Figure 4: Traffic map cube visualization by date, time of day and geographic location
16