geochemistry of proterozoic clastic rocks of the kerur...
TRANSCRIPT
126
http://journals.tubitak.gov.tr/earth/
Turkish Journal of Earth Sciences Turkish J Earth Sci(2016) 25: 126-144© TÜBİTAKdoi:10.3906/yer-1503-4
Geochemistry of Proterozoic clastic rocks of the Kerur Formation of Kaladgi-Badami Basin, North Karnataka, South India: implications for paleoweathering and provenance
Ariputhiran RAMACHANDRAN1, Jayagopal MADHAVARAJU2,*, Sooriamuthu RAMASAMY3, Yong IL LEE4, Sesha RAO5, David Lalhmingliana CHAWNGTHU3, Kasilingam VELMURUGAN3
1Department of Geology, Anna University, CEG Campus, Guindy, Chennai, India2Northwest Regional Station, Institute of Geology, National Autonomous University of Mexico, Hermosillo, Sonora, Mexico3Department of Geology, School of Earth and Atmospheric Sciences University of Madras, Guindy Campus, Chenmi, India
4School of Earth and Environmental Sciences, Seoul National University, Seoul, South Korea5Atomic Minerals Directorate for Exploration and Research, Southern Region, Nagarbhavi, Bangalore, India
* Correspondence: [email protected]
1. Introduction The geochemistry of clastic sedimentary rocks reflects the tectonic setting of the basin and also provides insights into the chemical environment of deposition (Maynard et al., 1982; Bhatia and Crook, 1986; Roser and Korsch, 1986, 1988; Erickson et al., 1992). Many workers have tried to provide a detailed geochemical analysis to interpret the source rock and depositional environments (Grout, 1925; Degens, 1965; Ernst, 1970; Fralic and Kronberg, 1997; Madhavaraju and Ramasamy, 2001; Armstrong-Altrin et al., 2004, 2013; Ramasamy et al., 2007; Kadir et al., 2013; Göz et al., 2014; Zaid and Gahtani, 2015). Major and trace element geochemistry of sedimentary rocks is considered as a valuable tool to identify the provenance and tectonic setting (Schoenborn and Fedo, 2011; Zhang et al., 2011; Concepcion et al., 2012; Srivastava et al., 2013; Young et al., 2013; Armstrong-Altrin et al., 2014). The trace element contents of sediments and sedimentary rocks have been widely used to investigate sediment provenance (Armstrong-Altrin et al., 2004, 2012; Nagarajan et al.,
2007a, 2007b; Madhavaraju et al., 2010; Moosavirad et al., 2012; Yang et al., 2012; Külah et al., 2014; Madhavaraju, 2015) and weathering intensity (Madhavaraju and Ramasamy, 2002; Selvaraj and Chen, 2006; Gupta et al., 2012; Raza et al., 2012), and to understand the depositional environment (Gürel and Kadir, 2010; Jung et al., 2012; Madhavaraju and González-León, 2012; Verma and Armstrong-Altrin, 2013).
In this study, an attempt has been made to ascertain the major, trace, and rare earth elements (REEs) of the sedimentary rocks of the Kerur Formation. Dey et al. (2009) conducted a geochemical study on the sedimentary rocks of the Kaladgi-Badami Basin that mainly focused on the major and trace elements of sandstones to unravel the paleoweathering and provenance signatures. They found that these sandstones showed large variations in weathering history (including chemical index of alteration (CIA) values) and were derived from varied sources; however, they did not properly explain the variations in CIA values or the nature of the source rocks. In this paper,
Abstract: Major, trace, and rare earth element (REE) studies have been conducted on the Proterozoic clastic rocks of the Kerur Formation of the Kaladgi-Badami Basin, South India, to determine their paleoweathering conditions and provenance characteristics. Geochemically, these sedimentary rocks are classified as quartz arenite, arkose, litharenite, and sublitharenite. The chemical index of alteration values and the A-CN-K diagram suggest that the clastics rocks in this study underwent moderate to intensive weathering. Chondrite-normalized REE patterns with light REE enrichment, flat heavy REE, and a negative Eu anomaly also attribute felsic source-rock to sedimentary rocks of the Kerur Formation. In addition, Eu/Eu* (~0.77), (La/Lu)cn (~7.65), La/Sc (~5.39), Th/Sc (~3.49 ), La/Co (~6.79), and Cr/Th (~0.31) ratios support a felsic source for these rock types. Comparing REE patterns and Eu anomalies of the source rocks reveals that the Kerur Formation clastic rocks received a major contribution of sediments from the Dharwar Craton.
Key words: Geochemistry, Proterozoic, paleoweathering, provenance, Kerur Formation, Kaladgi-Badami Basin
Received: 04.03.2015 Accepted/Published Online: 12.11.2015 Final Version: 08.02.2015
Research Article

127
RAMACHANDRAN et al. / Turkish J Earth Sci
we give special attention to the clastic rocks (DNR-58 core samples) of the Kerur Formation of Proterozoic age in an effort to determine the composition of sandstones of the Kerur Formation, evaluate the exact reasons for variations in paleoweathering, and deduce the nature of the source rocks.
2. Geology and stratigraphyThe area of the study lies within the well-known Proterozoic Karnataka-Kaladgi Basin (Figure 1), which covers an area of 8000 km2. The sediments occur in an east-west trending basin with irregular boundaries and are distributed in the northern districts of Karnataka, principally in the Belgaum, Bijapur, Dharwar, and Gulbarga districts. They are comparatively less disturbed shallow marine sediments, deposited over the eroded basement rocks of gneisses and schists and Archaean granites in the Kaladgi-Badami Basin (after Jayaprakash et al., 1987; Table 1).
The Badami Group overlies both the sediments of the Bagalkot Group and basement granitoids with a distinct angular unconformity and is marked by the presence of a conglomerate in the bottom-most part. The Badami Group includes two formations: the Kerur Formation and
the Katageri Formation. The Kerur Formation consists of three members: the Kendur Conglomerate, the Cave Temple Arenite, and the Halgeri Shale. The Kendur Conglomerate is seen overlying the different rock types, namely granitoids, metasediments, and a few members of the underlying Bagalkot Group, thus representing the presence of a major unconformity prior to its deposition with a gradational contact conglomerate into the Cave Temple Arenites in Badami, where it is well developed, and forms flat-topped barren hillocks with vertical scarps; in other places, it occurs as small mounds and elevated grounds. The Halgeri Shale shows limited exposures and a thickness of less than 4 m; this member is well recognized around Halgeri and Belikhindi. Bottle green to greenish yellow in color, it is friable, silty shale with convolute laminations and is rich in micaceous minerals.
The Katageri Formation is mainly divided into three distinct members: the Belikhindi Arenite, the Halkurki Shale, and the Konkankoppa Limestone. The Belikhindi Arenite is in sharp contact with the underlying Halgeri Shale Member. This unit has a peculiar geomorphic expression, forming smooth hills with a lighter tone and a thin soil cover that supports thorny bushes. The
Figure 1. Geological map of the study area (after Jayaprakash et al., 1987; Dey et al., 2009).

128
RAMACHANDRAN et al. / Turkish J Earth Sci
Halkurki Shale exhibits good exposures around Halkurki with a thickness of approximately 70 m. It is chocolate brown to dark brown in color and is finely laminated to distinctly bedded, with prominent fissility. This unit is in some places interlaminated with fine sandy matter and also bears some carbonates. Warping and local slumping of penecontemporaneous origin and minor faults are commonly observed in this member. The Konkankoppa Limestone shows a gradational contact with the underlying shale; beds around Konkankoppa are flaggy and medium-bedded, suggesting a higher content of insoluble materials.
It is bottle green, cream, buff, and pale gray in color with frequent shale partings, and fine color banding.2.1. Lithology of the Badami Group in the Deshnur areaType exposures are seen on two sides of the town of Badami, forming a chain of picturesque outcrop that extends from Gajendragad in the east to Gotak in the west. The Badami, as a younger group within the Kaladgi-Badami Basin, is separated by a clearly recognizable angular unconformity between Lower Bagalkot and the overlying Badami rocks.
The Deshnur area represents the western part of the Mesoproterozoic Kaladgi Basin, exposing sediments
Table 1. Lithostratigraphy of the Kaladgi-Badami Basin (after Jayaprakash et al., 1987).
Age Group Subgroup Formation Member Thickness (m)
Neo
prot
eroz
oic
Badami Group
Katageri FormationKonkankoppa LimestoneHalkurki ShaleBelikhindi Arenite
856939
Kerur FormationHalgeri ShaleCave Temple AreniteKendur Conglomerate
3893
Angular unconformity
Pale
o-M
esop
rote
rozo
ic
SemiriSubgroup
Hoskatti Formation Mallapur IntrusiveDadanhatti Argillite
7695
Arlikatti FormationLakshnhatti DolomiteKeralmatti Hematite SchistNiralkeri Chert-Breccia
874239
Kundargi FormationGovindkoppa ArgilliteMuchkundi QuartziteBevinmatti Conglomerate
8018215
Disconformity
Bagalkot Group Lokapur Subgroup
Yadhalli Formation Argillite 58
Muddapur FormationBamanbudnal DolomitePetlur LimestoneJalikatti Argillite
40212143
YendigeriFormation
Naganur DolomiteChiksellikere LimestoneHebbal Argillite
9393166
YargattiFormation
Chitrabhanukot DolomiteMuttalgeri ArgilliteMahakut chert-breccia
218502133
Ramdurg FormationManoli ArgilliteSaundatti QuartziteSalgundi Conglomerate
6138331
Nonconformity
Archaean Granitoids, gneisses, and metasediments
129
RAMACHANDRAN et al. / Turkish J Earth Sci
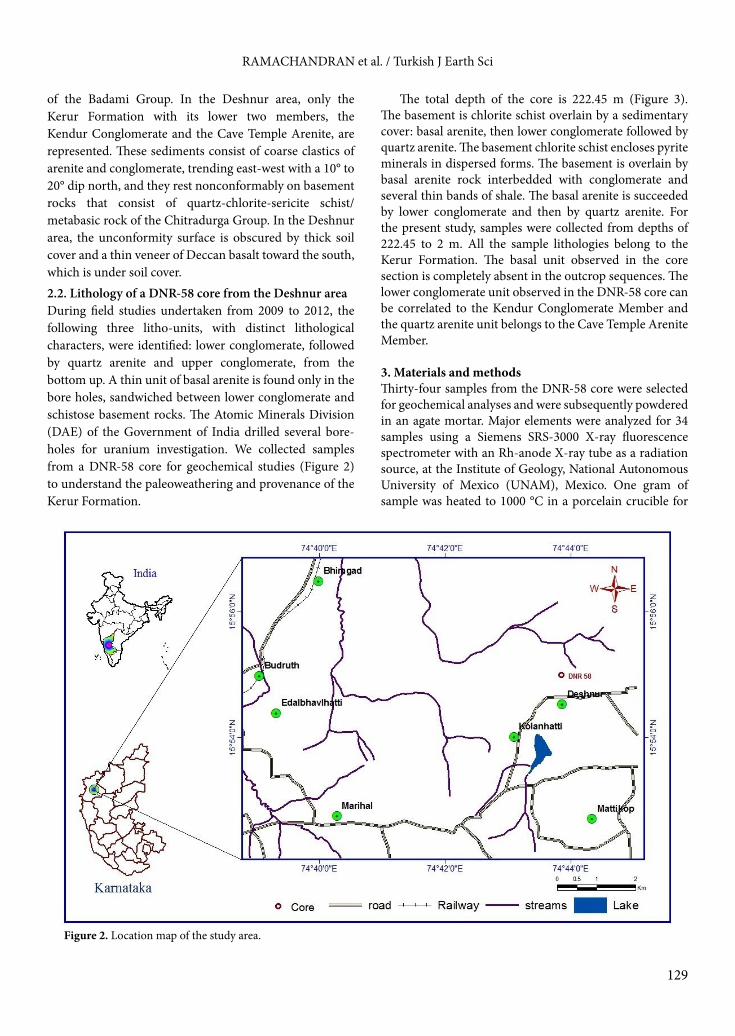
of the Badami Group. In the Deshnur area, only the Kerur Formation with its lower two members, the Kendur Conglomerate and the Cave Temple Arenite, are represented. These sediments consist of coarse clastics of arenite and conglomerate, trending east-west with a 10° to 20° dip north, and they rest nonconformably on basement rocks that consist of quartz-chlorite-sericite schist/metabasic rock of the Chitradurga Group. In the Deshnur area, the unconformity surface is obscured by thick soil cover and a thin veneer of Deccan basalt toward the south, which is under soil cover.2.2. Lithology of a DNR-58 core from the Deshnur areaDuring field studies undertaken from 2009 to 2012, the following three litho-units, with distinct lithological characters, were identified: lower conglomerate, followed by quartz arenite and upper conglomerate, from the bottom up. A thin unit of basal arenite is found only in the bore holes, sandwiched between lower conglomerate and schistose basement rocks. The Atomic Minerals Division (DAE) of the Government of India drilled several bore-holes for uranium investigation. We collected samples from a DNR-58 core for geochemical studies (Figure 2) to understand the paleoweathering and provenance of the Kerur Formation.
The total depth of the core is 222.45 m (Figure 3). The basement is chlorite schist overlain by a sedimentary cover: basal arenite, then lower conglomerate followed by quartz arenite. The basement chlorite schist encloses pyrite minerals in dispersed forms. The basement is overlain by basal arenite rock interbedded with conglomerate and several thin bands of shale. The basal arenite is succeeded by lower conglomerate and then by quartz arenite. For the present study, samples were collected from depths of 222.45 to 2 m. All the sample lithologies belong to the Kerur Formation. The basal unit observed in the core section is completely absent in the outcrop sequences. The lower conglomerate unit observed in the DNR-58 core can be correlated to the Kendur Conglomerate Member and the quartz arenite unit belongs to the Cave Temple Arenite Member.
3. Materials and methods Thirty-four samples from the DNR-58 core were selected for geochemical analyses and were subsequently powdered in an agate mortar. Major elements were analyzed for 34 samples using a Siemens SRS-3000 X-ray fluorescence spectrometer with an Rh-anode X-ray tube as a radiation source, at the Institute of Geology, National Autonomous University of Mexico (UNAM), Mexico. One gram of sample was heated to 1000 °C in a porcelain crucible for
Figure 2. Location map of the study area.

130
RAMACHANDRAN et al. / Turkish J Earth Sci
1 h to measure the loss on ignition (LOI). The geochemical standard JGB1 (GSJ) was used to check data quality. Analytical accuracy was better than ±2% for SiO2, Fe2O3,
CaO, and TiO2 and better than ±5% for Al2O3, MgO, Na2O, K2O, MnO, and P2O5.
Trace elements and REEs were analyzed for 25 samples using an Agilent 7500ce inductively coupled plasma mass spectrometer (ICP-MS) at the Institute of Geology, UNAM, Mexico. The standard analytical procedures suggested by Eggins et al. (1997) were followed in this study.
Geochemical standards GSR2 and OU8 (Govindaraju, 1994) were used to monitor the analytical reproducibility. The analytical precision errors for Ba, Sc, Y, Sr, Cr, Zn, V, Zr, Nb, Rb, Zn, and Pb were better than ±5%, whereas the analytical accuracy errors for Cu, Ni, Th, and U were better than ±10%. The accuracy errors of REEs such as La, Ce, Pr, Nd, Sm, Eu, Dy, Ho, Er, and Yb were better than 5% and those of Gd, Tb, Tm, and Lu were better than ±10%. Chondrite values (Taylor and McLennan, 1985) were used for REE-normalized diagrams.
4. Results4.1. Elemental variationsThe major element compositions of the present study are given in Table 2. Using a geochemical classification diagram (Herron, 1988), the different lithologies are classified into litharenite, sublitharenite, subarkose, and quartz arenite (Figure 4). The arenites have a high SiO2 concentration ranging from 79.72% to 98.07% (except one basal arenite sample that shows 53.51%). The lower conglomerate and basal arenite samples are higher in Al2O3 content (2.41% to 7.08%, 2.61% to 22.2%, respectively) than the quartz arenite (0.70% to 4.58%). The Fe2O3 content has a wide range in quartz arenite, lower conglomerate, and basal arenite (Table 2). The K2O/Al2O3 ratios of terrigenous sedimentary rocks can be used as an indicator of the original composition of ancient sediments because the K2O/Al2O3 ratios for clay minerals and feldspars are different. K2O/Al2O3 ratios for clay minerals range from 0.0 to 0.3 and for feldspars range between 0.3 and 0.9 (Cox and Lowe, 1995a). In the present study, the K2O/Al2O3 ratio varies as follows: basal arenite (0.61 ± 0.33, n = 6), lower conglomerate (0.70 ± 0.11, n = 12), and quartz arenite (0.22 ± 0.03, n = 13), which suggests that basal arenite and lower conglomerate contain considerable amounts of feldspar grains. SiO2 shows significant negative correlations with Al2O3 (Figure 5), suggesting that most of the SiO2 is present as quartz grains.
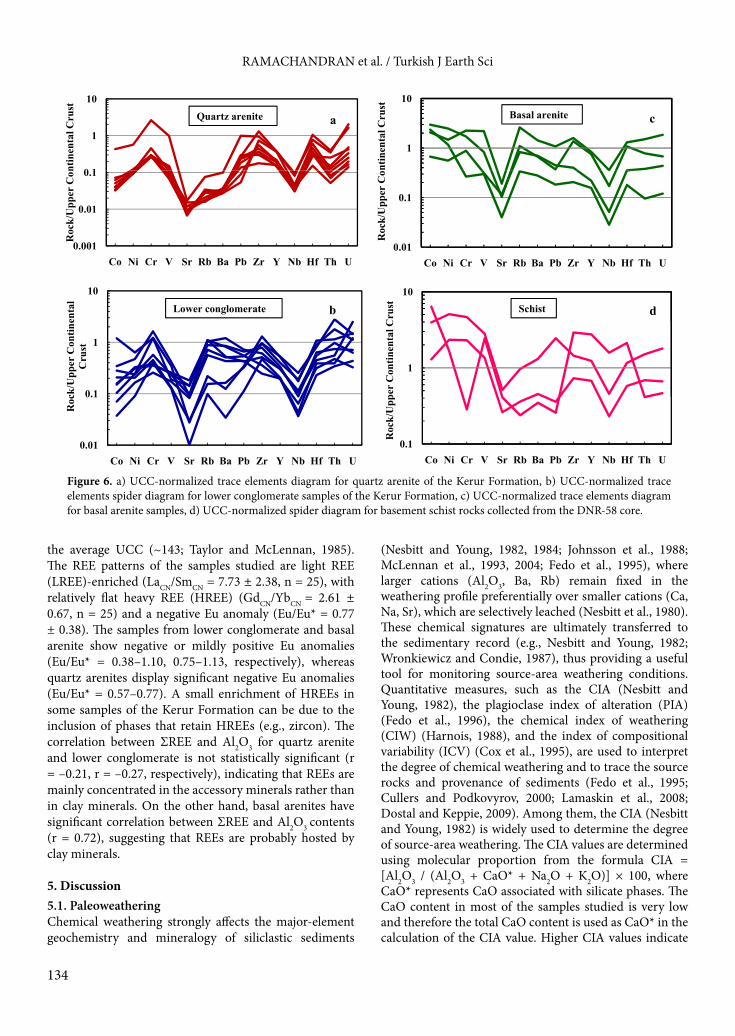
The concentrations of trace elements and their ratios are given in Table 3. The quartz arenite samples are lower in large ion lithophile elements (LILEs: Rb, Cs, Ba, and Sr) than in lower conglomerate and basal arenite (Figure 6; Table 3). In comparison with upper continental crust (UCC), the quartz arenites are depleted in Co, Sr, Rb, Ba, and Nb. Sr is depleted in both lower conglomerate and basal arenite samples. Most of the transition trace elements (TTEs: Co, Ni, V, and Cr) and high field strength elements (HFSEs: Zr, Y, Nb, and Hf) show wide variations compared to UCC (Figure 6). Al2O3 and K2O are positively correlated with Rb, Ba, and Sr in the lower conglomerate (Al2O3: r = 0.88, r = 0.73, r = 0.74, respectively; K2O: r = 0.98, r = 0.94, r = 0.96, respectively) and basal arenite (Al2O3: r = 0.99, r = 0.96, r = 0.91, respectively; K2O: r = 0.99, r = 0.98, r = 0.95, respectively), suggesting that these trace elements are
Figure 3. Lithostratigraphic section of the DNR-58 core.

131
RAMACHANDRAN et al. / Turkish J Earth Sci
Tabl
e 2.
Maj
or o
xide
s var
iatio
ns (w
t%) i
n th
e cl
astic
rock
s of t
he K
erur
For
mat
ion.
Lith
olog
yQ
uart
z are
nite
Low
er co
nglo
mer
ate
Dep
th (m
)2.
08.
413
.817
.325
.735
52.8
58.8
62.6
564
.868
.75
70.5
573
.177
.587
.75
97.8
112.
8Si
O2
Al 2O
3Fe
2O3
CaO
MgO
K2O
Na 2O
MnO
TiO
2P 2O
5LO
ITo
tal
CIA
97.7
81.
030.
230.
020.
110.
060.
060.
002
0.03
0.02
0.51
99.8
584
97.5
60.
980.
580.
010.
080.
070.
070.
002
0.07
0.01
0.3
99.7
382
97.0
11.
610.
40.
010.
090.
060.
080.
002
0.09
0.02
0.61
99.9
888
93.5
72.
861.
40.
030.
160.
620.
030.
002
0.17
0.02
0.91
99.7
779
98.0
70.
860.
190.
010.
110.
090.
060.
002
0.11
0.01
0.5
100.
0180
87.2
4.58
5.31
0.01
0.14
0.25
0.1
0.00
20.
160.
032.
0599
.83
91
95.6
52.
490.
310.
010.
110.
110.
060.
002
0.04
0.01
1.0
99.7
991
97.3
41.
320.
510.
010.
090.
070.
040.
002
0.17
0.01
0.47
100.
0389
97.1
11.
270.
250.
010.
070.
090.
040.
002
0.09
0.02
0.69
99.6
488
94.7
72.
910.
350.
010.
130.
180.
070.
002
0.05
0.02
1.16
99.6
590
95.9
62.
410.
270.
010.
120.
090.
040.
002
0.17
0.01
0.88
99.9
693
98.0
50.
70.
580.
020.
150.
080.
060.
010.
060.
020.
2199
.94
76
96.2
52.
080.
220.
010.
10.
070.
10.
010.
060.
010.
7599
.66
89
95.9
22.
410.
210.
010.
120.
260.
010.
010.
230.
021.
0510
0.25
88
91.1
24.
591.
310.
020.
190.
530.
080.
013
0.21
0.02
1.54
99.6
286
94.0
43.
710.
340.
040.
140.
410.
110.
020.
040.
031.
0599
.93
84
91.9
63.
142.
130.
030.
141.
370.
070.
002
0.45
0.03
0.75
100.
0766
Lith
olog
yLo
wer
cong
lom
erat
eBa
sal a
reni
teSc
hist
Dep
th (m
)11
5.8
127.
813
6.8
150.
215
6.7
157.
516
2.35
168
168.
3517
1.45
177.
118
1.4
185
187
188.
6520
0.65
222.
45Si
O2
Al 2O
3Fe
2O3
CaO
MgO
K2O
Na 2O
MnO
TiO
2P 2O
5LO
ITo
tal
CIA
90.0
54.
411.
690.
020.
142.
40.
070.
002
0.23
0.02
1.08
100.
1162
85.6
46.
821.
780.
030.
24.
250.
130.
002
0.12
0.02
0.86
99.8
558
90.4
55.
040.
620.
030.
132.
890.
120.
002
0.02
0.02
0.65
99.9
760
90.3
84.
940.
950.
020.
132.
190.
080.
002
0.04
0.01
1.21
99.9
566
90.5
54.
510.
830.
020.
182.
670.
160.
002
0.09
0.02
0.98
100.
0359
86.6
96.
761.
350.
030.
243.
780.
120.
002
0.06
0.02
0.84
99.8
961
79.7
97.
085.
480.
030.
273.
30.
070.
002
0.15
0.02
3.66
99.8
565
90.6
64.
610.
330.
010.
163.
250.
140.
002
0.1
0.02
0.65
99.9
355
90.5
44.
70.
720.
020.
232.
860.
070.
002
0.09
0.01
0.79
100.
0359
89.4
15.
510.
60.
020.
243.
070.
150.
002
0.07
0.02
1.04
100.
1360
53.5
122
.26.
420.
090.
869.
370.
080.
010.
60.
026.
2999
.45
68
79.7
28.
994.
050.
040.
772.
970.
120.
030.
370.
032.
8599
.94
72
89.2
63.
883.
40.
030.
681.
270.
130.
040.
050.
021.
3510
0.11
70
92.5
32.
611.
910.
010.
221.
360.
10.
002
0.09
0.01
1.2
100.
0461
44.1
615
.63
18.5
71.
684.
850.
713.
240.
263.
961.
135.
0599
.24
63
48.4
220
.63
12.4
81.
824.
733.
443.
020.
190.
940.
174.
199
.94
63
63.9
414
.26
8.33
1.24
3.86
1.96
2.68
0.1
0.69
0.13
2.66
99.8
562

132
RAMACHANDRAN et al. / Turkish J Earth Sci
Log (SiO2 / Al2O3)
Log
(Fe
2O3
/ K2O
)
0.0 0.5 1.0 1.5 2.0 2.5–1.5
–0.5
0.5
1.5
Fe–shale Fe–sand
Shale
Arkose Subarkose
Quartz arenite
Wac
ke
Sublith–arenite
Lith–arenite
Quartz arenite Lower conglomerate Basal arenite
Figure 4. Geochemical classification of the clastic rocks of the Kerur Formation using log(SiO2/Al2O3) – log(Fe2O3/K2O) diagram (after Herron, 1988).
Figure 5. Variations of SiO2 versus Al2O3, Fe2O3, Na2O, K2O CaO, MgO, MnO, and TiO2 (wt.%) for clastic rocks of the Kerur Formation.
02468
10
0 20 40 60 80 100
K2O
(wt %
)
SiO2 (wt%)
0
0.2
0.4
0.6
0.8
0 20 40 60 80 100
TiO
2(w
t %)
SiO2 (wt %)
0
0.05
0.1
0.15
0.2
0 20 40 60 80 100
Na 2
O (w
t %)
SiO2 (wt %)
0
0.02
0.04
0.06
0 20 40 60 80 100
MnO
(wt %
)
SiO2 (wt %)
5
10
2O3
(wt %
)
0 40.60.8
1
gO (w
t %)
00 20 40 60 80 100
Fe2
SiO2 (wt %)
00.20.4
0 20 40 60 80 100
Mg
SiO2 (wt %)
05
10152025
0 20 40 60 80 100
Al 2O
3(w
t %)
SiO2 (wt %)
00.020.040.060.08
0.1
0 20 40 60 80 100
CaO
(wt %
)
SiO2 (wt %)

133
RAMACHANDRAN et al. / Turkish J Earth Sci
largely fixed in the k-feldspar and clay minerals. However, the correlation of Al2O3 and K2O versus Rb, Ba, and Sr is poor or negative for quartz arenites (Al2O3: r = 0.25, r = 0.09, r = –0.13, respectively; K2O: r = 0.17, r = –0.04, r = –0.28, respectively). This suggests that the distributions of these elements are not controlled by k-feldspar and clays in the quartz arenites.
The results of REE analysis are given in Table 4, and chondrite-normalized patterns are shown in Figure 7. ΣREE concentrations vary widely, which is characteristic of individual rock types, e.g., basal arenite (~7.84–74.98 ppm; n = 4), lower conglomerate (~18.84–158.66 ppm; n = 9), and quartz arenite (~12.96–43.06 ppm; n = 9). All analyzed samples have ΣREE abundances less than
Table 3. Trace element concentrations (ppm) in the clastic rocks of the Kerur Formation.
Lithology Quartz arenites Lower conglomerateDepth (m) 2.0 8.4 13.8 35 52.8 58.8 64.8 70.55 73.1 77.5 87.75 97.8 115.8ScVCrCoNiCuZnRbSrYZrNbCsBaHfTaPbThU
1.45.679.50.321.91.980.581.775.314.76840.760.06182.120.065.080.890.46
1.47.429.70.391.92.161.161.944.134.09700.850.06201.850.084.650.750.55
1.58.5410.20.622.424.412.361.913.27.991401.110.06153.50.111.071.360.93
1.54.079.80.341.92.02.373.142.994.451051.140.10152.690.051.781.120.7
1.759.2192.394.3111.3811632.118.375.968.151802.360.36544.480.2719.893.715.72
1.66.5615.950.52.092.642.813.82.358.12492.020.12166.110.25.404.244.57
1.54.5210.30.42.02.560.793.172.83.15690.790.1171.780.083.71.611.35
1.48.949.40.41.92.761.663.313.073.4570.810.15181.590.095.932.71.18
1.54.879.80.721.91.181.712.314.153.48341.00.09200.880.12.710.550.39
1.47.6213.920.371.85.332.3311.053.524.52901.080.26192.260.172.254.183.36
1.721.0542.891.044.868.835.5124.579.6311.352464.370.98686.260.586.8712.224.18
1.47.9115.772.074.1042.14.8617.3110.458.781794.710.88895.150.76.4519.113.14
1.413.9119.922.824.776.285.6680.2332.8111.641816.353.542794.661.0310.6629.924.04
Table 3. Continued.
Lithology Lower conglomerate Basal arenite SchistDepth (m) 127.8 150.2 157.5 162.35 168 171.45 177.1 181.4 185 188.65 200.65 222.45ScVCrCoNiCuZnRbSrYZrNbCsBaHfTaPbThU
1.515.4912.371.586.180.673.98115.9763.416.641152.841.746613.170.4314.3610.371.75
1.310.329.00.73.290.62.3962.9528.784.32470.911.342371.330.198.673.661.21
1.514.6513.051.56.560.714.42122.6649.484.21681.62.34491.810.210.965.060.91
1.4625.0257.233.449.440.667.78123.5133.146.68972.645.952902.60.298.455.916.97
1.511.2242.2311.9312.668.672.9298.450.937.391492.221.774693.690.6013.197.921.99
1.418.7930.826.711.161.6313.8892.7340.124.81761.282.433842.050.158.954.061.22
9.81131.8478.7820.7329.3612.1226.91292.5566.6218.423038.9415.917877.571.0621.5216.155.19
5.9649.7859.8229.6449.5574.3346.44123.073616.542604.286.243686.260.447.438.341.89
1.417.889.323.5423.342.4343.9237.7614.013.44390.710.861531.040.063.661.020.34
17.44146.279.963.6833.4515.97209.8726.65143.3460.5855239.451.6819212.323.05.154.421.3
19.22168.04162.4439.52101.4419.92113.66108.32179.4927.1527511.46.797226.741.248.9716.155.03
8.8881.2180.7712.9346.778.9249.0140.4691.4614.891395.781.842493.360.577.177.371.86
134
RAMACHANDRAN et al. / Turkish J Earth Sci
the average UCC (~143; Taylor and McLennan, 1985). The REE patterns of the samples studied are light REE (LREE)-enriched (LaCN/SmCN = 7.73 ± 2.38, n = 25), with relatively flat heavy REE (HREE) (GdCN/YbCN = 2.61 ± 0.67, n = 25) and a negative Eu anomaly (Eu/Eu* = 0.77 ± 0.38). The samples from lower conglomerate and basal arenite show negative or mildly positive Eu anomalies (Eu/Eu* = 0.38–1.10, 0.75–1.13, respectively), whereas quartz arenites display significant negative Eu anomalies (Eu/Eu* = 0.57–0.77). A small enrichment of HREEs in some samples of the Kerur Formation can be due to the inclusion of phases that retain HREEs (e.g., zircon). The correlation between ΣREE and Al2O3 for quartz arenite and lower conglomerate is not statistically significant (r = –0.21, r = –0.27, respectively), indicating that REEs are mainly concentrated in the accessory minerals rather than in clay minerals. On the other hand, basal arenites have significant correlation between ΣREE and Al2O3 contents (r = 0.72), suggesting that REEs are probably hosted by clay minerals.
5. Discussion5.1. PaleoweatheringChemical weathering strongly affects the major-element geochemistry and mineralogy of siliclastic sediments
(Nesbitt and Young, 1982, 1984; Johnsson et al., 1988; McLennan et al., 1993, 2004; Fedo et al., 1995), where larger cations (Al2O3, Ba, Rb) remain fixed in the weathering profile preferentially over smaller cations (Ca, Na, Sr), which are selectively leached (Nesbitt et al., 1980). These chemical signatures are ultimately transferred to the sedimentary record (e.g., Nesbitt and Young, 1982; Wronkiewicz and Condie, 1987), thus providing a useful tool for monitoring source-area weathering conditions. Quantitative measures, such as the CIA (Nesbitt and Young, 1982), the plagioclase index of alteration (PIA) (Fedo et al., 1996), the chemical index of weathering (CIW) (Harnois, 1988), and the index of compositional variability (ICV) (Cox et al., 1995), are used to interpret the degree of chemical weathering and to trace the source rocks and provenance of sediments (Fedo et al., 1995; Cullers and Podkovyrov, 2000; Lamaskin et al., 2008; Dostal and Keppie, 2009). Among them, the CIA (Nesbitt and Young, 1982) is widely used to determine the degree of source-area weathering. The CIA values are determined using molecular proportion from the formula CIA = [Al2O3 / (Al2O3 + CaO* + Na2O + K2O)] × 100, where CaO* represents CaO associated with silicate phases. The CaO content in most of the samples studied is very low and therefore the total CaO content is used as CaO* in the calculation of the CIA value. Higher CIA values indicate
10 10
0 1
1
10
ntin
enta
l Cru
st
1
10
ntin
enta
l Cru
st
Quartz arenite Basal arenitea c
0 001
0.01
0.1
Roc
k/U
pper
Con
0 01
0.1
Roc
k/U
pper
Co
0.001Co Ni Cr V Sr Rb Ba Pb Zr Y Nb Hf Th U
10
enta
l
0.01Co Ni Cr V Sr Rb Ba Pb Zr Y Nb Hf Th U
10
Cru
stLower conglomerate Schistb d
0.1
1
ck/U
pper
Con
tine
Cru
st
1
per
Con
tinen
tal C
0.01
0.1
Co Ni Cr V Sr Rb Ba Pb Zr Y Nb Hf Th U
Roc
0.1Co Ni Cr V Sr Rb Ba Pb Zr Y Nb Hf Th U
Roc
k/U
pp
Figure 6. a) UCC-normalized trace elements diagram for quartz arenite of the Kerur Formation, b) UCC-normalized trace elements spider diagram for lower conglomerate samples of the Kerur Formation, c) UCC-normalized trace elements diagram for basal arenite samples, d) UCC-normalized spider diagram for basement schist rocks collected from the DNR-58 core.

135
RAMACHANDRAN et al. / Turkish J Earth Sci
intense chemical weathering (Nesbitt and Young, 1982; Fedo et al., 1995), whereas low CIA values suggest the near absence of chemical alteration and therefore might reflect cool and/or arid conditions (Fedo et al., 1995).
The CIA values vary from 58 to 95. For each lithology the CIA values vary as follows: basal arenite (61–74), lower conglomerate (58–90), and quartz arenite (81–95). During the initial stage of weathering, the sediments derived from the various igneous rocks (trend lines 1–5; Figure 8) mainly plot parallel to the A-CN line because Na2O and CaO are leached out from the earlier dissolved plagioclase. Increasing weathering intensity of the source rocks leads to the destruction of plagioclase. This resulted in the loss of Ca and Na from plagioclase feldspar and the resulted sediments plot closer to the A-K axis (e.g., Descourvieres et al., 2011; Misra and Sen, 2012; Raza et al., 2012). Likewise, the intensely weathered samples plot nearer to apex A, suggesting the abundance of kaolinite and gibbsite over primary minerals such as feldspar. Interestingly, samples of basal arenite, lower conglomerate, and quartz arenite are clustered at two points. In the A-CN-K diagram, quartz arenites and few lower conglomerate
samples plot closer to apex A, indicating that these sediments underwent intense chemical weathering in the source region. However, most of the lower conglomerate and basal arenite samples follow the A-K trend line and plot between k-feldspar and muscovite fields, implying that their source area experienced moderate intensity of chemical weathering. This is also supported by PIA values (Fedo et al., 1995), which are obtained using the following equation (molecular proportion): PIA = [Al2O3 – K2O)/(Al2O3 + CaO* + Na2O - K2O)] × 100. The PIA values are more or less similar to CIA values.
In the A-CN-K compositional space, each lithology exhibits a wide range of CIA values, and the observed compositional diversity is interpreted to reflect temporal variations in the balance between erosion and chemical weathering. Because the degree of weathering is chiefly a function of climate and tectonic-uplift rates (Wronkiewicz and Condie, 1987), increased chemical weathering intensity might reflect a decrease in tectonic activity and/or a change in climate toward warm and humid conditions (Jacobson et al., 2003). Therefore, weathering indices of sedimentary rocks can provide useful information about
Table 4. Rare earth element concentrations (ppm) and their ratios in the clastic rocks of the Kerur Formation.
Lithology Quartz arenites Lower conglomerateDepth (m) 2.0 8.4 13.8 35 52.8 58.8 64.8 70.55 73.1 77.5 87.75 97.8 115.8LaCePrNdSmEuGdTbDyHoErTmYbLuTh/ULa/ThLa/CoTh/CoLa/ScTh/ScTh/CrRb/SrCr/ThSLREE/SHREESREE(La/Yb)cn(La/Sm)cn(Gd/Yb)cnEu/Eu*
8.6213.681.727.221.210.251.070.160.800.160.540.080.620.101.949.7026.662.756.160.640.090.3310.689.1836.239.354.501.390.68
3.416.890.732.840.600.150.690.120.680.140.440.070.490.081.354.568.721.912.440.540.080.4712.945.3517.344.683.561.140.72
5.379.580.903.220.690.200.970.201.260.291.030.161.180.191.463.968.702.203.580.900.130.607.523.7425.253.094.870.670.75
2.635.550.552.190.500.130.570.110.640.130.440.060.460.071.602.347.843.351.750.750.111.058.734.6014.013.883.331.010.77
9.4418.531.736.621.400.311.360.231.250.260.810.120.860.130.652.542.190.865.562.190.041.4024.887.5043.067.444.261.290.69
4.158.850.923.540.910.231.140.201.130.240.790.120.870.150.930.988.248.432.592.650.271.623.763.9623.243.232.871.070.68
2.865.340.511.850.430.090.470.080.470.100.310.050.330.051.191.787.174.021.911.070.161.136.415.8912.965.814.231.140.64
4.126.420.602.200.530.100.540.090.510.100.330.050.350.062.281.5210.246.722.941.930.291.083.486.8316.017.984.901.250.57
4.076.460.712.650.550.130.600.100.580.120.400.060.430.071.427.375.680.772.710.370.060.5617.766.1016.946.394.631.120.71
3.997.680.782.920.650.110.700.130.710.140.450.060.450.071.240.9510.7011.212.852.980.303.143.335.9018.846.023.881.260.49
25.3542.654.1815.862.930.432.530.401.850.371.130.171.240.202.922.0724.4311.7814.927.190.292.553.5111.5699.2813.865.441.660.49
25.5039.733.6613.242.420.282.130.311.450.280.870.140.940.156.091.3212.169.2218.0013.651.211.660.8313.4590.8018.166.561.840.38
35.9372.187.4828.224.990.613.860.471.900.361.120.171.200.197.401.2012.7610.6325.6621.371.502.450.6716.08158.6620.314.532.610.42

136
RAMACHANDRAN et al. / Turkish J Earth Sci
tectonic activity and climatic conditions in the source area. In this study, most of the samples show moderate to high CIA values, which are interpreted to reflect a steady state of weathering, probably under tropical to subtropical conditions (Nesbitt et al., 1997).
Sedimentary recycling can be identified using Rb/Sr ratios, where Sr easily leaches compared to Rb and this leads to a significant increase in the Rb/Sr ratio, and high ratios have been interpreted to be indicators of strong weathering and sediment recycling (McLennan et al., 1993). The Rb/Sr ratios of the basal arenite, lower conglomerate, and quartz arenites (0.33 to 1.62, 1.66 to 3.73, and 2.31 to 4.39, respectively) are higher than the average PAAS value (0.80; Taylor and McLennan, 1985). The high CIA values and Rb/Sr ratios suggest moderate to intense weathering in the source region.5.2. Hydraulic sortingHydraulic sorting might lead to a significant difference in REE concentrations in sediments and sedimentary rocks with different mineral contents and grain-sized variations (e.g., Cullers et al., 1975, 1979; Gromet et al., 1984; McLennan, 1989; Singh, 2009; Wu et al., 2013).
The ΣREE content in the clastic rocks is affected by size sorting, and the ΣREE content decreases steadily with an increase in grain size (Cullers and Stone, 1991). Three major factors associated with sedimentary sorting that affect REE patterns in clastic rocks are grain size contrast, general mineralogy, and heavy mineral fractionation. A strong assumption about the sorting processes during sedimentation is that fine-grained sediments tend to have a relative abundance of REE, as found in their source region (Haskin et al., 1966; McCulloch and Wasserburg, 1978; McLennan and Taylor, 1982; McLennan et al., 1990; Cullers, 1995).
In the present study, different lithologies show large variations in ΣREE content that might be due to either grain size variations or the inclusion of heavy mineral fractions. The sedimentary rocks studied show large variations in grain size; for example, conglomerate samples show coarse-grained sediments, whereas arenites show fine- to medium-grained fractions. If the observed variations in ΣREE contents in these sedimentary rocks are largely due to grain-size variations, then the conglomerate
Table 4. (Continued).
Lithology Lower conglomerate Basal arenite SchistDepth (m) 127.8 150.2 157.5 162.35 168 171.45 177.1 181.4 185 188.65 200.65 222.45LaCePrNdSmEuGdTbDyHoErTmYbLuTh/ULa/ThLa/CoTh/CoLa/ScTh/ScTh/CrRb/SrCr/ThSLREE/SHREESREE(La/Yb)cn(La/Sm)cn(Gd/Yb)cnEu/Eu*
11.4716.861.726.321.220.341.180.191.030.200.650.100.720.125.911.117.256.557.656.910.841.831.198.9642.1410.735.941.320.88
2.405.400.622.480.630.210.650.120.670.130.420.060.420.073.020.663.405.201.842.810.412.192.464.5614.273.842.381.240.99
7.6312.001.234.530.840.260.770.120.650.130.410.070.450.085.551.515.093.375.093.370.392.482.589.8129.1611.425.721.370.99
6.928.170.692.250.560.230.750.150.960.210.660.100.670.110.851.172.011.724.734.040.103.739.695.1422.466.947.730.901.10
9.3520.772.168.011.440.411.280.211.100.230.740.110.790.123.991.180.780.666.245.280.191.935.339.1346.718.044.101.310.92
6.6812.131.184.220.790.260.790.130.710.150.510.080.560.093.321.651.000.614.772.900.132.317.608.2928.288.045.291.141.02
15.1127.952.9711.402.360.682.610.502.860.591.930.292.040.323.110.940.730.781.541.650.214.394.885.3771.605.014.031.040.83
16.2031.133.0411.672.250.542.160.422.480.551.880.292.060.324.401.940.550.282.721.400.143.427.176.3374.985.314.530.850.75
1.432.900.331.120.280.110.300.060.430.100.340.050.340.063.031.400.060.041.020.730.112.699.123.617.842.843.260.721.13
74.88155.2319.4287.0816.534.6714.792.3110.602.015.760.775.200.773.4016.921.180.074.290.250.450.192.248.37400.029.742.852.310.91
37.4471.037.2727.855.081.234.670.814.390.943.000.463.270.503.212.320.950.411.950.840.100.6010.068.24167.947.734.641.160.77
16.4531.773.3113.322.650.762.720.462.450.501.540.221.580.233.972.231.270.571.850.830.090.4410.966.9577.987.033.901.390.86

137
RAMACHANDRAN et al. / Turkish J Earth Sci
100 100
10
hond
rite
10
hond
rite
a
Quartz arenite
cBasal arenite
0 1
1
Roc
k ch
0 1
1
Roc
k ch
1000
0.1La Ce Pr Nd Sm Eu Gd Tb Dy Ho Er Tm Yb Lu
Elements
0.1La Ce Pr Nd Sm Eu Gd Tb Dy Ho Er Tm Yb Lu
Elements
1000
10
100100
hond
rite
b dSchistLower conglomerate
0 1
1
10
Roc
k ch
ondr
ite
10R
ock
ch
0.1La Ce Pr Nd Sm Eu Gd Tb Dy Ho Er Tm Yb Lu
Elements
1La Ce Pr Nd Sm Eu Gd Tb Dy Ho Er Tm Yb Lu
Elements
A
CN K
Kaolinite, Gibbsite, Chlorite
Illite
Muscovite
K-FeldsparPlagioclase
Smectite
Quartz AreniteLower ConglomerateBasal AreniteUCCGraniteGranodioritePeninsular GneissBasalt
Schist
Feldspar join
CIA
10
20
30
40
50
60
70
80
90
100
0
123
4
5
Figure 8. A-CN-K diagram showing the weathering trend of the Kerur Formation (after Nesbitt and Young, 1982). A: Al2O3; CN: CaO* + Na2O; K: K2O (molecular proportions). Trend lines 1–5: weathering trends; UCC and basalt data from Condie (1993); peninsular gneiss: Allen (1985); granite and granodiorite: Jayananda (2000); schist: present study.
Figure 7. a) Chondrite-normalized REE patterns for quartz arenite samples, b) chondrite-normalized REE patterns for lower conglomerate of the Kerur Formation, c) chondrite-normalized REE patterns for basal arenite, d) chondrite-normalized REE patterns for basement schist rock.

138
RAMACHANDRAN et al. / Turkish J Earth Sci
units should show lower ΣREE content than the arenites, but many conglomerate samples show elevated ΣREE content compared to the fine-grained lithologies. As such, the variations in ΣREE content in these litho-units might not be due to grain-size variations. The inclusions of small portions of heavy minerals can drastically change the ΣREE contents in the sedimentary rocks. Thus, the sedimentary rocks studied indicate the presence of various proportions of heavy minerals (zircon, tourmaline, rutile, garnet, magnetite, and ilmenite). The petrographic study of conglomerate and quartz arenite samples reveals the presence of heavy minerals in them.
Cox et al. (1995) proposed a new formula, the ICV, to understand the geochemical variability due to hydraulic sorting. Rock-forming minerals such as k-feldspars, plagioclase, amphiboles, and pyroxenes display higher ICV values (>0.84), whereas alteration products such as kaolinite, illite, and muscovite show lower values (<0.84; Cox et al., 1995; Cullers, 2000). For the Kerur Formation, the ICV values vary between 0.26 and 1.44. For each lithology the ICV values vary as follows: basal arenite (0.75–1.44), lower conglomerate (0.30–1.34), and quartz arenite (0.26–1.37), indicating that these rocks contain unequal proportions of both clay minerals and nonclay silicate minerals.
A statistically significant positive correlation of Zr with Yb (r = 0.72, r = 0.95, r = 0.99, respectively) and HREEs (r = 0.80, r = 0.89, r = 0.99, respectively) for the basal arenite, lower conglomerate, and quartz arenite suggests that the HREE fractionation is controlled mainly by the concentration of zircon mineral. The basal arenite, lower conglomerate, and quartz arenite show wide variations in Zr and Hf contents. McLennan et al. (1993) observed that the Th/Sc ratio is a sensitive index of the bulk composition of the provenance, and the Zr/Sc ratio is a useful index of zircon enrichment. In the Zr/Sc versus Th/Sc diagram (Figure 9), the samples are plotted to identify the role of heavy mineral concentrations during sediment sorting. In this diagram (Figure 9), the studied samples display two compositional trends with some samples plotting along Trend 1, which is indicative of a minimal influence of mineral sorting. Samples plotting along Trend 2 are indicative of zircon enrichment by sediment recycling and sorting. This suggests that the geochemical compositions of lower conglomerate and quartz arenite are exaggerated by sorting effects. 5.3. ProvenanceThe geochemical signatures of clastic sediments have been used to determine provenance (Taylor and McLennan, 1985; Cullers, 1995; Madhavaraju and Ramasamy, 2002; Armstrong-Altrin et al., 2004, 2013; Al-Juboury and Al-Hadidy, 2009; Perri et al., 2011; Shadan and Hosseini-Barzi, 2013; Madhavaraju, 2015). Elements concentrated
in mafic (Sc, Cr, and Co) and in silicic (La, Th, and REE) sediments, REE patterns, and the size of the Eu anomaly have been used widely to understand the provenance signatures’ interpretation (e.g., Shynu et al., 2011). REEs and certain trace elements (Th, Sc, and Cr) can provide an insight into the provenance and are thus useful to constrain the average source-area composition (e.g., Taylor and McLennan, 1985; Floyd et al., 1989; McLennan et al., 1993; Fedo et al., 1996; Cullers and Berendsen, 1998).
Al2O3/TiO2 ratios in clastic sediments can be used to identify the source rock composition (Garcia et al., 1994; Andersson et al., 2004). The Al in igneous rocks resides mostly in feldspars and Ti in mafic minerals (e.g., olivine, pyroxene, hornblende, biotite, and ilmenite) and the Al2O3/TiO2 ratios increase from 3 to 8 in mafic igneous rocks, from 8 to 21 in intermediate igneous rocks, and from 21 to 70 in felsic igneous rocks (Hayashi et al., 1997). In general, the variation in the Al2O3/TiO2 ratio (12 to 252) suggests that the samples were derived from intermediate to felsic source rocks. However, two samples from lower conglomerate and two samples from quartz arenite show a low Al2O3/TiO2 ratio (Table 2), which may be due to increasing sediment maturity and/or the presence of a significant amount of TiO2-rich minerals (ilmenite, anatase, brookite, and rutile).
The abundance of Cr and Ni in siliciclastic sediments is considered as a useful indicator in provenance studies. The higher concentration of Cr and Ni (Cr: >150 ppm, Ni: >100 ppm) and low ratios of Cr/Ni (1.3–1.5) suggest the ultramafic signatures of the source rocks (Garver et al., 1996). In the present study, the samples studied show low Cr and Ni content (Cr: 9.00–92.39 ppm, Ni: 1.8–49.55 ppm) when compared with ultramafic source rocks. In addition, they also show wide variations in the Cr/Th ratio, which ranges from 0.67 to 24.88, with an average of 7.11. The Cr and Ni contents and Cr/Th ratio observed in the sedimentary rocks strongly support the felsic nature of
1000Quartz Arenite Lower Conglomerate
10
100
h/Sc
Quartz Arenite Lower ConglomerateBasal Arenite
0 1
1
Th
0.1000100101
Zr/Sc
Figure 9. Zr/Sc vs. Th/Sc bivariate diagram (McLennan et al., 1993).

139
RAMACHANDRAN et al. / Turkish J Earth Sci
the source rocks. In addition, the Cr/V ratio is an index of the enrichment of Cr over the other ferromagnesian trace elements, whereas Y/Ni monitors the general level of ferromagnesian trace elements (Ni) compared to a proxy for HREEs (Y). Mafic sources have high ferromagnesian abundances; such a provenance would result in a decrease in Y/Ni (e.g., Hiscott, 1984; McLennan et al., 1993). The Cr/V vs. Y/Ni diagram (Hiscott, 1984) indicates the lack of mafic detritus input for the studied samples (Figure 10).
The La/Sc versus Th/Co bivariate plot is more useful to understand the source rock information of the clastic rocks (Cullers, 2002). In the present study, most of the samples fall in the felsic field rather than the mafic field, which strongly supports the felsic nature of the source rocks (Figure 11). In addition, La-Th-Sc triangular diagrams can provide information regarding the source rock characteristics (McLennan and Taylor, 1991; Cullers, 2002). In this diagram, most of the samples plot near the granite and granodiorite fields (Figure 12), suggesting that the sedimentary rocks were mainly derived from the granite and granodioritic rocks of the source region.
The REE patterns and the size of the Eu anomalies in the sediments provide useful information regarding source rock characteristics (Taylor and McLennan, 1985), since mafic igneous rocks have low LREE/HREE ratios and little or no negative Eu anomalies, whereas felsic igneous rocks have higher LREE/HREE ratios and negative Eu anomalies (Cullers, 1994a, 1994b). In the present study, most of the sedimentary rocks show higher LREE/HREE ratios and negative Eu anomalies, whereas few samples show a positive Eu anomaly, which suggests the felsic nature of the source rocks. The low positive Eu anomaly in few samples is likely due to inclusion of more feldspar in these samples.
Elemental ratios such as La/Sc, Th/Sc, La/Co, Th/Co, Th/Cr, Cr/Th, and Eu/Eu* show remarkable variations in felsic and mafic rocks, which are highly useful in unravelling the provenance signatures of the sedimentary
rocks (Wronkiewicz and Condie, 1987, 1989, 1990; Cullers et al., 1988; Cullers, 1994b, 1995; Cox et al., 1995; Armstrong-Altrin et al., 2004; Nagarajan et al., 2007a, 2007b, 2011; Madhavaraju and Lee, 2009, 2010; Madhavaraju et al., 2010, 2015). The La/Sc, La/Co, Th/Co, Th/Cr, Cr/Th, and Th/Sc ratios of the sedimentary rocks in this study have been compared with felsic and mafic rocks (fine fraction) and UCC values (Table 5) to discover the source rock characteristics. It suggests that these rocks were derived from felsic source rocks.
The intracratonic Kaladgi basin had considerable asymmetry between the northern and southern margins in terms of source composition and tectonics (Dey et al., 2009). During the initial stage, the northern part of the basin received more arkosic sediments from K-rich granitoids, whereas the southern part received highly weathered source materials from Archaean K-rich
2
4
6
8
10Quartz arenite Lower ConglomerateBasal arenite SchistGranite UCCGranodiorite
Ultramafic
Cr/
V
00 0.5 1 1.5 2 2.5 3 3.5 4
Y/Ni
0.01 0.10 1.00 10.00
La/Sc
0.01
0.10
1.00
10.00
Th/C
o
Silicic rocks
Basic rocks
Quartz arenite Lower conglomerate Basal arenite
La
Th Sc
Granodiorite Granite Basalt
Quartz arenite Lower conglomerate Basal arenite
Figure 10. Y/Ni vs. Cr/V bivariate plot. Figure 12. La-Th-Sc diagram. The values of granite, granodiorite, and basalt after Condie (1993).
Figure 11. La/Sc vs. Th/Co bivariate plot (after Cullers, 2002).
140
RAMACHANDRAN et al. / Turkish J Earth Sci
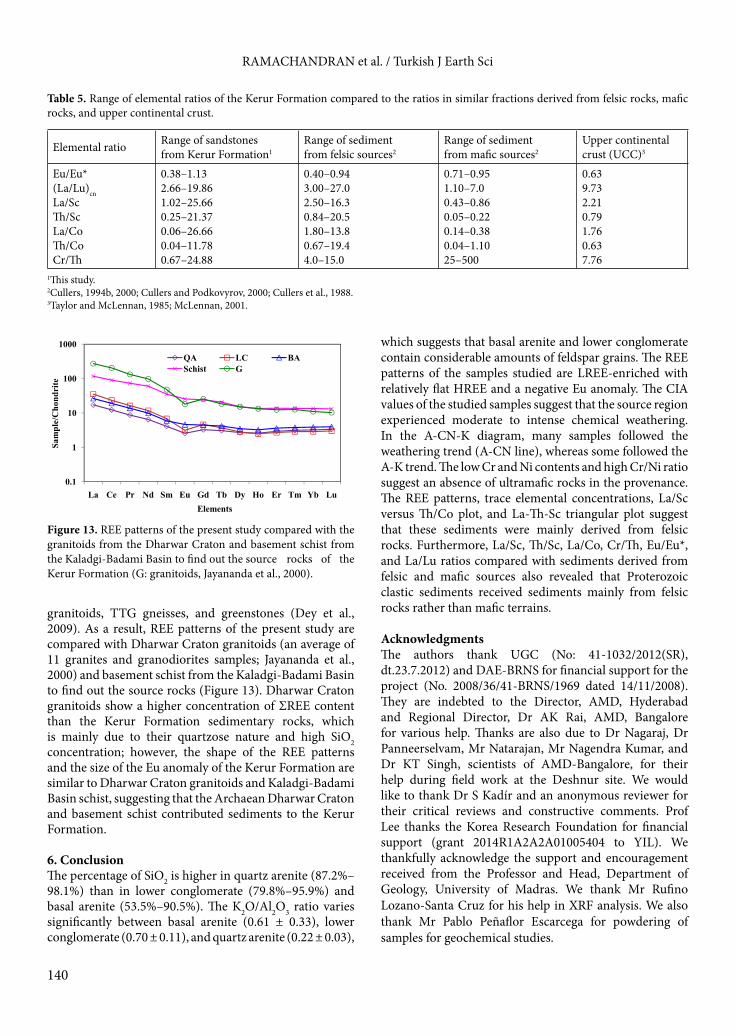
granitoids, TTG gneisses, and greenstones (Dey et al., 2009). As a result, REE patterns of the present study are compared with Dharwar Craton granitoids (an average of 11 granites and granodiorites samples; Jayananda et al., 2000) and basement schist from the Kaladgi-Badami Basin to find out the source rocks (Figure 13). Dharwar Craton granitoids show a higher concentration of ΣREE content than the Kerur Formation sedimentary rocks, which is mainly due to their quartzose nature and high SiO2 concentration; however, the shape of the REE patterns and the size of the Eu anomaly of the Kerur Formation are similar to Dharwar Craton granitoids and Kaladgi-Badami Basin schist, suggesting that the Archaean Dharwar Craton and basement schist contributed sediments to the Kerur Formation.
6. ConclusionThe percentage of SiO2 is higher in quartz arenite (87.2%–98.1%) than in lower conglomerate (79.8%–95.9%) and basal arenite (53.5%–90.5%). The K2O/Al2O3 ratio varies significantly between basal arenite (0.61 ± 0.33), lower conglomerate (0.70 ± 0.11), and quartz arenite (0.22 ± 0.03),
which suggests that basal arenite and lower conglomerate contain considerable amounts of feldspar grains. The REE patterns of the samples studied are LREE-enriched with relatively flat HREE and a negative Eu anomaly. The CIA values of the studied samples suggest that the source region experienced moderate to intense chemical weathering. In the A-CN-K diagram, many samples followed the weathering trend (A-CN line), whereas some followed the A-K trend. The low Cr and Ni contents and high Cr/Ni ratio suggest an absence of ultramafic rocks in the provenance. The REE patterns, trace elemental concentrations, La/Sc versus Th/Co plot, and La-Th-Sc triangular plot suggest that these sediments were mainly derived from felsic rocks. Furthermore, La/Sc, Th/Sc, La/Co, Cr/Th, Eu/Eu*, and La/Lu ratios compared with sediments derived from felsic and mafic sources also revealed that Proterozoic clastic sediments received sediments mainly from felsic rocks rather than mafic terrains.
AcknowledgmentsThe authors thank UGC (No: 41-1032/2012(SR), dt.23.7.2012) and DAE-BRNS for financial support for the project (No. 2008/36/41-BRNS/1969 dated 14/11/2008). They are indebted to the Director, AMD, Hyderabad and Regional Director, Dr AK Rai, AMD, Bangalore for various help. Thanks are also due to Dr Nagaraj, Dr Panneerselvam, Mr Natarajan, Mr Nagendra Kumar, and Dr KT Singh, scientists of AMD-Bangalore, for their help during field work at the Deshnur site. We would like to thank Dr S Kadír and an anonymous reviewer for their critical reviews and constructive comments. Prof Lee thanks the Korea Research Foundation for financial support (grant 2014R1A2A2A01005404 to YIL). We thankfully acknowledge the support and encouragement received from the Professor and Head, Department of Geology, University of Madras. We thank Mr Rufino Lozano-Santa Cruz for his help in XRF analysis. We also thank Mr Pablo Peñaflor Escarcega for powdering of samples for geochemical studies.
Table 5. Range of elemental ratios of the Kerur Formation compared to the ratios in similar fractions derived from felsic rocks, mafic rocks, and upper continental crust.
Elemental ratio Range of sandstonesfrom Kerur Formation1
Range of sediment from felsic sources2
Range of sediment from mafic sources2
Upper continental crust (UCC)3
Eu/Eu*(La/Lu)cnLa/ScTh/ScLa/CoTh/CoCr/Th
0.38–1.132.66–19.861.02–25.660.25–21.370.06–26.660.04–11.780.67–24.88
0.40–0.943.00–27.02.50–16.30.84–20.51.80–13.80.67–19.44.0–15.0
0.71–0.951.10–7.00.43–0.860.05–0.220.14–0.380.04–1.1025–500
0.639.732.210.791.760.637.76
0.1
1
10
100
1000
La Ce Pr Nd Sm Eu Gd Tb Dy Ho Er Tm Yb Lu
QA LC BASchist G
Elements
Sam
ple/
Cho
ndri
te
Figure 13. REE patterns of the present study compared with the granitoids from the Dharwar Craton and basement schist from the Kaladgi-Badami Basin to find out the source rocks of the Kerur Formation (G: granitoids, Jayananda et al., 2000).
1This study.2Cullers, 1994b, 2000; Cullers and Podkovyrov, 2000; Cullers et al., 1988.3Taylor and McLennan, 1985; McLennan, 2001.

141
RAMACHANDRAN et al. / Turkish J Earth Sci
Al-Juboury AI, Al-Hadidy AH (2009). Petrology and depositional evolution of the Palaeozoic rocks of Iraq. Mar Petrol Geol 26: 208–231.
Allen P (1985). The geochemistry of the Amphibolite-Granulite facies transition in Central South India (unpublished Ph.D thesis). New Mexico Institute of Mining and Technology, Socorro, NM, USA.
Andersson POD, Worden RH, Hodgson DM, Flint S (2004). Provenance evolution and chemostratigraphy of a Palaeozoic submarine fan-complex: Tanqua Karoo Basin, South Africa. Mar Petrol Geol 21: 555–577.
Armstrong-Altrin JS, Lee YI, Verma SP, Ramasamy S (2004). Geochemistry of sandstones from the upper Miocene Kudankulam Formation, southern India: implications for provenance, weathering, and tectonic setting. J Sediment Res 74: 285–297.
Armstrong-Altrin JS, Nagarajan R, Lee YI, Kasper-Zubillaga JJ, Córdoba-Saldaña LP (2014). Geochemistry of sands along the San Nicolas and San Carlos beaches, Gulf of California Mexico: implications for provenance and tectonic setting. Turkish J Earth Sci 23: 533–558.
Armstrong-Altrin JS, Nagarajan R, Madhavaraju J, Rosalez-Hoz L, Lee YI, Balaram V, Cruz-Martinez A, Avila-Ramirez G (2013). Geochemistry of the Jurassic and upper Cretaceous shales from the Molango Region, Hidalgo, Eastern Mexico: Implications of source-area weathering, provenance, and tectonic setting. CR Geosci 345: 185–202.
Bhatia M, Crook KAW (1986). Trace element characteristics of graywackes and tectonic setting discrimination of sedimentary Basin. Contrib Mineral Pet 92: 181–193.
Blatt HG, Middleton GV, Murray RC (1980). Origin of Sedimentary Rocks. 2nd ed. Upper Saddle River, NJ, USA: Prentice Hall.
Colin C, Turpin L, Bertaux J, Desprairies A, Kissel C (1999). Erosional history of the Himalayan and Burman ranges during the last two glacial-interglacial cycles. Earth Planet Sci Lett 171: 647–660.
Concepcion RAB, Dimalanta CB, Yumul GP, Faustino-Eslava DV, Queano KL, Tamayo RA, Imai A (2012). Petrography, geochemistry, and tectonics of a rifted fragment of Mainland Asia: evidence from the Lasala Formation, Mindoro Island, Philippines. Int J Earth Sci 101: 273–290.
Condie KC (1993). Chemical composition and evolution of upper continental crust: Contrasting results from surface samples and shales. Chem Geol 104: 1–37.
Cox R, Lowe DR (1995a). A conceptual review of regional scale controls on the composition of clastic sediment and the co-evolution of continental blocks and their sedimentary cover. J Sediment Res 65: 1–12.
Cox R, Lowe DR (1995b). Compositional evolution of coarse elastic sediments in the south United States from 1.8 to 0.2 G.A. and implications for relationship between the development of crustal blocks and their sedimentary cover. J Sediment Res 65: 477–494.
Cullers RL (1994a). The chemical signature of source rocks in size fraction of Holocene stream sediment derived from metamorphic rocks in the Wet Mountains region, USA. Chem Geol 113: 327–343.
Cullers RL (1994b). The controls on the major and trace element variation of shales, siltstones and sandstones of Pennsylvanian-Permian age from uplifted continental blocks in Colorado to platform sediment in Kansas, USA. Geochim Cosmochim Ac 58: 4955–4972.
Cullers RL (1995). The controls on the major and trace element evolution of shales, siltstones and sandstones of Ordovician to Tertiary age in the Wet Mountain region, Colorado, USA. Chem Geol 123: 107–131.
Cullers RL (2000). The geochemistry of shales, siltstones and sandstones of Pennsylvanian-Permian age, Colorado, U.S.A.: implications for provenance and metamorphic studies. Lithos 51: 181–203.
Cullers RL (2002). Implications of elemental concentrations for provenance, redox conditions, and metamorphic studies of shales and limestones near Pueblo, CO, USA. Chem Geol 191: 305–327.
Cullers RL, Basu A, Suttner LJ (1988). Geochemical signature of provenance in sand-size material in soils and stream sediments near the Tobacco Root batholith, Montana, USA. Chem Geol 70: 335–348.
Cullers RL, Berendsen P (1998). The provenance and chemical variation of sandstones associated with the mid-continent rift system, USA. Eur J Mineral 10: 987–1002.
Cullers RL, Chaudhuri S, Arnold B, Lee M, Wolf CW (1975). Rare-earth distributions in clay minerals and clay-sized fractions of Lower Permian Havensville and Eskridge shales of Kansas and Oklahoma. Geochim Cosmochim Ac 39: 1691–1703.
Cullers RL, Podkovyrov VN (2000). Geochemistry of the Mesoproterozoic Lakhanda shales in southeastern Yakutia, Russia: implications for mineralogical and provenance control, and recycling. Precamb Res 104: 77–93.
Cullers RL, Stone J (1991). Chemical and mineralogical comparison of the Pennsylvanian Mountain, Colorado, U.S.A. (an uplifted continental block) to sedimentary rocks from other tectonic environments. Lithos 27: 115–131.
Degens ET (1965). Geochemistry of Sediments. Upper Saddle River, NJ, USA: Prentice Hall.
Descourvieres C, Douglas G, Leyland L, Hartog N, Prommer H (2011). Geochemical reconstruction of the provenance, weathering and deposition of detrital-dominated sediments in the Perth Basin: the Cretaceous Leederville Formation, south-west Australia. Sediment Geol 236: 62–76.
Dostal J, Keppie JD (2009). Geochemistry of low-grade clastic rocks in the Acatlan Complex of southern Mexico: evidence for local provenance in felsic-intermediate igneous rocks. Sediment Geol 222: 241–253.
References

142
RAMACHANDRAN et al. / Turkish J Earth Sci
Eggins SM, Woodhead JD, Kinsley LPJ, Mortimer GE, Sylvester P, McCulloch MT, Hergt JM, Handler MR (1997). A simple method for the precise determination of ≥ 40 trace elements in geological samples by ICPMS using enriched isotope internal standardization. Chem Geol 134: 311–326.
Eriksson KA, Taylor SR, Korsch RJ (1992). Geochemistry of 1.8-1.67 Ga mudstones and siltstones from the Mount Isa Inlier, Queensland, Australia: provenance and tectonic implications. Geochim Cosmochim Ac 56: 899–909.
Ernst W (1970). Geochemical Facies Analysis. Amsterdam, the Netherlands: Elsevier.
Fedo CM, Eriksson KA, Krogstad EG (1996). Stratigraphic framework of the ~3.0 Ga Buhwa greenstone belt: a unique stable shelf succession in the Zimbabwe Archean craton. Precamb Res 77: 161–178.
Fedo CM, Nesbitt HW, Young GM (1995). Unraveling the effects of potassium metasomatism in sedimentary rocks and paleosols, with implications for paleoweathering conditions and provenance. Geology 23: 921–924.
Floyd PA, Shail R, Leveridge BE, Franke W (1991). Geochemistry and provenance of Rhenohercynian synorogenic sandstones: implications for tectonic environment discrimination. Geol Soc Spec Publ 57: 173–188.
Fralic PW, Kronberg BL (1997). Geochemical discrimination of clastic sedimentary rock sources. Sediment Geol 113: 111–124.
Garcia D, Fonteilles M, Moutte J (1994). Sedimentary fractionations between Al, Ti, and Zr, and the genesis of strongly peraluminous granites. J Geol 102: 411–422.
Garver JI, Royce PR, Smick TA (1996). Chromium and nickel in shale of the Taconic Foreland: a case study for the provenance of fine-grained sediments with an ultramafic source. J Sediment Res 66: 100–106.
Govindaraju K (1994). Compilation of working values and sample description for 383 standard reference materials. Geostand Newslett 18: 331.
Göz E, Kadir S, Gürel A, Ern M (2014). Geology, mineralogy, geochemistry, and depositional environment of a Late Miocene/Pliocene fluviolacustrine succession, Cappadocian Volcanic Province, central Anatolia, Turkey. Turkish J Earth Sci 23: 386–411.
Gromet LP, Dymek RF, Haskin LA, Korotev RL (1984). The North American shale composite: its compilation, major and trace element characteristics. Geochim Cosmochim Ac 48: 2469–2482.
Grout FF (1925). Relation of texture and composition of clays. Geol Soc Amer Bull 36: 393–416.
Gupta S, Banerjee R, Babu PVR, Parihar PS, Maithani PB (2012). Geochemistry of uraniferous Banganapalle sediments in the western part of Palnad Sub-basin, Andhra Pradesh: implications on provenance and paleo-weathering. Gondwana Geol Mag Spec 13: 1–14.
Gürel A, Kadir S (2010). Palaeoenvironmental approach to the geology, mineralogy and geochemistry of an Early Miocene alluvial-fan to cyclic shallow-lacustrine depositional system in the Aktoprak Basin (central Anatolia), Turkey. Clay Min 45: 51–75.
Harnois L (1988). The CIW index: a new chemical index of weathering. Sediment Geol 55: 319–322.
Haskin LA, Wildman RT, Frey FA, Collins KA, Keedy CR, Haskin MA (1966). Rare earths in sediments. J Geophy Res 71: 6091–6105.
Hayashi KI, Fujisawa H, Holland HD, Ohmoto H (1997). Geochemistry of ~1.9 Ga sedimentary rocks from Northeastern Labrador, Canada. Geochim Cosmochim Ac 61: 4115–4137.
Herron MM (1988). Geochemical classification of terrigenous sands and shales from core or log data. J Sediment Pet 58: 820–829.
Hiscott RN (1984) Ophiolitic source rocks for Taconic-age flysch: trace element evidence. Geol Soc Am 95: 1261–1267.
Jacobson AD, Blum JD, Chamberlian CP, Craw D, Koons PO (2003). Climate and tectonic controls on chemical weathering in the New Zealand Southern Alps. Geochim Cosmochim Ac 37: 29–46.
Jayananda M, Moyen JF, Martin H, Peucat JJ, Auvray B, Mahabaleswar B (2000). Late Archaean (2550-2520 Ma) juvenile magmatism in the Eastern Dharwar craton, Southern India: constraints from geochronology, Nd-Sr isotopes and whole rock geochemistry. Precamb Res 99: 225–254.
Jayaprakash AV, Sundaram V, Hans SK, Mishra RN (1987). Geology of the Kaladgi-Badami Basin. Purana Basins of Peninsular India (Middle to Late Proterozoic). Mem Geol Soc India 6: 201–226.
Johnsson MJ (1988). First-cycle quartz arenites in the Orinoco river basin, Venezuela and Colombia. J Geol 96: 263–277.
Jung HS, Lim D, Choi JC, Yoo HS, Rho KC, Lee HB (2012). Rare earth element compositions of core sediments from the shelf of the south Sea, Korea: their controls and origins. Cont Shelf Res 48: 75–86.
Kadir S, Gürel A, Külah T (2013). Geology of Late Miocene clayey sediments and distribution of palaeosol clay minerals in the north-eastern part of the Cappadocian Volcanic Province (Araph-Erdemli), central Anatolia, Turkey. Turkish J Earth Sci 22: 427–443.
Külah T, Kadir S, Gürel A, Eren M, Önalgil N (2014). Mineralogy, geochemistry and genesis of mudstones in the Upper Miocene Mustafapaşa member of the Ürgüp Formation in the Cappadocia region, central Anatolia, Turkey. Clays Clay Min 62: 267–285.
Madhavaraju J (2015). Geochemistry of Late Cretaceous sedimentary rocks of the Cauvery Basin, South India: constraints on paleoweathering, provenance and end Cretaceous environments. In: Ramkumar, M, editor. Chemostratigraphy: Concepts, Techniques and Applications. 1st ed. Elsevier, the Netherlands, pp. 185–214.
Madhavaraju J, González-León CM (2012). Depositional conditions and source of rare earth elements in carbonate strata of the Aptian-Albian Mural Formation, Pitaycachi section, northeastern Sonora, Mexico. Rev Mex Cien Geol 29: 478–491.
Madhavaraju J, González-León CM, Lee YI, Armstrong-Altrin JS, Reyes Campero LM (2010). Geochemistry of the Mural Formation (Aptian-Albian) of the Bisbee Group, Northern Sonora, Mexico. Cre Res 31: 400–414.
143
RAMACHANDRAN et al. / Turkish J Earth Sci
Madhavaraju J, Lee YI (2010). Influence of Deccan volcanism in the sedimentary rocks of Late Maastrichtian-Danian age of Cauvery basin Southeastern India: constraints from geochemistry. Current Sci 98: 528–537.
Madhavaraju J, Lee YI (2009). Geochemistry of the Dalmiapuram Formation of the Uttatur Group (Early Cretaceous), Cauvery basin, southeastern India: implications on provenance and paleo-redox conditions. Rev Mex Cien Geol 26: 380–394.
Madhavaraju J, Löser H, Lee YI, Lozano Santacruz R, Pi-Puig T (2015). Geochemistry of Lower Cretaceous limestones of the Alisitos Formation, Baja California, México: implications for REE source and paleo-redox conditions. J South Amer Earth Sci (in press).
Madhavaraju J, Ramasamy S (2001). Clay mineral assemblages and rare earth element distribution in the sediments of Ariyalur Group, Tiruchirapalli District, Tamil Nadu- Implication for paleoclimate. J Geol Soc India 58: 69–77.
Madhavaraju J, Ramasamy S (2002). Petrography and geochemistry of Late Maastrichtian-Early Paleocene sediments of Tiruchirapalli Cretaceous, Tamil Nadu – Paleoweathering and provenance implications. J Geol Soc India 59: 133–142.
Madhavaraju J, Ramasamy S, Mohan SP, Hussain SM, Gladwin Gnana Asir N, Stephen Pitchaimani V (2004). Petrography and surface textures on quartz grains of Nimar Sandstone, Bagh Beds, Madhya Pradesh - implications on provenance and depositional environments. J Geol Soc India 64: 747–762.
Maynard JB, Valloni R, Yu H (1982). Composition of modern deep sea sands from arc-related basins. Geol Soc Spec Publ 10: 551–561.
McCulloch MT, Wasserburg GJ (1978). Sm-Nd and Rb-Sr chronology of continental crust formation. Science 200: 1003–1011.
McLennan SM (1989). Rare earth elements in sedimentary rocks: influences of provenance and sedimentary processes. In: Lipin BR, McKay GA, editors. Geochemistry and Mineralogy of Rare Earth Elements. Reviews in Mineralogy, Vol. 21. Chantilly, VA, USA: Mineralogical Society of America, pp. 169–200.
McLennan SM (2001). Relationships between the trace element composition of sedimentary rocks and upper continental crust. Geochem Geophys Geosyst 2: 2000GC000109.
McLennan SM, Bock B, Hemming SR, Hurowitz JA, Lev SM, McDaniel DK (2004). The roles of provenance and sedimentary processes in the geochemistry of sedimentary rocks. In: Lentz DR, editors. Geochemistry of Sediments and Sedimentary Rocks: Evolutionary Considerations to Mineral Deposit-Forming Environments. St. John’s, NL, Canada: Geological Association of Canada, GeoText.
McLennan SM, Hemming S, McDaniel DK, Hanson GN (1993). Geochemical approaches to sedimentation, provenance and tectonics. In: Johnsson MJ, Basu A, editors. Processes Controlling the Composition of Clastic Sediments. Special Paper 284. Boulder, CO, USA: Geological Society of America, pp. 21–40.
McLennan SM, Taylor SR (1982). Geochemical constraints on the growth of the continental crust. J Geol 90: 347–361.
McLennan SM, Taylor SR (1991). Sedimentary rocks and crustal evolution: tectonic setting and secular trends. J Geol 99: 1–21.
McLennan SM, Taylor SR, Eriksson KA (1983). Geochemistry of Archaean shales from the Pilbara Supergroup, Western Australia. Geochim Cosmochim Ac 47: 1211–1222.
McLennan SM, Taylor SR, McCulloch MT, Maynard JB (1990). Geochemical and Nd-Sr isotopic composition of deep-sea turbidites: crustal evolution and plate tectonic associations. Geochim Cosmochim Ac 54: 2015–2050.
Mishra M, Sen S (2012). Provenance, tectonic setting and source-area weathering of Mesoproterozoic Kaimur Group, Vindhyan Supergroup, Central India. Geol Acta 10: 283–293.
Moosavirad SM, Janardhana MR, Sethumadhav MS, Narasimha KNP (2012). Geochemistry of Lower Jurassic sandstones of Shemshak Formation, Kerman Basin, Central Iran: provenance, source weathering and tectonic setting. J Geol Soc India 79: 483–496.
Nagarajan R, Armstrong-Altrin JS, Nagendra R, Madhavaraju J, Moutte J (2007a). Petrography and geochemistry of terrigenous sedimentary rocks in the Neoproterozoic Rabanpalli Formation, Bhima Basin, southern India: implications for paleoweathering condition, provenance, and source rock composition. J Geol Soc India 70: 297–312.
Nagarajan R, Madhavaraju J, Armstrong-Altrin JS, Nagendra R (2011). Geochemistry of Neoproterozoic limestones of the Shahabad Formation, Bhima Basin, Karnataka, southern India. Geosci J 15: 9–25.
Nagarajan R, Madhavaraju J, Nagendra R, Armstrong-Altrin JS, Moutte J (2007b). Geochemistry of Neoproterozoic shales of Rabanpalli Formation, Bhima Basin, Northern Karnataka, Southern India: implications for provenance and paleoredox conditions. Rev Mex Cien Geol 24: 150–160.
Nesbitt HW, Fedo CM, Young GM (1997). Quartz and feldspar stability, steady and non-steady-state weathering and petrogenesis of siliciclastic sands and muds. J Geol 105: 173–191.
Nesbitt HW, Markovics G, Price RC (1980). Chemical processes affecting alkalies and alkaline earths during continental weathering. Geochim Cosmochim Ac 44: 1659–1666.
Nesbitt HW, Young GM (1982). Early Proterozoic climates and plate motions inferred from major element chemistry of lutites. Nature 299: 715–717.
Nesbitt HW, Young GM (1984). Prediction of some weathering trends of plutonic and volcanic rocks based on thermodynamic and kinetic considerations. Geochim Cosmochim Ac 48: 1523–1534.
Perri F, Critelli S, Mongelli G, Cullers RL (2011). Sedimentary evolution of the Mesozoic continental redbeds using geochemical and mineralogical tools: the case of Upper Triassic to Lowermost Jurassic Monte di Gioiosa mudrocks (Sicily, southern Italy). Int J Earth Sci 100: 1569–1587.
Ramasamy S, Singh TS, Madhavaraju J, Gladwin Gnana Asir N (2007). Petrography and geochemistry of pre-Ariyalur sequence in Ariyalur District, Tamil Nadu-implication on depositional environment and paleoclimate. J Geol Soc India 69: 121–132.
144
RAMACHANDRAN et al. / Turkish J Earth Sci
Raza M, Ahmad AHM, Khan MS, Khan F (2012). Geochemistry and detrital modes of Proterozoic sedimentary rocks, Bayana Basin, north Delhi fold belt: implications for provenance and source-area weathering. Int Geol Rev 54: 1 111–129.
Roser BP, Cooper RA, Nathan S, Tulloch AJ (1996). Reconnaissance sandstone geochemistry, provenance, and tectonic setting of the lower Paleozoic terranes of the West Coast and Nelson, New Zealand. NZ J Geol Geophy 39: 1–16.
Roser BP, Korsch RJ (1986). Determination of tectonic setting of sandstone-mudstone suites using SiO2 content and K2O/Na2O ratio. J Geol 94: 635–650.
Roser BP, Korsch RJ (1988). Provenance signatures of sandstone-mudstone suites determined using discrimination function analysis of major-element data. Chem Geol 67: 119–139.
Sawyer EW (1986). The influence of source rock type, chemical weathering and sorting on the geochemistry of clastic sediments from the Quetico metasedimentary belt, Superior Province, Canada. Chem Geol 55: 77–95.
Schoenborn WA, Fedo CM (2011). Provenance and paleoweathering reconstruction of the Neoproterozoic Johnnie Formation, southeastern California. Chem Geol 285: 231–255.
Selvaraj K, Chen CTA (2006). Moderate chemical weathering of subtropical Taiwan: constraints from solid-phase geochemistry of sediments and sedimentary rocks. J Geol 14: 101–116.
Shadan M, Hosseini-Barzi M (2013). Petrography and geochemistry of the Ab-e-Haji Formation in central Iran: implications for provenance and tectonic setting in the southern part of the Tabas block. Rev Mex Cien Geol 30: 80–95.
Singh P (2009). Major, trace and REE geochemistry of the Ganga River sediments: influence of provenance and sedimentary processes. Chem Geol 266: 242–255.
Srivastava AK, Randive KR, Khare N (2013). Mineralogical and geochemical studies of glacial sediments from Schirmacher Oasis, East Antarctica. Quatern Int 292: 205–216.
Suttner LJ, Dutta PK (1986). Alluvial sandstone composition and paleoclimate frame work mineralogy. J Sediment Pet 56: 329–345.
Taylor SR, McLennan SM (1985). The Continental Crust: Its Composition and Evolution. Oxford, UK: Blackwell.
Verma SP, Armstrong-Altrin JS (2013). New multi-dimensional diagrams for tectonic discrimination of siliciclastic sediments and their application to Precambrian basins. Chem Geol 355: 117–133.
Wronkiewicz DJ, Condie KC (1987). Geochemistry of Archaean shales form the Witwatersrand Supergroup, South Africa. Source-area weathering and provenance. Geochim Cosmochim Ac 51: 2401–2416.
Wronkiewicz DJ, Condie KC (1989). Geochemistry and provenance of sediments from the Pongola Supergroup, South Africa: evidence for a 3.0 Ga old continental craton. Geochim Cosmochim Ac 53: 537–549.
Wronkiewicz DJ, Condie KC (1990). Geochemistry and mineralogy of sediments from the Ventersdorp and Transvaal Supergroups, South Africa. Cratonic evolution during the early Proterozoic. Geochim Cosmochim Ac 54: 343–354.
Wu W, Zheng H, Xu S, Yang J, Liu W (2013). Trace element geochemistry of riverbed and suspended sediments in the upper Yangtze River. J Geochem Explor 124: 67–78.
Young SM, Pitawala A, Ishiga H (2013). Geochemical characteristics of stream sediments, sediment fractions, soils, and basement rocks from the Mahaweli River and its catchment, Sri Lanka. Chem Erde Geochem 73: 357–371.
Zaid SM, Elbadry O, Ramadan F, Mohamed M (2015). Petrography and geochemistry of Pharaonic sandstone monuments in Tall San Al Hagr, Al Sharqiya Governorate, Egypt: implications for provenance and tectonic setting. Turkish J Earth Sci 24: 344–364.
Zaid SM, Gahtani FA (2015). Provenance, diagenesis, tectonic setting, and geochemistry of Hawkesbury Sandstone (Middle Triassic), southern Sydney Basin, Australia. Turkish J Earth Sci 24: 72–98.
Zhang YL, Wang ZQ, Yan Z, Wan T (2011). Tectonic setting of Neoproterozoic Beiyixi Formation in Quruqtagh area, Xinjiang: evidence from geochemistry of clastic rocks. Acta Petrol Sin 27: 1785–1796.