genomic data quality impacts automated detection … genomic data quality impacts automated...
TRANSCRIPT

INVESTIGATION
Genomic Data Quality Impacts AutomatedDetection of Lateral Gene Transfer in FungiPierre-Yves Dupont and Murray P. Cox1
Statistics and Bioinformatics Group, Institute of Fundamental Sciences and the Bio-Protection Research Centre, MasseyUniversity, Palmerston North 4442, New Zealand
ORCID IDs: 0000-0002-7384-5181 (P.-Y.D.); 0000-0003-1936-0236 (M.P.C.)
ABSTRACT Lateral gene transfer (LGT, also known as horizontal gene transfer), an atypical mechanism oftransferring genes between species, has almost become the default explanation for genes that displayan unexpected composition or phylogeny. Numerous methods of detecting LGT events all rely on twofundamental strategies: primary structure composition or gene tree/species tree comparisons. Discourag-ingly, the results of these different approaches rarely coincide. With the wealth of genome data nowavailable, detection of laterally transferred genes is increasingly being attempted in large uncuratedeukaryotic datasets. However, detection methods depend greatly on the quality of the underlying genomicdata, which are typically complex for eukaryotes. Furthermore, given the automated nature of genomic datacollection, it is typically impractical to manually verify all protein or gene models, orthology predictions, andmultiple sequence alignments, requiring researchers to accept a substantial margin of error in their datasets.Using a test case comprising plant-associated genomes across the fungal kingdom, this study reveals thatcomposition- and phylogeny-based methods have little statistical power to detect laterally transferredgenes. In particular, phylogenetic methods reveal extreme levels of topological variation in fungal genetrees, the vast majority of which show departures from the canonical species tree. Therefore, it is inherentlychallenging to detect LGT events in typical eukaryotic genomes. This finding is in striking contrast to thelarge number of claims for laterally transferred genes in eukaryotic species that routinely appear in theliterature, and questions how many of these proposed examples are statistically well supported.
KEYWORDS
lateral genetransfer
horizontal genetransfer
automateddetectionmethods
comparativegenomics
eukaryotesfungi
LGT (also known as horizontal gene transfer) is an atypical mechanismof transmittinggenes,not fromonegeneration to thenextwithina singlespecies but rather horizontally between different species (Gogarten andTownsend 2005; Keeling and Palmer 2008). Although a less commonmode of inheritance, this process has been known since as early as 1969,when mutations in the galactose operon of Escherichia coli were foundto be caused by the insertion of mobile DNA elements (Shapiro 1969).
Today, substantial evidence has accumulated for LGT in prokaryotes,and LGT has been shown to impose a strong evolutionary force onprokaryotic genomes, including through the transfer of pathogenicity-related genes (Gyles and Boerlin 2014; Kay et al. 2002; Furuya andLowy 2006; Ochman et al. 2000;Martínez 2008). Importantly, however,other studies suggest that the role of LGT in prokaryotes may be over-rated (Galtier 2007). More recent studies have also revealed evidencefor LGT in eukaryotic genomes (Alsmark et al. 2009; Nikolaidis et al.2014; Richards et al. 2009; Soanes and Richards 2014), and in somecases even between species from different kingdoms or domains(Marcet-Houben and Gabaldón 2010; Liu et al. 2011; Monier et al.2009; Richards et al. 2006; Brown 2003). This is despite earlier skepti-cism about the presence or extent of LGT in eukaryotes, likely due to apoor understanding of the molecular mechanisms involved (Sprague1991; Syvanen 1994; Keeling and Palmer 2008). Nevertheless, the extentof LGT in eukaryotes is unknown, and questions are increasingly beingraised over whether it has been overestimated (Danchin 2016). LGT ineukaryotes has been particularly well studied in fungi (Rosewich andKistler 2000; Fitzpatrick 2012; Szöll}osi et al. 2015; Khaldi et al. 2008;
Copyright © 2017 Dupont and Coxdoi: https://doi.org/10.1534/g3.116.038448Manuscript received December 13, 2016; accepted for publication February 17,2017; published Early Online February 23, 2017.This is an open-access article distributed under the terms of the CreativeCommons Attribution 4.0 International License (http://creativecommons.org/licenses/by/4.0/), which permits unrestricted use, distribution, and reproductionin any medium, provided the original work is properly cited.Supplemental material is available online at www.g3journal.org/lookup/suppl/doi:10.1534/g3.116.038448/-/DC1.1Corresponding author: Statistics and Bioinformatics Group, Institute of FundamentalSciences, Massey University, Private Bag 11 222, Palmerston North 4442, NewZealand. E-mail: [email protected]
Volume 7 | April 2017 | 1301
Moran et al. 2012; Ma et al. 2010), with many examples of LGT de-scribed between fungi and their plant hosts (Nikolaidis et al. 2014;Richards et al. 2009; Soanes and Richards 2014). While most earlyLGT studies focused on only one or a few genes, typically relying onextensivemanual annotation, the wealth of genomic data now availableis making whole-genome analyses of potential LGT events possible(Mallet et al. 2010; Wisecaver et al. 2014; Cheeseman et al. 2014; Kuet al. 2015). These analyses rely on two different classes of methods:composition- and phylogeny-based approaches.
Composition-based methods (Cortez et al. 2009; Menigaud et al.2012; Jaron et al. 2014; Rogul et al. 1965; Lawrence and Ochman 1997;Nakamura et al. 2004; Rosewich and Kistler 2000; Marcet-Houben andGabaldón 2010) focus on patterns in the primary structure of genes andgenome sequences, and aim to find genes or genomic regions withcomposition patterns that differ significantly from the rest of the ge-nome. These composition differences are often then attributed to anLGT event. A key advantage of these methods is that they do not re-quire additional information about other organisms outside the studyspecies, including the source species of the LGT event. However, wherethis extra information is available, the composition of the potentiallytransferred gene can be compared with the composition of other ge-nomes to infer a putative origin of the laterally transferred gene(Menigaud et al. 2012). The key disadvantage of these methods is thatthey are sensitive to changes within the genome caused by commonevolutionary features other than LGT, such as repetitive elements, AT-or GC-rich isochores, and pathogenicity or symbiosis islands, all ofwhich display different compositions to the rest of the genome. Incontrast, phylogeny-based methods (Weyenberg et al. 2014; Abbyet al. 2010; Zhaxybayeva 2009; Poptsova 2009) are generally thoughtto be more accurate, especially for detecting transfers between closelyrelated species (Koski et al. 2001; Poptsova and Gogarten 2007;Poptsova 2009). However, thesemethods aremuchmore computation-ally intensive because they require orthology predictions, sequencealignments, and phylogeny reconstructions. They work by detecting agene phylogeny that is statistically different from either the speciesphylogeny and/or the majority of other gene phylogenies. Some use ascoring system to rate phylogenetic events and employ a parsimonyanalysis to infer LGT vs. gene loss/gene duplication (Bansal et al. 2012;Stolzer et al. 2012). Phylogeny-based methods are highly dependent onthe quality of the gene models, multiple sequence alignments, andphylogeny reconstruction (Beiko and Ragan 2009). Unfortunately,the results of different composition- and phylogeny-based methodsgenerally do not overlap (Ragan 2001), leading to growing suspicionabout the accuracy of these results (Than et al. 2007; Danchin 2016),especially since most LGT events could potentially be explained byothermolecular mechanisms (Morel et al. 2015). However, both classesof methods can at least be used to generate hints about potential LGTcases, which might then be confirmed using extensive manual annota-tion in further studies (Ambrose et al. 2014; Cheeseman et al. 2014;Brown 2003).
To exchange geneticmaterial, two speciesmust live close by, oftenin the same environmental niche. Therefore, in this study,we focus onpossible exchanges between plant-associated fungi using the well-studied beneficial fungal endophyte Epichloë festucae as a referencepoint (Dupont et al. 2015; Eaton et al. 2015; Schardl et al. 2013).Plant-associated fungi frequently cooccur, have likely physicallyinteracted over evolutionary timescales, and therefore seem like rea-sonable candidates to have exchanged genes via LGT. Importantly, weuse genome-scale data typical of that available today, with all its variousfaults from automated genome assembly, gene calling, and gene anno-tation. We compare both composition- and phylogeny-based methods
for their ability to detect novel and proposed LGT events in fungi, andreveal new statistical insight into the pitfalls of these methodologies.
MATERIALS AND METHODS
Data descriptionE. festucae gene models were downloaded from the University ofKentucky Endophyte Database (Schardl et al. 2013). Version 6 of theEfM3 protein and gene (transcript) models were used. Sequences forall other fungal and oomycete species used in this analysis weredownloaded from the JGI MycoCosm database (Grigoriev et al.2014). The species were chosen to avoid genus redundancy. Lowerquality genomes were excluded based on sequencing read coverage,number of scaffolds, and sizes of the longest scaffolds, with the exceptionof the endophytes, which were all retained. These species include: sym-biotic endophytic fungi [Daldinia eschscholtzii, Rhodotorula graminis(Firrincieli et al. 2015), Xylona heveae (Gazis et al. 2016)], mycorrhizalfungi [Cenococcum geophilum, Choiromyces venosus, Cortinarius glau-copus, Gyrodon lividus, Hebeloma cylindrosporum (Kohler et al. 2015;Dore et al. 2015), Laccaria bicolor (Martin et al. 2008), Meliniomycesbicolor (Grelet et al. 2009), Oidiodendron maius (Kohler et al. 2015),Paxillus involutus (Kohler et al. 2015), Pisolithus tinctorius (Kohleret al. 2015), Terfezia boudieri, Tuber melanosporum (Martin et al.2010), andWilcoxina mikolae)] and plant pathogens [Bipolaris sorokini-ana (Ohm et al. 2012; Condon et al. 2013), Blumeria graminis (Spanuet al. 2010), Botryosphaeria dothidea,Botrytis cinerea (Staats and vanKan2012; Amselem et al. 2011), Cercospora zeae-maydis, Colletotrichumgraminicola (O’Connell et al. 2012), Cronartium quercuum, Didymellaexigua, Fomitiporia mediterranea (Floudas et al. 2012), Fusarium grami-nearum (Cuomo et al. 2007), Leptosphaeriamaculans (Rouxel et al. 2011),Magnaporthe oryzae (Dean et al. 2005), Mixia osmundae (Toome et al.2014),Passalora fulva (deWit et al. 2012;Ohm et al. 2012),Phaeosphaerianodorum (Hane et al. 2007), Sclerotinia sclerotiorum (Amselem et al.2011), Setosphaeria turcica (Ohm et al. 2012; Condon et al. 2013),Sporisorium reilianum (Schirawski et al. 2010), Verticillium alfalfae(Klosterman et al. 2011), and Zopfia rhizophila]. Transcript se-quences were downloaded for all species, also from the JGI data-base. Protein models for Phytophthora sojae (Tyler et al. 2006), anoomycete, were used as outgroups to root the gene trees. Pseudo-monas fluorescens sequences were downloaded from the NCBI Genedatabase (Redondo-Nieto et al. 2012).
Orthology predictionGene orthologies were predicted using the Reciprocal Best Blast Hit(RBBH) method because it has been shown to have the lowest false-positive error rate (Salichos and Rokas 2011; Huerta-Cepas et al. 2007).Transcripts from the EfM3 gene models were used for E. festucae, thegene models from Ps. fluorescens were downloaded from the NCBIGene database, and all the other gene models were retrieved from theJGI database. A blastn database was built for each of the comparisonspecies, including E. festucae, using transcript sequences (excludingUTRs). The best blastn hit (E-value # 1 · 1025) was recovered foreach gene in each species. Blastn was used to avoid problems withmisannotated intron–exon boundaries. By definition, to be acceptedas a reciprocal best blast hit, if gene G1 from one species is the closesthit of gene G2 in another species, the same gene G2 must be the closestblast hit of G1.
Gene compositionThe percentage of GC content (GC) and the percentage of GC on thethird base of each codon (GC3)were computed on the coding sequences
1302 | P.-Y. Dupont and M. P. Cox
with a custom Python script. The same script performed the compu-tation of the CodonAdaptation Index (CAI) using the formula of Sharpand Li (1987). The effective number of codons (ENC), a measure ofcodon usage bias that has received attention more recently (Sun et al.2013), was computed using the method of Wright (1990).
Phylogenetic analysis pipelineFor the protein phylogenies, the sequences of each orthology groupwere aligned using MAFFT v7.058b (Katoh et al. 2002; Katoh andStandley 2013) with the set of parameters linsi. Automatic trimmingof the alignments was then performed using trimAl v1.2rev59 (Capella-Gutierrez et al. 2009). The phylogeny was built using PhyMLv20120412 (Guindon et al. 2010) using the model LG (Le and Gascuel2008) with 100 bootstrap replicates. The species tree was reconstructedusing the Subtree Prune-and-Regraft distance (SPR) supertree method(v1.2.0) (Whidden et al. 2014) using all 1768 genes that had predictedorthology with P. sojae, the oomycete outgroup used to root the tree.A bootstrap test was performed to assess the robustness of the tree.A sample of trees was taken with replacement from the initial gene treepopulation and a SPR supertree was generated for each sample. Thisprocedure was repeated 500 times. The bootstrap values of each branchcorrespond to the percentage of trees containing the given branch.
To infer potential LGT events, the maximum likelihood valuereported by PhyML for each gene tree was compared to the maximumlikelihood value of the phylogeny for the same gene with its topologyconstrained by the species tree topology.
Phylogenetic-based LGT prediction methodsThree different software packages were used, all based on the evaluationof the most parsimonious Deletion Transfer Loss (DTL) scenario:Ranger-DTL v1.0 (Bansal et al. 2012), Notung v2.8.1.7 (Chen et al.2000; Stolzer et al. 2012) and ecceTERA v1.2.4 (Jacox et al. 2016). Thesemethods use scores for each of the three possible events: that is, dele-tion, transfer, and loss. The default scores were used for deletion andloss, and a range of scores were trialed for transfer, from 3 (the defaultvalue) to 30. All three methods were run on all trees containing P. sojaeas an outgroup.
Computation of tree distancesOnly bipartitions with a bootstrap score $75% were used for thedistance comparison. The tree distances were computed using theRobinson and Foulds (RF) algorithm (Robinson and Foulds 1981)using the normalized RF distance implemented in the ETE toolkitfor Python (v2.3.7) (Huerta-Cepas et al. 2010). To compute phylo-genetic distances between two trees, both were rooted using thesame outgroup species. The bootstrap cut-off introduced polytomiesin a small number of trees, which were resolved using the automaticmethod provided by the ETE toolkit.
E. festucae gene clusteringThe transcript sequences of E. festucae were clustered using the MeanShift algorithm (Comaniciu andMeer 2002) implemented in the scikit-learn (v0.16.1) library for Python (Pedregosa et al. 2011) based on theirGC, GC3, CAI, ENC, and tetranucleotide frequencies. The bandwidthwas automatically determined using the method estimate_bandwidthavailable in scikit-learn. As the Mean Shift algorithm is sensitive to theshape of the data distributions (i.e., it was built to discover “blobs”),another clustering algorithm from scikit-learn, DBSCAN (Ester et al.1996), was also used. This algorithm considers clusters as areas of highdensity separated by areas of low density.
Data availabilityAll data are freely available from public databases. Accession numbersare indicated in Supplemental Material, Table S1 in File S1.
RESULTS
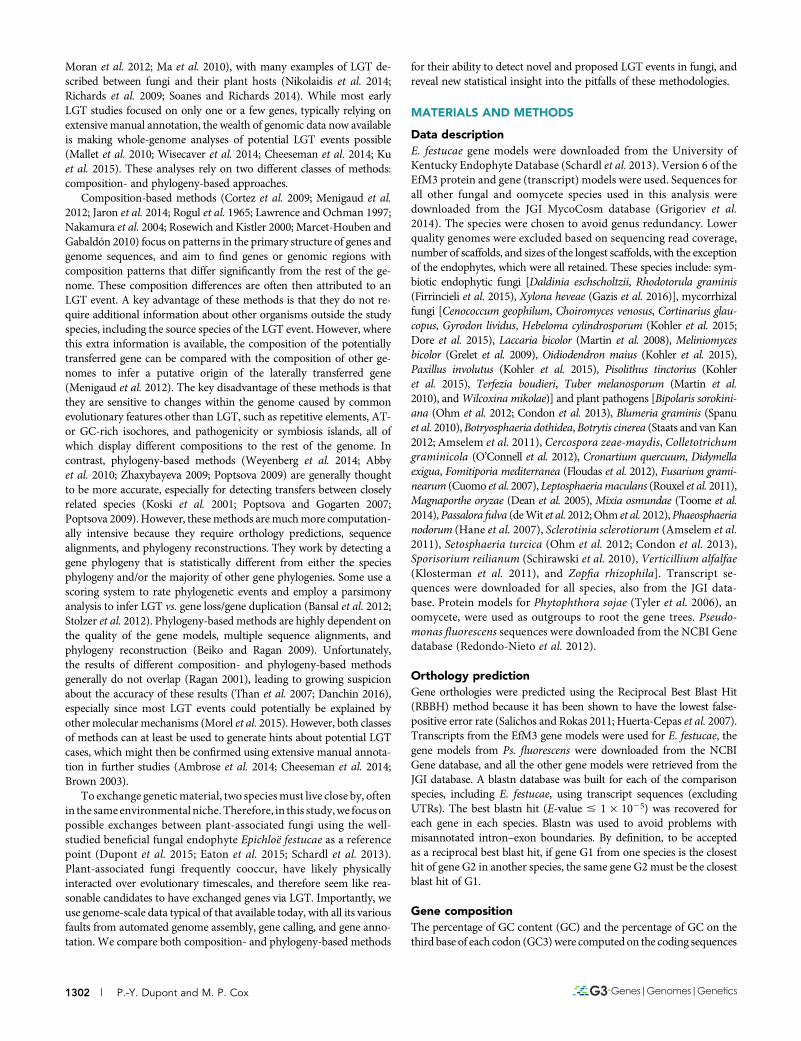
Study systemWhile claims of LGT are common in the literature (Gogarten andTownsend 2005; Keeling and Palmer 2008; Shapiro 1969; Gyles andBoerlin 2014; Kay et al. 2002; Furuya and Lowy 2006; Ochman et al.2000; Sprague 1991; Syvanen 1994; Rosewich and Kistler 2000;Fitzpatrick et al. 2008; Marcet-Houben and Gabaldón 2010), compre-hensive studies suggest that the power of automated methods to detectLGT events remain limited (Ragan 2001; Than et al. 2007; Danchin2016). This study aims to investigate whether it is possible to predictLGT events accurately in eukaryotic systems, specifically for real geno-mic data from fungi, given all its associated sources of noise and error.This study focused on protein-coding genes from 37 fungal species(Table S1 in File S1) that form associations with plants (20 pathogens,13 mycorrhiza, and four endophytes), plus one pathogenic oomycetespecies, P. sojae, used as an outgroup. The aim was to focus on speciesthat live in a common environmental niche (the plant host), thus in-creasing the possibility that LGT events may have occurred betweenthem. As is typical in modern genomic research, the genes and codingsequences studied here have mostly been automatically predicted,with little to no manual curation. Orthology relationships were de-termined using the RBBH method, which has been shown to offer agood balance between sensitivity and specificity in contrast to morecomputationally intensive algorithms (Salichos and Rokas 2011;Huerta-Cepas et al. 2007). The species tree presented in this study(Figure 1) was reconstructed using the SPR supertree method(Whidden et al. 2014) from all gene trees that included an outgroupsequence from P. sojae (n = 1768). Importantly, this species treeexactly matches previously published phylogenies (Fitzpatrick et al.2006; Wang et al. 2009; Brown 2003; James et al. 2006; Liu et al.2006) and is also consistent with the traditional fungal taxonomyavailable on the NCBI taxonomy database.
Formany analyses, it is useful to view LGT from the perspective of areference species. In this study, E. festucae, a natural symbiotic endo-phyte of the cool season grass Festuca rubra, was used (Schardl 2001).This organism is very well studied and used extensively as a modelsystem to explore fungal–plant interactions (Schardl et al. 2013;Tanaka et al. 2006; Christensen et al. 2008; Dupont et al. 2015; Eatonet al. 2015). Because E. festucae is the primary model organism in ourlaboratory, we understand its genes and genome particularly well,which has benefited the interpretation of several analyses presentedhere. Five other fungal species were chosen as secondary referencepoints based on their laddered evolutionary distances from E. festucae.From the closest to the furthest, these species are F. graminearum,O. maius, M. oryzae, S. turcica, and L. bicolor (Figure 1).
Assessment of previously described LGT eventin E. festucaeThe fitD gene, which encodes an insect toxin, has been reported tobe a putatively laterally transferred gene from Pseudomonas bacteriato Epichloë endophytes (Ambrose et al. 2014). A blast and HMMERsearch on the UniProtKB database shows that this gene is also pre-sent in Phlebiopsis gigantea, a fungus from the Agaricomycetes classthat is phylogenetically very distant from E. festucae with a muchhigher E-value than the Pseudomonas sequences. It is also found inAspergillus flavus (Eurotiomycetes), in different Metarhizium species
Volume 7 April 2017 | Data Quality Impacts Detection of LGT | 1303
(Sordariomycetes), and in Neonectria ditissima (Sordariomycetes), allwith significant E-values (, 1 · 10212). It is important to consider thatfitDmay not have been directly transferred from bacteria into Epichloëdue to its presence in many phylogenetically distant fungal clades. It isinteresting to note that the closest fungal fitD hit is from Ph. gigan-tea, which is phylogenetically more distant from E. festucae than theother fungal hits, suggesting that fitD may have been transferredinto Epichloë from Ph. gigantea rather than directly from bacteria.Indeed, it is possible that fitD was lost in most fungal species andmay not have been laterally transferred at all. Nevertheless, fitD is
included in many analyses here as a reference point, as it is the onlyLGT gene claimed to date in an Epichloë species.
Composition-based methodsComposition-based methods are used to find genes whose sequencecompositions differ from the rest of the genome. They do not requireany knowledge about the phylogeny of the studied organism, andhave a long history of use for characterizing potential LGT events(Rogul et al. 1965), especially in prokaryotes (Lawrence and Ochman1997; Garcia-Vallve et al. 2000; Nakamura et al. 2004) and more
Figure 1 Cladogram of the plant-associated fungalspecies considered in this study. This tree representsthe phylogenetic relationships between 37 plant-associated fungal species that span the fungal treeof life, together with an oomycete outgroup. It containsseven classes of fungi (Sordariomycetes, Leotimycetes,Dothideomycetes, Xylonomycetes, Pezizomycetes,Agaricomycetes, and Ustilagomycetes) and one Oomy-cetes species. Subphylum Pucciniomycotina repre-sents three more classes of fungi: Microbotryomycetes(R. graminis), Mixiomycetes (Mi. osmundae), and Pucci-niomycetes (C. quercuum). It covers the two main fun-gal phyla: Basidiomycota and Ascomycota. Ourreference species, E. festucae, belongs to the sameorder (Hypocreales) as its closest neighbor in the tree,F. graminearum. The Oomycete P. sojae is a nonfungalorganism used as an outgroup in the phylogeny re-construction. Pathogenic species are represented inred, mycorrhizas in blue, and endophytes in green.Asterisks indicate the species at laddered evolutionarydistances that are compared to E. festucae in Figure 4.
1304 | P.-Y. Dupont and M. P. Cox
recently in fungi (Rosewich and Kistler 2000; Fitzpatrick 2012; Marcet-Houben and Gabaldón 2010; Jaron et al. 2014). Our study aims toevaluate the efficiency of composition-based methods for detectingLGT in fungal genomes.
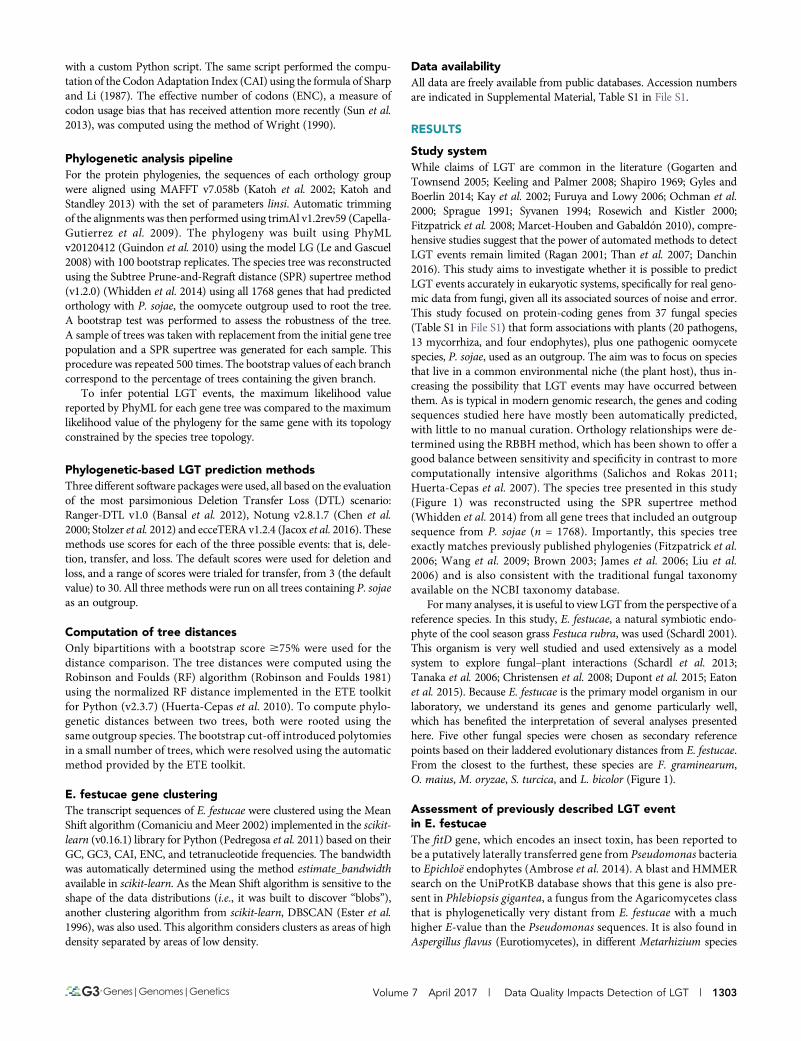
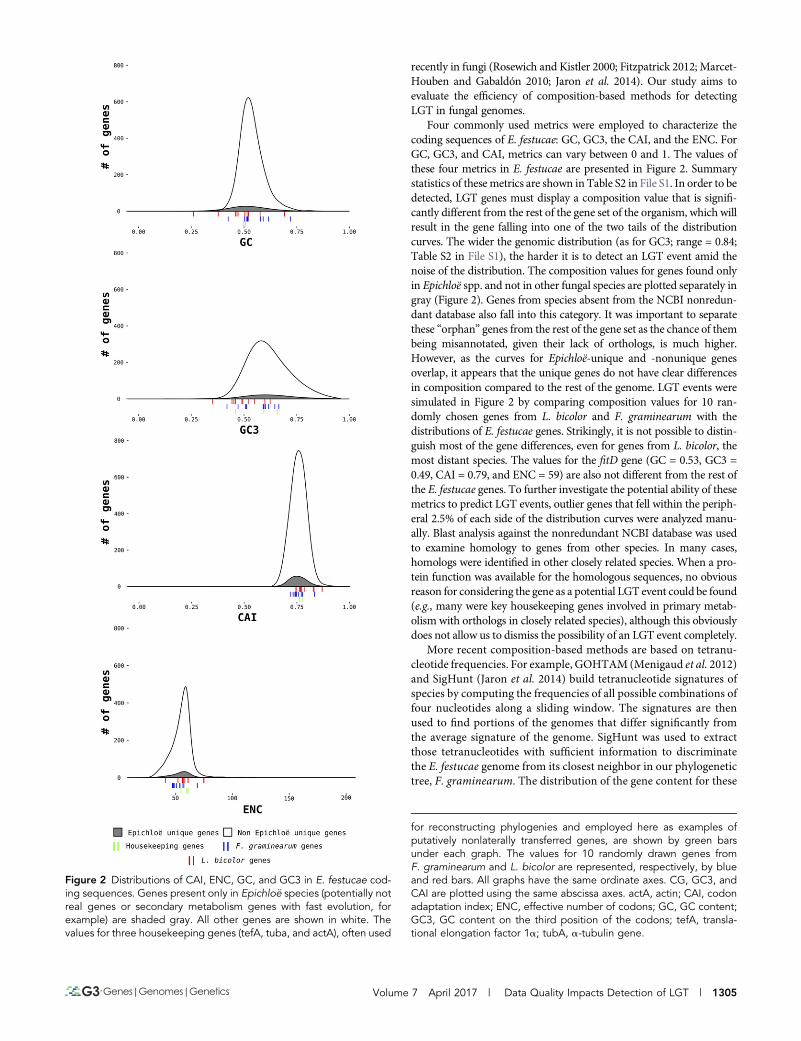
Four commonly used metrics were employed to characterize thecoding sequences of E. festucae: GC, GC3, the CAI, and the ENC. ForGC, GC3, and CAI, metrics can vary between 0 and 1. The values ofthese four metrics in E. festucae are presented in Figure 2. Summarystatistics of these metrics are shown in Table S2 in File S1. In order to bedetected, LGT genes must display a composition value that is signifi-cantly different from the rest of the gene set of the organism, which willresult in the gene falling into one of the two tails of the distributioncurves. The wider the genomic distribution (as for GC3; range = 0.84;Table S2 in File S1), the harder it is to detect an LGT event amid thenoise of the distribution. The composition values for genes found onlyin Epichloë spp. and not in other fungal species are plotted separately ingray (Figure 2). Genes from species absent from the NCBI nonredun-dant database also fall into this category. It was important to separatethese “orphan” genes from the rest of the gene set as the chance of thembeing misannotated, given their lack of orthologs, is much higher.However, as the curves for Epichloë-unique and -nonunique genesoverlap, it appears that the unique genes do not have clear differencesin composition compared to the rest of the genome. LGT events weresimulated in Figure 2 by comparing composition values for 10 ran-domly chosen genes from L. bicolor and F. graminearum with thedistributions of E. festucae genes. Strikingly, it is not possible to distin-guish most of the gene differences, even for genes from L. bicolor, themost distant species. The values for the fitD gene (GC = 0.53, GC3 =0.49, CAI = 0.79, and ENC = 59) are also not different from the rest ofthe E. festucae genes. To further investigate the potential ability of thesemetrics to predict LGT events, outlier genes that fell within the periph-eral 2.5% of each side of the distribution curves were analyzed manu-ally. Blast analysis against the nonredundant NCBI database was usedto examine homology to genes from other species. In many cases,homologs were identified in other closely related species. When a pro-tein function was available for the homologous sequences, no obviousreason for considering the gene as a potential LGT event could be found(e.g., many were key housekeeping genes involved in primary metab-olism with orthologs in closely related species), although this obviouslydoes not allow us to dismiss the possibility of an LGT event completely.
More recent composition-based methods are based on tetranu-cleotide frequencies. For example, GOHTAM (Menigaud et al. 2012)and SigHunt (Jaron et al. 2014) build tetranucleotide signatures ofspecies by computing the frequencies of all possible combinations offour nucleotides along a sliding window. The signatures are thenused to find portions of the genomes that differ significantly fromthe average signature of the genome. SigHunt was used to extractthose tetranucleotides with sufficient information to discriminatethe E. festucae genome from its closest neighbor in our phylogenetictree, F. graminearum. The distribution of the gene content for these
Figure 2 Distributions of CAI, ENC, GC, and GC3 in E. festucae cod-ing sequences. Genes present only in Epichloë species (potentially notreal genes or secondary metabolism genes with fast evolution, forexample) are shaded gray. All other genes are shown in white. Thevalues for three housekeeping genes (tefA, tuba, and actA), often used
for reconstructing phylogenies and employed here as examples ofputatively nonlaterally transferred genes, are shown by green barsunder each graph. The values for 10 randomly drawn genes fromF. graminearum and L. bicolor are represented, respectively, by blueand red bars. All graphs have the same ordinate axes. CG, GC3, andCAI are plotted using the same abscissa axes. actA, actin; CAI, codonadaptation index; ENC, effective number of codons; GC, GC content;GC3, GC content on the third position of the codons; tefA, transla-tional elongation factor 1a; tubA, a-tubulin gene.
Volume 7 April 2017 | Data Quality Impacts Detection of LGT | 1305
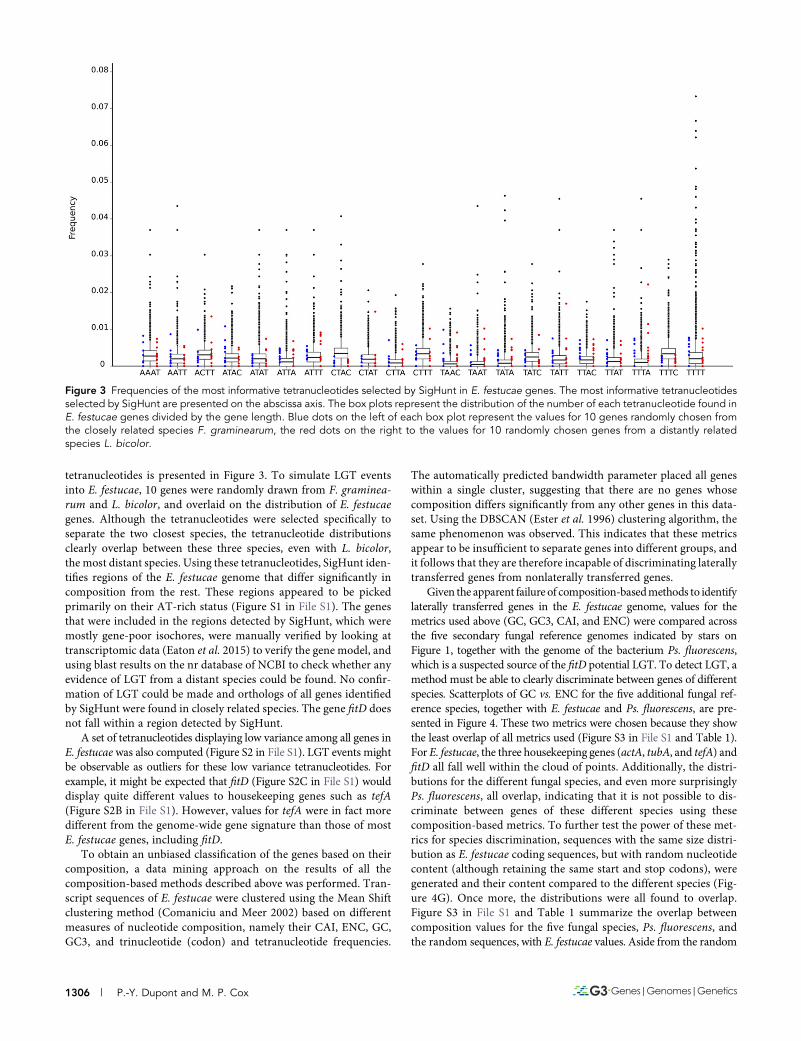
tetranucleotides is presented in Figure 3. To simulate LGT eventsinto E. festucae, 10 genes were randomly drawn from F. graminea-rum and L. bicolor, and overlaid on the distribution of E. festucaegenes. Although the tetranucleotides were selected specifically toseparate the two closest species, the tetranucleotide distributionsclearly overlap between these three species, even with L. bicolor,the most distant species. Using these tetranucleotides, SigHunt iden-tifies regions of the E. festucae genome that differ significantly incomposition from the rest. These regions appeared to be pickedprimarily on their AT-rich status (Figure S1 in File S1). The genesthat were included in the regions detected by SigHunt, which weremostly gene-poor isochores, were manually verified by looking attranscriptomic data (Eaton et al. 2015) to verify the gene model, andusing blast results on the nr database of NCBI to check whether anyevidence of LGT from a distant species could be found. No confir-mation of LGT could be made and orthologs of all genes identifiedby SigHunt were found in closely related species. The gene fitD doesnot fall within a region detected by SigHunt.
A set of tetranucleotides displaying low variance among all genes inE. festucae was also computed (Figure S2 in File S1). LGT events mightbe observable as outliers for these low variance tetranucleotides. Forexample, it might be expected that fitD (Figure S2C in File S1) woulddisplay quite different values to housekeeping genes such as tefA(Figure S2B in File S1). However, values for tefA were in fact moredifferent from the genome-wide gene signature than those of mostE. festucae genes, including fitD.
To obtain an unbiased classification of the genes based on theircomposition, a data mining approach on the results of all thecomposition-based methods described above was performed. Tran-script sequences of E. festucae were clustered using the Mean Shiftclustering method (Comaniciu and Meer 2002) based on differentmeasures of nucleotide composition, namely their CAI, ENC, GC,GC3, and trinucleotide (codon) and tetranucleotide frequencies.
The automatically predicted bandwidth parameter placed all geneswithin a single cluster, suggesting that there are no genes whosecomposition differs significantly from any other genes in this data-set. Using the DBSCAN (Ester et al. 1996) clustering algorithm, thesame phenomenon was observed. This indicates that these metricsappear to be insufficient to separate genes into different groups, andit follows that they are therefore incapable of discriminating laterallytransferred genes from nonlaterally transferred genes.
Given the apparent failure of composition-basedmethods to identifylaterally transferred genes in the E. festucae genome, values for themetrics used above (GC, GC3, CAI, and ENC) were compared acrossthe five secondary fungal reference genomes indicated by stars onFigure 1, together with the genome of the bacterium Ps. fluorescens,which is a suspected source of the fitD potential LGT. To detect LGT, amethod must be able to clearly discriminate between genes of differentspecies. Scatterplots of GC vs. ENC for the five additional fungal ref-erence species, together with E. festucae and Ps. fluorescens, are pre-sented in Figure 4. These two metrics were chosen because they showthe least overlap of all metrics used (Figure S3 in File S1 and Table 1).For E. festucae, the three housekeeping genes (actA, tubA, and tefA) andfitD all fall well within the cloud of points. Additionally, the distri-butions for the different fungal species, and even more surprisinglyPs. fluorescens, all overlap, indicating that it is not possible to dis-criminate between genes of these different species using thesecomposition-based metrics. To further test the power of these met-rics for species discrimination, sequences with the same size distri-bution as E. festucae coding sequences, but with random nucleotidecontent (although retaining the same start and stop codons), weregenerated and their content compared to the different species (Fig-ure 4G). Once more, the distributions were all found to overlap.Figure S3 in File S1 and Table 1 summarize the overlap betweencomposition values for the five fungal species, Ps. fluorescens, andthe random sequences, with E. festucae values. Aside from the random
Figure 3 Frequencies of the most informative tetranucleotides selected by SigHunt in E. festucae genes. The most informative tetranucleotidesselected by SigHunt are presented on the abscissa axis. The box plots represent the distribution of the number of each tetranucleotide found inE. festucae genes divided by the gene length. Blue dots on the left of each box plot represent the values for 10 genes randomly chosen fromthe closely related species F. graminearum, the red dots on the right to the values for 10 randomly chosen genes from a distantly relatedspecies L. bicolor.
1306 | P.-Y. Dupont and M. P. Cox
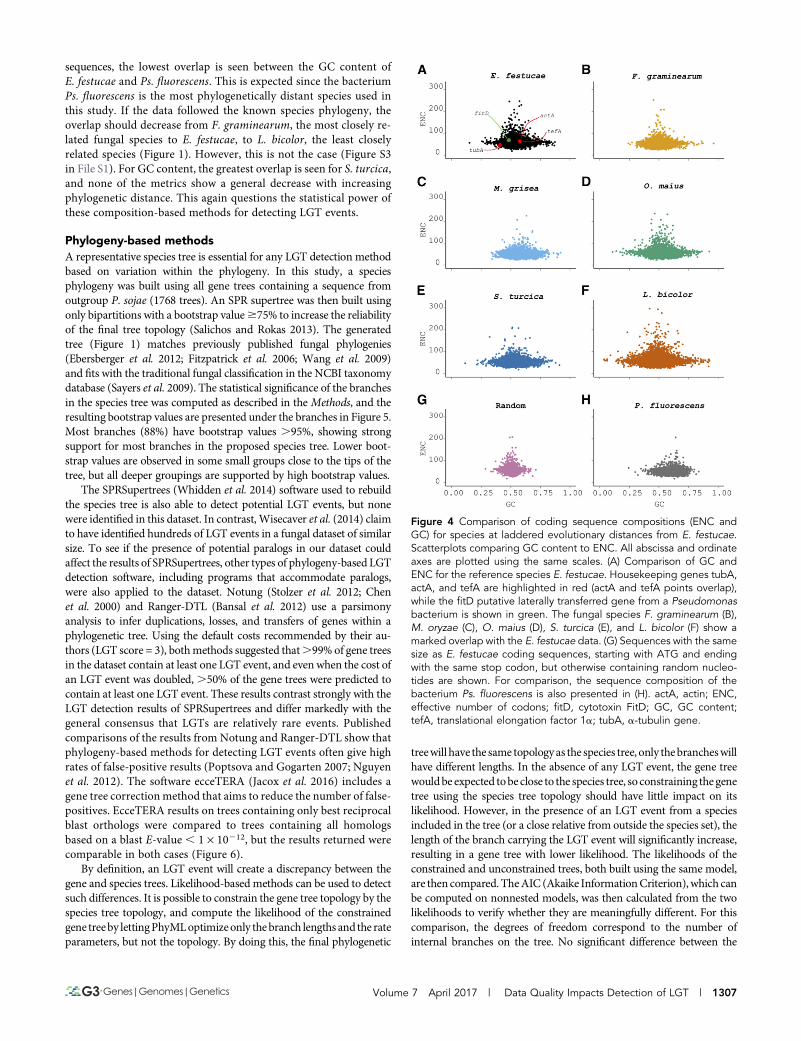
sequences, the lowest overlap is seen between the GC content ofE. festucae and Ps. fluorescens. This is expected since the bacteriumPs. fluorescens is the most phylogenetically distant species used inthis study. If the data followed the known species phylogeny, theoverlap should decrease from F. graminearum, the most closely re-lated fungal species to E. festucae, to L. bicolor, the least closelyrelated species (Figure 1). However, this is not the case (Figure S3in File S1). For GC content, the greatest overlap is seen for S. turcica,and none of the metrics show a general decrease with increasingphylogenetic distance. This again questions the statistical power ofthese composition-based methods for detecting LGT events.
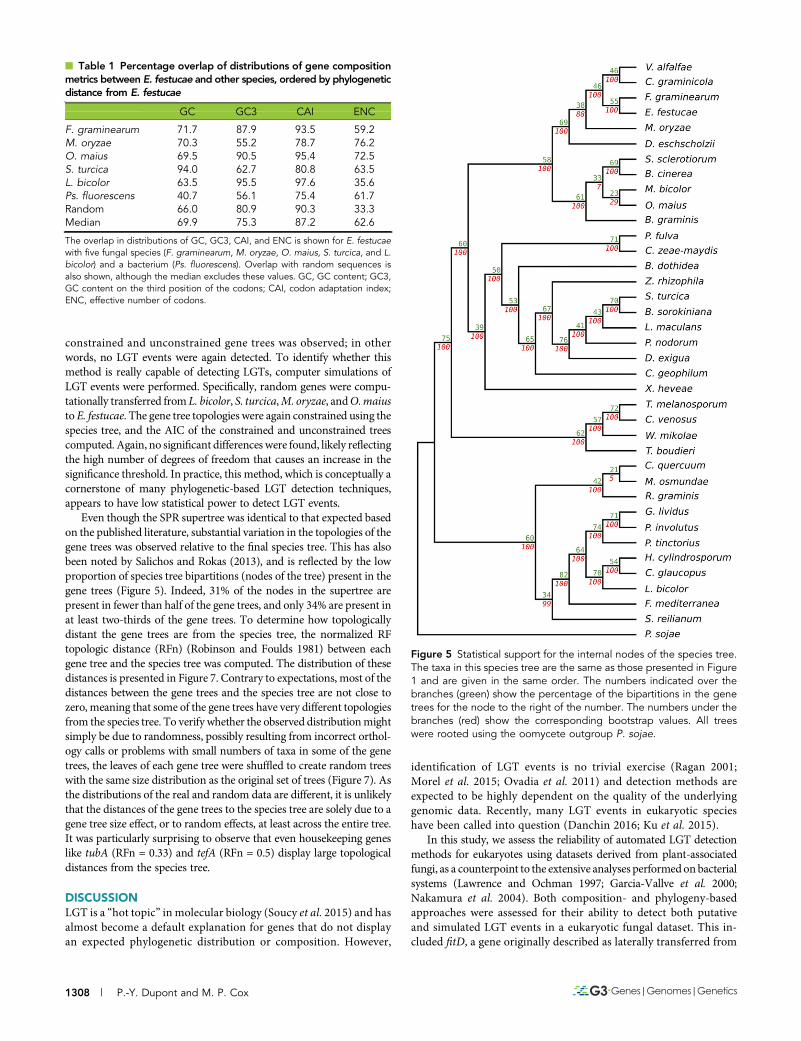
Phylogeny-based methodsA representative species tree is essential for any LGT detection methodbased on variation within the phylogeny. In this study, a speciesphylogeny was built using all gene trees containing a sequence fromoutgroup P. sojae (1768 trees). An SPR supertree was then built usingonly bipartitions with a bootstrap value$75% to increase the reliabilityof the final tree topology (Salichos and Rokas 2013). The generatedtree (Figure 1) matches previously published fungal phylogenies(Ebersberger et al. 2012; Fitzpatrick et al. 2006; Wang et al. 2009)and fits with the traditional fungal classification in the NCBI taxonomydatabase (Sayers et al. 2009). The statistical significance of the branchesin the species tree was computed as described in the Methods, and theresulting bootstrap values are presented under the branches in Figure 5.Most branches (88%) have bootstrap values .95%, showing strongsupport for most branches in the proposed species tree. Lower boot-strap values are observed in some small groups close to the tips of thetree, but all deeper groupings are supported by high bootstrap values.
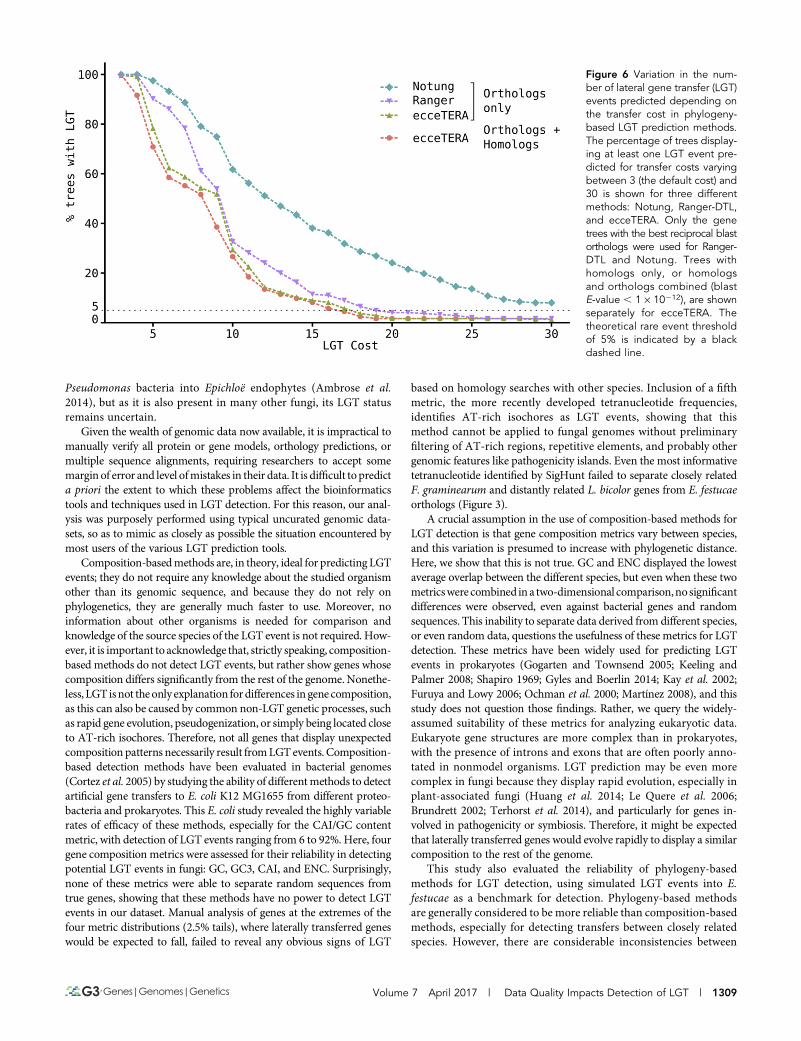
The SPRSupertrees (Whidden et al. 2014) software used to rebuildthe species tree is also able to detect potential LGT events, but nonewere identified in this dataset. In contrast, Wisecaver et al. (2014) claimto have identified hundreds of LGT events in a fungal dataset of similarsize. To see if the presence of potential paralogs in our dataset couldaffect the results of SPRSupertrees, other types of phylogeny-based LGTdetection software, including programs that accommodate paralogs,were also applied to the dataset. Notung (Stolzer et al. 2012; Chenet al. 2000) and Ranger-DTL (Bansal et al. 2012) use a parsimonyanalysis to infer duplications, losses, and transfers of genes within aphylogenetic tree. Using the default costs recommended by their au-thors (LGT score = 3), bothmethods suggested that.99% of gene treesin the dataset contain at least one LGT event, and even when the cost ofan LGT event was doubled, .50% of the gene trees were predicted tocontain at least one LGT event. These results contrast strongly with theLGT detection results of SPRSupertrees and differ markedly with thegeneral consensus that LGTs are relatively rare events. Publishedcomparisons of the results from Notung and Ranger-DTL show thatphylogeny-based methods for detecting LGT events often give highrates of false-positive results (Poptsova and Gogarten 2007; Nguyenet al. 2012). The software ecceTERA (Jacox et al. 2016) includes agene tree correctionmethod that aims to reduce the number of false-positives. EcceTERA results on trees containing only best reciprocalblast orthologs were compared to trees containing all homologsbased on a blast E-value , 1 · 10212, but the results returned werecomparable in both cases (Figure 6).
By definition, an LGT event will create a discrepancy between thegene and species trees. Likelihood-based methods can be used to detectsuch differences. It is possible to constrain the gene tree topology by thespecies tree topology, and compute the likelihood of the constrainedgene treeby lettingPhyMLoptimizeonly the branch lengths and the rateparameters, but not the topology. By doing this, the final phylogenetic
treewill have the same topologyas the species tree, only thebrancheswillhave different lengths. In the absence of any LGT event, the gene treewouldbe expected tobe close to the species tree, so constraining the genetree using the species tree topology should have little impact on itslikelihood. However, in the presence of an LGT event from a speciesincluded in the tree (or a close relative from outside the species set), thelength of the branch carrying the LGT event will significantly increase,resulting in a gene tree with lower likelihood. The likelihoods of theconstrained and unconstrained trees, both built using the same model,are then compared. TheAIC (Akaike InformationCriterion), which canbe computed on nonnested models, was then calculated from the twolikelihoods to verify whether they are meaningfully different. For thiscomparison, the degrees of freedom correspond to the number ofinternal branches on the tree. No significant difference between the
Figure 4 Comparison of coding sequence compositions (ENC andGC) for species at laddered evolutionary distances from E. festucae.Scatterplots comparing GC content to ENC. All abscissa and ordinateaxes are plotted using the same scales. (A) Comparison of GC andENC for the reference species E. festucae. Housekeeping genes tubA,actA, and tefA are highlighted in red (actA and tefA points overlap),while the fitD putative laterally transferred gene from a Pseudomonasbacterium is shown in green. The fungal species F. graminearum (B),M. oryzae (C), O. maius (D), S. turcica (E), and L. bicolor (F) show amarked overlap with the E. festucae data. (G) Sequences with the samesize as E. festucae coding sequences, starting with ATG and endingwith the same stop codon, but otherwise containing random nucleo-tides are shown. For comparison, the sequence composition of thebacterium Ps. fluorescens is also presented in (H). actA, actin; ENC,effective number of codons; fitD, cytotoxin FitD; GC, GC content;tefA, translational elongation factor 1a; tubA, a-tubulin gene.
Volume 7 April 2017 | Data Quality Impacts Detection of LGT | 1307
constrained and unconstrained gene trees was observed; in otherwords, no LGT events were again detected. To identify whether thismethod is really capable of detecting LGTs, computer simulations ofLGT events were performed. Specifically, random genes were compu-tationally transferred from L. bicolor, S. turcica,M. oryzae, andO.maiusto E. festucae. The gene tree topologies were again constrained using thespecies tree, and the AIC of the constrained and unconstrained treescomputed. Again, no significant differences were found, likely reflectingthe high number of degrees of freedom that causes an increase in thesignificance threshold. In practice, this method, which is conceptually acornerstone of many phylogenetic-based LGT detection techniques,appears to have low statistical power to detect LGT events.
Even though the SPR supertree was identical to that expected basedon the published literature, substantial variation in the topologies of thegene trees was observed relative to the final species tree. This has alsobeen noted by Salichos and Rokas (2013), and is reflected by the lowproportion of species tree bipartitions (nodes of the tree) present in thegene trees (Figure 5). Indeed, 31% of the nodes in the supertree arepresent in fewer than half of the gene trees, and only 34% are present inat least two-thirds of the gene trees. To determine how topologicallydistant the gene trees are from the species tree, the normalized RFtopologic distance (RFn) (Robinson and Foulds 1981) between eachgene tree and the species tree was computed. The distribution of thesedistances is presented in Figure 7. Contrary to expectations, most of thedistances between the gene trees and the species tree are not close tozero, meaning that some of the gene trees have very different topologiesfrom the species tree. To verify whether the observed distributionmightsimply be due to randomness, possibly resulting from incorrect orthol-ogy calls or problems with small numbers of taxa in some of the genetrees, the leaves of each gene tree were shuffled to create random treeswith the same size distribution as the original set of trees (Figure 7). Asthe distributions of the real and random data are different, it is unlikelythat the distances of the gene trees to the species tree are solely due to agene tree size effect, or to random effects, at least across the entire tree.It was particularly surprising to observe that even housekeeping geneslike tubA (RFn = 0.33) and tefA (RFn = 0.5) display large topologicaldistances from the species tree.
DISCUSSIONLGT is a “hot topic” in molecular biology (Soucy et al. 2015) and hasalmost become a default explanation for genes that do not displayan expected phylogenetic distribution or composition. However,
identification of LGT events is no trivial exercise (Ragan 2001;Morel et al. 2015; Ovadia et al. 2011) and detection methods areexpected to be highly dependent on the quality of the underlyinggenomic data. Recently, many LGT events in eukaryotic specieshave been called into question (Danchin 2016; Ku et al. 2015).
In this study, we assess the reliability of automated LGT detectionmethods for eukaryotes using datasets derived from plant-associatedfungi, as a counterpoint to the extensive analyses performedon bacterialsystems (Lawrence and Ochman 1997; Garcia-Vallve et al. 2000;Nakamura et al. 2004). Both composition- and phylogeny-basedapproaches were assessed for their ability to detect both putativeand simulated LGT events in a eukaryotic fungal dataset. This in-cluded fitD, a gene originally described as laterally transferred from
n Table 1 Percentage overlap of distributions of gene compositionmetrics between E. festucae and other species, ordered by phylogeneticdistance from E. festucae
GC GC3 CAI ENC
F. graminearum 71.7 87.9 93.5 59.2M. oryzae 70.3 55.2 78.7 76.2O. maius 69.5 90.5 95.4 72.5S. turcica 94.0 62.7 80.8 63.5L. bicolor 63.5 95.5 97.6 35.6Ps. fluorescens 40.7 56.1 75.4 61.7Random 66.0 80.9 90.3 33.3Median 69.9 75.3 87.2 62.6
The overlap in distributions of GC, GC3, CAI, and ENC is shown for E. festucaewith five fungal species (F. graminearum, M. oryzae, O. maius, S. turcica, and L.bicolor) and a bacterium (Ps. fluorescens). Overlap with random sequences isalso shown, although the median excludes these values. GC, GC content; GC3,GC content on the third position of the codons; CAI, codon adaptation index;ENC, effective number of codons.
Figure 5 Statistical support for the internal nodes of the species tree.The taxa in this species tree are the same as those presented in Figure1 and are given in the same order. The numbers indicated over thebranches (green) show the percentage of the bipartitions in the genetrees for the node to the right of the number. The numbers under thebranches (red) show the corresponding bootstrap values. All treeswere rooted using the oomycete outgroup P. sojae.
1308 | P.-Y. Dupont and M. P. Cox
Pseudomonas bacteria into Epichloë endophytes (Ambrose et al.2014), but as it is also present in many other fungi, its LGT statusremains uncertain.
Given the wealth of genomic data now available, it is impractical tomanually verify all protein or gene models, orthology predictions, ormultiple sequence alignments, requiring researchers to accept somemargin of error and level ofmistakes in their data. It is difficult to predicta priori the extent to which these problems affect the bioinformaticstools and techniques used in LGT detection. For this reason, our anal-ysis was purposely performed using typical uncurated genomic data-sets, so as to mimic as closely as possible the situation encountered bymost users of the various LGT prediction tools.
Composition-basedmethods are, in theory, ideal for predicting LGTevents; they do not require any knowledge about the studied organismother than its genomic sequence, and because they do not rely onphylogenetics, they are generally much faster to use. Moreover, noinformation about other organisms is needed for comparison andknowledge of the source species of the LGT event is not required. How-ever, it is important to acknowledge that, strictly speaking, composition-based methods do not detect LGT events, but rather show genes whosecomposition differs significantly from the rest of the genome. Nonethe-less, LGTisnot theonly explanation for differences in gene composition,as this can also be caused by common non-LGT genetic processes, suchas rapid gene evolution, pseudogenization, or simply being located closeto AT-rich isochores. Therefore, not all genes that display unexpectedcomposition patterns necessarily result fromLGT events. Composition-based detection methods have been evaluated in bacterial genomes(Cortez et al. 2005) by studying the ability of differentmethods to detectartificial gene transfers to E. coli K12 MG1655 from different proteo-bacteria and prokaryotes. This E. coli study revealed the highly variablerates of efficacy of these methods, especially for the CAI/GC contentmetric, with detection of LGT events ranging from 6 to 92%. Here, fourgene composition metrics were assessed for their reliability in detectingpotential LGT events in fungi: GC, GC3, CAI, and ENC. Surprisingly,none of these metrics were able to separate random sequences fromtrue genes, showing that these methods have no power to detect LGTevents in our dataset. Manual analysis of genes at the extremes of thefour metric distributions (2.5% tails), where laterally transferred geneswould be expected to fall, failed to reveal any obvious signs of LGT
based on homology searches with other species. Inclusion of a fifthmetric, the more recently developed tetranucleotide frequencies,identifies AT-rich isochores as LGT events, showing that thismethod cannot be applied to fungal genomes without preliminaryfiltering of AT-rich regions, repetitive elements, and probably othergenomic features like pathogenicity islands. Even the most informativetetranucleotide identified by SigHunt failed to separate closely relatedF. graminearum and distantly related L. bicolor genes from E. festucaeorthologs (Figure 3).
A crucial assumption in the use of composition-based methods forLGT detection is that gene composition metrics vary between species,and this variation is presumed to increase with phylogenetic distance.Here, we show that this is not true. GC and ENC displayed the lowestaverage overlap between the different species, but even when these twometricswere combined in a two-dimensional comparison,nosignificantdifferences were observed, even against bacterial genes and randomsequences. This inability to separate data derived from different species,or even random data, questions the usefulness of these metrics for LGTdetection. These metrics have been widely used for predicting LGTevents in prokaryotes (Gogarten and Townsend 2005; Keeling andPalmer 2008; Shapiro 1969; Gyles and Boerlin 2014; Kay et al. 2002;Furuya and Lowy 2006; Ochman et al. 2000; Martínez 2008), and thisstudy does not question those findings. Rather, we query the widely-assumed suitability of these metrics for analyzing eukaryotic data.Eukaryote gene structures are more complex than in prokaryotes,with the presence of introns and exons that are often poorly anno-tated in nonmodel organisms. LGT prediction may be even morecomplex in fungi because they display rapid evolution, especially inplant-associated fungi (Huang et al. 2014; Le Quere et al. 2006;Brundrett 2002; Terhorst et al. 2014), and particularly for genes in-volved in pathogenicity or symbiosis. Therefore, it might be expectedthat laterally transferred genes would evolve rapidly to display a similarcomposition to the rest of the genome.
This study also evaluated the reliability of phylogeny-basedmethods for LGT detection, using simulated LGT events into E.festucae as a benchmark for detection. Phylogeny-based methodsare generally considered to be more reliable than composition-basedmethods, especially for detecting transfers between closely relatedspecies. However, there are considerable inconsistencies between
Figure 6 Variation in the num-ber of lateral gene transfer (LGT)events predicted depending onthe transfer cost in phylogeny-based LGT prediction methods.The percentage of trees display-ing at least one LGT event pre-dicted for transfer costs varyingbetween 3 (the default cost) and30 is shown for three differentmethods: Notung, Ranger-DTL,and ecceTERA. Only the genetrees with the best reciprocal blastorthologs were used for Ranger-DTL and Notung. Trees withhomologs only, or homologsand orthologs combined (blastE-value , 1 · 10212), are shownseparately for ecceTERA. Thetheoretical rare event thresholdof 5% is indicated by a blackdashed line.
Volume 7 April 2017 | Data Quality Impacts Detection of LGT | 1309

the results of different detection methods (Ragan 2001; Jaron et al.2014). Additionally, phylogeny-based methods seem to be very sen-sitive to the quality of the study data (Wägele andMayer 2007) and itwas unclear how these methods would perform on real uncurateddatasets, particularly those representing larger eukaryotic genomes.Phylogeny-based methods work by comparing the topology of thespecies tree with topologies for gene trees to identify genes thatdisplay a significantly different phylogeny, thus hinting at possibleLGT events.
The species supertree was built so as to minimize the distancebetween all gene trees. Due to the nature of the resampling processused to compute the bootstrap scores, each bootstrap replicate tends tobe based on a very large dataset (despite the resampling) and thus allbootstrap trees are very similar to the species supertree. Consequently,bootstrap scores are typically close to 100%. This seems overly conser-vative and it proved more informative to look at the distribution of treeshapes rather than the bootstrap values. To check whether high boot-strap values are an artifact of the large set of gene trees, the frequencies ofthe species tree bipartitions present across all the gene trees werecomputed. This provides a measure of the variation in the underlyinggene phylogenies. Comparing individual gene tree topologies with thespecies supertree revealed a surprisingly high level of variation amongindividual gene trees,with the frequencyof bipartition identities rangingfrom21 to 82%,with an average of 56%.Thismeans that a givennode inthe species tree is onaveragepresent only in aroundhalfof the gene trees.This was unexpected as it is generally thought that individual gene treesmostly follow the same phylogeny as the species tree, although thismarked variation between gene trees and the species tree topology hasbeen observed previously in bacteria (Poptsova andGogarten 2007) andyeasts (Salichos and Rokas 2013). It is likely that the low bipartitionidentities observed are at least in part due to pruning of nodes in thegene trees with bootstrap values,75%. However, this was essential toensure that only highly supported nodes were used for the phylogenycomparisons. It is also interesting to note that low bootstrap values were
always associated with a low bipartition frequency value, but that thereciprocal property was not true: some high bootstrap values wereassociated with a low bipartition frequency. For example, the node thatseparates the Xylonomycetes and Dothideomycetes has a bootstrapscore of 100%, but a bipartition frequency score of only 39%. The factthat these frequencies are generally low emphasizes just how variablegene tree topologies are. As phylogeny-based LGT methods work byidentifying gene phylogenies that differ from that of the species tree,such extreme levels of topological variation between the gene trees andspecies tree poses a considerable problem for these detection methods,as it then becomes complex to distinguish LGT events from normaltopological variation.
Phylogeny-based methods compare gene and species trees by com-puting a distance value between them. In this study, the high variationbetween the gene and species trees by definition also impacts the RFn,where a distanceof zero represents an identical topology for a given genetree and the species trees, while a distance of one corresponds to the twotrees being as different from each other as possible. It was expected thatmost of the gene tree topologies would reflect the species tree topologyand have distances very close to zero. In this case, the distribution of thetopological distances between the species tree and gene trees would berepresentedbyarapidlydecreasingcurvewithmostof thedistancescloseto zero. LGTevents should thenbe representedby gene treeswithhigherdistances. Instead, a bell-shaped distribution was observed, centered at�0.5 and with a maximum of 0.9, indicating that most of the gene treesare very different from the species tree. This implies that, although thespecies tree is the average of all the gene trees, it is by nomeans themostfrequent tree. In fact, only 6% of gene trees exactly match the speciestree. The sheer diversity of gene tree topologies may be due to thevariable speed of gene evolution resulting from quite different environ-mental selection pressures or incomplete lineage sorting. It is generallythought that discordant gene and species phylogenies reflect only rareevents like LGT or transspecies polymorphism (Pamilo and Nei 1988;Maddison 1997), and many putative laterally transferred genes have
Figure 7 Variation in the topology of gene trees com-pared to the species tree. The distribution of the RFnsbetween the species tree and between the species treeand trees of individual E. festucae genes is shown in black.The distribution of the RFn distances between the speciestree and randomly generated trees with the same sizedistribution as the real gene trees is displayed in white.The distance values for the housekeeping genes actA,tubA, and tefA are highlighted by red arrows. The fitDgene cannot be represented on this figure because it isonly present in E. festucae. (This putative laterally trans-ferred gene is not found in the other fungi studied here.)Examples of comparisons between gene trees and thespecies tree are displayed in the boxes at the top partof the figure. The species tree appears to vary only be-cause the subset of species present in the gene tree dif-fers between the three examples. The species treetopology is in fact identical for all analyses. Orange linksindicate a change in the location of species in the genetree relative to the species tree. Blue links indicate con-servation with the species tree topology. RFn = 0 corre-sponds to a perfect match between the species tree andthe gene tree, while RFn = 0.5 indicates that half of thenodes in the gene tree do not match the species tree.actA, actin; fitD, cytotoxin FitD; RFn, normalized Robinsonand Foulds distances; tefA, translational elongation factor1a; tubA, a-tubulin gene.
1310 | P.-Y. Dupont and M. P. Cox
been identified based on this assumption. However, this study revealsthat, at least in fungi, discord between gene and species tree topologiesappears to be common and can even be observed routinely in house-keeping genes. We suspect that this large variation in tree topologies isthe main reason why the SPRSupertrees software could not detect anyLGT events in this dataset, and may also explain the unlikely results ofNotung and Ranger-DTL, which predict that nearly all gene trees con-tain at least one LGT event. These tools apply a score for each type ofevent (duplications, gene losses, and LGTs), and the software returnsthe most parsimonious series of events relative to the phylogeny. With-out a priori knowledge of the rates at which these events occur, it ischallenging to find an appropriate set of scores for the algorithm. In thisstudy, the default scores produce unlikely results. Moreover, missinggenes in our gene trees may have important consequences: they shouldbe annotated as losses, but often seem to be classified as transfers.EcceTERA attempts to address this by implementing a probabilisticmodel to infer true transfer events from false-positives. The relationshipbetween the number of detected LGT events and the transfer cost inNotung, Ranger-DTL, and ecceTERA are inverse-like functions; dou-bling the default score for a transfer event still results in .50% of thetrees displaying an LGT event. Even when the default transfer cost ismultiplied by five, LGT events still are still not rare, with.5% of trees(8 to 38% of trees) being called as having at least one LGT event. Thisillustrates how difficult it can be to choose a transfer cost for thesemethods and how unreliable the default scores can be.
Often, missing orthologs and discontinuous distributions of homo-logs are also used to infer potential LGT events (Ambrose et al. 2014;Moore et al. 2014; Fitzpatrick et al. 2008; Temporini and Van Etten2004), but these assumptions tend to change as more genomes aresequenced and intermediate genes are found (Khaldi et al. 2008).Finally, many of the tools developed to detect LGT events are basedon phylogenetic methods that have been developed for bacteria, butin practice, fungal phylogenies are much harder to reconstruct thanbacterial phylogenies due to the presence of cryptic intronic sequencesand other sequence complexities. Additionally, the genomes of plant-associated fungi often contain effector genes, which are short andhighly variable (Mesarich et al. 2015), as well as genes involved inthe production of secondary metabolites, which tend to evolve rapidlyand often display a complex modular structure (Berry et al. 2015). Thephylogeny is particularly hard to reconstruct for these genes. Thus, theefficacy of LGT detection tools in fungi, and presumably for othereukaryotes, seems to remain relatively underpowered. In addition tothe deficiencies mentioned above, the phylogeny-based LGT detectionmethods also completely failed to identify either the putative LGT eventof fitD, any other potentially novel LGT events, or any computationallysimulated LGT events. This leads us to express doubt regarding theoverall reliability of these tools for LGT detection in similar eukaryoticdatasets. Indeed, this study highlights the key problem of using incom-pletely annotated genome sequence information for automated LGTprediction. Where orthologs could not be identified in some species,this may not have been due to the absence of these genes in thosespecies, but rather from the sequence simply being missing from thedataset. As missing taxa in gene trees are a potential indicator of LGT(Temporini and Van Etten 2004; Fitzpatrick et al. 2008), this problemwould also confound LGT detection methods.
Overall, this study reveals concerning insight into the deficiencies ofboth composition- and phylogeny-based LGT detectionmethods whenused on complex, uncurated, but typical eukaryotic genome sequencedata. Neither of the broad approaches was capable of identifying aputative LGT event or gave reliable support for any novel LGT event.This is in striking contrast to the large number of claims that routinely
appear in the literature. Additionally, this study exposes the existence ofextremely high variation between gene tree and species tree topologiesacross fungi, showing that thismajor biological patternholdsbeyond theyeasts. An important effect is that this variation will likely confoundphylogeny-based LGT prediction methods. This study concludes thatLGT remains a challenging process to detect, and questionswhether thefloodofLGTeventsappearing in the literature todatearenecessarilywellsupported statistically.
ACKNOWLEDGMENTSWe thank Carla Eaton and anonymous reviewers for thoughtfulcomments on the manuscript. This research was supported by theTertiary Education Commission through a Centre of Research Excel-lence grant from the Bio-Protection Research Centre, and by the RoyalSociety of New Zealand through a Rutherford Fellowship (RDF-10-MAU-001) and Marsden grant (14-MAU-007) to M.P.C.
LITERATURE CITEDAbby, S. S., E. Tannier, M. Gouy, and V. Daubin, 2010 Detecting lateral
gene transfers by statistical reconciliation of phylogenetic forests. BMCBioinformatics 11: 324.
Alsmark, U. C., T. Sicheritz-Ponten, P. G. Foster, R. P. Hirt, and T. M.Embley, 2009 Horizontal gene transfer in eukaryotic parasites: a casestudy of Entamoeba histolytica and Trichomonas vaginalis. Methods Mol.Biol. 532: 489–500.
Ambrose, K. V., A. M. Koppenhofer, and F. C. Belanger, 2014 Horizontalgene transfer of a bacterial insect toxin gene into the Epichloë fungalsymbionts of grasses. Sci. Rep. 4: 5562.
Amselem, J., C. A. Cuomo, J. A. van Kan, M. Viaud, E. P. Benito et al.,2011 Genomic analysis of the necrotrophic fungal pathogens Sclerotiniasclerotiorum and Botrytis cinerea. PLoS Genet. 7(8): e1002230.
Bansal, M. S., E. J. Alm, and M. Kellis, 2012 Efficient algorithms for thereconciliation problem with gene duplication, horizontal transfer andloss. Bioinformatics 28(12): i283–i291.
Beiko, R. G., and M. A. Ragan, 2009 Untangling hybrid phylogenetic sig-nals: horizontal gene transfer and artifacts of phylogenetic reconstruction.Methods Mol. Biol. 532: 241–256.
Berry, D., J. E. Takach, C. L. Schardl, N. D. Charlton, B. Scott et al., 2015 Disparateindependent genetic events disrupt the secondary metabolism geneperA in certain symbiotic Epichloë species. Appl. Environ. Microbiol.81(8): 2797–2807.
Brown, J. R., 2003 Ancient horizontal gene transfer. Nat. Rev. Genet. 4(2):121–132.
Brundrett, M. C., 2002 Coevolution of roots and mycorrhizas of landplants. New Phytol. 154(2): 275–304.
Capella-Gutierrez, S., J. M. Silla-Martinez, and T. Gabaldon, 2009 trimAl: atool for automated alignment trimming in large-scale phylogeneticanalyses. Bioinformatics 25(15): 1972–1973.
Cheeseman, K., J. Ropars, P. Renault, J. Dupont, J. Gouzy et al., 2014 Multiplerecent horizontal transfers of a large genomic region in cheese makingfungi. Nat. Commun. 5: 2876.
Chen, K., D. Durand, and M. Farach-Colton, 2000 NOTUNG: a programfor dating gene duplications and optimizing gene family trees. J. Comput.Biol. 7(3–4): 429–447.
Christensen, M. J., R. J. Bennett, H. A. Ansari, H. Koga, R. D. Johnson et al.,2008 Epichloë endophytes grow by intercalary hyphal extension inelongating grass leaves. Fungal Genet. Biol. 45(2): 84–93.
Comaniciu, D., and P. Meer, 2002 Mean shift: a robust approach towardfeature space analysis. IEEET Pattern Anal 24(5): 603–619.
Condon, B. J., Y. Leng, D. Wu, K. E. Bushley, R. A. Ohm et al., 2013 Comparativegenome structure, secondary metabolite, and effector coding capacityacross Cochliobolus pathogens. PLoS Genet. 9(1): e1003233.
Cortez, D., L. Delaye, A. Lazcano, and A. Becerra, 2009 Composition-basedmethods to identify horizontal gene transfer. Methods Mol. Biol. 532:215–225.
Volume 7 April 2017 | Data Quality Impacts Detection of LGT | 1311
Cortez, D. Q., A. Lazcano, and A. Becerra, 2005 Comparative analysis ofmethodologies for the detection of horizontally transferred genes: a re-assessment of first-order Markov models. In Silico Biol. 5(5–6): 581–592.
Cuomo, C. A., U. Guldener, J. R. Xu, F. Trail, B. G. Turgeon et al., 2007 TheFusarium graminearum genome reveals a link between localized poly-morphism and pathogen specialization. Science 317(5843): 1400–1402.
Danchin, E. G., 2016 Lateral gene transfer in eukaryotes: tip of the icebergor of the ice cube? BMC Biol. 14(1): 101.
Dean, R. A., N. J. Talbot, D. J. Ebbole, M. L. Farman, T. K. Mitchell et al.,2005 The genome sequence of the rice blast fungusMagnaporthe grisea.Nature 434(7036): 980–986.
de Wit, P. J., A. van der Burgt, B. Okmen, I. Stergiopoulos, K. A. Abd-Elsalamet al., 2012 The genomes of the fungal plant pathogens Cladosporiumfulvum and Dothistroma septosporum reveal adaptation to different hostsand lifestyles but also signatures of common ancestry. PLoS Genet. 8(11):e1003088.
Dore, J., M. Perraud, C. Dieryckx, A. Kohler, E. Morin et al., 2015 Comparativegenomics, proteomics and transcriptomics give new insight into theexoproteome of the basidiomycete Hebeloma cylindrosporum and itsinvolvement in ectomycorrhizal symbiosis. New Phytol. 208(4): 1169–1187.
Dupont, P. Y., C. J. Eaton, J. J. Wargent, S. Fechtner, P. Solomon et al.,2015 Fungal endophyte infection of ryegrass reprograms host metabo-lism and alters development. New Phytol. 208(4): 1227–1240.
Eaton, C. J., P. Y. Dupont, P. Solomon, W. Clayton, B. Scott et al., 2015 Acore gene set describes the molecular basis of mutualism and antagonismin Epichloë spp. Mol. Plant Microbe Interact. 28(3): 218–231.
Ebersberger, I., R. de Matos Simoes, A. Kupczok, M. Gube, E. Kothe et al.,2012 A consistent phylogenetic backbone for the fungi. Mol. Biol. Evol.29(5): 1319–1334.
Ester, M., H.-P. Kriegel, S. Jörg, and X. Xu, 1996 A density-based algorithmfor discovering clusters in large spatial databases with noise, pp. 226–231in Proceedings of the Second International Conference on KnowledgeDiscovery and Data Mining. AAAI Press, California.
Firrincieli, A., R. Otillar, A. Salamov, J. Schmutz, Z. Khan et al.,2015 Genome sequence of the plant growth promoting endophyticyeast Rhodotorula graminis WP1. Front. Microbiol. 6: 978.
Fitzpatrick, D. A., 2012 Horizontal gene transfer in fungi. FEMS Microbiol.Lett. 329(1): 1–8.
Fitzpatrick, D. A., M. E. Logue, J. E. Stajich, and G. Butler, 2006 A fungalphylogeny based on 42 complete genomes derived from supertree andcombined gene analysis. BMC Evol. Biol. 6: 99.
Fitzpatrick, D. A., M. E. Logue, and G. Butler, 2008 Evidence of recentinterkingdom horizontal gene transfer between bacteria and Candidaparapsilosis. BMC Evol. Biol. 8(1): 181.
Floudas, D., M. Binder, R. Riley, K. Barry, R. A. Blanchette et al., 2012 ThePaleozoic origin of enzymatic lignin decomposition reconstructed from31 fungal genomes. Science 336(6089): 1715–1719.
Furuya, E. Y., and F. D. Lowy, 2006 Antimicrobial-resistant bacteria in thecommunity setting. Nat. Rev. Microbiol. 4(1): 36–45.
Galtier, N., 2007 A model of horizontal gene transfer and the bacterialphylogeny problem. Syst. Biol. 56(4): 633–642.
Garcia-Vallve, S., A. Romeu, and J. Palau, 2000 Horizontal gene transfer inbacterial and archaeal complete genomes. Genome Res. 10(11): 1719–1725.
Gazis, R., A. Kuo, R. Riley, K. LaButti, A. Lipzen et al., 2016 The genome ofXylona heveae provides a window into fungal endophytism. Fungal Biol.120(1): 26–42.
Gogarten, J. P., and J. P. Townsend, 2005 Horizontal gene transfer, genomeinnovation and evolution. Nat. Rev. Microbiol. 3(9): 679–687.
Grelet, G. A., D. Johnson, E. Paterson, I. C. Anderson, and I. J. Alexander,2009 Reciprocal carbon and nitrogen transfer between an ericaceousdwarf shrub and fungi isolated from Piceirhiza bicolorata ectomycorrhizas.New Phytol. 182(2): 359–366.
Grigoriev, I. V., R. Nikitin, S. Haridas, A. Kuo, R. Ohm et al., 2014 MycoCosmportal: gearing up for 1000 fungal genomes. Nucleic Acids Res. 42(Databaseissue): D699–D704.
Guindon, S., J. F. Dufayard, V. Lefort, M. Anisimova, W. Hordijk et al.,2010 New algorithms and methods to estimate maximum-likelihoodphylogenies: assessing the performance of PhyML 3.0. Syst. Biol. 59(3):307–321.
Gyles, C., and P. Boerlin, 2014 Horizontally transferred genetic elementsand their role in pathogenesis of bacterial disease. Vet. Pathol. 51(2): 328–340.
Hane, J. K., R. G. Lowe, P. S. Solomon, K. C. Tan, C. L. Schoch et al.,2007 Dothideomycete plant interactions illuminated by genome se-quencing and EST analysis of the wheat pathogen Stagonospora nodorum.Plant Cell 19(11): 3347–3368.
Huang, J., W. Si, Q. Deng, P. Li, and S. Yang, 2014 Rapid evolution ofavirulence genes in rice blast fungus Magnaporthe oryzae. BMC Genet.15: 45.
Huerta-Cepas, J., H. Dopazo, J. Dopazo, and T. Gabaldon, 2007 The humanphylome. Genome Biol. 8(6): R109.
Huerta-Cepas, J., J. Dopazo, and T. Gabaldon, 2010 ETE: a Python envi-ronment for tree exploration. BMC Bioinformatics 11: 24.
Jacox, E., C. Chauve, G. J. Szöll}osi, Y. Ponty, and C. Scornavacca,2016 ecceTERA: comprehensive gene tree-species tree reconciliationusing parsimony. Bioinformatics 32(13): 2056–2058.
James, T. Y., F. Kauff, C. L. Schoch, P. B. Matheny, V. Hofstetter et al.,2006 Reconstructing the early evolution of fungi using a six-genephylogeny. Nature 443(7113): 818–822.
Jaron, K. S., J. C. Moravec, and N. Martínková, 2014 SigHunt: horizontalgene transfer finder optimized for eukaryotic genomes. Bioinformatics 30(8): 1081–1086.
Katoh, K., and D. M. Standley, 2013 MAFFT multiple sequence alignmentsoftware version 7: improvements in performance and usability. Mol.Biol. Evol. 30(4): 772–780.
Katoh, K., K. Misawa, K. Kuma, and T. Miyata, 2002 MAFFT: a novelmethod for rapid multiple sequence alignment based on fast Fouriertransform. Nucleic Acids Res. 30(14): 3059–3066.
Kay, E., T. M. Vogel, F. Bertolla, R. Nalin, and P. Simonet, 2002 In situtransfer of antibiotic resistance genes from transgenic (transplastomic)tobacco plants to bacteria. Appl. Environ. Microbiol. 68(7): 3345–3351.
Keeling, P. J., and J. D. Palmer, 2008 Horizontal gene transfer in eukaryoticevolution. Nat. Rev. Genet. 9(8): 605–618.
Khaldi, N., J. Collemare, M.-H. Lebrun, and K. H. Wolfe, 2008 Evidence forhorizontal transfer of a secondary metabolite gene cluster between fungi.Genome Biol. 9(1): 1–10.
Klosterman, S. J., K. V. Subbarao, S. Kang, P. Veronese, S. E. Gold et al.,2011 Comparative genomics yields insights into niche adaptation ofplant vascular wilt pathogens. PLoS Pathog. 7(7): e1002137.
Kohler, A., A. Kuo, L. G. Nagy, E. Morin, K. W. Barry et al., 2015 Convergentlosses of decay mechanisms and rapid turnover of symbiosis genes inmycorrhizal mutualists. Nat. Genet. 47(4): 410–415.
Koski, L. B., R. A. Morton, and G. B. Golding, 2001 Codon bias and basecomposition are poor indicators of horizontally transferred genes. Mol.Biol. Evol. 18(3): 404–412.
Ku, C., S. Nelson-Sathi, M. Roettger, F. L. Sousa, P. J. Lockhart et al.,2015 Endosymbiotic origin and differential loss of eukaryotic genes.Nature 524(7566): 427–432.
Lawrence, J. G., and H. Ochman, 1997 Amelioration of bacterial genomes:rates of change and exchange. J. Mol. Evol. 44(4): 383–397.
Le, S. Q., and O. Gascuel, 2008 An improved general amino acid replace-ment matrix. Mol. Biol. Evol. 25(7): 1307–1320.
Le Quere, A., K. A. Eriksen, B. Rajashekar, A. Schutzendubel, B. Canbacket al., 2006 Screening for rapidly evolving genes in the ectomycorrhizalfungus Paxillus involutus using cDNA microarrays. Mol. Ecol. 15(2):535–550.
Liu, H., Y. Fu, B. Li, X. Yu, J. Xie et al., 2011 Widespread horizontal genetransfer from circular single-stranded DNA viruses to eukaryotic ge-nomes. BMC Evol. Biol. 11: 276.
Liu, Y. J., M. C. Hodson, and B. D. Hall, 2006 Loss of the flagellum happenedonly once in the fungal lineage: phylogenetic structure of Kingdom Fungiinferred from RNA polymerase II subunit genes. BMC Evol. Biol. 6: 74.
1312 | P.-Y. Dupont and M. P. Cox

Ma, L.-J., H. C. van der Does, K. A. Borkovich, J. J. Coleman, M.-J. Daboussiet al., 2010 Comparative genomics reveals mobile pathogenicity chro-mosomes in Fusarium. Nature 464(7287): 367–373.
Maddison, W. P., 1997 Gene trees in species trees. Syst. Biol. 46(3): 523–536.
Mallet, L. V., J. Becq, and P. Deschavanne, 2010 Whole genome evaluationof horizontal transfers in the pathogenic fungus Aspergillus fumigatus.BMC Genomics 11: 171.
Marcet-Houben, M., and T. Gabaldón, 2010 Acquisition of prokaryoticgenes by fungal genomes. Trends Genet. 26(1): 5–8.
Martin, F., A. Aerts, D. Ahren, A. Brun, E. G. Danchin et al., 2008 Thegenome of Laccaria bicolor provides insights into mycorrhizal symbiosis.Nature 452(7183): 88–92.
Martin, F., A. Kohler, C. Murat, R. Balestrini, P. M. Coutinho et al.,2010 Perigord black truffle genome uncovers evolutionary origins andmechanisms of symbiosis. Nature 464(7291): 1033–1038.
Martínez, J. L., 2008 Antibiotics and antibiotic resistance genes in naturalenvironments. Science 321(5887): 365–367.
Menigaud, S., L. Mallet, G. Picord, C. Churlaud, A. Borrel et al., 2012 GOHTAM:a website for ‘genomic origin of horizontal transfers, alignment andmetagenomics.’ Bioinformatics 28(9): 1270–1271.
Mesarich, C. H., J. K. Bowen, C. Hamiaux, and M. D. Templeton, 2015 Repeat-containing protein effectors of plant-associated organisms. Front. Plant Sci. 6:872.
Monier, A., A. Pagarete, C. de Vargas, M. J. Allen, B. Read et al.,2009 Horizontal gene transfer of an entire metabolic pathway be-tween a eukaryotic alga and its DNA virus. Genome Res. 19(8):1441–1449.
Moore, G. G., J. Collemare, M.-H. Lebrun, and R. E. Bradshaw,2014 Evolutionary mechanisms involved in development of fungalsecondary metabolite gene clusters, pp. 341–356 in Natural Products.John Wiley & Sons, Inc., New York.
Moran, Y., D. Fredman, P. Szczesny, M. Grynberg, and U. Technau,2012 Recurrent horizontal transfer of bacterial toxin genes to eukary-otes. Mol. Biol. Evol. 29(9): 2223–2230.
Morel, G., L. Sterck, D. Swennen, M. Marcet-Houben, D. Onesime et al.,2015 Differential gene retention as an evolutionary mechanism togenerate biodiversity and adaptation in yeasts. Sci. Rep. 5: 11571.
Nakamura, Y., T. Itoh, H. Matsuda, and T. Gojobori, 2004 Biased biologicalfunctions of horizontally transferred genes in prokaryotic genomes. Nat.Genet. 36(7): 760–766.
Nguyen, T. H., J.-P. Doyon, S. Pointet, A.-M. A. Chifolleau, V. Ranwezet al., 2012 Accounting for gene tree uncertainties improves genetrees and reconciliation inference, pp. 123–134 in WABI’12: Work-shop on Algorithms in Bioinformatics, September, 2012, Ljubljana,Slovenia.
Nikolaidis, N., N. Doran, and D. J. Cosgrove, 2014 Plant expansins inbacteria and fungi: evolution by horizontal gene transfer and independentdomain fusion. Mol. Biol. Evol. 31(2): 376–386.
O’Connell, R. J., M. R. Thon, S. Hacquard, S. G. Amyotte, J. Kleemann et al.,2012 Lifestyle transitions in plant pathogenic Colletotrichum fungideciphered by genome and transcriptome analyses. Nat. Genet. 44(9):1060–1065.
Ochman, H., J. G. Lawrence, and E. A. Groisman, 2000 Lateral gene transferand the nature of bacterial innovation. Nature 405(6784): 299–304.
Ohm, R. A., N. Feau, B. Henrissat, C. L. Schoch, B. A. Horwitz et al.,2012 Diverse lifestyles and strategies of plant pathogenesis encoded inthe genomes of eighteen Dothideomycetes fungi. PLoS Pathog. 8(12):e1003037.
Ovadia, Y., D. Fielder, C. Conow, and R. Libeskind-Hadas, 2011 The co-phylogeny reconstruction problem is NP-complete. J. Comput. Biol.18(1): 59–65.
Pamilo, P., and M. Nei, 1988 Relationships between gene trees and speciestrees. Mol. Biol. Evol. 5(5): 568–583.
Pedregosa, F., G. Varoquaux, A. Gramfort, V. Michel, B. Thirion et al.,2011 Scikit-learn: machine learning in Python. J. Mach. Learn. Res. 12:2825–2830.
Poptsova, M., 2009 Testing phylogenetic methods to identify horizontalgene transfer. Methods Mol. Biol. 532: 227–240.
Poptsova, M. S., and J. P. Gogarten, 2007 The power of phylogeneticapproaches to detect horizontally transferred genes. BMC Evol. Biol.7: 45.
Ragan, M. A., 2001 On surrogate methods for detecting lateral genetransfer. FEMS Microbiol. Lett. 201(2): 187–191.
Redondo-Nieto, M., M. Barret, J. P. Morrisey, K. Germaine, F. Martinez-Graneroet al., 2012 Genome sequence of the biocontrol strain Pseudomonasfluorescens F113. J. Bacteriol. 194(5): 1273–1274.
Richards, T. A., J. B. Dacks, S. A. Campbell, J. L. Blanchard, P. G. Foster et al.,2006 Evolutionary origins of the eukaryotic shikimate pathway: genefusions, horizontal gene transfer, and endosymbiotic replacements.Eukaryot. Cell 5(9): 1517–1531.
Richards, T. A., D. M. Soanes, P. G. Foster, G. Leonard, C. R. Thornton et al.,2009 Phylogenomic analysis demonstrates a pattern of rare and ancienthorizontal gene transfer between plants and fungi. Plant Cell 21(7): 1897–1911.
Robinson, D. F., and L. R. Foulds, 1981 Comparison of phylogenetic trees.Math. Biosci. 53(1–2): 131–147.
Rogul, M., Z. McGee, R. Wittler, and S. Falkow, 1965 Nucleic acid homol-ogies of selected bacteria, L forms, and Mycoplasma species. J. Bacteriol.90(5): 1200–1204.
Rosewich, U. L., and H. C. Kistler, 2000 Role of horizontal gene transfer inthe evolution of fungi. Annu. Rev. Phytopathol. 38: 325–363.
Rouxel, T., J. Grandaubert, J. K. Hane, C. Hoede, A. P. van de Wouw et al.,2011 Effector diversification within compartments of the Leptosphaeriamaculans genome affected by repeat-induced point mutations. Nat.Commun. 2: 202.
Salichos, L., and A. Rokas, 2011 Evaluating ortholog prediction algorithmsin a yeast model clade. PLoS One 6(4): e18755.
Salichos, L., and A. Rokas, 2013 Inferring ancient divergences requiresgenes with strong phylogenetic signals. Nature 497(7449): 327–331.
Sayers, E. W., T. Barrett, D. A. Benson, S. H. Bryant, K. Canese et al.,2009 Database resources of the national center for biotechnology in-formation. Nucleic Acids Res. 37(Database issue): D5–D15.
Schardl, C. L., 2001 Epichloë festucae and related mutualistic symbionts ofgrasses. Fungal Genet. Biol. 33(2): 69–82.
Schardl, C. L., C. A. Young, U. Hesse, S. G. Amyotte, K. Andreeva et al.,2013 Plant-symbiotic fungi as chemical engineers: multi-genome anal-ysis of the Clavicipitaceae reveals dynamics of alkaloid loci. PLoS Genet.9(2): e1003323.
Schirawski, J., G. Mannhaupt, K. Munch, T. Brefort, K. Schipper et al.,2010 Pathogenicity determinants in smut fungi revealed by genomecomparison. Science 330(6010): 1546–1548.
Shapiro, J. A., 1969 Mutations caused by the insertion of genetic materialinto the galactose operon of Escherichia coli. J. Mol. Biol. 40(1): 93–105.
Sharp, P. M., and W. H. Li, 1987 The codon adaptation index—a measureof directional synonymous codon usage bias, and its potential applica-tions. Nucleic Acids Res. 15(3): 1281–1295.
Soanes, D., and T. A. Richards, 2014 Horizontal gene transfer in eukaryoticplant pathogens. Annu. Rev. Phytopathol. 52: 583–614.
Soucy, S. M., J. Huang, and J. P. Gogarten, 2015 Horizontal gene transfer:building the web of life. Nat. Rev. Genet. 16(8): 472–482.
Spanu, P. D., J. C. Abbott, J. Amselem, T. A. Burgis, D. M. Soanes et al.,2010 Genome expansion and gene loss in powdery mildew fungi revealtradeoffs in extreme parasitism. Science 330(6010): 1543–1546.
Sprague, G. F., Jr, 1991 Genetic exchange between kingdoms. Curr. Opin.Genet. Dev. 1(4): 530–533.
Staats, M., and J. A. van Kan, 2012 Genome update of Botrytis cinereastrains B05.10 and T4. Eukaryot. Cell 11(11): 1413–1414.
Stolzer, M., H. Lai, M. Xu, D. Sathaye, B. Vernot et al., 2012 Inferringduplications, losses, transfers and incomplete lineage sorting with non-binary species trees. Bioinformatics 28(18): i409–i415.
Sun, X., Q. Yang, and X. Xia, 2013 An improved implementation of ef-fective number of codons (Nc). Mol. Biol. Evol. 30(1): 191–196.
Syvanen, M., 1994 Horizontal gene transfer: evidence and possible conse-quences. Annu. Rev. Genet. 28: 237–261.
Volume 7 April 2017 | Data Quality Impacts Detection of LGT | 1313
Szöll}osi, G. J., A. A. Davin, E. Tannier, V. Daubin, and B. Boussau,2015 Genome-scale phylogenetic analysis finds extensive gene transferamong fungi. Philos. Trans. R. Soc. B Biol. Sci. 370(1678): 20140335.
Tanaka, A., M. J. Christensen, D. Takemoto, P. Park, and B. Scott,2006 Reactive oxygen species play a role in regulating a fungus-perennial ryegrass mutualistic interaction. Plant Cell 18(4): 1052–1066.
Temporini, E., and H. Van Etten, 2004 An analysis of the pea patho-genicity genes of Nectria haematococca MPVI supports the hypothesisof their origin by horizontal transfer and uncovers a potentially newpathogen of garden pea: Neocosmospora boniensis. Curr. Genet. 46:29–36.
Terhorst, C. P., J. T. Lennon, and J. A. Lau, 2014 The relative importance ofrapid evolution for plant-microbe interactions depends on ecologicalcontext. Proc. Biol. Sci. 281(1785): 20140028.
Than, C., D. Ruths, H. Innan, and L. Nakhleh, 2007 Confounding factors inHGT detection: statistical error, coalescent effects, and multiple solutions.J. Comput. Biol. 14(4): 517–535.
Toome, M., R. A. Ohm, R. W. Riley, T. Y. James, K. L. Lazarus et al.,2014 Genome sequencing provides insight into the reproductivebiology, nutritional mode and ploidy of the fern pathogen Mixiaosmundae. New Phytol. 202(2): 554–564.
Tyler, B. M., S. Tripathy, X. Zhang, P. Dehal, R. H. Jiang et al., 2006 Phytophthoragenome sequences uncover evolutionary origins and mechanisms of patho-genesis. Science 313(5791): 1261–1266.
Wägele, J. W., and C. Mayer, 2007 Visualizing differences in phylogeneticinformation content of alignments and distinction of three classes oflong-branch effects. BMC Evol. Biol. 7: 147.
Wang, H., Z. Xu, L. Gao, and B. Hao, 2009 A fungal phylogeny based on82 complete genomes using the composition vector method. BMC Evol.Biol. 9: 195.
Weyenberg, G., P. M. Huggins, C. L. Schardl, D. K. Howe, and R. Yoshida,2014 kdetrees: non-parametric estimation of phylogenetic tree distri-butions. Bioinformatics 30(16): 2280–2287.
Whidden, C., N. Zeh, and R. G. Beiko, 2014 Supertrees based on the subtreeprune-and-regraft distance. Syst. Biol. 63(4): 566–581.
Wisecaver, J. H., J. C. Slot, and A. Rokas, 2014 The evolution of fungalmetabolic pathways. PLoS Genet. 10(12): e1004816.
Wright, F., 1990 The ‘effective number of codons’ used in a gene. Gene87(1): 23–29.
Zhaxybayeva, O., 2009 Detection and quantitative assessment of horizontalgene transfer. Methods Mol. Biol. 532: 195–213.
Communicating editor: R. Kulathinal
1314 | P.-Y. Dupont and M. P. Cox