a comprehensive genomic scan reveals gene dosage balance ... · a comprehensive genomic scan...
TRANSCRIPT
A comprehensive genomic scan reveals gene dosagebalance impacts on quantitative traits in Populus treesHéloïse Bastiaansea,b, Matthew Zinkgrafa,1, Courtney Canninga, Helen Tsaib,c, Meric Liebermanb,c, Luca Comaib,c,Isabelle Henryb,c, and Andrew Groovera,b,2
aPacific Southwest Research Station, US Department of Agriculture Forest Service, Davis, CA 95618; bDepartment of Plant Biology, University of California,Davis, CA 95616; and cGenome Center, University of California, Davis, CA 95616
Edited by James A. Birchler, Division of Biological Sciences, University of Missouri, Columbia, MO, and approved May 24, 2019 (received for review February22, 2019)
Gene dosage variation and the associated changes in gene expres-sion influence a wide variety of traits, ranging from cancer inhumans to yield in plants. It is also expected to affect importanttraits of ecological and agronomic importance in forest trees, but thisvariation has not been systematically characterized or exploited.Here we performed a comprehensive scan of the Populus genomefor dosage-sensitive loci affecting quantitative trait variation forspring and fall phenology and biomass production. The study pop-ulation was a large collection of clonally propagated F1 hybrid linesof Populus that saturate the genome 10-fold with deletions andinsertions (indels) of known sizes and positions. As a group, thephenotypic means of the indel lines consistently differed from con-trol nonindel lines, with an overall negative effect of both insertionsand deletions on all biomass-related traits but more diverse effectsand an overall wider phenotypic distribution of the indel lines for thephenology-related traits. We also investigated the correlation be-tween gene dosage at specific chromosomal locations and pheno-type, to identify dosage quantitative trait loci (dQTL). Such dQTLwere detected for most phenotypes examined, but stronger effectdQTL were identified for the phenology-related traits than for thebiomass traits. Our genome-wide screen for dosage sensitivity in ahigher eukaryote demonstrates the importance of global genomicbalance and the impact of dosage on life history traits.
gene dosage | quantitative trait | forest trees | genome balance |copy number variation
The causative factors underlying quantitative trait variationhave been modeled and debated for over a century. Notably,
Fisher’s seminal work provided the statistical framework formodeling quantitative trait variation as the cumulative effects ofindividual genes, whose alleles can exert additive, dominance,and epistatic effects (1). Today, DNA sequencing technologyenables genome-wide survey of allelic variation, yet significantgaps remain in the ability to fully explain the observed pheno-typic variation. Structural variation, including copy number var-iation (CNV), has been shown to affect many traits in plants andanimals (1–7), although its relevance remains to be assessed atthe genome-wide level.Mechanistically, structural variation can change the relative
dosage of affected genes, which in turn can affect the concen-tration of the encoded protein or RNA product in proportion togene copy number (1, 8). If a molecular pathway contributing toa phenotypic trait is sensitive to dosage, a quantitative variationof the phenotypic trait results. Differences in gene copy number(or in cis-regulatory regions) have been identified as causalvariants of previously identified plant quantitative trait loci(QTL), in contrast to differences in protein sequence (9, 10). Sofar, such DNA structural variations are incompletely assessed bycommon genotyping approaches, and dosage effects may notnecessarily conform to traditional quantitative genetic models.CNV and dosage may thus contribute to the missing heritabilityof traditional mapping studies (11). Data so far have focusedmostly on domesticated crops of agricultural importance andsuggest that although present over thousands of sites, naturally
occurring CNV occurs more frequently in gene-poor regions (12)and usually only encompasses a small proportion of the genome.For instance, in apple, maize, and barley, natural CNV has beendetected only in 3.5, 10, and 14.9% of the genome, respectively (6,13, 14), and therefore does not provide the power to systematicallysurvey the effect of gene dosage variation on plant function.Perennial growth is a fundamental feature of forest trees that
is not shared by herbaceous annual model plants such as Ara-bidopsis or maize. Temperate trees have strictly regulated phe-nology, controlling the timing of onset of dormancy inpreparation for winter and the breaking of dormancy and initi-ation of growth in the spring (15). Phenology thus describesadaptive traits that balance maximizing the growing season whileminimizing the danger of frost damage (16). Temperature andphotoperiod are key agents in controlling phenology in mosttemperate woody plants (16–19). Typical of temperate trees,Populus species primarily respond to shortening photoperiods inthe late summer/early fall by developing vegetative buds con-taining preformed shoots and leaves, followed by cessation ofgrowth and dormancy (20). Exposure to a cumulative amount ofcold temperatures during the winter is needed to establishcompetency to respond to returning warm temperatures in thespring resulting in outgrowth of the preformed stems and leaves(bud burst). Phenology is a major determinant of geographical
Significance
Phenotypic trait variation can be linked to genomic sequencevariation. These differences range from a single nucleotide tolarger insertion and deletion (indel) of chromosomal segments.Indels can change the copy number of affected genes, whichcan create complex phenotypic trait variation through effectson gene expression. For example, gene dosage variation hasbeen associated with various human chronic diseases. Here wesystematically explored the effect of induced gene dosagevariation on quantitative trait variation in Populus. We showthat gene dosage variation at specific chromosomal locationsand also gene dosage balance at a global genomic scale areboth major determinants of quantitative trait variation ina plant species.
Author contributions: H.B., M.Z., L.C., I.H., and A.G. designed research; H.B., M.Z., C.C.,H.T., and M.L. performed research; H.B., L.C., and I.H. analyzed data; and H.B. wrotethe paper.
The authors declare no conflict of interest.
This article is a PNAS Direct Submission.
Published under the PNAS license.
Data deposition: The sequences reported in this paper have been deposited in the Na-tional Center for Biotechnology Information BioProject database (accession no.PRJNA241273).1Present address: College of Science and Engineering, Western Washington University,Bellingham, WA 98225-9063.
2To whom correspondence may be addressed. Email: [email protected].
This article contains supporting information online at www.pnas.org/lookup/suppl/doi:10.1073/pnas.1903229116/-/DCSupplemental.
Published online June 18, 2019.
13690–13699 | PNAS | July 2, 2019 | vol. 116 | no. 27 www.pnas.org/cgi/doi/10.1073/pnas.1903229116
Dow
nloa
ded
by g
uest
on
May
7, 2
020
range (21), affects species migration in response to climatechange, and is correlated with biomass traits important forcommercial forestry and bioenergy application.The genetic control of phenology and biomass traits in Populus
species has been examined at the population and moleculargenetic levels. Population genomics of Populus trichocarpaand Populus tremula identified strong genetic differentiationaccording to their geographical origin (22–24). Interestingly, inboth species, such genomic regions that were associated withpositive and/or divergent selection were also found to beenriched with candidate genes related to phenology. This trendreveals the importance of natural selection in phenotypic treeadaptation (23). At the molecular level, there is evidence ofcooption or cross talk between Arabidopsis flowering/seed dor-mancy pathways and the regulation of bud set in Populus, as wellas in other plant species (25–28). Such shared pathways revealedthe importance of the phytohormone abscisic acid (ABA) (29,30) as well as components of the CONSTANS/FLOWERINGLOCUS T (FT) regulatory module (25, 31, 32) and GIGANTEA(GI)-like genes (33). Recent studies described a key componentof bud break in hybrid aspen: the transcription factor SHORTVEGETATIVE PHASE-LIKE (SVL), closely related to Arabi-dopsis floral repressor SHORT VEGETATIVE PHASE and itsdownstream target TCP18, a tree homolog of a branching reg-ulator in Arabidopsis (34).In association and QTL mapping studies, variation in pheno-
logical traits in Populus is typically attributed to many genes withmodest contributions (22, 35–37). The genetic control of woodybiomass yield is particularly complex as it represents the integratedand combined result of many complex traits, each themselvesunder polygenic control (38). Breeding for increased biomass yieldtherefore requires understanding the various components con-tributing to the traits. Even recent studies using genome rese-quencing data from Populus leaf tissue leave significant portions ofthe observed phenotypic variation unexplained (39), suggestingthat additional sources of genetic variation may be overlooked.Interestingly, a high frequency of naturally occurring structuralvariation that is typically undetected by traditional genotypingmethods has been reported for Populus species (40), although therole in phenotypic trait variation within and among these un-domesticated species has not yet been explored.Induced dosage variation can be used to systematically dissect
quantitative traits. This approach provides the obvious advantageof potentially identifying loci for which no natural variation isavailable in the sampled gene pool. For instance, induced mu-tations have been used to improve major crops such as wheat,rice, barley, cotton, peanuts, and beans (41). While difficult tomaintain and robustly assess in sexual species, it is easily main-tained in clonally propagated species such as Populus. In a pre-vious study (42), we created a dosage-based functional genomictool for Populus, a clonally propagated woody model species.This irradiated hybrid mutant population includes >500 siblinglines that collectively contain insertions and deletions coveringthe full genome multiple times.Here we used this population to investigate the effect of dosage
variation on complex traits central to forest biology, phenology,and biomass production. Genome scans revealed the influence ofgene dosage on the phenotypic trait variation, including identifi-cation of dosage QTL (dQTL) that can modulate biomass andphenology traits. Overall, our results illustrate the central role ofgene dosage in quantitative trait variation and can now be ex-tended to understand the role of naturally occurring dosage var-iation for ecologically and economically important traits.
ResultsIn a previous work, we reported the development of a populationof Populus dosage variants, consisting of a large number of in-terspecific F1 hybrids carrying insertion and deletion (indel)mutations induced by gamma irradiation of pollen grains (42)(Fig. 1). This population was comprised of two full-sib pedigrees,sharing the same Populus nigra male parent but two distinct
Populus deltoides female parents (Materials and Methods). Herewe characterized a second set of F1 hybrids from the samecrosses, for a full population of 646 lines. We phenotyped 592 ofthese lines in a replicated field trial (SI Appendix, AdditionalTable 1), carrying structural variation similar to that previouslydescribed (SI Appendix, Additional Table 2). Briefly, ∼58% ofthe irradiated lines carried indel mutations, of which 71% weredeletions and 29% were insertions. Most irradiation mutantswere diploid, but triploid individuals were also recovered, whichon average carried more mutations than their diploid counter-parts. Indels spanned the 19 chromosomes of Populus, with eachregion being affected by at least 1 indel and at most 31, with anaverage of 10 indels per chromosomal region (SI Appendix,Additional Figs. 1 and 2). Only 6.2 Mbp (∼1.6%) of the 19 as-sembled chromosomes lacked any indel, corresponding to132 genes in the reference P. trichocarpa genome (SI Appendix,Additional Table 3). It is possible that indels in these regionsimpair plant fitness or simply that by chance no indels were re-covered in these regions. Indel mutations varied in length (from0.3 Mbp and up to a whole chromosome) and number, with asingle individual carrying up to 13 indels.
Dosage Variation Is Associated with Phenotypic Variation. Individualirradiation indel lines were phenotyped in a replicated experi-mental field. In the spring, we followed the progression of thefoliar bud expansion, from fully closed to fully flushed. In thefall, we recorded the progression of the leaf yellowing and leafsenescence throughout the canopy. From these data, the greencanopy duration was estimated as the time between total budflush to total leaf yellowing. Finally, throughout the year, wecharacterized the trees for various biomass related traits in-cluding tree height, diameter at the base, breast height diameter,and volume. After two growing seasons, trees were harvested andweighed. The following growing season, the total number ofstems sprouting from stumps of the coppiced trees was recorded.We investigated the overall effect of indel mutations across
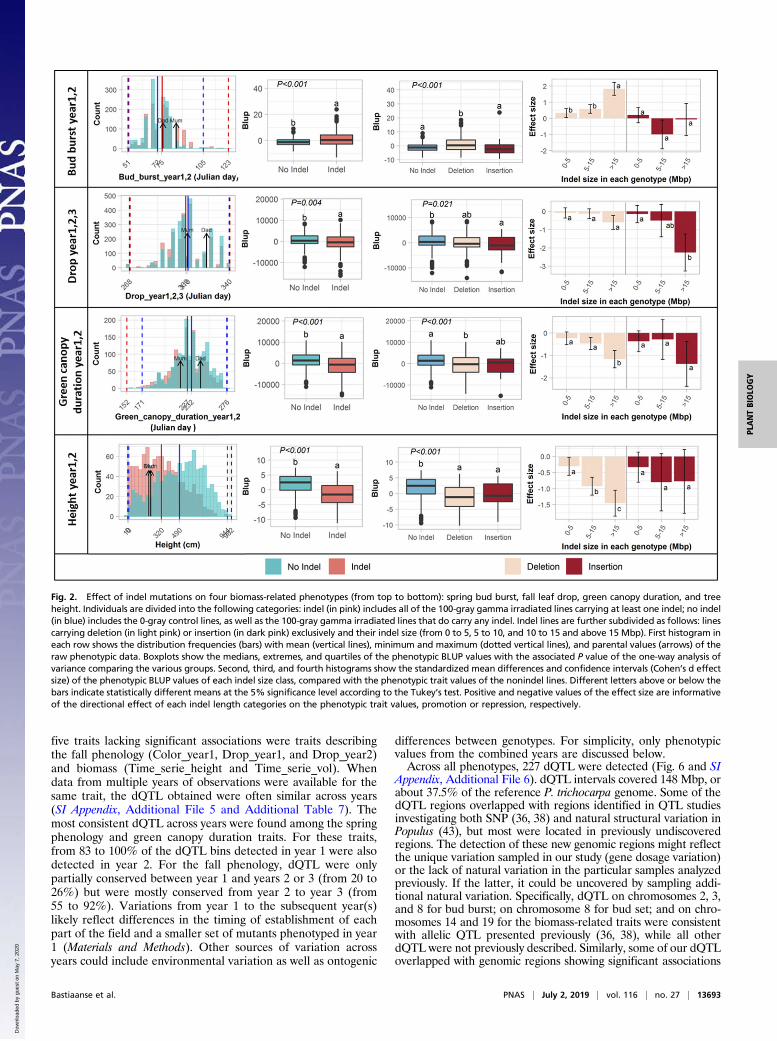
the whole genome on each phenotype. First, we compared themean phenotypic value of all indel lines collectively (lines car-rying at least one indel) to the mean phenotypic value of allnonindel lines (control 0 gray and 100 gray-irradiated lines withno detectable indel) to reveal the general trend of indel effectson phenotypes. For the vast majority of the traits (94%), analysisof variance demonstrated significant differences (at P < 0.001;Fig. 2, Table 1, and SI Appendix, Additional File 1) in meanphenotypic trait values between the two groups. On average,indel lines tended to flush 3 d later in the spring and drop theirleaves 1 d earlier in the fall, resulting in a 5 d shorter period ofgreen canopies. The most striking differences were among thebiomass-related traits, for which on average indels always nega-tively affected the phenotype. Indel lines were on average shorterby 170 cm in height. On the other hand, when examining thephenotypic distribution, we determined that extreme pheno-types, in either direction, were more frequently observed amongthe indel lines than in the control nonindel lines. In addition, forsome traits, the indel lines also exhibited an overall wider phe-notypic distribution (Fig. 2 and SI Appendix, Additional File 2).For instance, some of the indel lines flushed more than 18 d afterthe latest nonindel control line. Similarly, indel-carrying linesexhibited a green canopy for up to 19 fewer days. Overall, thephenotype of the indel lines tended to be more similar to that ofthe maternal parent compared with their sibling nonindel lines.Next, we investigated the effect of indel types (insertions
versus deletions) and their lengths on the phenotypic trait values.For most traits (75%), lines carrying either indel type were onaverage significantly different from the nonindel controls (Fig. 2,Table 1, and SI Appendix, Additional File 3). In addition, whensignificant, deletions and insertions affected the phenotype in thesame direction (Table 1). Finally, for 75% of the traits, longerdeletions had increasing effect on the phenotypic trait values,measured as the Cohen’s d effect size compared with nonindellines (Fig. 2, Table 1, and SI Appendix, Additional File 4).
Bastiaanse et al. PNAS | July 2, 2019 | vol. 116 | no. 27 | 13691
PLANTBIOLO
GY
Dow
nloa
ded
by g
uest
on
May
7, 2
020
However, apart from the leaf drop trait, this did not hold true forthe insertions; that is, longer insertions did not further affect thephenotypic trait values compared with shorter insertions.
Phenotypic Trait Values Are Correlated and Heritable. We in-vestigated the correlation among phenotypic traits, a criticalconsideration when breeding for multiple traits. High positivecorrelations were found among the biomass-related traits (r >0.9), including tree volume, height, weight, diameter at the base,diameter at breast height, and coppicing response (Fig. 3 and SIAppendix, Additional Table 4). Low to moderate positive cor-relations (r from 0.3 to 0.4) were found between the fall phe-nology traits (leaf color and leaf drop) and the biomass-relatedtraits. Low negative correlations (r from −0.4 to −0.3) werefound between the spring phenology (bud burst) trait and thebiomass-related traits, as well as between the spring and fallphenology traits. Finally, moderate positive correlations werefound between the green canopy duration and the biomass-related traits (r from 0.5 to 0.6).We also determined the heritability of each trait, to measure
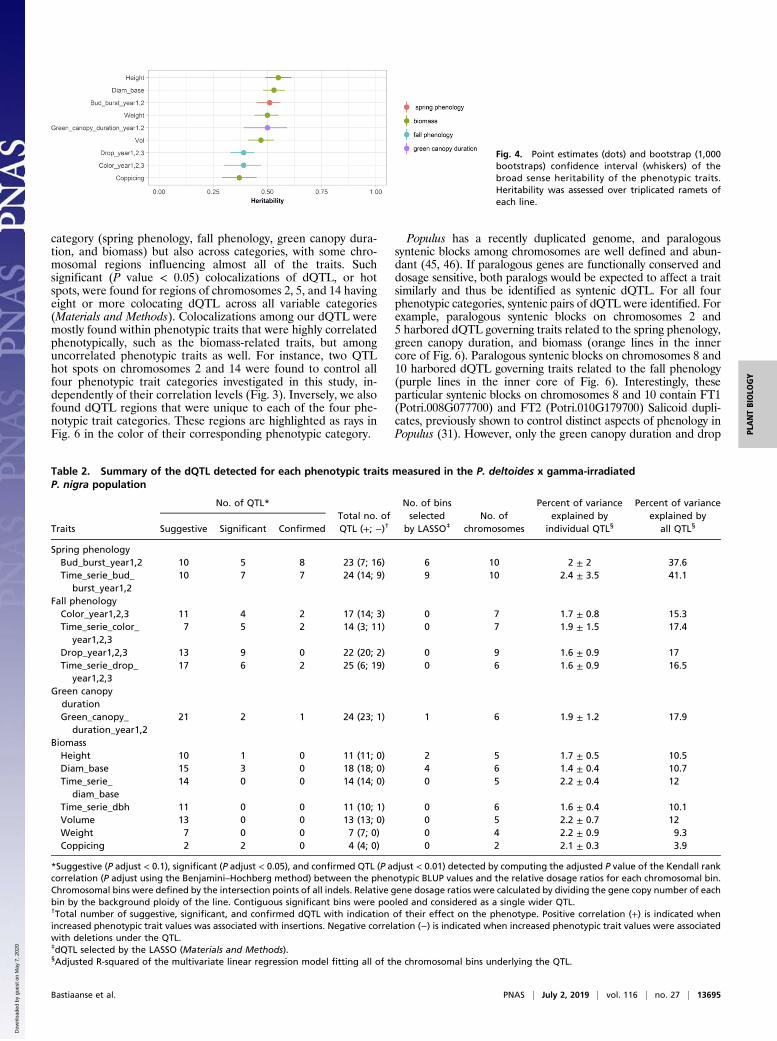
the contribution of phenotypic variation attributable to the ge-notypic variation. Broad-sense heritability (H2) was estimated foreach trait, by dividing the total genetic variance among the threeclonal replicates of each line, by the total phenotypic variance.Overall, low heritability levels (H2 < 0.2) were obtained for thetime series data, while moderate (0.2 < H2 < 0.4) to high heri-tability levels (>0.4) were observed for the rest of the phenotypictraits (Fig. 4 and SI Appendix, Additional Table 5). Among themoderately heritable traits were the coppicing response, leafdrop, and leaf color. Highly heritable traits included the biomass-related traits (tree volume, weight, base diameter, and height),the spring phenology (bud burst), and the green canopy duration(Fig. 4 and SI Appendix, Additional Table 5).
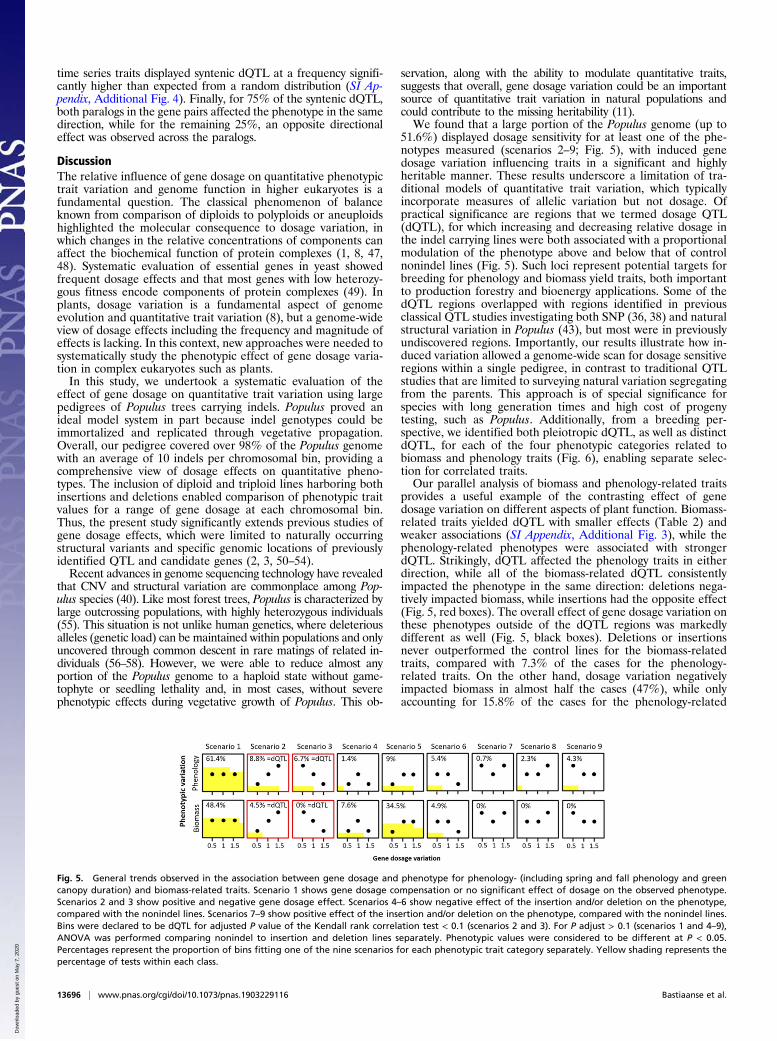
Genetic Contributions to Phenotypic Variation Can Be Assigned todQTL. To investigate the effect of dosage variation of specificchromosomal regions on phenotypic traits, we divided the genomeinto nonoverlapping chromosomal bins based on indel boundariesand estimated the correlation between gene dosage in each ofthese bins and phenotypic trait values (Fig. 5). We identified ninepossible scenarios describing the relationship between dosage andphenotype. In scenario 1, representing the majority of the tests(61.4 and 48.4% for phenology and biomass, respectively), neitherinsertion nor deletion lines were different from the nonindel lines(adjusted P value Kendall rank < 0.1 and P value ANOVA > 0.05),suggesting either gene dosage compensation or no significant effectof dosage variation for these regions on the observed phenotypes(reviewed in ref. 1). In scenarios 2 and 3, a significant positive orinverse correlation, respectively, was found between gene dosageand phenotypic trait values (adjusted P value Kendall rank < 0.1).These bins defined the intervals of dQTL and represented 16 and5% of the tests for the phenology- and biomass-related traits, re-spectively. For the phenology traits, both direct (8.8%) and inversecorrelations were detected (6.7% of the tests), while for thebiomass-related traits, only direct correlations were observed (4.5%of the tests). Finally, uncorrelated bins were identified that showeda negative (scenarios 4–6) or positive (scenarios 7–9) effect (P valueANOVA < 0.05) of one or both types of indel compared with thenonindel control lines. While scenarios 7–9 represented about 7.3%of the tests for the phenology-related traits, these were not observedamong the biomass-related traits. An overall higher frequency ofrepressive effect for both insertion and deletion in these particularbins (scenarios 4–6) is consistent with our previous description ofthe overall effects of indels on the traits analyzed here (Fig. 2).dQTL were identified for 29/34 phenotypic traits (SI Appendix,
Additional File 5) and were located on 16 of the 19 Populuschromosomes (Fig. 6 and SI Appendix, Additional Table 6). The
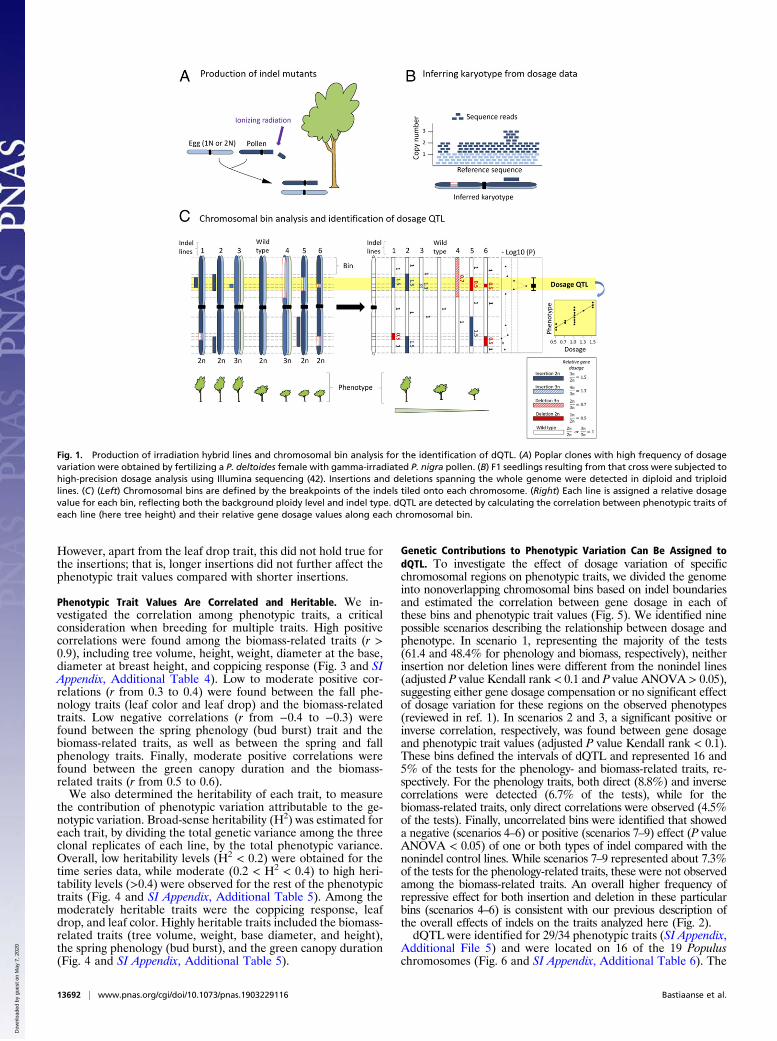
Fig. 1. Production of irradiation hybrid lines and chromosomal bin analysis for the identification of dQTL. (A) Poplar clones with high frequency of dosagevariation were obtained by fertilizing a P. deltoides female with gamma-irradiated P. nigra pollen. (B) F1 seedlings resulting from that cross were subjected tohigh-precision dosage analysis using Illumina sequencing (42). Insertions and deletions spanning the whole genome were detected in diploid and triploidlines. (C) (Left) Chromosomal bins are defined by the breakpoints of the indels tiled onto each chromosome. (Right) Each line is assigned a relative dosagevalue for each bin, reflecting both the background ploidy level and indel type. dQTL are detected by calculating the correlation between phenotypic traits ofeach line (here tree height) and their relative gene dosage values along each chromosomal bin.
13692 | www.pnas.org/cgi/doi/10.1073/pnas.1903229116 Bastiaanse et al.
Dow
nloa
ded
by g
uest
on
May
7, 2
020
five traits lacking significant associations were traits describingthe fall phenology (Color_year1, Drop_year1, and Drop_year2)and biomass (Time_serie_height and Time_serie_vol). Whendata from multiple years of observations were available for thesame trait, the dQTL obtained were often similar across years(SI Appendix, Additional File 5 and Additional Table 7). Themost consistent dQTL across years were found among the springphenology and green canopy duration traits. For these traits,from 83 to 100% of the dQTL bins detected in year 1 were alsodetected in year 2. For the fall phenology, dQTL were onlypartially conserved between year 1 and years 2 or 3 (from 20 to26%) but were mostly conserved from year 2 to year 3 (from55 to 92%). Variations from year 1 to the subsequent year(s)likely reflect differences in the timing of establishment of eachpart of the field and a smaller set of mutants phenotyped in year1 (Materials and Methods). Other sources of variation acrossyears could include environmental variation as well as ontogenic
differences between genotypes. For simplicity, only phenotypicvalues from the combined years are discussed below.Across all phenotypes, 227 dQTL were detected (Fig. 6 and SI
Appendix, Additional File 6). dQTL intervals covered 148 Mbp, orabout 37.5% of the reference P. trichocarpa genome. Some of thedQTL regions overlapped with regions identified in QTL studiesinvestigating both SNP (36, 38) and natural structural variation inPopulus (43), but most were located in previously undiscoveredregions. The detection of these new genomic regions might reflectthe unique variation sampled in our study (gene dosage variation)or the lack of natural variation in the particular samples analyzedpreviously. If the latter, it could be uncovered by sampling addi-tional natural variation. Specifically, dQTL on chromosomes 2, 3,and 8 for bud burst; on chromosome 8 for bud set; and on chro-mosomes 14 and 19 for the biomass-related traits were consistentwith allelic QTL presented previously (36, 38), while all otherdQTL were not previously described. Similarly, some of our dQTLoverlapped with genomic regions showing significant associations
Fig. 2. Effect of indel mutations on four biomass-related phenotypes (from top to bottom): spring bud burst, fall leaf drop, green canopy duration, and treeheight. Individuals are divided into the following categories: indel (in pink) includes all of the 100-gray gamma irradiated lines carrying at least one indel; no indel(in blue) includes the 0-gray control lines, as well as the 100-gray gamma irradiated lines that do carry any indel. Indel lines are further subdivided as follows: linescarrying deletion (in light pink) or insertion (in dark pink) exclusively and their indel size (from 0 to 5, 5 to 10, and 10 to 15 and above 15 Mbp). First histogram ineach row shows the distribution frequencies (bars) with mean (vertical lines), minimum and maximum (dotted vertical lines), and parental values (arrows) of theraw phenotypic data. Boxplots show the medians, extremes, and quartiles of the phenotypic BLUP values with the associated P value of the one-way analysis ofvariance comparing the various groups. Second, third, and fourth histograms show the standardized mean differences and confidence intervals (Cohen’s d effectsize) of the phenotypic BLUP values of each indel size class, compared with the phenotypic trait values of the nonindel lines. Different letters above or below thebars indicate statistically different means at the 5% significance level according to the Tukey’s test. Positive and negative values of the effect size are informativeof the directional effect of each indel length categories on the phenotypic trait values, promotion or repression, respectively.
Bastiaanse et al. PNAS | July 2, 2019 | vol. 116 | no. 27 | 13693
PLANTBIOLO
GY
Dow
nloa
ded
by g
uest
on
May
7, 2
020

between natural CNV in Balsam poplar (Potri.001G063700,Potri.001G222900, Potri.001G223200, Potri.001G427200,Potri.004G110200, Potri.005G013100, and Potri.015G018600)and adaptive phenological traits variation (43). Overall, dQTLwere not limited to regions covered by many indels, but the sta-tistical power to detect dQTL varied, depending on the number oflines carrying indels spanning each particular genomic bin (SIAppendix, Additional Fig. 3 A and B). It is therefore possible thatin some cases, a single locus resulted in multiple dQTL locatednext to each other due to bin-to-bin variation in statistical power.The survey of the genome for dQTL was extensive, with all but 6.2
Mbp (1.6%) of the Populus genome covered by at least one indel.Interestingly, uncovered regions overlapped with gene-poor re-gions on the annotated P. trichocarpa genome (compare Fig. 6Bwith the gene density of Fig. 6C), and possibly correspond topericentromeric regions, as described in ref. 42.To reduce dQTL intervals and select the best predictors
among the significant bins, least absolute shrinkage and selectionoperator (LASSO) regression was used to impose shrinkage andsparsity on the number and magnitude of regression coefficients(44). The LASSO regression procedure narrowed dQTL inter-vals and selected a subset of 24 bins among the 1,073 significantbins detected by Kendall rank correlation. Most of these LASSOsubsetted bins (71%) also showed high correlation levelsaccording to the Kendall rank correlation test (adjusted Pvalue < 0.01) as opposed to the lower correlation levels (adjustedP value <0.05 and <0.1) (SI Appendix, Additional Table 8).
Dosage Variation Does Not Affect All Traits Equally. We comparedthe number of dQTL and their influence across all phenotypictrait categories (Table 2 and SI Appendix, Additional File 7).Overall, phenology-related traits (bud burst, leaf drop, and greencanopy duration) were influenced by a higher number of dQTLand spanned more chromosomes (up to 25 dQTL and 10 chro-mosomes) than the biomass-related traits (up to 18 dQTL and6 chromosomes). These phenology-related dQTL also hadstronger association (significant and confirmed association, Padjust <0.05 and <0.01, respectively) and cumulatively explaineda greater proportion of variance (up to 38%) than the biomass-related dQTL (no confirmed association P adjust < 0.01 and nomore than 12% of the variance explained). Irrespective of thetrait, individual dQTL explained a relatively small proportion ofthe variance (from 1.4 to 2.4%). Finally, increased relative genedosage under dQTL bins could either promote or repress thephenotype, except for the biomass-related traits, for which in-creased relative gene dosage under the dQTL bins was alwaysassociated with taller/bigger trees. Inversely, apart from onedQTL, decreased relative gene dosage under the dQTL bins wasalways associated with shorter, smaller-diameter trees.
Genomic Organization of the dQTL Reveals Hot Spots and SyntenicRelationships. Because we are investigating the genetic control ofcontrasting phenotypic traits, we next examined the distributionand extent of colocalization of these dQTL. We found colocal-ization of dQTL for individual phenotypic traits within each trait
Table 1. Summary of the effect of indels on the various phenotypic traits
TraitControl nonindel–
indelControl nonindel–
deletionControl nonindel–
insertionInsertion–deletion
Effect sizeinsertion
Effect sizedeletion
Bud_burst_year1,2 Indel < C*** C < Del*** NS Ins < Del* NS +***Time_serie_bud_burst_year1,2 C > indel*** C > Del*** NS Ins > Del* NS −*Color_year1,2,3 C > indel** NS C > Ins** Ins < Del* NS NSTime_serie_color_year1,2,3 Indel < C* NS C < Ins** NS NS NSDrop_year1,2,3 C > indel** NS C > Ins* NS −* NSTime_serie_drop_year1,2,3 NS NS C < Ins* NS NS NSGreen_canopy_duration_year1,2 C > indel*** C > Del*** C > Ins* NS NS −**Height C > indel*** C > Del*** C > Ins* NS NS −***Time_serie_height C > indel*** C > Del*** C > Ins* NS NS −***Diam_base C > indel*** C > Del*** C > Ins* NS NS −***Time_serie_diam_base C > indel*** C > Del*** C > Ins* NS NS −***Time_serie_dbh C > indel*** C > Del*** NS NS NS −***Time_serie_vol C > indel*** C > Del*** C > Ins* NS NS −***Volume C > indel*** C > Del*** C > Ins* NS NS −***Weight C > indel*** C > Del*** C > Ins* NS NS −***Coppicing C > indel*** C > Del*** C > Ins** NS NS −***% of significant traits (P < 0.05) 94% 75% 81% 19% 6% 75%
C, control nonindel lines; Del, deletion lines; Ins, insertion lines; NS, not significant. *, **, and *** indicate P value significance of the ANOVA analyzing theBLUP of each trait groups at P < 0.05, P < 0.01, and P < 0.001, respectively. + and − indicates the direction of the effect size when comparing the mean BLUP ofdeletion or insertion relative to the nonindel lines.
Fig. 3. Pairwise Pearson correlation matrix of the phenotypic traits. Redindicates positive correlation, and blue indicates negative correlation.Darker colors are associated with stronger correlation coefficients.
13694 | www.pnas.org/cgi/doi/10.1073/pnas.1903229116 Bastiaanse et al.
Dow
nloa
ded
by g
uest
on
May
7, 2
020
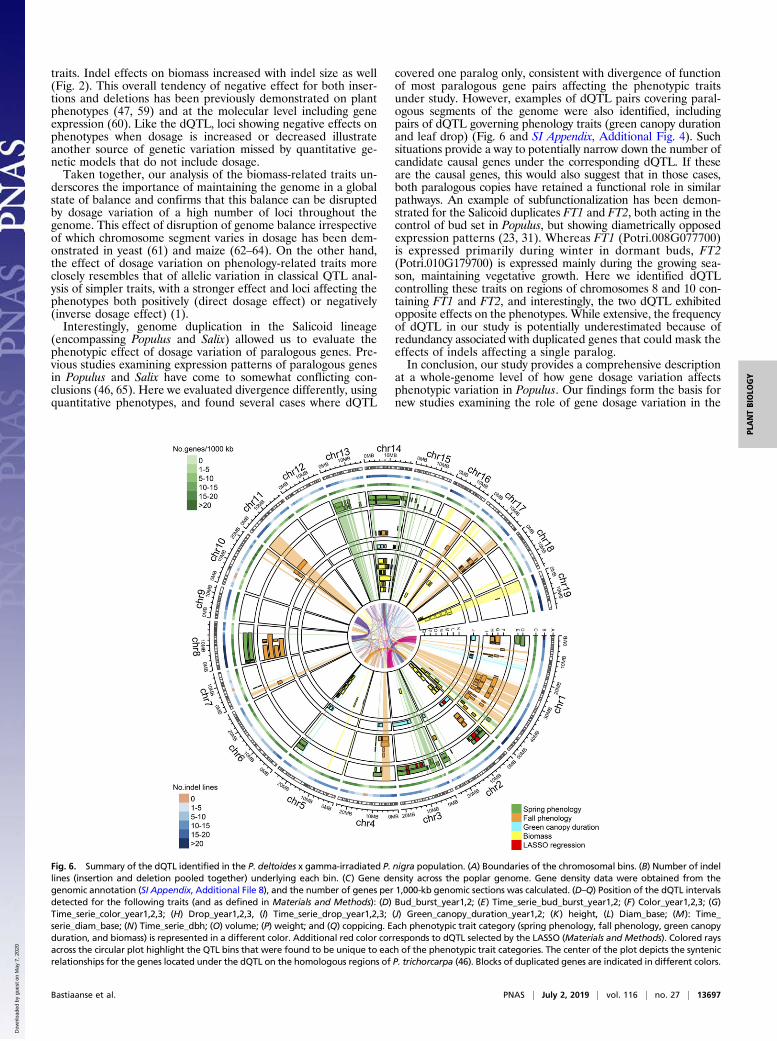
category (spring phenology, fall phenology, green canopy dura-tion, and biomass) but also across categories, with some chro-mosomal regions influencing almost all of the traits. Suchsignificant (P value < 0.05) colocalizations of dQTL, or hotspots, were found for regions of chromosomes 2, 5, and 14 havingeight or more colocating dQTL across all variable categories(Materials and Methods). Colocalizations among our dQTL weremostly found within phenotypic traits that were highly correlatedphenotypically, such as the biomass-related traits, but amonguncorrelated phenotypic traits as well. For instance, two QTLhot spots on chromosomes 2 and 14 were found to control allfour phenotypic trait categories investigated in this study, in-dependently of their correlation levels (Fig. 3). Inversely, we alsofound dQTL regions that were unique to each of the four phe-notypic trait categories. These regions are highlighted as rays inFig. 6 in the color of their corresponding phenotypic category.
Populus has a recently duplicated genome, and paralogoussyntenic blocks among chromosomes are well defined and abun-dant (45, 46). If paralogous genes are functionally conserved anddosage sensitive, both paralogs would be expected to affect a traitsimilarly and thus be identified as syntenic dQTL. For all fourphenotypic categories, syntenic pairs of dQTL were identified. Forexample, paralogous syntenic blocks on chromosomes 2 and5 harbored dQTL governing traits related to the spring phenology,green canopy duration, and biomass (orange lines in the innercore of Fig. 6). Paralogous syntenic blocks on chromosomes 8 and10 harbored dQTL governing traits related to the fall phenology(purple lines in the inner core of Fig. 6). Interestingly, theseparticular syntenic blocks on chromosomes 8 and 10 contain FT1(Potri.008G077700) and FT2 (Potri.010G179700) Salicoid dupli-cates, previously shown to control distinct aspects of phenology inPopulus (31). However, only the green canopy duration and drop
Fig. 4. Point estimates (dots) and bootstrap (1,000bootstraps) confidence interval (whiskers) of thebroad sense heritability of the phenotypic traits.Heritability was assessed over triplicated ramets ofeach line.
Table 2. Summary of the dQTL detected for each phenotypic traits measured in the P. deltoides x gamma-irradiatedP. nigra population
Traits
No. of QTL*Total no. ofQTL (+; −)†
No. of binsselected
by LASSO‡
No. ofchromosomes
Percent of varianceexplained by
individual QTL§
Percent of varianceexplained by
all QTL§Suggestive Significant Confirmed
Spring phenologyBud_burst_year1,2 10 5 8 23 (7; 16) 6 10 2 ± 2 37.6Time_serie_bud_
burst_year1,210 7 7 24 (14; 9) 9 10 2.4 ± 3.5 41.1
Fall phenologyColor_year1,2,3 11 4 2 17 (14; 3) 0 7 1.7 ± 0.8 15.3Time_serie_color_
year1,2,37 5 2 14 (3; 11) 0 7 1.9 ± 1.5 17.4
Drop_year1,2,3 13 9 0 22 (20; 2) 0 9 1.6 ± 0.9 17Time_serie_drop_
year1,2,317 6 2 25 (6; 19) 0 6 1.6 ± 0.9 16.5
Green canopydurationGreen_canopy_
duration_year1,221 2 1 24 (23; 1) 1 6 1.9 ± 1.2 17.9
BiomassHeight 10 1 0 11 (11; 0) 2 5 1.7 ± 0.5 10.5Diam_base 15 3 0 18 (18; 0) 4 6 1.4 ± 0.4 10.7Time_serie_
diam_base14 0 0 14 (14; 0) 0 5 2.2 ± 0.4 12
Time_serie_dbh 11 0 0 11 (10; 1) 0 6 1.6 ± 0.4 10.1Volume 13 0 0 13 (13; 0) 0 5 2.2 ± 0.7 12Weight 7 0 0 7 (7; 0) 0 4 2.2 ± 0.9 9.3Coppicing 2 2 0 4 (4; 0) 0 2 2.1 ± 0.3 3.9
*Suggestive (P adjust < 0.1), significant (P adjust < 0.05), and confirmed QTL (P adjust < 0.01) detected by computing the adjusted P value of the Kendall rankcorrelation (P adjust using the Benjamini–Hochberg method) between the phenotypic BLUP values and the relative dosage ratios for each chromosomal bin.Chromosomal bins were defined by the intersection points of all indels. Relative gene dosage ratios were calculated by dividing the gene copy number of eachbin by the background ploidy of the line. Contiguous significant bins were pooled and considered as a single wider QTL.†Total number of suggestive, significant, and confirmed dQTL with indication of their effect on the phenotype. Positive correlation (+) is indicated whenincreased phenotypic trait values was associated with insertions. Negative correlation (−) is indicated when increased phenotypic trait values were associatedwith deletions under the QTL.‡dQTL selected by the LASSO (Materials and Methods).§Adjusted R-squared of the multivariate linear regression model fitting all of the chromosomal bins underlying the QTL.
Bastiaanse et al. PNAS | July 2, 2019 | vol. 116 | no. 27 | 13695
PLANTBIOLO
GY
Dow
nloa
ded
by g
uest
on
May
7, 2
020
time series traits displayed syntenic dQTL at a frequency signifi-cantly higher than expected from a random distribution (SI Ap-pendix, Additional Fig. 4). Finally, for 75% of the syntenic dQTL,both paralogs in the gene pairs affected the phenotype in the samedirection, while for the remaining 25%, an opposite directionaleffect was observed across the paralogs.
DiscussionThe relative influence of gene dosage on quantitative phenotypictrait variation and genome function in higher eukaryotes is afundamental question. The classical phenomenon of balanceknown from comparison of diploids to polyploids or aneuploidshighlighted the molecular consequence to dosage variation, inwhich changes in the relative concentrations of components canaffect the biochemical function of protein complexes (1, 8, 47,48). Systematic evaluation of essential genes in yeast showedfrequent dosage effects and that most genes with low heterozy-gous fitness encode components of protein complexes (49). Inplants, dosage variation is a fundamental aspect of genomeevolution and quantitative trait variation (8), but a genome-wideview of dosage effects including the frequency and magnitude ofeffects is lacking. In this context, new approaches were needed tosystematically study the phenotypic effect of gene dosage varia-tion in complex eukaryotes such as plants.In this study, we undertook a systematic evaluation of the
effect of gene dosage on quantitative trait variation using largepedigrees of Populus trees carrying indels. Populus proved anideal model system in part because indel genotypes could beimmortalized and replicated through vegetative propagation.Overall, our pedigree covered over 98% of the Populus genomewith an average of 10 indels per chromosomal bin, providing acomprehensive view of dosage effects on quantitative pheno-types. The inclusion of diploid and triploid lines harboring bothinsertions and deletions enabled comparison of phenotypic traitvalues for a range of gene dosage at each chromosomal bin.Thus, the present study significantly extends previous studies ofgene dosage effects, which were limited to naturally occurringstructural variants and specific genomic locations of previouslyidentified QTL and candidate genes (2, 3, 50–54).Recent advances in genome sequencing technology have revealed
that CNV and structural variation are commonplace among Pop-ulus species (40). Like most forest trees, Populus is characterized bylarge outcrossing populations, with highly heterozygous individuals(55). This situation is not unlike human genetics, where deleteriousalleles (genetic load) can be maintained within populations and onlyuncovered through common descent in rare matings of related in-dividuals (56–58). However, we were able to reduce almost anyportion of the Populus genome to a haploid state without game-tophyte or seedling lethality and, in most cases, without severephenotypic effects during vegetative growth of Populus. This ob-
servation, along with the ability to modulate quantitative traits,suggests that overall, gene dosage variation could be an importantsource of quantitative trait variation in natural populations andcould contribute to the missing heritability (11).We found that a large portion of the Populus genome (up to
51.6%) displayed dosage sensitivity for at least one of the phe-notypes measured (scenarios 2–9; Fig. 5), with induced genedosage variation influencing traits in a significant and highlyheritable manner. These results underscore a limitation of tra-ditional models of quantitative trait variation, which typicallyincorporate measures of allelic variation but not dosage. Ofpractical significance are regions that we termed dosage QTL(dQTL), for which increasing and decreasing relative dosage inthe indel carrying lines were both associated with a proportionalmodulation of the phenotype above and below that of controlnonindel lines (Fig. 5). Such loci represent potential targets forbreeding for phenology and biomass yield traits, both importantto production forestry and bioenergy applications. Some of thedQTL regions overlapped with regions identified in previousclassical QTL studies investigating both SNP (36, 38) and naturalstructural variation in Populus (43), but most were in previouslyundiscovered regions. Importantly, our results illustrate how in-duced variation allowed a genome-wide scan for dosage sensitiveregions within a single pedigree, in contrast to traditional QTLstudies that are limited to surveying natural variation segregatingfrom the parents. This approach is of special significance forspecies with long generation times and high cost of progenytesting, such as Populus. Additionally, from a breeding per-spective, we identified both pleiotropic dQTL, as well as distinctdQTL, for each of the four phenotypic categories related tobiomass and phenology traits (Fig. 6), enabling separate selec-tion for correlated traits.Our parallel analysis of biomass and phenology-related traits
provides a useful example of the contrasting effect of genedosage variation on different aspects of plant function. Biomass-related traits yielded dQTL with smaller effects (Table 2) andweaker associations (SI Appendix, Additional Fig. 3), while thephenology-related phenotypes were associated with strongerdQTL. Strikingly, dQTL affected the phenology traits in eitherdirection, while all of the biomass-related dQTL consistentlyimpacted the phenotype in the same direction: deletions nega-tively impacted biomass, while insertions had the opposite effect(Fig. 5, red boxes). The overall effect of gene dosage variation onthese phenotypes outside of the dQTL regions was markedlydifferent as well (Fig. 5, black boxes). Deletions or insertionsnever outperformed the control lines for the biomass-relatedtraits, compared with 7.3% of the cases for the phenology-related traits. On the other hand, dosage variation negativelyimpacted biomass in almost half the cases (47%), while onlyaccounting for 15.8% of the cases for the phenology-related
Fig. 5. General trends observed in the association between gene dosage and phenotype for phenology- (including spring and fall phenology and greencanopy duration) and biomass-related traits. Scenario 1 shows gene dosage compensation or no significant effect of dosage on the observed phenotype.Scenarios 2 and 3 show positive and negative gene dosage effect. Scenarios 4–6 show negative effect of the insertion and/or deletion on the phenotype,compared with the nonindel lines. Scenarios 7–9 show positive effect of the insertion and/or deletion on the phenotype, compared with the nonindel lines.Bins were declared to be dQTL for adjusted P value of the Kendall rank correlation test < 0.1 (scenarios 2 and 3). For P adjust > 0.1 (scenarios 1 and 4–9),ANOVA was performed comparing nonindel to insertion and deletion lines separately. Phenotypic values were considered to be different at P < 0.05.Percentages represent the proportion of bins fitting one of the nine scenarios for each phenotypic trait category separately. Yellow shading represents thepercentage of tests within each class.
13696 | www.pnas.org/cgi/doi/10.1073/pnas.1903229116 Bastiaanse et al.
Dow
nloa
ded
by g
uest
on
May
7, 2
020
traits. Indel effects on biomass increased with indel size as well(Fig. 2). This overall tendency of negative effect for both inser-tions and deletions has been previously demonstrated on plantphenotypes (47, 59) and at the molecular level including geneexpression (60). Like the dQTL, loci showing negative effects onphenotypes when dosage is increased or decreased illustrateanother source of genetic variation missed by quantitative ge-netic models that do not include dosage.Taken together, our analysis of the biomass-related traits un-
derscores the importance of maintaining the genome in a globalstate of balance and confirms that this balance can be disruptedby dosage variation of a high number of loci throughout thegenome. This effect of disruption of genome balance irrespectiveof which chromosome segment varies in dosage has been dem-onstrated in yeast (61) and maize (62–64). On the other hand,the effect of dosage variation on phenology-related traits moreclosely resembles that of allelic variation in classical QTL anal-ysis of simpler traits, with a stronger effect and loci affecting thephenotypes both positively (direct dosage effect) or negatively(inverse dosage effect) (1).Interestingly, genome duplication in the Salicoid lineage
(encompassing Populus and Salix) allowed us to evaluate thephenotypic effect of dosage variation of paralogous genes. Pre-vious studies examining expression patterns of paralogous genesin Populus and Salix have come to somewhat conflicting con-clusions (46, 65). Here we evaluated divergence differently, usingquantitative phenotypes, and found several cases where dQTL
covered one paralog only, consistent with divergence of functionof most paralogous gene pairs affecting the phenotypic traitsunder study. However, examples of dQTL pairs covering paral-ogous segments of the genome were also identified, includingpairs of dQTL governing phenology traits (green canopy durationand leaf drop) (Fig. 6 and SI Appendix, Additional Fig. 4). Suchsituations provide a way to potentially narrow down the number ofcandidate causal genes under the corresponding dQTL. If theseare the causal genes, this would also suggest that in those cases,both paralogous copies have retained a functional role in similarpathways. An example of subfunctionalization has been demon-strated for the Salicoid duplicates FT1 and FT2, both acting in thecontrol of bud set in Populus, but showing diametrically opposedexpression patterns (23, 31). Whereas FT1 (Potri.008G077700)is expressed primarily during winter in dormant buds, FT2(Potri.010G179700) is expressed mainly during the growing sea-son, maintaining vegetative growth. Here we identified dQTLcontrolling these traits on regions of chromosomes 8 and 10 con-taining FT1 and FT2, and interestingly, the two dQTL exhibitedopposite effects on the phenotypes. While extensive, the frequencyof dQTL in our study is potentially underestimated because ofredundancy associated with duplicated genes that could mask theeffects of indels affecting a single paralog.In conclusion, our study provides a comprehensive description
at a whole-genome level of how gene dosage variation affectsphenotypic variation in Populus. Our findings form the basis fornew studies examining the role of gene dosage variation in the
Fig. 6. Summary of the dQTL identified in the P. deltoides x gamma-irradiated P. nigra population. (A) Boundaries of the chromosomal bins. (B) Number of indellines (insertion and deletion pooled together) underlying each bin. (C) Gene density across the poplar genome. Gene density data were obtained from thegenomic annotation (SI Appendix, Additional File 8), and the number of genes per 1,000-kb genomic sections was calculated. (D–Q) Position of the dQTL intervalsdetected for the following traits (and as defined in Materials and Methods): (D) Bud_burst_year1,2; (E) Time_serie_bud_burst_year1,2; (F) Color_year1,2,3; (G)Time_serie_color_year1,2,3; (H) Drop_year1,2,3, (I) Time_serie_drop_year1,2,3; (J) Green_canopy_duration_year1,2; (K) height, (L) Diam_base; (M): Time_serie_diam_base; (N) Time_serie_dbh; (O) volume; (P) weight; and (Q) coppicing. Each phenotypic trait category (spring phenology, fall phenology, green canopyduration, and biomass) is represented in a different color. Additional red color corresponds to dQTL selected by the LASSO (Materials and Methods). Colored raysacross the circular plot highlight the QTL bins that were found to be unique to each of the phenotypic trait categories. The center of the plot depicts the syntenicrelationships for the genes located under the dQTL on the homologous regions of P. trichorcarpa (46). Blocks of duplicated genes are indicated in different colors.
Bastiaanse et al. PNAS | July 2, 2019 | vol. 116 | no. 27 | 13697
PLANTBIOLO
GY
Dow
nloa
ded
by g
uest
on
May
7, 2
020
evolution and adaptive traits of the undomesticated Populus, aswell as for functional genomic and breeding applications. We arecurrently extending our studies of gene dosage to define linkagesbetween phenotypic variation gene dosage effects on genetranscription and regulatory networks.
Materials and MethodsCreation and Genomic Analysis of Irradiation Hybrids in Populus. Methods forthe creation and genomic analysis of irradiation hybrids lines were describedpreviously (42, 66). An interspecific crossing strategy was used because ofrelevance to forest industry and bioenergy applications, to maximize fe-cundity and seedset, and to facilitate assignment of alleles from the parentsin F1 progeny. Briefly, two female genotypes of P. deltoides (SO546SL andSO598SL; Greenwood Resources) were crossed to 100 gray gamma-irradiatedpollen of a male genotype of P. nigra (SO361SL; Greenwood Resources). Theresulting F1 populations were IFG_100 (126 genotypes) and GWR_100(466 genotypes), for a total of 592 lines. An additional 54 lines derived froma cross between SO546SL and the nonirradiated pollen of SO361SL wereproduced as controls (population IFG_0). DNA extracted from the leaves ofeach seedling was analyzed by Illumina low-pass sequencing to identify andfine map large-scale insertions and deletions (indels) across the whole Pop-ulus genome (Fig. 1) as previously described (42).
Field Experimental Design. Out of the 646 F1 hybrid lines, 592 were vegeta-tively propagated over two consecutive growing seasons (years 2014 and2015) to produce robust seedlings with extensive root systems and ensuresuccessful propagation. Three cuttings from each seedling were rooted inindividual tubes containing rooting hormones and Sunshine mix #4 pottingsoil (SunGrow Horticulture) under interval misting (15–30 s every hour from9 AM to 5 PM). Seedlings were grown in the greenhouse for approximately2 mo at day/night temperature 22 ± 2 °C/16 ± 2 °C before being transplantedin one experimental field in Placerville, CA, in two adjacent blocks: 373 lineswere planted in September 2014, and 329 lines were planted in May 2015 (SIAppendix, Additional Table 1). Each block contained a different set of threeclonal replicates per line (ramets), but 110 lines were planted in triplicate inboth blocks to allow for phenotypic data normalization over the two blocks.Ramet positions were randomized in each part of the field. Trees werespaced 0.6 m × 1 m and equipped with drip irrigation line. Additional linesof the same hybrid cross were planted at the border of the field to controlfor border effects. Soil was covered with weed block fabric and hay. InDecember 2016, all of the trees were harvested at 10 cm in height and wereallowed to coppice in the following spring.
Phenotypic Traits. The trees in the field were scored for various biomass andphenology-related traits at multiple times over the 4 y defined as follows:year 0 (September to December 2014), year 1 (2015), year 2 (2016), and year 3(2017, coppicing year). Phenotyping dates for each trait are presented in SIAppendix, Additional Table 9. See SI Appendix, Supplemental Methods, fordetailed descriptions of phenotypic trait measurements.
Estimation of the Best Linear Unbiased Predictors and Broad Sense Heritability.All statistical analyses were performed using R 3.5–1 in the R studio environ-ment 1.1.456. Normal distribution of each phenotypic trait was assessed usinga Shapiro–Wilk test. Nonnormally distributed data were transformed using aBox–Cox transformation. The phenotypic variance was assessed in a mixedlinear model using the lmer procedure implemented in R using restrictedmaximum likelihood and specified as follows: Yijk = μ+ Fi + Pj + LkðjÞ + «ijk,where μ is the general mean; F is the effect of field i, considered as fixed; P isthe effect of the population j, considered as random; and L is the effect of theline k nested into the population j, considered as random.
When comparing different lines over a time course experiment, observationday D was added to the model as a fixed factor effect as follows:Yijkl = μ+ Fi + Pj + LkðjÞ +Dl + «ijkl. Finally, phenotypic data from multiple yearswere jointly analyzed by adding year YR as a fixed factor effect to the models:Yijkl = μ+ Fi + Pj + LkðjÞ +YRl + «ijkl, for single time point data, and Yijklm =μ+ Fi + Pj + LkðjÞ +YRl +DmðlÞ + «ijklm, for time series. The variance componentestimates resulting from these analysis were used to estimate the broad sense
heritability (H2) using the following equation: H2 = Variance linesVariance total, where the vari-
ance of the lines represents the variance of the three clonal replicates of eachline, nested within the two populations IFG and GWR in our model, and vari-ance total represents the sum of the total variance of the model. The 95%confidence interval around the point estimate H2, was estimated using abootstrap procedure with 1,000 simulations. Mixed linear models were alsoused to estimate the best linear unbiased predictors (BLUPs) of the effect of
lines (nested within population) on the phenotypic estimates across time (ob-servation days and year) and environment (field part) (67). These BLUP esti-mates were used for the subsequent statistical and genomic analysis (SIAppendix, Additional Table 11).
Chromosomal Bin Analysis and Identification of dQTL. dQTL were detected asfollows and as illustrated in Fig. 1. Chromosomal bins were defined by thebreakpoints of the indels (deletion and insertion) tiled to the 19 chromo-somes. Next, for each line and for each bin, a relative dosage ratio wascalculated by dividing the gene copy number of the particular bin by thebackground ploidy of the particular line. For example, for a diploid linehaving an insertion spanning three bins on chromosome 1, the relativedosage ratio of these particular bins is 3/2 = 1.5, while it is 2/2 = 1 for the restof the bins. In the case of lines that do not carry any indel, the relativedosage ratio equaled 1 for all bins and background ploidy levels. To assessthe relationship between phenotype and gene dosage, Kendall rank corre-lation coefficients between relative dosage ratio and phenotypic BLUPswere calculated for each individual bin. P values associated with these co-efficients were adjusted for false discovery rates using the Benjamini–Hochbergcorrection (BH method). dQTL were declared as suggestive, significant, andconfirmed, for adjusted P values of <0.1, <0.05, and <0.01, respectively (68, 69).Consecutive bins located on the same chromosome were pooled into a singlelarger dQTL. For individual BLUP traits, scatterplots of the adjusted P valuedistribution along the bins were plotted using the qqman R package forManhattan plots (https://cran.r-project.org/web/packages/qqman/). Overviewsof the position of the suggestive, significant, and confirmed dQTL were pre-sented in a chord plot using the circlize R package (https://cran.r-project.org/web/packages/circlize/). The LASSO method was employed to select genomicbins under the dQTL showing the strongest associations with the phenotypictraits. The LASSO procedure was applied using the glmnet package in R using a10-fold cross validation and alpha = 1. LASSO procedure was repeated1,000 times, and the best predictor bins were declared when consistently se-lected by the model over 95% of the replications. The percentage of varianceexplained by individual and multiple dQTL was estimated by computing theadjusted R-squared of the multivariate linear regression model fitting all ofthe genomic bins underlying the dQTL.
Identification of dQTL Hot Spots. We identified chromosomal bins over-represented with colocating dQTL using the technique presented by (38).Briefly, we randomly permuted 1,000 times the length and position of thedQTL across the whole genome, and used a sliding window of 100 kb tocount the number of dQTL in each window region. For each permutation themaximum number of dQTL per window region was recorded and thensorted. The top 950th value among the 1,000 permutations (α = 0.05 signifi-cance level) was defined as the critical value for declaring a significant hotspot of dQTL. In our particular data set, the critical number was equal toseven across all phenotypic categories.
Analysis of the Presence of Indels and/or dQTL in Paralogous Gene Pairs. Syn-tenic comparisons were made based on the Populus paralogous gene pairsdataset provided by ref. 46. First, we investigated the frequency of occur-rence of insertion and deletion in both paralogous gene pairs in the samelines, for diploid and triploid lines separately. Second, for each category ofdQTL (spring phenology, fall phenology, biomass, and green canopy dura-tion), we investigated the frequency of occurrence of dQTL in the twomembers of the paralogous Populus gene pairs. Statistical significance wasassessed by randomly permuting 1,000 times the position of the indelswithin each lines or dQTL across the whole genome. A null distribution offrequencies was obtained from these random permutations and was com-pared with the observed frequencies obtained with the original data.
Additional Statistical Tests.One-way analysis of variance (ANOVA) using the Rfunction aov was used to evaluate the mean and variance the BLUP phe-notypic values according to various grouping factors (e.g., indel versus controlnonindel genotypes and deletion versus insertion lines). Where appropriate,the Tukey’s test was used for post hoc tests of significant differences be-tween means using the R function TukeyHSD at the 5% significance level.Effect size estimates and confidence intervals of the grouping factors on thephenotypic trait values were performed according to the Cohen’s d pro-cedure using the effsize R package. A correlation matrix between the phe-notypic traits was computed as the pairwise Pearson correlation coefficientsusing the cor function in R.
ACKNOWLEDGMENTS. This research was supported by the US Departmentof Energy Office of Science, Office of Biological and Environmental Research,
13698 | www.pnas.org/cgi/doi/10.1073/pnas.1903229116 Bastiaanse et al.
Dow
nloa
ded
by g
uest
on
May
7, 2
020
Grant DE-SC0007183 to L.C., I.H., and A.G. We thank Reginald King andAnnie Mix of the Institute of Forest Genetics, Placerville, CA, for assistancein poplar propagation and phenotyping; Veronica Thompson of Universityof California (UC), Davis, and Aedric Lim of US Department of Agriculture
Forest Service for assistance in fall phenology data collection; Brian Stantonand Kathy Haiby of Greenwood Resources for germplasm and technical as-sistance on poplar breeding; and Sergio Silva (UC Davis genome center) forassistance with laboratory procedures and data collection.
1. J. A. Birchler, U. Bhadra, M. P. Bhadra, D. L. Auger, Dosage-dependent gene regula-tion in multicellular eukaryotes: Implications for dosage compensation, aneuploidsyndromes, and quantitative traits. Dev. Biol. 234, 275–288 (2001).
2. A. K. Knox et al., CBF gene copy number variation at Frost Resistance-2 is associatedwith levels of freezing tolerance in temperate-climate cereals. Theor. Appl. Genet.121, 21–35 (2010).
3. A. Díaz, M. Zikhali, A. S. Turner, P. Isaac, D. A. Laurie, Copy number variation affectingthe Photoperiod-B1 and Vernalization-A1 genes is associated with altered floweringtime in wheat (Triticum aestivum). PLoS One 7, e33234 (2012).
4. Y. Li et al., A tandem segmental duplication (TSD) in green revolution gene Rht-D1bregion underlies plant height variation. New Phytol. 196, 282–291 (2012).
5. S. Förster, E. Schumann, M. Baumann, W. E. Weber, K. Pillen, Copy number variationof chromosome 5A and its association with Q gene expression, morphological aber-rations, and agronomic performance of winter wheat cultivars. Theor. Appl. Genet.126, 3049–3063 (2013).
6. J. Boocock, D. Chagné, T. R. Merriman, M. A. Black, The distribution and impact ofcommon copy-number variation in the genome of the domesticated apple, Malus xdomestica Borkh. BMC Genomics 16, 848 (2015).
7. A.-N. Sieber, C. F. H. Longin, W. L. Leiser, T. Würschum, Copy number variation of CBF-A14 at the Fr-A2 locus determines frost tolerance in winter durum wheat. Theor.Appl. Genet. 129, 1087–1097 (2016).
8. J. A. Birchler, R. A. Veitia, The gene balance hypothesis: From classical genetics tomodern genomics. Plant Cell 19, 395–402 (2007).
9. J. Liu, B. Cong, S. D. Tanksley, Generation and analysis of an artificial gene dosageseries in tomato to study the mechanisms by which the cloned quantitative trait locusfw2.2 controls fruit size. Plant Physiol. 132, 292–299 (2003).
10. D. E. Cook et al., Copy number variation of multiple genes at Rhg1 mediates nema-tode resistance in soybean. Science 338, 1206–1209 (2012).
11. T. A. Manolio et al., Finding the missing heritability of complex diseases. Nature 461,747–753 (2009).
12. R. Redon et al., Global variation in copy number in the human genome. Nature 444,444–454 (2006).
13. Y. Jiao et al., Genome-wide genetic changes during modern breeding of maize. Nat.Genet. 44, 812–815 (2012).
14. M. Muñoz-Amatriaín et al., Distribution, functional impact, and origin mechanisms ofcopy number variation in the barley genome. Genome Biol. 14, R58 (2013).
15. A. M. Brunner, E. Varkonyi-Gasic, R. C. Jones, “Phase change and phenology in trees”in Comparative and Evolutionary Genomics of Angiosperm Trees, A. Groover,Q. Cronk, Eds. (Springer International Publishing, Cham, 2017), pp. 227–274.
16. C. A. Polgar, R. B. Primack, Leaf-out phenology of temperate woody plants: Fromtrees to ecosystems. New Phytol. 191, 926–941 (2011).
17. A. F. Hunter, M. J. Lechowicz, Predicting the timing of budburst in temperate trees. J.Appl. Ecol. 29, 597–604 (1992).
18. I. Chuine, A unified model for budburst of trees. J. Theor. Biol. 207, 337–347 (2000).19. T. Linkosalo, R. Häkkinen, H. Hänninen, Models of the spring phenology of boreal and
temperate trees: Is there something missing? Tree Physiol. 26, 1165–1172 (2006).20. T. O. Perry, Dormancy of trees in winter. Science 171, 29–36 (1971).21. I. Chuine, E. G. Beaubien, Phenology is a major determinant of tree species range.
Ecol. Lett. 4, 500–510 (2001).22. X.-F. Ma, D. Hall, K. R. S. Onge, S. Jansson, P. K. Ingvarsson, Genetic differentiation,
clinal variation and phenotypic associations with growth cessation across the Populustremula photoperiodic pathway. Genetics 186, 1033–1044 (2010).
23. L. M. Evans et al., Population genomics of Populus trichocarpa identifies signatures ofselection and adaptive trait associations. Nat. Genet. 46, 1089–1096 (2014).
24. J. Wang et al., A major locus controls local adaptation and adaptive life history var-iation in a perennial plant. Genome Biol. 19, 72 (2018).
25. H. Böhlenius et al., CO/FT regulatory module controls timing of flowering and sea-sonal growth cessation in trees. Science 312, 1040–1043 (2006).
26. F. Turck, F. Fornara, G. Coupland, Regulation and identity of florigen: FLOWERINGLOCUS T moves center stage. Annu. Rev. Plant Biol. 59, 573–594 (2008).
27. D.-H. Kim, M. R. Doyle, S. Sung, R. M. Amasino, Vernalization: Winter and the timingof flowering in plants. Annu. Rev. Cell Dev. Biol. 25, 277–299 (2009).
28. R. M. Amasino, S. D. Michaels, The timing of flowering. Plant Physiol. 154, 516–520(2010).
29. A. Rohde et al., PtABI3 impinges on the growth and differentiation of embryonicleaves during bud set in poplar. Plant Cell 14, 1885–1901 (2002).
30. S. Tylewicz et al., Photoperiodic control of seasonal growth is mediated by ABA actingon cell-cell communication. Science 360, 212–215 (2018).
31. C.-Y. Hsu et al., FLOWERING LOCUS T duplication coordinates reproductive and vege-tative growth in perennial poplar. Proc. Natl. Acad. Sci. U.S.A. 108, 10756–10761 (2011).
32. A. Azeez, P. Miskolczi, S. Tylewicz, R. P. Bhalerao, A tree ortholog of APETALA1mediatesphotoperiodic control of seasonal growth. Curr. Biol. 24, 717–724 (2014).
33. J. Ding et al., GIGANTEA-like genes control seasonal growth cessation in Populus.New Phytol. 218, 1491–1503 (2018).
34. R. K. Singh et al., A genetic network mediating the control of bud break in hybridaspen. Nat. Commun. 9, 4173 (2018).
35. B. E. Frewen et al., Quantitative trait loci and candidate gene mapping of bud set andbud flush in populus. Genetics 154, 837–845 (2000).
36. A. Rohde et al., Bud set in poplar–genetic dissection of a complex trait in natural andhybrid populations. New Phytol. 189, 106–121 (2011).
37. A. D. McKown et al., Geographical and environmental gradients shape phenotypictrait variation and genetic structure in Populus trichocarpa. New Phytol. 201, 1263–1276 (2014).
38. A. M. Rae, N. R. Street, K. M. Robinson, N. Harris, G. Taylor, Five QTL hotspots for yieldin short rotation coppice bioenergy poplar: The Poplar Biomass Loci. BMC Plant Biol.9, 23 (2009).
39. H. B. Chhetri et al., Multi-trait genome-wide association analysis of Populus tricho-carpa identifies key polymorphisms controlling morphological and physiologicaltraits. New Phytol. 10.1111/nph.15777 (2019).
40. S. Pinosio et al., Characterization of the poplar pan-genome by genome-wide iden-tification of structural variation. Mol. Biol. Evol. 33, 2706–2719 (2016).
41. B. S. Ahloowalia, M. Maluszynski, Induced mutations—A new paradigm in plantbreeding. Euphytica 118, 167–173 (2001).
42. I. M. Henry, M. S. Zinkgraf, A. T. Groover, L. Comai, A system for dosage-basedfunctional genomics in poplar. Plant Cell 27, 2370–2383 (2015).
43. J. Prunier et al., Gene copy number variations involved in balsam poplar (Populusbalsamifera L.) adaptive variations. Mol. Ecol. 28, 1476–1490 (2019).
44. R. Tibshirani, Regression shrinkage and selection via the lasso. J. R. Stat. Soc. Series BStat. Methodol. 58, 267–288 (1996).
45. G. A. Tuskan et al., The genome of black cottonwood, Populus trichocarpa (Torr. &Gray). Science 313, 1596–1604 (2006).
46. E. Rodgers-Melnick et al., Contrasting patterns of evolution following whole genomeversus tandem duplication events in Populus. Genome Res. 22, 95–105 (2012).
47. J. A. Birchler, K. J. Newton, Modulation of protein levels in chromosomal dosage seriesof maize: The biochemical basis of aneuploid syndromes. Genetics 99, 247–266 (1981).
48. R. A. Veitia, Exploring the etiology of haploinsufficiency. BioEssays 24, 175–184(2002).
49. B. Papp, C. Pál, L. D. Hurst, Dosage sensitivity and the evolution of gene families inyeast. Nature 424, 194–197 (2003).
50. S. Pearce et al., Molecular characterization of Rht-1 dwarfing genes in hexaploidwheat. Plant Physiol. 157, 1820–1831 (2011).
51. E. Francia et al., Copy number variation at the HvCBF4-HvCBF2 genomic segment is amajor component of frost resistance in barley. Plant Mol. Biol. 92, 161–175 (2016).
52. S. Schiessl, B. Huettel, D. Kuehn, R. Reinhardt, R. J. Snowdon, Targeted deep se-quencing of flowering regulators in Brassica napus reveals extensive copy numbervariation. Sci. Data 4, 170013 (2017).
53. T. Würschum, P. H. G. Boeven, S. M. Langer, C. F. H. Longin, W. L. Leiser, Multiply toconquer: Copy number variations at Ppd-B1 and Vrn-A1 facilitate global adaptationin wheat. BMC Genet. 16, 96 (2015).
54. T. Würschum, C. F. H. Longin, V. Hahn, M. R. Tucker, W. L. Leiser, Copy number var-iations of CBF genes at the Fr-A2 locus are essential components of winter hardinessin wheat. Plant J. 89, 764–773 (2017).
55. O. Savolainen, T. Pyhäjärvi, Genomic diversity in forest trees. Curr. Opin. Plant Biol. 10,162–167 (2007).
56. S. Sunyaev et al., Prediction of deleterious human alleles. Hum. Mol. Genet. 10, 591–597 (2001).
57. S. Chun, J. C. Fay, Identification of deleterious mutations within three human ge-nomes. Genome Res. 19, 1553–1561 (2009).
58. M. Zhang, L. Zhou, R. Bawa, H. Suren, J. A. Holliday, Recombination rate variation,hitchhiking, and demographic history shape deleterious load in poplar. Mol. Biol.Evol. 33, 2899–2910 (2016).
59. M. Guo, J. A. Birchler, Trans-acting dosage effects on the expression of model genesystems in maize aneuploids. Science 266, 1999–2002 (1994).
60. J. Hou et al., Global impacts of chromosomal imbalance on gene expression in Ara-bidopsis and other taxa. Proc. Natl. Acad. Sci. U.S.A. 115, E11321–E11330 (2018).
61. J. M. Sheltzer et al., Aneuploidy drives genomic instability in yeast. Science 333, 1026–1030 (2011).
62. E. A. Lee, E. H. Coe, L. L. Darrah, Genetic variation in dosage effects in maize aneu-ploids. Genome 39, 711–721 (1996).
63. E. A. Lee, L. L. Darrah, E. H. Coe, Dosage effects on morphological and quantitativetraits in maize aneuploids. Genome 39, 898–908 (1996).
64. J. A. Birchler, R. A. Veitia, Gene balance hypothesis: Connecting issues of dosage sensi-tivity across biological disciplines. Proc. Natl. Acad. Sci. U.S.A. 109, 14746–14753 (2012).
65. S. L. Harikrishnan, P. Pucholt, S. Berlin, Sequence and gene expression evolution ofparalogous genes in willows. Sci. Rep. 5, 18662 (2015).
66. M. Zinkgraf et al., Creation and genomic analysis of irradiation hybrids in Populus.Curr. Protoc. Plant Biol. 1, 431–450 (2016).
67. M. Lynch, B. Walsh, Genetics and Analysis of Quantitative Traits (Sinauer, Sunderland,MA, 1998).
68. E. Lander, L. Kruglyak, Genetic dissection of complex traits: Guidelines for inter-preting and reporting linkage results. Nat. Genet. 11, 241–247 (1995).
69. Y. Benjamini, D. Yekutieli, Quantitative trait Loci analysis using the false discoveryrate. Genetics 171, 783–790 (2005).
Bastiaanse et al. PNAS | July 2, 2019 | vol. 116 | no. 27 | 13699
PLANTBIOLO
GY
Dow
nloa
ded
by g
uest
on
May
7, 2
020