genome-wide association study of pigmentary traits (skin and iris … · pupil and sclera to retain...
TRANSCRIPT

Submitted 23 August 2017Accepted 1 October 2017Published 2 November 2017
Corresponding authorEsteban J. Parra,[email protected]
Academic editorAmanda Toland
Additional Information andDeclarations can be found onpage 16
DOI 10.7717/peerj.3951
Copyright2017 Rawofi et al.
Distributed underCreative Commons CC-BY 4.0
OPEN ACCESS
Genome-wide association study ofpigmentary traits (skin and iris color)in individuals of East Asian ancestryLida Rawofi1, Melissa Edwards1, S Krithika1, Phuong Le1, David Cha1,Zhaohui Yang2, Yanyun Ma3, Jiucun Wang4, Bing Su5, Li Jin4,Heather L. Norton6 and Esteban J. Parra1
1Department of Anthropology, University of Toronto at Mississauga, Mississauga, Canada2Yunnan Key Laboratory of Primate Biomedical Research, Institute of Primate Translational Medicine,Kunming University of Science and Technology, Kunming, China
3MOE Key Laboratory of Contemporary Anthropology, School of Life Sciences, Fudan University, Shanghai,China
4 State Key laboratory of Genetic Engineering, Collaborative Innovation Center for Genetics and Development,School of Life Sciences, Fudan University, Shanghai, China
5 State Key Laboratory of Genetic Resources and Evolution, Kumming Institute of Zoology, Chinese Academyof Sciences, Kunming, China
6Department of Anthropology, University of Cincinnati, Cincinnati, United States of America
ABSTRACTBackground. Currently, there is limited knowledge about the genetics underlyingpigmentary traits in East Asian populations. Here, we report the results of the firstgenome-wide association study of pigmentary traits (skin and iris color) in individualsof East Asian ancestry.Methods.We obtained quantitative skin pigmentationmeasures (M-index) in the innerupper arm of the participants using a portable reflectometer (N = 305). Quantitativemeasures of iris color (expressed as L*, a* and b* CIELab coordinates) were extractedfrom high-resolution iris pictures (N = 342). We also measured the color differencesbetween the pupillary and ciliary regions of the iris (e.g., iris heterochromia). DNAsamples were genotyped with Illumina’s Infinium Multi-Ethnic Global Array (MEGA)and imputed using the 1000 Genomes Phase 3 samples as reference haplotypes.Results. For skin pigmentation, we did not observe any genome-wide significantsignal. We followed-up in three independent Chinese samples the lead SNPs of fiveregions showing multiple common markers (minor allele frequency ≥ 5%) with goodimputation scores and suggestive evidence of association (p-values < 10−5). One ofthese markers, rs2373391, which is located in an intron of the ZNF804B gene onchromosome 7, was replicated in one of the Chinese samples (p= 0.003). For iris color,we observed genome-wide signals in the OCA2 region on chromosome 15. This signalis driven by the non-synonymous rs1800414 variant, which explains 11.9%, 10.4% and6%of the variation observed in the b*, a* and L* coordinates in our sample, respectively.However, the OCA2 region was not associated with iris heterochromia.Discussion. Additional genome-wide association studies in East Asian samples will benecessary to further disentangle the genetic architecture of pigmentary traits in EastAsian populations.
How to cite this article Rawofi et al. (2017), Genome-wide association study of pigmentary traits (skin and iris color) in individuals ofEast Asian ancestry. PeerJ 5:e3951; DOI 10.7717/peerj.3951
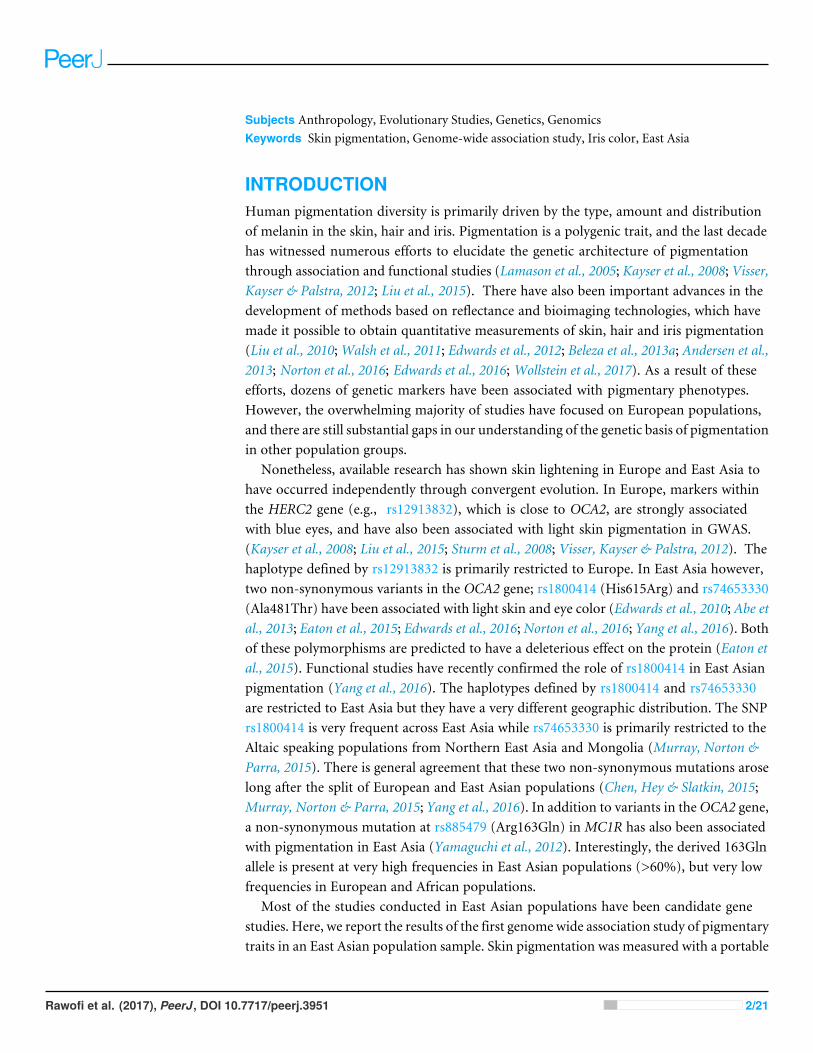
Subjects Anthropology, Evolutionary Studies, Genetics, GenomicsKeywords Skin pigmentation, Genome-wide association study, Iris color, East Asia
INTRODUCTIONHuman pigmentation diversity is primarily driven by the type, amount and distributionof melanin in the skin, hair and iris. Pigmentation is a polygenic trait, and the last decadehas witnessed numerous efforts to elucidate the genetic architecture of pigmentationthrough association and functional studies (Lamason et al., 2005; Kayser et al., 2008; Visser,Kayser & Palstra, 2012; Liu et al., 2015). There have also been important advances in thedevelopment of methods based on reflectance and bioimaging technologies, which havemade it possible to obtain quantitative measurements of skin, hair and iris pigmentation(Liu et al., 2010;Walsh et al., 2011; Edwards et al., 2012; Beleza et al., 2013a; Andersen et al.,2013; Norton et al., 2016; Edwards et al., 2016; Wollstein et al., 2017). As a result of theseefforts, dozens of genetic markers have been associated with pigmentary phenotypes.However, the overwhelming majority of studies have focused on European populations,and there are still substantial gaps in our understanding of the genetic basis of pigmentationin other population groups.
Nonetheless, available research has shown skin lightening in Europe and East Asia tohave occurred independently through convergent evolution. In Europe, markers withinthe HERC2 gene (e.g., rs12913832), which is close to OCA2, are strongly associatedwith blue eyes, and have also been associated with light skin pigmentation in GWAS.(Kayser et al., 2008; Liu et al., 2015; Sturm et al., 2008; Visser, Kayser & Palstra, 2012). Thehaplotype defined by rs12913832 is primarily restricted to Europe. In East Asia however,two non-synonymous variants in the OCA2 gene; rs1800414 (His615Arg) and rs74653330(Ala481Thr) have been associated with light skin and eye color (Edwards et al., 2010; Abe etal., 2013; Eaton et al., 2015; Edwards et al., 2016;Norton et al., 2016; Yang et al., 2016). Bothof these polymorphisms are predicted to have a deleterious effect on the protein (Eaton etal., 2015). Functional studies have recently confirmed the role of rs1800414 in East Asianpigmentation (Yang et al., 2016). The haplotypes defined by rs1800414 and rs74653330are restricted to East Asia but they have a very different geographic distribution. The SNPrs1800414 is very frequent across East Asia while rs74653330 is primarily restricted to theAltaic speaking populations from Northern East Asia and Mongolia (Murray, Norton &Parra, 2015). There is general agreement that these two non-synonymous mutations aroselong after the split of European and East Asian populations (Chen, Hey & Slatkin, 2015;Murray, Norton & Parra, 2015; Yang et al., 2016). In addition to variants in theOCA2 gene,a non-synonymous mutation at rs885479 (Arg163Gln) in MC1R has also been associatedwith pigmentation in East Asia (Yamaguchi et al., 2012). Interestingly, the derived 163Glnallele is present at very high frequencies in East Asian populations (>60%), but very lowfrequencies in European and African populations.
Most of the studies conducted in East Asian populations have been candidate genestudies. Here, we report the results of the first genome wide association study of pigmentarytraits in an East Asian population sample. Skin pigmentation was measured with a portable
Rawofi et al. (2017), PeerJ, DOI 10.7717/peerj.3951 2/21

reflectometer while eye color was measured quantitatively (CIELab color space) fromhigh-resolution pictures of the iris. The samples were genotyped with Illumina’s MEGAarray, and imputed with the 1KG Phase 3 reference samples. We followed up the mainsignals observed in our GWAS in two independent East Asian samples. This study providesimportant insights about the architecture of skin pigmentation in East Asian populations.
MATERIALS AND METHODSSample collectionRecruitment of study participants was carried out at the University of Toronto (Canada).All participants ranged between 18 and 35 yr of age and were recruited using online andprint advertisements directed towards the University of Toronto student community. Apersonal questionnaire was administered to each participant to determine their age, sexand whether or not they had been diagnosed with any pigmentation-related diseases ordisorders.
Biogeographical ancestry was determined using information from the personalquestionnaire, which inquired about the ancestry, place of birth and first language of eachparticipant’s maternal and paternal grandparents. The sample used in this study comprisedindividuals who had grandparents from China, Japan, South Korea or Taiwan. In the fewcases where information about grandparents was not available, we used information aboutboth parents to assess biogeographical ancestry. The total number of individuals includedin the study was 425. The study was approved by the University of Toronto Research andEthics Board (Protocol Reference #27015), and all participants provided written informedconsent. A 2-ml saliva sample was obtained from each participant using the Oragene-DNA(OG-500) collection kit (DNA Genotek, Ottawa, Canada). All participants were instructednot to eat, drink or smoke for at least 30 min prior to obtaining the sample to ensuremaximal sample purity. DNA was isolated from each sample using the protocol providedby DNA Genotek and eluted in 500 ml of TE (10 mM Tris–HCl, 1 mM EDTA, pH 8.0)buffer. Prior to genotyping, 23 DNA samples were excluded due to poor DNA quality. Thefinal number of samples genotyped was 402.
Measurement of pigmentary traitsSkin pigmentation was measured quantitatively using the DSMII Dermaspectrometer(Cortex Technologies, Hadsund, Denmark), and melanin levels were reported as M index(individuals with higher M -values have darker pigmentation). Measurements were takenthree times on the inner skin of the upper right arm and pigmentation was reportedas the mean of the three measures, after excluding outliers. High-resolution pictures ofthe right iris of each participant were taken with a Fujifilm Finepix S3 Pro 12-megapixelDSLR mounted on a Nikor 105-mm macro lens. To control for lighting and exposure,photographs were taken with a coaxial biometric illuminator to deliver a constant anduniform source of light to each iris at 5,500 K (D55 illuminant). All photographs weretaken under the same setting (Delaneau, Marchini & Zagury, 2012) conditions, with anaperture of f/19, exposure sensitivity (ISO) set at 200 and a shutter speed of 1/125 s. Irispigmentation was digitally scored using a custom program designed to crop out both the
Rawofi et al. (2017), PeerJ, DOI 10.7717/peerj.3951 3/21

pupil and sclera to retain only the iris. A wedge of the iris was then extracted, and colorscores in CIELab coordinates were calculated from the pupillary and ciliary zones. Inaddition to the L*, a* and b* coordinates for the iris wedge, the program calculated theparameter delta, which describes color differences in the pupillary and ciliary regions of theiris. Detailed information about this program has been described in Edwards et al. (2016).
Genotyping, phasing and imputationGenotyping was carried out with Illumina’s Infinium Multi-Ethnic Global Array (MEGA)at the Clinical Genomics Centre (Mount Sinai Hospital, Toronto, Ontario, Canada) usingstandard protocols. The MEGA array, which includes approximately 1.7 million markers,was designed to capture common genome variation in diverse population groups. Foursamples were included as blind duplicates, and the concordance rate was in all sampleshigher than 99.99%. We used the program GenomeStudio to carry out the basic QCsteps recommended by Illumina. After this initial QC step, approximately 1.4 millionwere retained for further analyses. The number of autosomal markers included wasapproximately 1.36 million. We performed additional QC steps to remove samples andmarkers, according to the following criteria, Sample QC: 1/removal of samples withmissing call rates <0.9, 2/removal of samples that were outliers in Principal ComponentAnalysis (PCA) plots, 3/removal of samples with sex discrepancies, 4/removal of samplesthat were outliers for heterozygosity, and 5/removal of related individuals (pi-hat > 0.2).Marker QC: 1/removal of markers with genotype call rate <0.95, 2/removal of markerswith Hardy-Weinberg p-values <10−6, 3/removal of Insertion/Deletion (Indel) markers,4/removal of markers with allele frequencies <0.01, 5/removal of markers not present inthe 1000 Genomes reference panel, or that do not match on chromosome, position andalleles, 6/removal of A/T or G/C SNPs with MAF >40% in the 1000 Genomes East Asianreference samples, and 7/removal of SNPs with allele frequency differences >20% betweenthe study sample and the 1000 Genomes East Asian reference sample. After these QC steps,we retained 377 samples and 520,076 markers.
After performing the QC steps described above, the samples were phased using theprogram SHAPEIT2 and imputed at the Sanger Imputation Service, using the PositionalBurrows-Wheeler Transform (PBWT) algorithm (Durbin, 2014), and the samples of the1000 Genomes as reference haplotypes.
Population structureWe used the program EIGENSOFT to perform PCA and evaluate population stratificationafter pruning markers in high LD and removing regions showing high LD or genomiccomplexity.
Statistical analysesAs a first step of the statistical analyses, we carried out a linear regression withM -values asthe dependent variable, and sex and the first four Principal Component Axis as independentvariables and saved the standardized residuals. A similar process was carried out forthe L*, a*, b* and delta iris values, but in this case, due to deviations from normality,the unstandardized residuals were transformed using the rank-based inverse normal
Rawofi et al. (2017), PeerJ, DOI 10.7717/peerj.3951 4/21

transformation. The M -value residuals and the L*, a*, b* and delta transformed residualswere used as input for the association tests with the program SNPTEST v2 (Marchini &Howie, 2010), using an additive model and the expected test (e.g., using genotype dosages)in order to control for genotype uncertainty. For the L*, a*, b* coordinates that defineiris color, we also run a Bayesian Multiple Phenotype test implemented in the programSNPTEST (-mpheno option). This test evaluates the three coordinates jointly and providesa log10 Bayes Factor reporting the ratio of two probabilities: the probability of the dataunder an unconstrained model (M1), and the probability of the data under a null model(M0) in which there is no effect. For example, a log10 Bayes Factor of 3 indicates that theprobability of the data under the model M1 is 1,000-fold higher than the probability of thedata under the null model with no genotype effects.
Of the 377 samples that were retained after the post-genotyping QC step, some sampleshad missing phenotype data. The final number of samples with valid skin pigmentationdata was 305, and the final number of samples with valid iris color data was 342.
Annotation of genome-wide significant and suggestive signalsThe genome-wide significant (p< 10−8) and suggestive signals (p< 10−5) identified in thestatistical analyseswere annotated using the online SNP-Nexus tool (http://snp-nexus.org/),which provides extensive annotations, including potential effects of non-synonymouscoding SNPs on protein function (e.g., SIFT and Polyphen), potential regulatory effects(e.g., conserved transcription factor binding sites, microRNAs, Enhancers and CpGislands), evidence of evolutionary conservation (e.g., PHAST and GERP++) and evidenceof association with complex diseases and disorders (e.g., GAD and NHGRI Catalogue ofPublished Genome-Wide Association studies).
Replication in independent East Asian samplesThe markers showing the strongest evidence of association with skin pigmentation werefollowed up in three independent Chinese samples, for which skin pigmentation measures(M-index or L* values) were also available. The first two samples were collected by theLaboratory of Contemporary Anthropology at Fudan University between 2013 and 2015.Constitutive pigmentation was measured with a DSMII colormeter (Cortex Technology,Hadsund, Denmark) and pigmentation levels were reported as M-index values (darkerpigmentation corresponds to higher M-index values). Pigmentation was estimated as themean of three measures, after excluding outliers. The first sample was a cohort from theJinan Military Hospital (N = 559). All the participants were male, and the mean age of thissample was 21.13 years. Constitutive pigmentation wasmeasured in the buttocks during themonth of September. The second sample was a cohort fromTaizhou (N = 568), comprising404 females and 164 males, with an average age of 44.32 years. Constitutive pigmentationwas measured in the upper inner arm in the month of April. Genotyping of the SNPs wascarried out using SNaPshot. In both samples, the association of the relevant markers withM-index values was carried out using linear regression, including age, rs1800414 and sex(only for the Taizhou cohort) as covariates. The third sample comprises 346 Han Chineseindividuals (College students) for whom constitutive pigmentation was measured in the
Rawofi et al. (2017), PeerJ, DOI 10.7717/peerj.3951 5/21
buttocks and the upper inner arm. The study took place in the month of September. In thiscase, pigmentation was estimated as the mean of three measurements and reported usingL* values (darker pigmentation corresponds to lower L* values). Genotyping was doneusing Sanger sequencing. The association of the variants with pigmentation was tested withthe program PLINK, using sex and age as covariates. Unfortunately, to our knowledge,there have been no studies in East Asia reporting quantitative iris color estimates using theCIELab color space, so it was not possible to follow-up the signals identified for iris colorin our East Asian samples.
RESULTSDistribution of pigmentary traits in East Asian sampleFigure S1 shows the distribution of skin pigmentation values, expressed as the M-index.The average M -value was 37.83 (SD = 2.843). Figures S2A–S2C show the scatterplots ofa* and b*, L* and a* and L* and b* iris color coordinates, respectively. The CIELab plotsshow that there is a substantial amount of variation in the three iris color coordinates,emphasizing the importance to use quantitative estimates of iris color, instead of categoricalclassifications (which in the case of this sample, would be restricted to ‘‘brown’’ color).Finally, the distribution of the delta values (difference in color coordinates between thepupillary and ciliary regions of the iris) are depicted in Fig. S3.
Population structureFigure S4 shows the representation of the first two axes of a PCA analysis of the East Asiansample included in this study, as well as the East Asian samples of the 1000 Genomes project(CDX: Chinese Dai in Xishuangbanna, KHV: Kinh in Ho Chi Minh City, Vietnam, CHB:Han Chinese in Beijing, CHS: Han Chinese South and JPT: Japanese in Tokyo). Most ofthe East Asian individuals included in this study overlap with the two Han Chinese samples(CHB and CHS) and a few individuals with the Japanese samples. Interestingly, the EastAsian individuals who reported ancestry from Korea in our sample form a discrete clusterthat is located between the Han Chinese and the Japanese 1000 Genomes samples.
Results of genome-wide association studyFigure 1 shows a Manhattan plot reporting the association results for skin pigmentation.We did not observe any genome-wide significant signal (p< 5×10⁻⁸). Figure S5 showsthe QQ plot corresponding to skin pigmentation. There was no evidence of genomicinflation (lambda: 1.00). Table 1 reports the list of the common markers (maf > 5%)with the lowest p-values identified in the GWA study. All the markers listed in the Tablehave good imputation info scores (info > 0.8), and correspond to regions with multiplesignificant markers (File S1). The regional plots for these regions are depicted in Fig. S6.Figure 2 shows the Manhattan plots reporting the association results for iris color (L*,a*, b* and delta). The QQ plots for these traits are depicted in Fig. S7. Again, there is noevidence of genomic inflation for any of the traits. We observed a genome-wide signal inthe well-known OCA2 region. In this region, the top signal was rs76930569, which hadp-values of 9.27×10⁻¹¹ and 5.30×10⁻¹² for the a* and b* color dimensions, respectively.
Rawofi et al. (2017), PeerJ, DOI 10.7717/peerj.3951 6/21
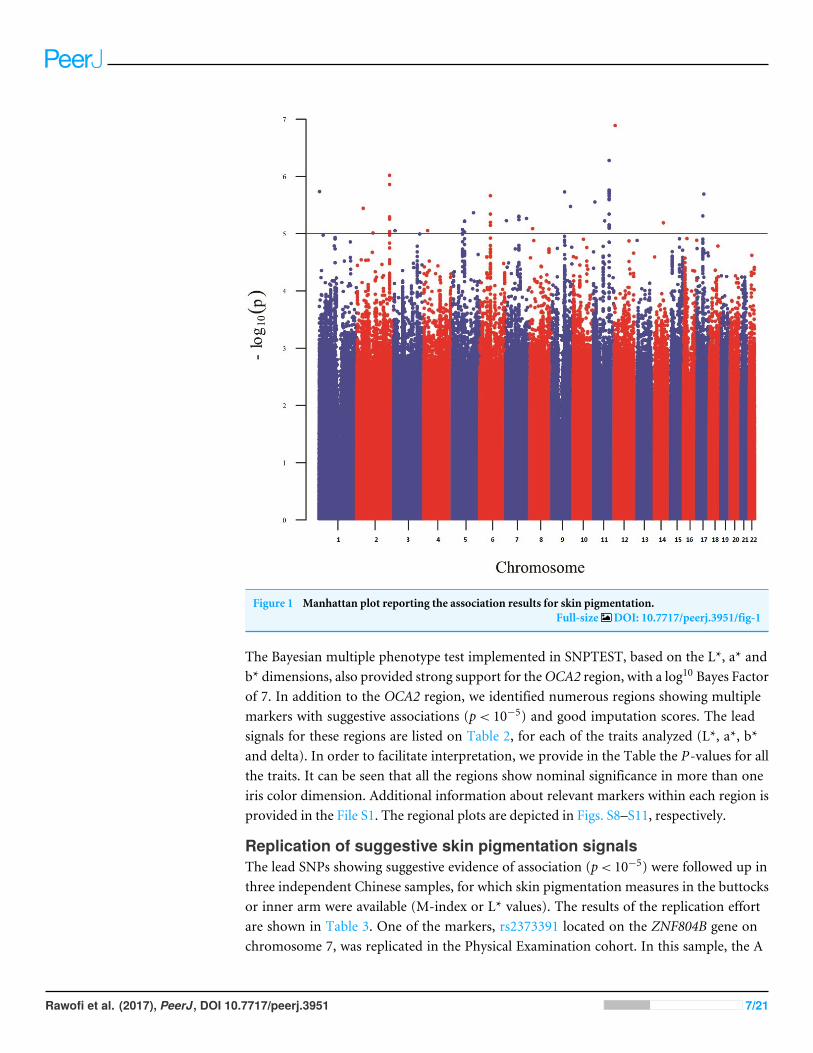
Figure 1 Manhattan plot reporting the association results for skin pigmentation.Full-size DOI: 10.7717/peerj.3951/fig-1
The Bayesian multiple phenotype test implemented in SNPTEST, based on the L*, a* andb* dimensions, also provided strong support for theOCA2 region, with a log10 Bayes Factorof 7. In addition to the OCA2 region, we identified numerous regions showing multiplemarkers with suggestive associations (p< 10−5) and good imputation scores. The leadsignals for these regions are listed on Table 2, for each of the traits analyzed (L*, a*, b*and delta). In order to facilitate interpretation, we provide in the Table the P-values for allthe traits. It can be seen that all the regions show nominal significance in more than oneiris color dimension. Additional information about relevant markers within each region isprovided in the File S1. The regional plots are depicted in Figs. S8–S11, respectively.
Replication of suggestive skin pigmentation signalsThe lead SNPs showing suggestive evidence of association (p< 10−5) were followed up inthree independent Chinese samples, for which skin pigmentation measures in the buttocksor inner arm were available (M-index or L* values). The results of the replication effortare shown in Table 3. One of the markers, rs2373391 located on the ZNF804B gene onchromosome 7, was replicated in the Physical Examination cohort. In this sample, the A
Rawofi et al. (2017), PeerJ, DOI 10.7717/peerj.3951 7/21

Table 1 Main signals observed in the GWAS of skin pigmentation (M -values). We report the beta, SE and P-values obtained with the model using the standardizedand unstandardized residuals.
SNP CHR POS NEA/EA Gene Frq EA INFO Betaa SEa Pa Betab SEb Pb
rs2003589 2 217527465 T/C IGFBP2 0.063 0.843 0.885 0.177 9.54E–07 2.464 0.494 1.05E–06rs853807 5 67752638 C/T 0.485 0.956 −0.347 0.077 8.45E–06 −0.961 0.213 9.75E–06rs57836066 6 71304950 T/G RP11-134K13.4 0.086 0.979 −0.661 0.137 2.17E–06 −1.838 0.382 2.40E–06rs2373391 7 88449300 T/A ZNF804B 0.681 0.987 −0.384 0.083 4.98E–06 −1.076 0.232 5.09E–06rs7945369 11 103425586 T/C 0.537 0.968 −0.405 0.079 5.26E–07 −1.159 0.224 3.97E–07
Notes.aBeta estimate using standardized residuals.bBeta estimate using unstandardized residuals.
Raw
ofietal.(2017),PeerJ,D
OI10.7717/peerj.3951
8/21
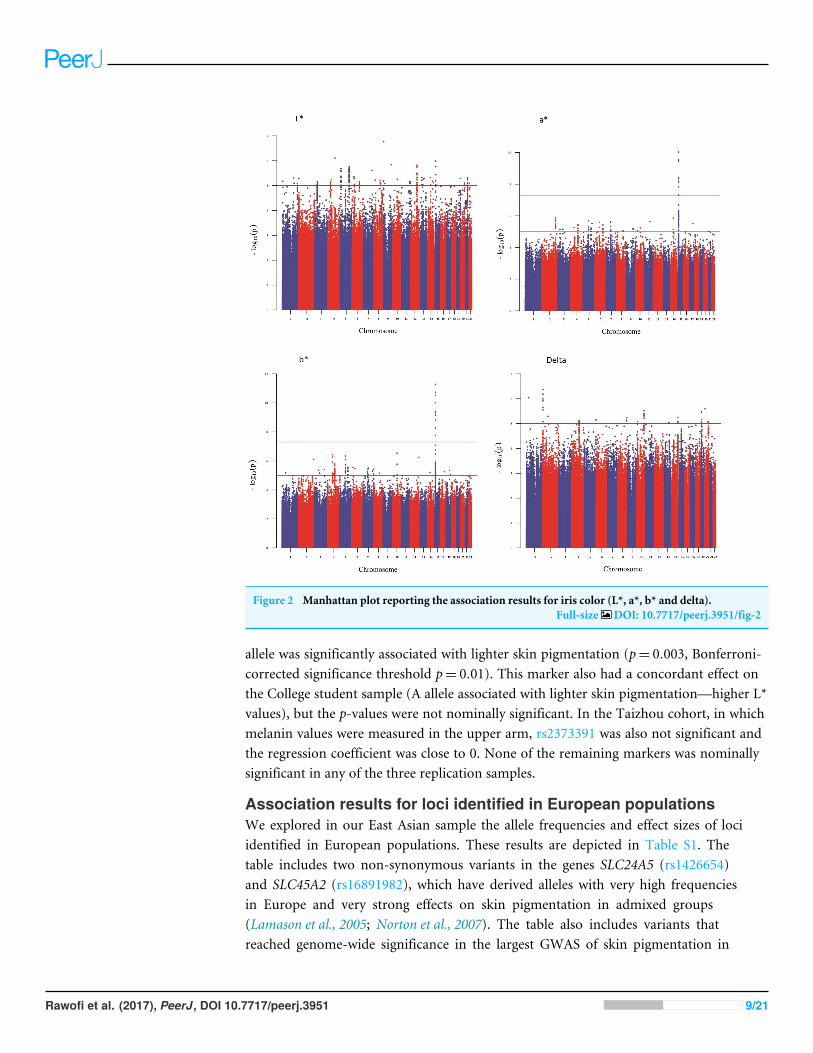
Figure 2 Manhattan plot reporting the association results for iris color (L*, a*, b* and delta).Full-size DOI: 10.7717/peerj.3951/fig-2
allele was significantly associated with lighter skin pigmentation (p= 0.003, Bonferroni-corrected significance threshold p= 0.01). This marker also had a concordant effect onthe College student sample (A allele associated with lighter skin pigmentation—higher L*values), but the p-values were not nominally significant. In the Taizhou cohort, in whichmelanin values were measured in the upper arm, rs2373391 was also not significant andthe regression coefficient was close to 0. None of the remaining markers was nominallysignificant in any of the three replication samples.
Association results for loci identified in European populationsWe explored in our East Asian sample the allele frequencies and effect sizes of lociidentified in European populations. These results are depicted in Table S1. Thetable includes two non-synonymous variants in the genes SLC24A5 (rs1426654)and SLC45A2 (rs16891982), which have derived alleles with very high frequenciesin Europe and very strong effects on skin pigmentation in admixed groups(Lamason et al., 2005; Norton et al., 2007). The table also includes variants thatreached genome-wide significance in the largest GWAS of skin pigmentation in
Rawofi et al. (2017), PeerJ, DOI 10.7717/peerj.3951 9/21
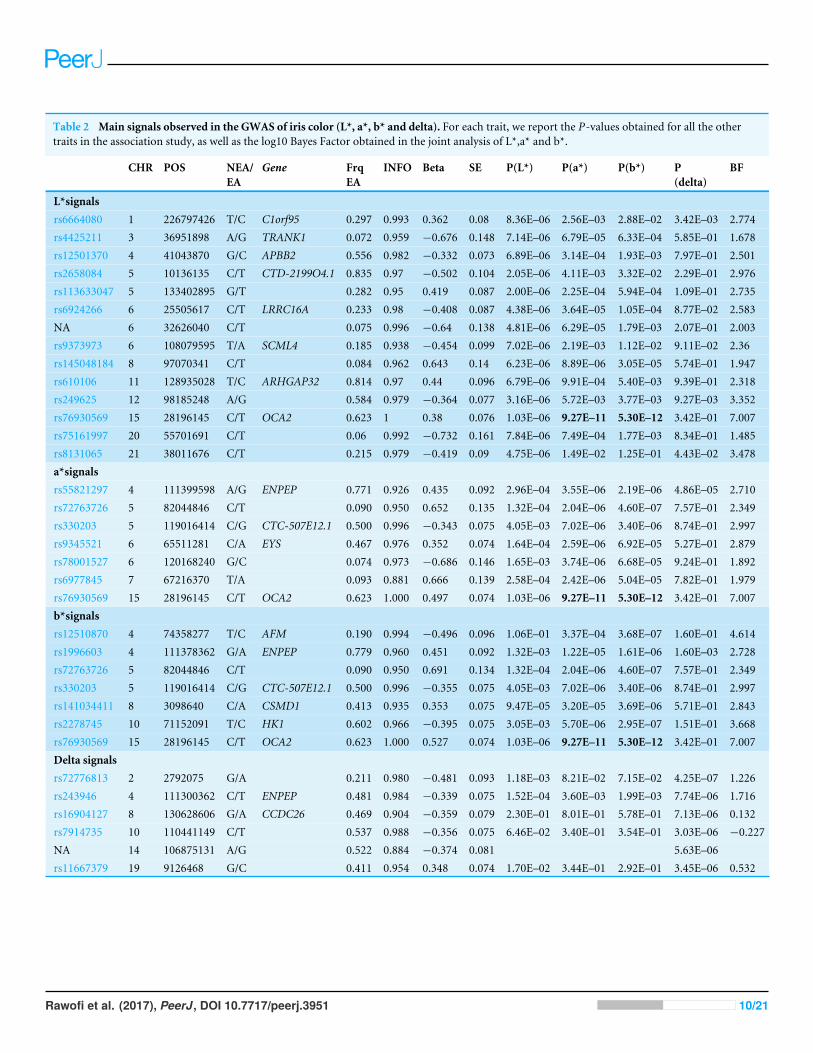
Table 2 Main signals observed in the GWAS of iris color (L*, a*, b* and delta). For each trait, we report the P-values obtained for all the othertraits in the association study, as well as the log10 Bayes Factor obtained in the joint analysis of L*,a* and b*.
CHR POS NEA/EA
Gene FrqEA
INFO Beta SE P(L*) P(a*) P(b*) P(delta)
BF
L*signalsrs6664080 1 226797426 T/C C1orf95 0.297 0.993 0.362 0.08 8.36E–06 2.56E–03 2.88E–02 3.42E–03 2.774rs4425211 3 36951898 A/G TRANK1 0.072 0.959 −0.676 0.148 7.14E–06 6.79E–05 6.33E–04 5.85E–01 1.678rs12501370 4 41043870 G/C APBB2 0.556 0.982 −0.332 0.073 6.89E–06 3.14E–04 1.93E–03 7.97E–01 2.501rs2658084 5 10136135 C/T CTD-2199O4.1 0.835 0.97 −0.502 0.104 2.05E–06 4.11E–03 3.32E–02 2.29E–01 2.976rs113633047 5 133402895 G/T 0.282 0.95 0.419 0.087 2.00E–06 2.25E–04 5.94E–04 1.09E–01 2.735rs6924266 6 25505617 C/T LRRC16A 0.233 0.98 −0.408 0.087 4.38E–06 3.64E–05 1.05E–04 8.77E–02 2.583NA 6 32626040 C/T 0.075 0.996 −0.64 0.138 4.81E–06 6.29E–05 1.79E–03 2.07E–01 2.003rs9373973 6 108079595 T/A SCML4 0.185 0.938 −0.454 0.099 7.02E–06 2.19E–03 1.12E–02 9.11E–02 2.36rs145048184 8 97070341 C/T 0.084 0.962 0.643 0.14 6.23E–06 8.89E–06 3.05E–05 5.74E–01 1.947rs610106 11 128935028 T/C ARHGAP32 0.814 0.97 0.44 0.096 6.79E–06 9.91E–04 5.40E–03 9.39E–01 2.318rs249625 12 98185248 A/G 0.584 0.979 −0.364 0.077 3.16E–06 5.72E–03 3.77E–03 9.27E–03 3.352rs76930569 15 28196145 C/T OCA2 0.623 1 0.38 0.076 1.03E–06 9.27E–11 5.30E–12 3.42E–01 7.007rs75161997 20 55701691 C/T 0.06 0.992 −0.732 0.161 7.84E–06 7.49E–04 1.77E–03 8.34E–01 1.485rs8131065 21 38011676 C/T 0.215 0.979 −0.419 0.09 4.75E–06 1.49E–02 1.25E–01 4.43E–02 3.478a*signalsrs55821297 4 111399598 A/G ENPEP 0.771 0.926 0.435 0.092 2.96E–04 3.55E–06 2.19E–06 4.86E–05 2.710rs72763726 5 82044846 C/T 0.090 0.950 0.652 0.135 1.32E–04 2.04E–06 4.60E–07 7.57E–01 2.349rs330203 5 119016414 C/G CTC-507E12.1 0.500 0.996 −0.343 0.075 4.05E–03 7.02E–06 3.40E–06 8.74E–01 2.997rs9345521 6 65511281 C/A EYS 0.467 0.976 0.352 0.074 1.64E–04 2.59E–06 6.92E–05 5.27E–01 2.879rs78001527 6 120168240 G/C 0.074 0.973 −0.686 0.146 1.65E–03 3.74E–06 6.68E–05 9.24E–01 1.892rs6977845 7 67216370 T/A 0.093 0.881 0.666 0.139 2.58E–04 2.42E–06 5.04E–05 7.82E–01 1.979rs76930569 15 28196145 C/T OCA2 0.623 1.000 0.497 0.074 1.03E–06 9.27E–11 5.30E–12 3.42E–01 7.007b*signalsrs12510870 4 74358277 T/C AFM 0.190 0.994 −0.496 0.096 1.06E–01 3.37E–04 3.68E–07 1.60E–01 4.614rs1996603 4 111378362 G/A ENPEP 0.779 0.960 0.451 0.092 1.32E–03 1.22E–05 1.61E–06 1.60E–03 2.728rs72763726 5 82044846 C/T 0.090 0.950 0.691 0.134 1.32E–04 2.04E–06 4.60E–07 7.57E–01 2.349rs330203 5 119016414 C/G CTC-507E12.1 0.500 0.996 −0.355 0.075 4.05E–03 7.02E–06 3.40E–06 8.74E–01 2.997rs141034411 8 3098640 C/A CSMD1 0.413 0.935 0.353 0.075 9.47E–05 3.20E–05 3.69E–06 5.71E–01 2.843rs2278745 10 71152091 T/C HK1 0.602 0.966 −0.395 0.075 3.05E–03 5.70E–06 2.95E–07 1.51E–01 3.668rs76930569 15 28196145 C/T OCA2 0.623 1.000 0.527 0.074 1.03E–06 9.27E–11 5.30E–12 3.42E–01 7.007Delta signalsrs72776813 2 2792075 G/A 0.211 0.980 −0.481 0.093 1.18E–03 8.21E–02 7.15E–02 4.25E–07 1.226rs243946 4 111300362 C/T ENPEP 0.481 0.984 −0.339 0.075 1.52E–04 3.60E–03 1.99E–03 7.74E–06 1.716rs16904127 8 130628606 G/A CCDC26 0.469 0.904 −0.359 0.079 2.30E–01 8.01E–01 5.78E–01 7.13E–06 0.132rs7914735 10 110441149 C/T 0.537 0.988 −0.356 0.075 6.46E–02 3.40E–01 3.54E–01 3.03E–06 −0.227NA 14 106875131 A/G 0.522 0.884 −0.374 0.081 5.63E–06rs11667379 19 9126468 G/C 0.411 0.954 0.348 0.074 1.70E–02 3.44E–01 2.92E–01 3.45E–06 0.532
Rawofi et al. (2017), PeerJ, DOI 10.7717/peerj.3951 10/21

Table 3 Results of the replication effort for skin pigmentation signals in three independent Chinese samples.Note that in the Physical Examination and Taizhou co-horts melanin was reported as M-index (higherM -values indicate darker skin), whereas in the sample of College students melanin was reported as L* (higher L* valuesindicate lighter skin).
SNP CHR POS NEA/EA This study Physical examination cohort Taizhou cohort College Students
Site Upper arm Buttocks Upper arm Buttocks Upper arm
Index M-index M-index M-index L* L*
Beta P-value Beta P-value Beta P-value Beta P-value Beta P-value
rs2003589 2 217527465 T/C 2.464 1.05E–06 −0.104 0.864 0.171 0.575 −1.927 0.259 −0.659 0.635rs853807 5 67752638 C/T −0.961 9.75E–06 −0.243 0.440 −0.050 0.755 0.085 0.744 −0.018 0.931rs57836066 6 71304950 T/G −1.838 2.40E–06 0.605 0.225 0.213 0.394 0.995 0.317 0.175 0.828rs2373391 7 88449300 T/A −1.076 5.09E–06 −1.132 0.003 0.024 0.889 0.120 0.739 0.273 0.349rs7945369 11 103425586 T/C −1.159 3.97E–07 −0.614 0.051 0.211 0.190 NA NA NA NA
Raw
ofietal.(2017),PeerJ,D
OI10.7717/peerj.3951
11/21

populations of European ancestry, which included more than 17,000 samples (Liu et al.,2015). Five of the six variants are either absent or present at very low frequencies in the EastAsian sample and have relatively low imputation scores (info < 0.8). The only exceptionis the polymorphism rs4268748 located near the MC1R gene, in which the minor allele(allele C) has a frequency of 27.4% and a good imputation score (info = 0. 983). None ofthe variants reached nominal significance in our East Asian sample, except the SLC24A5rs1426654 non-synonymous variant, which is present at a very low frequency in the sample(frequency of the derived A allele 1.6%).
DISCUSSIONIn this paper, we describe the results of a genome-wide association study of pigmentarytraits (skin pigmentation and iris color) in East Asian populations. We were able to confirmthe important role that the gene OCA2 plays in East Asian populations. In our iris colorGWA, we observed a genome-wide significant signal in the OCA2 region. The lead SNP inthis region was rs76930569, and this marker showed particularly strong associations withthe a* and b* color dimensions (p-values of 9.27×10⁻¹¹ and 5.30×10⁻¹², respectively).However, rs76930569 was not associated with delta, which is a measure that capturesiris heterochromia (e.g., the color differences between the pupillary and ciliary regionsof the iris). This indicates that the genetic architecture of iris color is different from thegenetic architecture of iris heterochromia. It is important to note that rs76930569 is invery strong linkage disequilibrium with the non-synonymous SNP rs1800414 (R2
= 1 inCHB, CHS and JPT 1KG samples). Not surprisingly, the p-values of rs1800414 were verysimilar to those of rs76930569 in our sample, and most probably this non-synonymousSNP is the causal polymorphism driving the association. A recent study (Yang et al., 2016)using cultured melanocytes, and transgenic and targeted gene modification analyses onzebrafish and mouse have shown that the rs1800414 G variant (Arg615) is functional andleads to skin lightening. In our skin pigmentation analysis, the rs1800414 G variant wasalso associated with lighter skin pigmentation, but did not reach genome-wide significance(beta=−0.81, p= 5.5×10⁻⁴). The magnitude of the skin pigmentation effect observed inour study is quite similar to the effects described in previous reports in which the M-indexwas used to describe constitutive pigmentation (e.g., Edwards et al., 2010, beta = −1.26 ina sample of individuals of East Asian ancestry living in Canada, and beta=−0.86 in a HanChinese sample; Eaton et al., 2015, beta = −0.91 in a sample of individuals of East Asianancestry living in Canada).
Aside from the eye color signal in the OCA2 region, no other regions surpassed thegenome-wide significance threshold for skin pigmentation or iris color. However, therewere several regions harboringmultiple commonmarkers with good imputation scores andsuggestive p-values (p< 10−5, Tables 1 and 2; File S1). For skin pigmentation, we followedup the lead SNPs for each region in three independent Chinese samples (Table 3). Oneof the SNPs, rs2373391, which is located in an intron of the gene ZNF804B, replicated inone of the Chinese samples (beta=−1.132, p= 0.003). The gene ZNF804B encodes a zincfinger protein, but it has been poorly characterized. Variants within this gene have been
Rawofi et al. (2017), PeerJ, DOI 10.7717/peerj.3951 12/21

nominally associated with a number of traits in previous GWA studies (Anorexia nervosa,Wang et al., 2011; Heschl’s gyrus morphology, (Cai et al., 2014; and IgG glycosylation,Lauc et al., 2013, among others), but to our knowledge no associations with pigmentarytraits have been reported for this or nearby genes. Given that we were able to replicate theassociation only in one of the three East Asian samples, it will be important to investigatethe potential role of this region in skin pigmentation in larger samples from East Asia.None of the other regions showing suggestive associations with skin pigmentation werereplicated in the follow-up samples.
Unfortunately, we could not follow up any of the suggestive regions identified for iriscolor, because of the lack of studies in East Asia reporting quantitative measures of iriscolor. In this study, we show that there is a substantial amount of variation in iris color inEast Asia (Fig. S2), and that theOCA2 region (and more particularly, the non-synonymousvariant rs1800414) is a major determinant of the variation observed. We estimated thatrs1800414 explains 11.9%, 10.4% and 6% of the variation observed in the b*, a* andL* coordinates in our sample, respectively. Therefore, there is a substantial amount ofvariation that remains unexplained in our sample. This highlights the need to carry outmore studies using quantitative measures of iris color in East Asia. Categorical definitionsof iris color would not be useful in East Asian populations, because in such a classificationmost of the irises would have been categorized as ‘‘brown’’, but there is a substantial rangeof L*, a* and b* values within this category.
To our knowledge, this is the first genome-wide association study of pigmentary traitsin East Asian populations. The main weakness of this study is the small sample size,which limits our statistical power to identify variants with small effects on skin and irispigmentation. Another limitation is that constitutive pigmentation was measured indifferent body sites (e.g., buttocks or inner arm) in the discovery and replication samples.Ideally, constitutive pigmentation should be measured in the buttocks, because there is lessexposure to UV in this body site. However, often it is not possible to obtain pigmentationmeasures in the buttocks, and constitutive pigmentation is measured in the inner upperarm. In this site, there may be some exposure to UV light, particularly at certain timesof the year, and several studies have reported that measurements of pigmentation in theinner arm are not interchangeable with estimates in the buttocks (Johansen et al., 2016;Bieliauskiene, Philipsen & Wulf, 2017). In the discovery sample from Canada, inner upperarm measures were collected either in the winter/early spring (January to April) or thefall (October and November), so it would not be expected that UVR exposure wouldhave a substantial effect on melanin levels. Similarly, in the two replication samples inwhich pigmentation measures were taken in the inner arm, Taizhou cohort and Collegestudents, the measures were collected in April, and September, respectively. Additionally,it is important to note that in one of the replication samples, pigmentation was reportedas the CIELAB L* value, instead of the M-index. Although these two measures are highlycorrelated (Shriver & Parra, 2000), ideally all the discovery and replication samples shouldhave beenmeasured using the same index. Given that measurements were taken in differentbody sites, and for one replication sample using different pigmentation units, we couldnot carry out a meta-analysis of the discovery and replication samples. Instead, in our
Rawofi et al. (2017), PeerJ, DOI 10.7717/peerj.3951 13/21

replication effort, we evaluated if the SNPs that were followed up in the replication samplesreached significance after Bonferroni-correction based on the number of independenttests. Finally, it is important to note that for this GWAS we used both directly genotypedand imputed data. This is the standard protocol used in this type of studies, because itincreases the power to identify associated variants (Spencer et al., 2009;Marchini & Howie,2010). We implemented two different strategies to minimize potential problems relatedto imputation: (1) we used tests implemented in the program SNPTEST that take intoaccount uncertainty in the imputed genotypes, and (2) we only followed up markers withvery high imputation scores (info > 0.8).
In spite of these limitations, this study provides important insights about the geneticarchitecture of skin and iris color in East Asian populations. Using the program Quanto(http://biostats.usc.edu/Quanto.html) we estimated that our skin pigmentation associationstudy (N = 305) had good power (>0.8) to identify variants explaining approximately12.5% of the variance of the trait. This implies that there are no polymorphic variantsin our samples with large effects on skin melanin levels. For iris color (N = 342), ourstudy had good power to identify variants explaining approximately 11% of the varianceof the trait, and in fact we identified a SNP with an effect of approximately that size. Itwill be critical to expand the number of genome-wide association studies in East Asianpopulations in order to be able to identify genetic markers with smaller effects on skin andiris pigmentation. We cannot exclude the possibility that there are variants with strongeffects on pigmentation that have been fixed in East Asian populations due to the actionof positive selection. This is something that happened in Europe with the well-knownSLC24A5 rs1426654 A allele, which is the variant with the largest effect on melanin levelsreported in human populations (Lamason et al., 2005). Identifying this type of variants, ifthey exist in East Asian populations, would require association studies in admixed sampleswith a substantial East Asian contribution.
We followed up in our East Asian sample genetic markers in 6 loci that have beenreported to influence skin pigmentation in European populations (SLC45A5, IRF4,HERC2, SLC24A5, DEF8/MC1R and RALY/ASIP, Table S1). Most of these variants areabsent (RALY/ASIP rs6059655) or present at very low frequencies in the East Asian sample(SLC45A2 rs16891982, IRF4 rs12203592, HERC2 rs12913832 and SLC24A5 rs4268748,Table S1). Because of their low frequencies, these SNPs explain little variation of skinpigmentation in East Asian populations. However, it is important to note that the estimatedeffect size of the derived SLC24A5 rs1426654 A allele in our GWAS is quite large (beta= −2.46), in agreement with numerous reports indicating that this is the locus with thestrongest effect on skin pigmentation so far described in human populations (Lamason etal., 2005; Basu Mallick et al., 2013; Beleza et al., 2013a; Beleza et al., 2013b). Only one of thevariants reaching genome-wide significance in a large GWAS study in a European sample(DEF8/MC1R rs4268748; Liu et al., 2015) is present with relatively high frequencies in ourEast Asian sample. In fact, the allele reported to decrease pigmentation in the Europeansample (C allele) is slightly more frequent in East Asian populations than in Europeanpopulations (28.5% in EAS 1000 Genomes Project sample vs. 22.8% in EUR 1000 Genomesproject). However, the rs4268748 polymorphism is not nominally significant in our sample.
Rawofi et al. (2017), PeerJ, DOI 10.7717/peerj.3951 14/21

One potential explanation is that rs4268748 is in linkage disequilibrium (LD) with causalloci in Europe, and the pattern of LD between rs4268748 and the causal loci, or theallele frequencies of the causal loci are different in European and East Asian populations.Supporting this explanation is the detailed analysis of the MC1R region reported forone of the European samples (Rotterdam study) included in Liu et al. (2015) GWAS.These authors described that 3 known high-penetrance variants located within the MC1Rgene (rs1805007 (R151C), rs1805008 (R160W), rs1805009 (D294H)) showed the mostsignificant associationwith skin pigmentation in the Rotterdam study sample, and replacingthe SNP rs4268748 by the high penetrance variants marginally increased the amount of thephenotypic variance explained. These threeMC1R high-penetrance variants, two of whichhave frequencies higher than 5% in Europe (rs1805007 and rs1805008), are not found orare found in extremely low frequencies in East Asia, and this may explain the absence ofan association signal in our study. Yamaguchi et al. (2012) reported that a low-penetranceMC1R variant, rs885479 (R163Q), which is common in East Asia (frequency derived 163Qallele in EAS 1000 Genomes project sample = 61.6%) but much less frequent in Europewas nominally associated with light skin in a Japanese sample. As expected, the rs885479polymorphism was present in our East Asian sample, with a frequency of the derived 163Qallele of 60.1%. However, this variant was not nominally associated with skin pigmentationin our sample (beta = −0.046, p= 0.843).
Overall, our study confirms previous research indicating that the evolution of light skin inEast Asia and Europe took place, at least to a large extent, independently in both groups afterthe split of the ancestral East Asian and European populations following the Out-of-Africamigration. In Europe, functional derived variants in the genes SLC24A5, SLC45A2 andOCA2/HERC2 increased in frequency as a result of positive selection (Lamason et al., 2005;Izagirre et al., 2006; Norton et al., 2007; Lao et al., 2007;Wilde et al., 2014). In East Asia, thenon-synonymous polymorphism rs1800414 located within the OCA2 gene dramaticallyincreased in frequency, also as a result of an independent selective event (Lao et al., 2007;Edwards et al., 2010; Donnelly et al., 2012; Hider et al., 2013). This constitutes, with lactasepersistence and adaptation to altitude, one of the most fascinating examples of convergentevolution in human populations.
CONCLUSIONHere we report the first genome-wide association of pigmentary traits (skin pigmentationand iris color) in East Asian populations. We measured these traits using quantitativemethods, and we show that there is considerable variation not only in skin pigmentationbut also in iris color, in spite of the fact that using categorical classifications, all the irisesin this sample would have been categorized as ‘‘brown’’. We confirmed the important rolethat the OCA2 gene plays in normal pigmentation variation in East Asian populations.In particular, the non-synonymous variant rs1800414 explains a substantial amount ofvariation in iris color. We did not observe any genome-wide significant variant for skinpigmentation, but one of the lead SNPs showing suggestive significance in our study,rs2373391, which is located in an intron of the ZNF804B gene on chromosome 7, was
Rawofi et al. (2017), PeerJ, DOI 10.7717/peerj.3951 15/21
replicated in an independent Chinese sample (p= 0.003). It will be critical to carry outadditional association studies in East Asian populations in order to uncover additionalvariants with smaller effects on skin pigmentation and iris color.
ACKNOWLEDGEMENTSWe would like to thank all the individuals who participated in this study.
ADDITIONAL INFORMATION AND DECLARATIONS
FundingLida Rawofi was funded by a Natural Sciences and Engineering Research Council (NSERC)CGS-M scholarship. Esteban J. Parra was funded by an NSERC Discovery Grant. HeatherL. Norton and Esteban J. Parra were funded by the US National Institute of Justice (grant2013-DN-BX-K011). InCanada, computationswere performed on theGPC supercomputerat the SciNet HPCConsortium. SciNet is funded by: the Canada Foundation for Innovationunder the auspices of Compute Canada; the Government of Ontario; Ontario ResearchFund—Research Excellence; and the University of Toronto. Yanyun Ma, JiucunWang andLi Jin were funded by grants from the National Science Foundation of China (31521003)the Science and Technology Committee of Shanghai Municipality (16JC1400500) and the111 project (B13016) from Ministry of Education of P.R.China. Bing Su was funded bygrants from the Strategic Priority Research Program of the Chinese Academy of Sciences(XDB13010000) and the National Natural Science Foundation of China (91631306). Thefunders had no role in study design, data collection and analysis, decision to publish, orpreparation of the manuscript.
Grant DisclosuresThe following grant information was disclosed by the authors:Natural Sciences and Engineering Research Council (NSERC) CGS-M scholarship.NSERC Discovery Grant.US National Institute of Justice: 2013-DN-BX-K011.Canada Foundation for Innovation.Government of Ontario; Ontario Research Fund—Research Excellence.University of Toronto.National Science Foundation of China: 31521003.Science and Technology Committee of Shanghai Municipality: 16JC1400500.Ministry of Education of P.R. China: B13016.Chinese Academy of Sciences: XDB13010000.National Natural Science Foundation of China: 91631306.
Competing InterestsThe authors declare there are no competing interests.
Rawofi et al. (2017), PeerJ, DOI 10.7717/peerj.3951 16/21

Author Contributions• Lida Rawofi analyzed the data, wrote the paper, prepared figures and/or tables, revieweddrafts of the paper.• Melissa Edwards performed the experiments, analyzed the data.• S Krithika performed the experiments.• Phuong Le and David Cha analyzed the data.• Zhaohui Yang and Yanyun Ma performed the experiments, analyzed the data.• Jiucun Wang and Bing Su analyzed the data, contributed reagents/materials/analysistools, reviewed drafts of the paper.• Li Jin analyzed the data, contributed reagents/materials/analysis tools.• Heather L. Norton contributed reagents/materials/analysis tools, reviewed drafts of thepaper.• Esteban J. Parra conceived and designed the experiments, analyzed the data, contributedreagents/materials/analysis tools, wrote the paper, prepared figures and/or tables,reviewed drafts of the paper.
Human EthicsThe following information was supplied relating to ethical approvals (i.e., approving bodyand any reference numbers):
The study was approved by the University of Toronto Research and Ethics Board(Protocol Reference #27015).
Data AvailabilityThe following information was supplied regarding data availability:
The raw data has been provided as a Supplemental File.
Supplemental InformationSupplemental information for this article can be found online at http://dx.doi.org/10.7717/peerj.3951#supplemental-information.
REFERENCESAbe Y, Tamiya G, Nakamura T, Hozumi Y, Suzuki T. 2013. Association of melanogene-
sis genes with skin color variation among Japanese females. Journal of DermatologicalScience 69:167–172 DOI 10.1016/j.jdermsci.2012.10.016.
Andersen JD, Johansen P, Harder S, Christoffersen SR, DelgadoMC, Henriksen ST,NielsenMM, Sørensen E, UllumH, Hansen T, Dahl AL, Paulsen RR, Børsting C,Morling N. 2013. Genetic analyses of the human eye colours using a novel objectivemethod for eye colour classification. Forensic Science International 7:508–515DOI 10.1016/j.fsigen.2013.05.003.
BasuMallick C, Iliescu FM,Möls M, Hill S, Tamang R, Chaubey G, Goto R, Ho SY,Gallego Romero I, Crivellaro F, Hudjashov G, Rai N, MetspaluM,Mascie-TaylorCG, Pitchappan R, Singh L, Mirazon-LahrM, Thangaraj K, Villems R, KivisildT. 2013a. The light skin allele of SLC24A5 in South Asians and Europeans sharesidentity by descent. PLOS Genetics 9:e1003912 DOI 10.1371/journal.pgen.1003912.
Rawofi et al. (2017), PeerJ, DOI 10.7717/peerj.3951 17/21

Beleza S, Johnson NA, Candille SI, Absher DM, CoramMA, Lopes J, Campos J, AraújoII, Anderson TM, Vilhjálmsson BJ, NordborgM, Correia E, Silva A, ShriverMD, Rocha J, Barsh GS, Tang H. 2013a. Genetic architecture of skin and eyecolor in an African-European admixed population. PLOS Genetics 9:e1003372DOI 10.1371/journal.pgen.1003372.
Beleza S, Santos AM,McEvoy B, Alves I, Martinho C, Cameron E, Shriver MD, ParraEJ, Rocha J. 2013b. The timing of pigmentation lightening in Europeans.MolecularBiology and Evolution 30:24–35 DOI 10.1093/molbev/mss207.
Bieliauskiene G, Philipsen PA,Wulf HC. 2017. Can constitutive pigmentation bemeasured on upper inner arm? Correlation between arm and buttocks pigmen-tation. Photodermatology, Photoimmunology and Photomedicine 33:233–236DOI 10.1111/phpp.12314.
Cai DC, Fonteijn H, Guadalupe T, Zwiers M,Wittfeld K, Teumer A, HoogmanM,Arias-Vasquez A, Yang Y, Buitelaar J, Fernandez G, Brunner HG, Van BokhovenH, Franke B, Hegenscheid K, Homuth G, Fisher SE, Grabe HJ, Francks C, HagoortP. 2014. A genome-wide search for quantitative trait loci affecting the corticalsurface area and thickness of Heschl’s gyrus. Genes Brain and Behavior 13:675–685DOI 10.1111/gbb.12157.
Chen H, Hey J, SlatkinM. 2015. A hidden Markov model for investigating recent positiveselection through haplotype structure. Theoretical Population Biology 99:18–30DOI 10.1016/j.tpb.2014.11.001.
Delaneau O, Marchini J, Zagury JF. 2012. A linear complexity phasing method forthousands of genomes. Nature Methods 9:179–181 DOI 10.1038/nmeth.1785.
Donnelly MP, Paschou P, Grigorenko E, Gurwitz D, Barta C, Lu RB, Zhukova OV,Kim JJ, SiniscalcoM, NewM, Li H, Kajuna SL, Manolopoulos VG, SpeedWC,Pakstis AJ, Kidd JR, Kidd KK. 2012. A global view of the OCA2-HERC2 region andpigmentation. Human Genetics 131:683–696 DOI 10.1007/s00439-011-1110-x.
Durbin R. 2014. Efficient haplotype matching and storage using the positional Burrows-Wheeler transform (PBWT). Bioinformatics 30:1266–1272DOI 10.1093/bioinformatics/btu014.
Eaton K, Edwards M, Krithika S, Cook G, Norton H, Parra EJ. 2015. Associationstudy confirms the role of two OCA2 polymorphisms in normal skin pigmentationvariation in East Asian populations. American Journal of Human Biology 27:520–525DOI 10.1002/ajhb.22678.
Edwards M, Bigham A, Tan JZ, Li SL, Gozdzik A, Ross K, Jin L, Parra EJ. 2010. Asso-ciation of the OCA2 polymorphism His615Arg with melanin content in East Asianpopulations: further evidence of convergent evolution of skin pigmentation. PLOSGenetics 6:e1000867 DOI 10.1371/journal.pgen.1000867.
Edwards M, Cha D, Krithika S, JohnsonM, Cook G, Parra EJ. 2016. Iris pigmentationas a quantitative trait: variation in populations of European, East Asian and SouthAsian ancestry and association with candidate gene polymorphisms. Pigment Cell &Melanoma Research 29:141–162 DOI 10.1111/pcmr.12435.
Rawofi et al. (2017), PeerJ, DOI 10.7717/peerj.3951 18/21

Edwards M, Gozdzik A, Ross K, Miles J, Parra EJ. 2012. Technical note: quantitativemeasures of iris color using high resolution photographs. American Journal ofPhysical Anthropology 147:141–149 DOI 10.1002/ajpa.21637.
Hider JL, Gittelman RM, Shah T, Edwards M, Rosenbloom A, Akey JM, ParraEJ. 2013. Exploring signatures of positive selection in pigmentation candidategenes in populations of East Asian ancestry. BMC Evolutionary Biology 13:150DOI 10.1186/1471-2148-13-150.
Izagirre N, García I, Junquera C, De la Rúa C, Alonso S. 2006. A scan for signaturesof positive selection in candidate loci for skin pigmentation in humans.MolecularBiology and Evolution 23:1697–1706 DOI 10.1093/molbev/msl030.
Johansen P, Andersen JD, Madsen LN, UllumH, GludM, Børsting C, Gniadecki R,Morling N. 2016. Pigmentary markers in Danes–associations with quantitative skincolour, Nevi Count, familial atypical multiple-mole, and melanoma syndrome. PLOSONE 11:e0150381 DOI 10.1371/journal.pone.0150381.
Kayser M, Liu F, Janssens A, Rivadeneira F, Lao O, Van Duijn K, VermeulenM,Arp P, Jhamai MM, Van IjckenWFJ, Den Dunnen JT, Heath S, Zelenika D,Despriet DDG, Klaver CCW, Vingerling JR, De Jong P, Hofman A, Aulchenko YS,Uitterlinden AG, Oostra BA, Van Duijn CM. 2008. Three genome-wide associationstudies and a linkage analysis identify HERC2 as a human iris color gene. AmericanJournal of Human Genetics 82:411–423 DOI 10.1016/j.ajhg.2007.10.003.
Lamason RL, MohideenM,Mest JR,Wong AC, Norton HL, Aros MC, Jurynec MJ,Mao XY, Humphreville VR, Humbert JE, Sinha S, Moore JL, Jagadeeswaran P,ZhaoW, Ning G, Makalowska I, McKeigue PM, O’Donnell D, Kittles R, Parra EJ,Mangini NJ, Grunwald DJ, Shriver MD, Canfield VA, Cheng KC. 2005. SLC24A5,a putative cation exchanger, affects pigmentation in zebrafish and humans. Science310:1782–1786 DOI 10.1126/science.1116238.
Lao O, De Gruijter JM, Van Duijn K, Navarro A, Kayser M. 2007. Signatures of positiveselection in genes associated with human skin pigmentation as revealed fromanalyses of single nucleotide polymorphisms. Annals of Human Genetics 71:354–369DOI 10.1111/j.1469-1809.2006.00341.x.
Lauc G, Huffman JE, Pucic M, Zgaga L, Adamczyk B, Muzinic A, Novokmet M, PolasekO, Gornik O, Kristic J, Keser T, Vitart V, Scheijen B, Uh HW,Molokhia M, PatrickAL, McKeigue P, Kolcic I, Lukic IK, Swann O, Van Leeuwen FN, Ruhaak LR,Houwing-Duistermaat JJ, Slagboom PE, BeekmanM, De Craen AJM, DeelderAM, Zeng Q,WangW, Hastie ND, Gyllensten U,Wilson JF, Wuhrer M,WrightAF, Rudd PM, Hayward C, Aulchenko Y, Campbell H, Rudan I. 2013. Lociassociated with N-glycosylation of human immunoglobulin G show pleiotropywith autoimmune diseases and haematological cancers. PLOS Genetics 9:e1003225DOI 10.1371/journal.pgen.1003225.
Liu F, Visser M, Duffy DL, Hysi PG, Jacobs LC, Lao O, Zhong KY,Walsh S, ChaitanyaL,Wollstein A, Zhu G, Montgomery GW, Henders AK, ManginoM, Glass D,Bataille V, Sturm RA, Rivadeneira F, Hofman A, Van IjckenWFJ, UitterlindenAG, Palstra R, Spector TD, Martin NG, Nijsten TEC, Kayser M. 2015. Genetics of
Rawofi et al. (2017), PeerJ, DOI 10.7717/peerj.3951 19/21
skin color variation in Europeans: genome-wide association studies with functionalfollow-up. Human Genetics 134:823–835 DOI 10.1007/s00439-015-1559-0.
Liu F,Wollstein A, Hysi PG, Ankra-Badu GA, Spector TD, Park D, Zhu G, LarssonM,Duffy DL, Montgomery GW,Mackey DA,Walsh S, Lao O, Hofman A, RivadeneiraF, Vingerling JR, Uitterlinden AG, Martin NG, Hammond CJ, Kayser M. 2010.Digital quantification of human eye color highlights genetic association of three newloci. PLOS Genetics 6:e1000934 DOI 10.1371/journal.pgen.1000934.
Marchini J, Howie B. 2010. Genotype imputation for genome-wide association studies.Nature Reviews Genetics 11:499–511 DOI 10.1038/nrg2796.
Murray N, Norton H, Parra EJ. 2015. Distribution of two OCA2 polymorphismsassociated with pigmentation in East Asian populations. Human Genome Variation2:15058 DOI 10.1038/hgv.2015.58.
Norton HL, Edwards M, Krithika S, JohnsonM,Werren EA, Parra EJ. 2016. Quantita-tive assessment of skin, hair, and iris variation in a diverse sample of individuals andassociated genetic variation. American Journal of Physical Anthropology 160:570–581DOI 10.1002/ajpa.22861.
Norton HL1, Kittles RA, Parra E, McKeigue P, Mao X, Cheng K, Canfield VA, BradleyDG, McEvoy B, Shriver MD. 2007. Genetic evidence for the convergent evolution oflight skin in Europeans and East Asians.Molecular Biology and Evolution 24:710–722DOI 10.1093/molbev/msl203.
Shriver MD, Parra EJ. 2000. Comparison of narrow-band reflectance spectroscopyand tristimulus colorimetry for measurements of skin and hair color in persons ofdifferent biological ancestry. American Journal of Physical Anthropology 112:17–27DOI 10.1002/(SICI)1096-8644(200005)112:1<17::AID-AJPA3>3.0.CO;2-D.
Spencer CC, Su Z, Donnelly P, Marchini J. 2009. Designing genome-wide associationstudies: sample size, power, imputation, and the choice of genotyping chip. PLOSGenetics 5:e1000477 DOI 10.1371/journal.pgen.1000477.
Sturm RA, Duffy DL, Zhao ZZ, Leite FPN, StarkMS, Hayward NK, Martin NG,Montgomery GW. 2008. A single SNP in an evolutionary conserved region withinintron 86 of the HERC2 gene determines human blue-brown eye color. AmericanJournal of Human Genetics 82:424–431 DOI 10.1016/j.ajhg.2007.11.005.
Visser M, Kayser M, Palstra RJ. 2012.HERC2 rs12913832 modulates human pigmenta-tion by attenuating chromatin-loop formation between a long-range enhancer andthe OCA2 promoter. Genome Research 22:446–455 DOI 10.1101/gr.128652.111.
Walsh S, Lindenbergh A, Zuniga SB, Sijen T, De Knijff P, Kayser M, Ballantyne KN.2011. Developmental validation of the IrisPlex system: determination of blue andbrown iris colour for forensic intelligence. Forensic Science International-Genetics5:464–471 DOI 10.1016/j.fsigen.2010.09.008.
Wang K, Zhang H, Bloss CS, Duvvuri V, KayeW, Schork NJ, Berrettini W, HakonarsonH, the Price Foundation Collaborative Group. 2011. A genome-wide associationstudy on common SNPs and rare CNVs in anorexia nervosa.Molecular Psychiatry16:949–959 DOI 10.1038/mp.2010.107.
Rawofi et al. (2017), PeerJ, DOI 10.7717/peerj.3951 20/21

Wilde S, Timpson A, Kirsanow K, Kaiser E, Kayser M, Unterländer M, Hollfelder N,Potekhina ID, SchierW, ThomasMG, Burger J. 2014. Direct evidence for positiveselection of skin, hair, and eye pigmentation in Europeans during the last 5,000y. Proceedings of the National Academy of Sciences of the United States of America111:4832–4837 DOI 10.1073/pnas.1316513111.
Wollstein A,Walsh S, Liu F, Chakravarthy U, RahuM, Seland JH, Soubrane G,Tomazzoli L, Topouzis F, Vingerling JR, Vioque J, Bohringer S, Fletcher AE,Kayser M. 2017. Novel quantitative pigmentation phenotyping enhances geneticassociation, epistasis, and prediction of human eye colour. Scientific Reports 7:43359DOI 10.10.1038/srep43359.
Yamaguchi K,Watanabe C, Kawaguchi A, Sato T, Naka I, ShindoM,Moromizato K,Aoki K, Ishida H, Kimura R. 2012. Association of melanocortin 1 receptor gene(MC1R) polymorphisms with skin reflectance and freckles in Japanese. Journal ofHuman Genetics 57:700–708 DOI 10.1038/jhg.2012.96.
Yang ZH, Zhong H, Chen J, Zhang XM, Zhang H, Luo X, Xu SH, Chen H, Lu DS, HanYL, Li JK, Fu LJ, Qi XB, Peng Y, Xiang K, Lin Q, Guo Y, Li M, Cao XY, ZhangYF, Liao SY, Peng YM, Zhang L, Guo XS, Dong SS, Liang F,Wang J, WilldenA, Aun HS, Serey B, Sovannary T, Bunnath L, SamnomH,Mardon G, Li QW,Meng AM, Shi H, Su B. 2016. A genetic mechanism for convergent skin lighteningduring recent human evolution.Molecular Biology and Evolution 33:1177–1187DOI 10.1093/molbev/msw003.
Rawofi et al. (2017), PeerJ, DOI 10.7717/peerj.3951 21/21