genetics and bioinformatics gbio0002
TRANSCRIPT

Genetics and BioinformaticsGBIO0002
Archana Bhardwaj
AB-ULg 113/11/2018

The FASTA format is a simple and widely used format for storing biological (DNA or protein) sequences.
It was first used by the FASTA program for sequence alignment.
It begins with a single-line description starting with a “>” character, followed by lines of sequences.
Here is an example of a FASTA file:
> A06852 183 residues MPRLFSYLLGVWLLLSQLPREIPGQSTNDFIKACGRELVRLWVEICGSVSWGRTALSLEE PQLETGPPAETMPSSITKDAEILKMMLEFVPNLPQELKATLSERQPSLRELQQSASKDSN LNFEEFKKIILNRQNEAEDKSLLELKNLGLDKHSRKKRLFRMTLSEKCCQVGCIRKDIARLC
FASTA format
AB-ULg 213/11/2018

Sequence Database
The National Centre for Biotechnology Information (NCBI)(www.ncbi.nlm.nih.gov) in the US maintains a huge database of all the DNAand protein sequence data that has been collected, the NCBI SequenceDatabase
A similar database in Europe, the European Molecular Biology Laboratory(EMBL) Sequence Database (www.ebi.ac.uk/embl)
A similar database in Japan, the DNA Data Bank of Japan (DDBJ;www.ddbj.nig.ac.jp).
These three databases exchange data every night, so at any one point intime, they contain almost identical data.
AB-ULg 313/11/2018

Each sequence in the NCBI Sequence Database is stored in a
separate record, and is assigned a unique identifier that can be
used to refer to that sequence record.
The identifier is known as an accession, and consists of a
mixture of numbers and letters.
The NCBI accessions for the DNA sequences of the DEN-1, DEN-
2, DEN-3, and DEN-4 Dengue viruses are NC_001477, NC_001474,NC_001475 and NC_002640, respectively.
AB-ULg 413/11/2018

Retrieving genome sequence data via the NCBI website
You can easily retrieve DNA or protein sequence data from the NCBISequence Database via its website www.ncbi.nlm.nih.gov
AB-ULg 513/11/2018

AB-ULg 613/11/2018

To retrieve the DNA sequence for the DEN-1 Dengue virus genomesequence as a FASTA format sequence file, click on “Send” at the topright of the NC_001477 sequence record webpage,
Then choose “File” in the pop-up menu that appears, and then chooseFASTA from the “Format” menu that appears, and click on “Create file”
File format
AB-ULg 713/11/2018

You can now open the FASTA file containing the DEN-1 Dengue virus genome sequence using WordPad on your computer.
AB-ULg 813/11/2018

Reading sequence data into R
> library(“seqinr")
> dengueseq<- read.fasta(file = “seq.fasta")
> dengueseq <- dengueseq[[1]]
The first element of the list object dengue contains the the DNAsequence.
Load Library
AB-ULg 913/11/2018
Read sequence using read.fasta
if (!requireNamespace("BiocManager", quietly = TRUE)) install.packages("BiocManager") BiocManager::install(“seqinr")
Install seqinr package

Length of a DNA sequence
Once you have retrieved a DNA sequence, we can obtain some simplestatistics to describe that sequence, such as the sequence’s total lengthin nucleotides.
To subsequently obtain the length of the genome sequence, wewould use the length() function, typing:
> length(dengueseq)
[1] 10735
AB-ULg 1013/11/2018

Base composition of a DNA sequence
> table(dengueseq)
dengueseqa c g t 3426 2240 2770 2299
To subsequently obtain the composition of the genome sequence,we would use the table() function, typing:
AB-ULg 1113/11/2018

Words
Short strings of letters from an alphabet
A word of length k is called a k-word or k-tuple
Examples:
1-tuple: individual nucleotide
2-tuple: dinucleotide
3-tuple: codon
AB-ULg 1213/11/2018
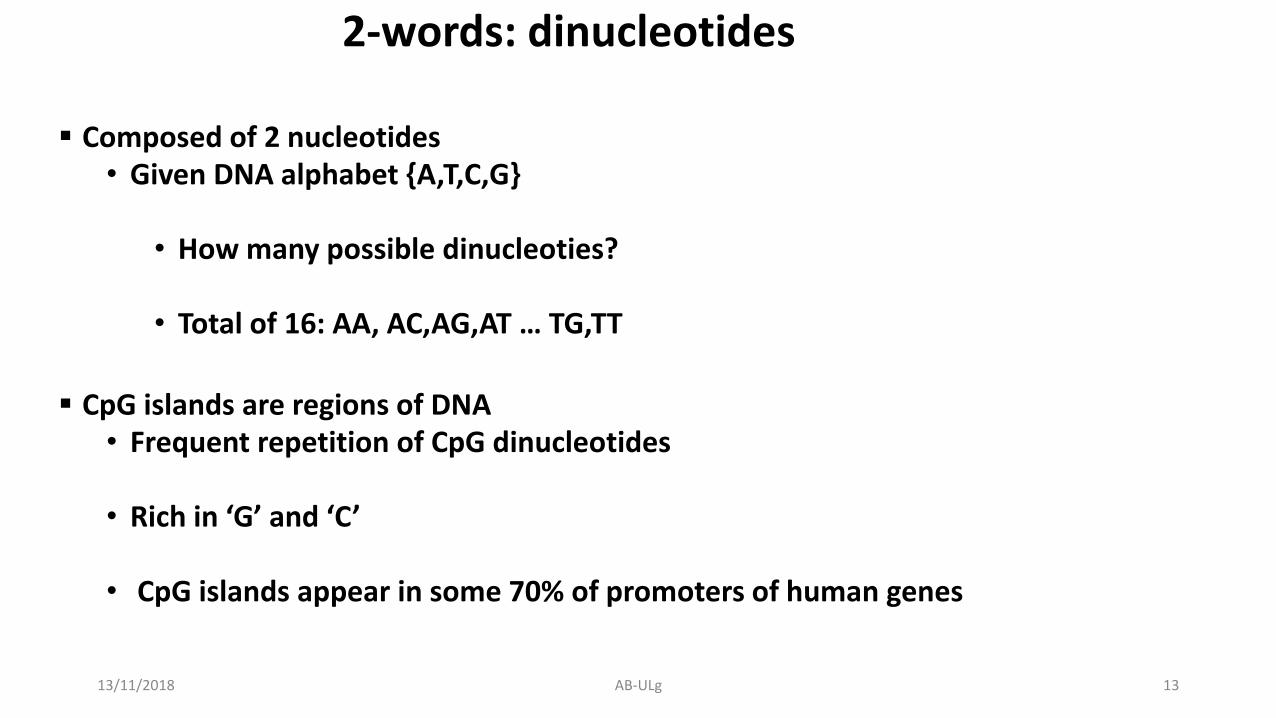
2-words: dinucleotides
Composed of 2 nucleotides• Given DNA alphabet {A,T,C,G}
• How many possible dinucleoties?
• Total of 16: AA, AC,AG,AT … TG,TT
CpG islands are regions of DNA• Frequent repetition of CpG dinucleotides
• Rich in ‘G’ and ‘C’
• CpG islands appear in some 70% of promoters of human genes
AB-ULg 1313/11/2018

if you want to know the frequency of all DNA words that are 2 nucleotides long inthe Dengue virus genome sequence, you can type:
> count(dengueseq, 2)aa ac ag at ca cc cg ct ga gc gg gt ta tc tg tt1108 720 890 708 901 523 261 555 976 500 787 507 440 497 832 529
DNA di-nucletides words
AB-ULg 1413/11/2018

3-words: codons
Important in case of DNA sequences
Linked to expression
DNA RNA protein
AB-ULg 1513/11/2018

GC Content of DNA
One of the most fundamental properties of a genomesequence is its GC content, the fraction of the sequence thatconsists of Gs and Cs, ie. the %(G+C).
You can easily calculate the GC content based on the numberof As, Gs, Cs, and Ts in the genome sequence.
> GC(dengueseq)
[1] 0.4666977
For example, for the DEN-1 Dengue virus genomesequence, we know from using the table() function abovethat the genome contains 3426 As, 2240 Cs, 2770 Gs and2299 Ts. Therefore, we can calculate the GC content usingthe command:
Nucleotide bonds showing AT
and GC pairs. Arrows point to
the hydrogen bonds
AB-ULg 1613/11/2018

Although the GC content of the whole DEN-1 Dengue virus genome sequence is about46.7%, there is probably local variation in GC content within the genome.
That is, some regions of the genome sequence may have GC contents quite a bithigher than 46.7%, while some regions of the genome sequence may have GCcontents that are quite a big lower than 46.7%.
Local fluctuations in GC content within the genome sequence can provide differentinteresting information, for example, they may reveal cases of horizontal transfer orreveal biases in mutation.
Local variation in GC content
AB-ULg 1713/11/2018

A sliding window analysis of GC content
In order to study local variation in GC content within a genome sequence, we couldcalculate the GC content for small chunks of the genome sequence.
> GC(dengueseq[1:2000]) # Calculate the GC content of nucleotides 1-2000 of the Dengue genome[1] 0.465> GC(dengueseq[2001:4000]) # Calculate the GC content of nucleotides 2001-4000 of the Dengue genome[1] 0.4525> GC(dengueseq[4001:6000]) # Calculate the GC content of nucleotides 4001-6000 of the Dengue genome[1] 0.4705> GC(dengueseq[6001:8000]) # Calculate the GC content of nucleotides 6001-8000 of the Dengue genome[1] 0.479> GC(dengueseq[8001:10000]) # Calculate the GC content of nucleotides 8001-10000 of the Dengue genome[1] 0.4545> GC(dengueseq[10001:10735]) # Calculate the GC content of nucleotides 10001-10735 of the Dengue genome[1] 0.4993197
AB-ULg 1813/11/2018

• In R, it is possible to write a for loop to carry out the same command several times.
• For example, if we want to print out the square of each number between 1 and 10, we can write the following for loop:
> for (i in 1:10) { print (i*i) }[1] 1[1] 4[1] 9[1] 16[1] 25[1] 36[1] 49[1] 64[1] 81[1] 100
the variable i is a counter for the number of cycles through
the loop
In the first cycle through the loop, the value of i is 1, and
so i * i =1 is printed out.
In the second cycle through the loop, the value of i is 2,
and so i * i =4 is printed out
for loop in R
AB-ULg 1913/11/2018

Lets us create a new function
We can also create our own functions in R to do calculations that you want tocarry out very often on different input data sets.
For example, we can create a function to calculate the value of 20 plus the squareof some input number:
> myfunction <- function(x) { return(20 + (x*x)) }
This function will calculate the square of a number (x), and then add 20 to that value. The return() statement returns the calculated value.
we can use the function for different input numbers (eg. 10, 25):
> myfunction(10)[1] 120> myfunction(25)[1] 645 AB-ULg 2013/11/2018

For loop - GC content
We set the variable n to be equal
to the number of elements in the
vector starts,
The line “for (i in 1:n)” means that the counter
i will take values of 1-5 in subsequent cycles
of the for loop.
AB-ULg 2113/11/2018
> starts <- seq(1, length(dengueseq)-2000, by = 2000)> n <- length(starts) # Find the length of the vector "starts"> chunkGCs <- numeric(n) # Make a vector of the same length as vector "starts", but just containing zeroes> for (i in 1:n) {
chunk <- dengueseq[starts[i]:(starts[i]+1999)]chunkGC <- GC(chunk)print(chunkGC)chunkGCs[i] <- chunkGC
}> plot(starts,chunkGCs,type="b",xlab="Nucleotide start position",ylab="GC content")

> plot(starts,chunkGC,type="b",xlab="Nucleotide start position",ylab="GC content")
A sliding window plot of GC content
AB-ULg 2213/11/2018

> slidingwindowplot <- function(windowsize, inputseq){
starts <- seq(1, length(inputseq)-windowsize, by = windowsize)n <- length(starts) # Find the length of the vector "starts"chunkGCs <- numeric(n) # Make a vector of the same length as vector "starts", but just containing zeroesfor (i in 1:n) {
chunk <- inputseq[starts[i]:(starts[i]+windowsize-1)]chunkGC <- GC(chunk)print(chunkGC)chunkGCs[i] <- chunkGC
}plot(starts,chunkGCs,type="b",xlab="Nucleotide start position",ylab="GC content")
}
Create a new Function to plot slidingwindoplot
AB-ULg 2313/11/2018

> slidingwindowplot(300, dengueseq)
> slidingwindowplot(3000, dengueseq)
Let us plot GC content in different window size
AB-ULg 2413/11/2018

It is interesting to identify DNA words that are two nucleotides long (“dinucleotides”,ie. “AT”, “AC”, etc.) that are over-represented or under-represented in a DNAsequence.
If a particular DNA word is over-represented in a sequence, it means that it occursmany more times in the sequence than you would have expected by chance.
Similarly, if a particular DNA word is under-represented in a sequence, it means itoccurs far fewer times in the sequence than you would have expected.
Over and under represented words (1)
AB-ULg 2513/11/2018
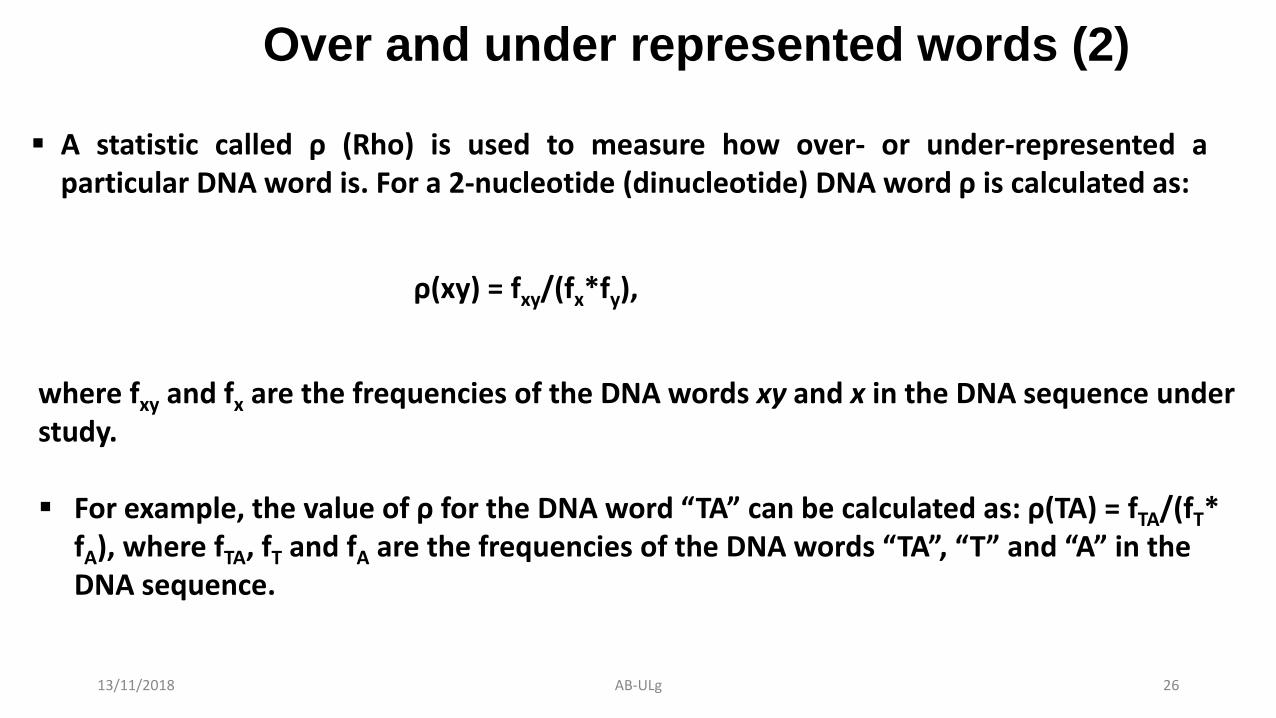
A statistic called ρ (Rho) is used to measure how over- or under-represented aparticular DNA word is. For a 2-nucleotide (dinucleotide) DNA word ρ is calculated as:
ρ(xy) = fxy/(fx*fy),
where fxy and fx are the frequencies of the DNA words xy and x in the DNA sequence under study.
For example, the value of ρ for the DNA word “TA” can be calculated as: ρ(TA) = fTA/(fT* fA), where fTA, fT and fA are the frequencies of the DNA words “TA”, “T” and “A” in the DNA sequence.
Over and under represented words (2)
AB-ULg 2613/11/2018
13/11/2018 AB-ULg 27
If this were true, then ρ would be equal to 1.
If we find that ρ is much greater than 1 for a particular 2-nucleotide word in a sequence, it indicates that that 2-nucleotide word is much more common in that sequence than expected (ie. it is over-represented).
If ρ is much less than 1 , for a particular 2-nucleotide word in a sequence, indicates under represented
The frequencies of the 2-nucleotide DNA words in a sequence are expected to be equal the products of the specific frequencies of the two nucleotides that compose them.
Over and under represented words (3)

> count(dengueseq, 1) # Get the number of occurrences of 1-nucleotide DNA wordsa c g t3426 2240 2770 2299
> 2770/(3426+2240+2770+2299) # Get fG[1] 0.2580345> 2240/(3426+2240+2770+2299) # Get fC[1] 0.2086633> count(dengueseq, 2) # Get the number of occurrences of 2-nucleotide DNA wordsaa ac ag at ca cc cg ct ga gc gg gt ta tc tg tt1108 720 890 708 901 523 261 555 976 500 787 507 440 497 832 529> 500/(1108+720+890+708+901+523+261+555+976+500+787+507+440+497+832+529) # Get fGC[1] 0.04658096> 0.04658096/(0.2580345*0.2086633) # Get rho(GC)[1] 0.8651364
Let us calculate Rho (ρ) for GC
AB-ULg 2813/11/2018

13/11/2018 AB-ULg 29
Check how many of these are over and under represented sequences indengu sequence
TA
GA
CT
Exercise

A sequence alignment is a way of arrangingthe sequences of DNA , RNA, or protein to identifyregions of similarity.
Comparable ?
What is Sequence Alignment ?
AB-ULg 3013/11/2018

Sequence Alignment :Uses (1)
Sequence Assembly : Genome sequence are assembledby using the sequence alignment methods to find theoverlap between many short pieces of DNA .
AB-ULg 3113/11/2018

Gene Finding : Sequence similarity could help us to find the geneprediction just by doing comparison against the other set ofsequences.
Sequence Alignment :Uses (2)
AB-ULg 3213/11/2018

Function prediction : Function of any unknown sequence could bepredicted by comparing with other known sequence .
Sequence Alignment :Uses (3)
AB-ULg 3313/11/2018

Types of Alignments
Global : This attempt to align every residue in every sequence.
Local: It is more useful for dissimilar sequences that are suspected tocontain regions of similarity or similar sequence motifs within theirlarger sequence context.
AB-ULg 3413/11/2018

Pair wise Sequence Alignment : This alignments can only be usedbetween two sequences at a time.
Multiple Sequence Alignment : This alignments can only be usedbetween more than two sequences at a time.
Types of Alignments: Based on number of sequences
AB-ULg 3513/11/2018

Tools for Sequence Alignments
There are many tools for sequence Alignment. In this session, we willdiscuss about
BLAST
CLUSTALW
AB-ULg 3613/11/2018

BLAST stands for Basic Local Alignment Search Tool
Sequence Alignment : BLAST
AB-ULg 3713/11/2018

sequences, and identify library sequences that resemblethe query sequence above a certain threshold.
DATABASE
AB-ULg 38
A BLAST search enables a researcher to compare a
query sequence with a library or databases of
13/11/2018

Types of BLAST (1)
BLASTN
: search nucleotide databases using anucleotide query(A)Query : ATGCATCGATC(B) Database : ATCGATGATCGACATCGATCAGCTACG
BLASTP : search protein databases using a proteinquery
(A)Query : VIVALASVEGAS(B) DATABASE : TARDEFGGAVIVADAVISASTILHGGQWLC
BLASTX : search protein databases using a translatednucleotide query
(A)Query : ATGCATCGATC(B)DATABASE : TARDEFGGAVIVADAVISASTILHGGQWLC
AB-ULg 3913/11/2018

TBLASTN : search translated nucleotide databasesusing a protein query
(A)Query : TARDEFGGAVI(B)DATABASE : ATCGATGATCGACATCGATCAGCTACG
TBLASTX : search translated nucleotide databasesusing a translated nucleotide query
(A)Query : CGATGATCG(B)DATABASE : ATCGATGATCGACATCGATCAGCTACG
Types of BLAST (2)
AB-ULg 4013/11/2018

Types of BLAST : ALL
AB-ULg 4113/11/2018

Construct a dictionary of all words in the query
Initiate a local alignment for each word matchbetween query and DB
How does BLAST Works?
AB-ULg 4213/11/2018

AB-ULg 43
BLAST: Global Alignment
It compares the whole sequence with another sequence.
So, output of Global is one to one comparison of two sequences.
This method is useful if you have small group of sequences.
13/11/2018

Global alignment
AB-ULg 4413/11/2018

Global alignment (NW -Needleman–Wunsch) Sequences are aligned end-to-end along their entire length
Many possible alignments are produced
• The alignment with the highest score is chosen
Naïve algorithm is very inefficient (Oexp)
Impractical for sequences of length >20 nt
Used to analyze homology/similarity of
• genes and proteins
• between species
AB-ULg 4513/11/2018

Methodology of global alignment (1 of 4)
• Define scoring scheme for each event
• mismatch between ai and bj
• 𝒔 𝒂𝒊, 𝒃𝒋 = −𝟏 if 𝒂𝒊 ≠ 𝒃𝒋• gap (insertion or deletion)
• 𝒔 𝒂𝒊, − = 𝒔 −, 𝒃𝒋 = −𝟐
• match between ai and bj
• 𝒔 𝒂𝒊, 𝒃𝒋 = +𝟐 if 𝒂𝒊 = 𝒃𝒋
• Provide no restrictions on minimal score
• Start completing the alignment MxN matrix
s1: ..AATA..
s2: ..AACA..
s1: ..AAT-A..
s2: ..AACA..
s1: ..AATA..
s2: ..AATA..
AB-ULg 4613/11/2018

Methodology of global alignment (2 of 4)
• The matrix should have extra column and row• M+1 columns , where M is the length sequence M
• N+1 rows, where N is the length of sequence N
1. Initialize the matrix• introduce gap penalty at every initial position along rows and columns
• Scores at each cell are cumulative
W H A T
0 -2 -4 -6 -8
W -2
H -4
Y -6
-2 -2 -2 -2-2
-2
-2
AB-ULg 4713/11/2018

Methodology of global alignment (3 of 4)
2. Alignment possibilities
Gap (horiz/vert) Match (W-W diag.)
3. Select the maximum score
• Best alignmentW H A T
0 -2 -4 -6 -8
W -2 2 0 -2 -4
H -4 0 4 2 0
Y -6 -2 2 3 1
W H0 -2 -4
W -2 -4
W H0 -2 -4
W -2 +2-2
-2+2-OR-
AB-ULg 4813/11/2018
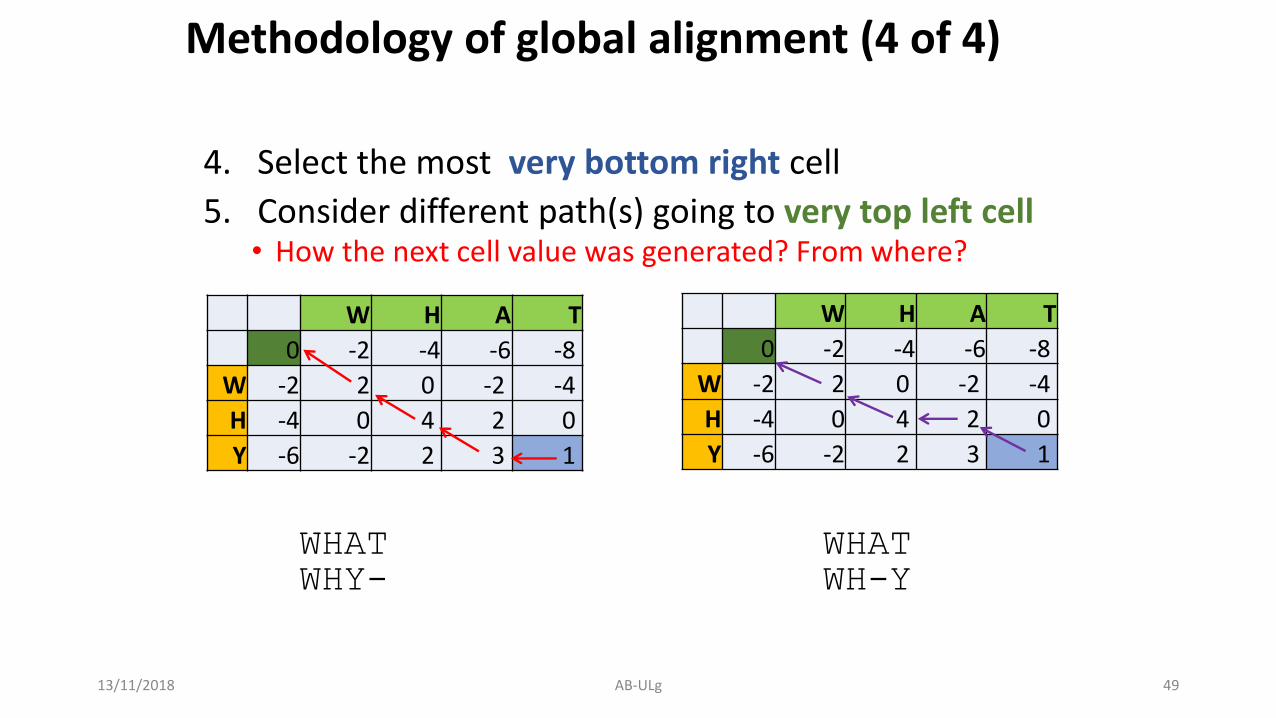
Methodology of global alignment (4 of 4)
4. Select the most very bottom right cell
5. Consider different path(s) going to very top left cell• How the next cell value was generated? From where?
WHAT WHATWHY- WH-Y
W H A T
0 -2 -4 -6 -8
W -2 2 0 -2 -4
H -4 0 4 2 0
Y -6 -2 2 3 1
W H A T
0 -2 -4 -6 -8
W -2 2 0 -2 -4
H -4 0 4 2 0
Y -6 -2 2 3 1
AB-ULg 4913/11/2018

13/11/2018 AB-ULg 50
1. Creat scoring matrix of CTTCA and CTACA where mismatch -1,gap -2 and Match +5
2. Give the track back arrow
3. Write alignment
Exercise

(A) GCATTACTAATATATTAGTAAATCAGAGTAGTA|||||||||
(B) AAGCGAATAATATATTTATACTCAGATTATTGCGCG
Local method uses the subset of sequence andattempts to align againstsequence.
the subset of another
So, output of local alignment gives the subset ofregions which are highly similar.
Example : Compare two sequence A and B
BLAST: Local Alignment
AB-ULg 5113/11/2018

Local alignment
13/11/2018 AB-ULg 52

Local alignment (Smith–Waterman)
Sequences are aligned to find regions where the best alignment occurs (i.e. highest score)
Assumes a local context (aligning parts of seq.)
Ideal for finding short motifs, DNA binding sites
helix-loop-helix (bHLH) - motif
TATAAT box (a famous promoter region) – DNA binding site
Works well on highly divergent sequences
13/11/2018 AB-ULg 53

Methodology of local alignment (1 of 4)
• The scoring system is similar with one exception
• The minimum possible score in the matrix is zero
• There are no negative scores in the matrix
• Let’s define the scoring system as in global
mismatch between seq. ai and bj gap (insertion or deletion)
𝒔 𝒂𝒊, 𝒃𝒋 = −𝟏 if 𝒂𝒊 ≠ 𝒃𝒋 𝒔 𝒂𝒊, − = 𝒔 −, 𝒃𝒋 = −𝟐
match between ai and bj
𝒔 𝒂𝒊, 𝒃𝒋 = +𝟐 if 𝒂𝒊 = 𝒃𝒋
13/11/2018 AB-ULg 54

Methodology of local alignment (2 of 4)
• Construct the MxN alignment matrix with M+1 columns and N+1 rows
• Initialize the matrix by introducing gap penalty at 1st row and 1st column
W H A T
0 0 0 0 0
W 0
H 0
Y 0
s(a,b) ≥ 0(min value is zero)
13/11/2018 AB-ULg 55

Methodology of local alignment (3 of 4)
• For each subsequent cell consider alignments
• Vertical s(I, - )
• Horizontal s(-,J)
• Diagonal s(I,J)
• For each cell select the highest score
• If score is negative assign zero
W H A T
0 0 0 0 0
W 0 2 0 0 0
H 0 0 4 2 0
Y 0 0 2 3 113/11/2018 AB-ULg 56

Methodology of local alignment (4 of 4)
• Select the initial cell with the highest score(s)
• Consider different path(s) leading to score of zero• Trace-back the cell values
• Look how the values were originated (i.e. path)
WH
WH
• Mathematically• where S(I, J) is the score for sub-sequences I and J
W H A T
0 0 0 0 0
W 0 2 0 0 0
H 0 0 4 2 0
Y 0 0 2 3 1
total score of 4B
A
J
I
13/11/2018 AB-ULg 57

Local alignment illustration (1 of 2)
• Determine the best local alignment and the maximum alignment score for
• Sequence A: ACCTAAGG
• Sequence B: GGCTCAATCA
• Scoring conditions:• 𝑠 𝑎𝑖 , 𝑏𝑗 = +2 if 𝑎𝑖 = 𝑏𝑗,
• 𝑠 𝑎𝑖 , 𝑏𝑗 = −1 if 𝑎𝑖 ≠ 𝑏𝑗 and
• 𝑠 𝑎𝑖 , − = 𝑠 −, 𝑏𝑗 = −2
13/11/2018 AB-ULg 58

Local alignment illustration (2 of 2)
G G C T C A A T C A
A
C
C
T
A
A
G
G
G G C T C A A T C A
0 0 0 0 0 0 0 0 0 0 0
A 0
C 0
C 0
T 0
A 0
A 0
G 0
G 0
G G C T C A A T C A
0 0 0 0 0 0 0 0 0 0 0
A 0 0 0 0 0 0 2
C 0
C 0
T 0
A 0
A 0
G 0
G 0
G G C T C A A T C A
0 0 0 0 0 0 0 0 0 0 0
A 0 0 0 0 0 0 0
C 0
C 0
T 0
A 0
A 0
G 0
G 0
G G C T C A A T C A
0 0 0 0 0 0 0 0 0 0 0
A 0 0 0 0 0 0 0
C 0
C 0
T 0
A 0
A 0
G 0
G 0
G G C T C A A T C A
0 0 0 0 0 0 0 0 0 0 0
A 0 0 0 0 0 0 2 2 0 0 2
C 0
C 0
T 0
A 0
A 0
G 0
G 0
G G C T C A A T C A
0 0 0 0 0 0 0 0 0 0 0
A 0 0 0 0 0 0 2 2 0 0 2
C 0 0 0 2 0 2 0 1 1 2 0
C 0
T 0
A 0
A 0
G 0
G 0
G G C T C A A T C A
0 0 0 0 0 0 0 0 0 0 0
A 0 0 0 0 0 0 2 2 0 0 2
C 0 0 0 2 0 2 0 1 1 2 0
C 0 0 0 2 1 2 1 0 0 3 1
T 0
A 0
A 0
G 0
G 0
G G C T C A A T C A
0 0 0 0 0 0 0 0 0 0 0
A 0 0 0 0 0 0 2 2 0 0 2
C 0 0 0 2 0 2 0 1 1 2 0
C 0 0 0 2 1 2 1 0 0 2 1
T 0 0 0 0 4 2 1 0 2 0 1
A 0
A 0
G 0
G 0
G G C T C A A T C A
0 0 0 0 0 0 0 0 0 0 0
A 0 0 0 0 0 0 2 2 0 0 2
C 0 0 0 2 0 2 0 1 1 2 0
C 0 0 0 2 1 2 1 0 0 2 1
T 0 0 0 0 4 2 1 0 2 0 1
A 0 0 0 0 2 3 4 3 1 1 2
A 0
G 0
G 0
G G C T C A A T C A
0 0 0 0 0 0 0 0 0 0 0
A 0 0 0 0 0 0 2 2 0 0 2
C 0 0 0 2 0 2 0 1 1 2 0
C 0 0 0 2 1 2 1 0 0 2 1
T 0 0 0 0 4 2 1 0 2 0 1
A 0 0 0 0 2 3 4 3 1 1 2
A 0 0 0 0 0 1 5 6 4 2 3
G 0
G 0
G G C T C A A T C A
0 0 0 0 0 0 0 0 0 0 0
A 0 0 0 0 0 0 2 2 0 0 2
C 0 0 0 2 0 2 0 1 1 2 0
C 0 0 0 2 1 2 1 0 0 2 1
T 0 0 0 0 4 2 1 0 2 0 1
A 0 0 0 0 2 3 4 3 1 1 2
A 0 0 0 0 0 1 5 6 4 2 3
G 0 2 2 0 0 0 3 4 5 3 1
G 0
G G C T C A A T C A
0 0 0 0 0 0 0 0 0 0 0
A 0 0 0 0 0 0 2 2 0 0 2
C 0 0 0 2 0 2 0 1 1 2 0
C 0 0 0 2 1 2 1 0 0 3 1
T 0 0 0 0 4 2 1 0 2 1 2
A 0 0 0 0 2 3 4 3 1 1 3
A 0 0 0 0 0 1 5 6 4 2 3
G 0 2 2 0 0 0 3 4 5 3 1
G 0 2 4 2 0 0 1 2 3 4 2
13/11/2018 AB-ULg 59

Local alignment illustration (3 of 3)
CTCAA
CT-AA
G G C T C A A T C A
0 0 0 0 0 0 0 0 0 0 0
A 0 0 0 0 0 0 2 2 0 0 2
C 0 0 0 2 0 2 0 1 1 2 0
C 0 0 0 2 1 2 1 0 0 3 1
T 0 0 0 0 4 2 1 0 2 1 1
A 0 0 0 0 2 3 4 3 1 1 3
A 0 0 0 0 0 1 5 6 4 2 3
G 0 2 2 0 0 0 3 4 5 3 1
G 0 2 4 2 0 0 1 2 3 4 2
locally
13/11/2018 AB-ULg 60

BLAST: Input Format
Many program for sequence alignment expect sequences to be in FASTA format
Example 1 :>L37107.1 Canis familiaris p53 mRNA, partial cds
GTTCCGTTTGGGGTTCCTGCATTCCGGGACAGCCAAGTCTGTTACTTGGACGTACTCCCCTCTCCTCAAC
AAGTTGTTTTGCCAGCTGGCGAAGACCTGCCCCGTGCAGCTGTGGGTCAGCTCCCCACCCCCACCCAATA
CCTGCGTCCGCGCTATGGCCATCTATAAGAAGTCGGAGTTCGTGACCGAGGTTGTGCGGCGCTGCCCCCA
CCATGAACGCTGCTCTGACAGTAGTGACGGTCTTGCCCCTCCTCAGCATCTCATCCGAGTGGAAGGAAAT
TTGCGGGCCAAGTACCTGGACGACAGAAACACTTTTCGACACAGTGTGGTGGTGCCTTATGAGCCACCCG
AGGTTGGCTCTGACTATACCACCATCCACTACAACTACATGTGTAACAGTTCCTGCATGGGAGGCATGAA
CCGGCGGCCCATCCTCACTATCATCACCCTGGAAGACTCCAGTGGAAACGTGCTGGGACGCAACAGCTTT
GAGGTACGCGTTTGTGCCTGTCCCGGGAGAGACCGCCGGACTGAGGAGGAGAATTTCCACAAGAAGGGGG
AGCCTTGTCCTGAGCCACCCCCCGGGAGTACCAAGCGAGCACTGCCTCCCAGCACCAGCTCCTCTCCCCC
GCAAAAGAAGAAGCCACTAGATGGAGAATATTTCACCCTTCAGATCCGTGGGCGTGAACGCTATGAGATG
TTCAGGAATCTGAATGAAGCCTTGGAGCTGAAGGATGCCCAGAGTGGAAAGGAGCCAGGGGGAAGCAGGG
CTCACTCCAGCCACCTGAAGGCAAAGAAGGGGCAATCTACCTCTCGCCATAAAAAACTGATGTTCAAGAGAG
AA
Example 2 :
>NM_033360.3 Homo sapiens KRAS proto-oncogene, GTPase (KRAS), transcript
variant a, mRNA
TCCTAGGCGGCGGCCGCGGCGGCGGAGGCAGCAGCGGCGGCGGCAGTGGCGGCGGCGAAGGTGGCGGCGG
CTCGGCCAGTACTCCCGGCCCCCGCCATTTCGGACTGGGAGCGAGCGCGGCGCAGGCACTGAAGGCGGCG
GCGGGGCCAGAGGCTCAGCGGCTCCCAGGTGCGGGAGAGAGGCCTGCTGAAAATGACTGAATATAAACTT
GTGGTAGTTGGAGCTGGTGGCGTAGGCAAGAGTGCCTTGACGATACAGCTAATTCAGAATCATTTTGTGG
ACGAATATGATCCAACAATAGAGGATTCCTACAGGAAGCAAGTAGTAATTGATGGAGAAACCTGTCTCTT
GATATTCTCGACACAGCAGGTCAAGAGGAGTACAGTGCAATGAGGGACCAGTACATGAGGACTGGGGAG
GGCTTTCTTTGTGTATTTGCCATAAATAATACTAAATCATTTGAAGATATTCACCATTATAGAGAACAAAAB-ULg 6113/11/2018

Open the website : https://blast.ncbi.nlm.nih.gov/Blast.cgi
NCBI BLAST SERVER
AB-ULg 6213/11/2018

Window of BLASTN
AB-ULg 6313/11/2018

Select following sequence and give input into NCBI BLASTN querysection>Seq1
ACCAAGGCCAGTCCTGAGCAGGCCCAACTCCAGTGCAGCTGCCCACCCTGCCGCCATGTCTCTGACCAAG ACTGAGAGGACCATCATTGTGTCCATGTGGGCCAAGATCTCCACGCAGGCCGACACCATCGGCACCGAGA
CTCTGGAGAGGCTCTTCCTCAGCCACCCGCAGACCAAGACCTACTTCCCGCACTTCGACCTGCACCCGGG GTCCGCGCAGTTGCGCGCGCACGGCTCCAAGGTGGTGGCCGCCGTGGGCGACGCGGTGAAGAGCATCGAC
GACATCGGCGGCGCCCTGTCCAAGCTGAGCGAGCTGCACGCCTACATCCTGCGCGTGGACCCGGTCAACT TCAAGCTCCTGTCCCACTGCCTGCTGGTCACCCTGGCCGCGCGCTTCCCCGCCGACTTCACGGCCGAGGC
CCACGCCGCCTGGGACAAGTTCCTATCGGTCGTATCCTCTGTCCTGACCGAGAAGTACCGCTGAGCGCCG CCTCCGGGACCCCCAGGACAGGCTGCGGCCCCTCCCCCGTCCTGGAGGTTCCCCAGCCCCACTTACCGCG
TAATGCGCCAATAAACCAATGAACGAAGC
You will get list of Hits
Let us work on BLASTN
AB-ULg 6413/11/2018

You will see statistic of alignments ( Identity, E value)
Click here
AB-ULg 6513/11/2018

How well alignment is ? : Bad, Good, Very Good?
AB-ULg 6613/11/2018

Resources
• Online Tutorial on Sequence Alignment• http://a-little-book-of-r-for-bioinformatics.readthedocs.org/en/latest/src/chapter4.html
• Pairwise alignment of DNA and proteins using your rules:• http://www.bioinformatics.org/sms2/pairwise_align_dna.html
• Documentation on libraries• Biostings: http://www.bioconductor.org/packages/2.10/bioc/manuals/Biostrings/man/Biostrings.pdf
• SeqinR: http://seqinr.r-forge.r-project.org/seqinr_2_0-7.pdf
13/11/2018 AB-ULg 67