generic competition and price regulation in the european
TRANSCRIPT

University of South FloridaScholar Commons
Graduate Theses and Dissertations Graduate School
4-4-2014
Generic Competition and Price Regulation in theEuropean Union Pharmaceutical Market: The Caseof Cardiovascular MedicinesBerna ColakUniversity of South Florida, [email protected]
Follow this and additional works at: https://scholarcommons.usf.edu/etd
Part of the Economics Commons, and the Medicine and Health Sciences Commons
This Dissertation is brought to you for free and open access by the Graduate School at Scholar Commons. It has been accepted for inclusion inGraduate Theses and Dissertations by an authorized administrator of Scholar Commons. For more information, please [email protected].
Scholar Commons CitationColak, Berna, "Generic Competition and Price Regulation in the European Union Pharmaceutical Market: The Case of CardiovascularMedicines" (2014). Graduate Theses and Dissertations.https://scholarcommons.usf.edu/etd/5000
Generic Competition and Price Regulation in the European Union Pharmaceutical Market:
The Case of Cardiovascular Medicines
by
Berna Colak
A dissertation submitted in partial fulfillment of the requirements for the degree of
Doctor of Philosophy Department of Economics
College of Arts and Sciences University of South Florida
Co-Major Professor: Bradley P. Kamp, Ph.D. Co-Major Professor: Gabriel Picone, Ph.D.
Andrei Barbos, Ph.D. Aysegul Timur, Ph.D.
Date of Approval: April 4, 2014
Keywords: European pharmaceutical industry, price competition, pricing and reimbursement regulation, hedonic regression, panel data
Copyright © 2014, Berna Colak

Acknowledgments
I am truly thankful to my dissertation committee, Bradley P. Kamp, Ph.D., Gabriel
Picone, Ph.D., Andrei Barbos, Ph.D., and Aysegul Timur, Ph.D., for their valuable comments,
tremendous help, patience and advice. I could not have finished this dissertation without their
support. Especially I would like to thank my dissertation committee chairs, Bradley P. Kamp,
Ph.D., and Gabriel Picone, Ph.D., for their belief in me and leadership that helped me accomplish
this goal.
I gratefully acknowledge support from Aysegul Timur, Ph.D., for providing me the data
used in this dissertation and for her unlimited assistance in understanding the data set. Without
her support, I would not have been able to utilize the data.
I am also thankful to my graduate director, Michael Loewy, Ph.D., for encouraging and
helping me during my Ph.D. study in the Department of Economics starting from the very first
day of this journey to the end.
Lastly, I appreciate the helpful comments, suggestions, and continuing support from my
colleagues, Karen Langbehn, Zheni Stefanova, Robyn Kibler, and Youssef Fassi Fehri, in my
research.

Table of Contents
List of Tables ................................................................................................................................. iii
List of Figures ..................................................................................................................................v
Abstract .......................................................................................................................................... vi
Chapter 1: Introduction ....................................................................................................................1 1.1 The History of the European Union ...............................................................................1 1.2 Regulating Pharmaceuticals in Europe ..........................................................................3 1.3 The Off-Patent Pharmaceutical Market in Europe .........................................................5 1.4 Contributions..................................................................................................................8
Chapter 2: A Background of the Pharmaceutical Industry in the European Union .......................10 2.1 Identifying Characteristics of Pharmaceutical Markets ...............................................10 2.2 Pricing and Reimbursement Regulations in the EU Pharmaceutical Market ..............12 2.2.1 The Regulation of Drug Supply ....................................................................13 2.2.2 The Regulation of Drug Demand ..................................................................15 2.3 Summary of Features of the EU Pharmaceutical Industry...........................................21
Chapter 3: Literature Review .........................................................................................................24
Chapter 4: Research Methodology.................................................................................................32 4.1 Conceptual Framework ................................................................................................32 4.2 Data ..............................................................................................................................32 4.3 Variable Definitions .....................................................................................................34 4.4 Methodology ................................................................................................................36 4.4.1 Quasi-hedonic Price Regressions ..................................................................36 4.4.2 Fully Interacted Model ..................................................................................39
Chapter 5: Empirical Results .........................................................................................................43 5.1 Descriptive Statistics ....................................................................................................43 5.2 Quasi-hedonic Price Regressions .................................................................................45 5.3 Fully Interacted Model .................................................................................................48 5.3.1 Quality Characteristics ..................................................................................48 5.3.2 Competition Characteristics ..........................................................................49 5.3.3 Summary of Findings ....................................................................................55
i

Chapter 6: Conclusions ..................................................................................................................58 6.1 Main Findings ..............................................................................................................58 6.2 Limitations ...................................................................................................................60 6.3 Future Research ...........................................................................................................61
Tables and Figures .........................................................................................................................62 References ......................................................................................................................................75
Appendices .................................................................................................................................... 80 Appendix A: Tables ...........................................................................................................81
About the Author ............................................................................................................... End Page
ii

List of Tables
Table 1 Overall Mean; (Overall), [Within] Standard Deviation Values; N Unit of
Observation: Products, Retail Pharmacy, 1994-2003 ............................................62 Table 2 Overall Mean; (Overall), [Within] Standard Deviation Values; N Unit of
Observation: Molecule, Retail Pharmacy, 1994-2003 ...........................................63 Table 3 Quasi-Hedonic Price Regression Results. Unit of Observation: Products, Retail Pharmacy, 1994-2003 ..................................................................................64 Table 4 Quasi-Hedonic Price Regression Results. Unit of Observation: Molecules, Retail Pharmacy, 1994-2003 ..................................................................................65 Table 5 Product Level Pharmaceutical Prices: Log Price Per Unit Fully Interacted Model – Fixed Effect, 1994-2003 ..........................................................................66 Table 6 Product Level Pharmaceutical Prices: Generic Competition Log Price Per Unit, Fully Interacted Model..................................................................................68 Table 7 National Controls for Pharmaceuticals on the Supply-Side ..................................69 Table 8 Summary of Approaches in the Regulation of Pharmaceutical Prices by Originator and Generic Drugs (2003) ....................................................................70 Table 9 Demand-Side Policies (Prescribing, Dispensing and Consumption) in the Member States .......................................................................................................71 Table 10 ATC Therapeutic Categories for Cardiovascular Disease .....................................72 Table 11 Largest Pharmaceutical Markets in the World, National Currency (million), growth: US$, NC ...................................................................................73 Table A.1 Product Level Pharmaceutical Prices: Strength Log Price Per Unit, Fully Interacted Model ...........................................................................................81 Table A.2 Product Level Pharmaceutical Prices: Molecule Age Log Price Per Unit, Fully Interacted Model ...........................................................................................82
iii

Table A.3 Product Level Pharmaceutical Prices: Form Code Log Price Per Unit, Fully Interacted Model ...........................................................................................83 Table A.4 Product Level Pharmaceutical Prices: Pack Size Log Price Per Unit, Fully Interacted Model ...........................................................................................84 Table A.5 Product Level Pharmaceutical Prices: Therapeutic Substitutes Log Price Per Unit, Fully Interacted Model ...........................................................................85
iv

List of Figures Figure 1 Pharmaceutical Production in the European Union ...............................................74
v

Abstract
The purpose of this dissertation is to examine the extent of competition between generic
products and therapeutic substitutes under different regulatory regimes in the European Union
(EU) pharmaceutical industry. In particular, this study investigates generic competition among
the five largest European pharmaceutical markets; the United Kingdom, Germany, France, Italy
and Spain, with comprehensive IMS data for 10 years (1994-2003), in order to estimate the
effect of generic entry on drug prices at the product level. This analysis finds that generic entry
has a negative effect on prices in countries with free pricing originator market, whereas in EU
countries with strict price and reimbursement regulation, generic competition is ineffective
and/or counterproductive. Fewer generics and less competitive late entrants are consistent with
incentives in regulated environments: low regulated prices for originator products discourage
generic entry following patent expiration. These findings suggest that regulation of both
manufacturers’ prices and retail pharmacy prices undermines price competition in the off-patent
sector, and that budgetary savings from generic price competition are not realized in countries
with strict regulatory systems.
vi

Chapter 1
Introduction
1.1 The History of the European Union
The European Union (EU) refers to 28 member countries, which collectively form a
political and economic community throughout Europe. European countries started forming the
EU in the late 1940s, shortly after the end of World War II. In 1950, Belgium, France, Germany,
Italy, Luxembourg, and the Netherlands (the EU’s “founding members”) drafted an initial treaty
representing the interests and goals of this political and economic partnership. In 1957, the
Treaty of Rome was signed. The treaty allowed for additional countries to join. Now, nearly 57
years since the initial inception of the EU in 1957, the EU has expanded to 28 member countries
(geography.about.com, The European Union: History and Overview).
In 1987, the Single European Act (SEA), a revision to the Treaty of Rome that further
solidified European integration and expanded the community’s power (particularly for R&D, the
environment, and foreign policy) created a “single market” for trade (EUR-Lex, 2014). Two
years later, in 1989 – given the dismantling of the Berlin Wall – the EU’s economic power
became even stronger. For instance, during the 1990s, the single market phenomenon gave EU
member countries the opportunity to trade easily within the Union, which meant that production
was more efficiently allocated and as a result, increased. Perhaps most importantly, though, was
the signing of a new amendment in 1992, the Treaty of Maastricht, which introduced the idea of
European citizenship and launched the Economic and Monetary Union (EMU) (http://europa.eu,
1

Treaty of Maastricht on European Union). The Treaty of Maastricht defined five goals that were
vital for providing support and structure to the European Economic Union:
1) to strengthen the democratic governance of participating nations
2) to improve the efficiency of the nations’ economies
3) to establish economic and financial unification
4) to develop the "Community social dimension"
5) to establish a security policy for involved nations
While the notion of a single currency within Europe was being discussed among
leadership within the European Economic Community even in 1969, the Treaty of Maastricht
made this agenda an even more eminent topic. Thirty years after this initial conversation, on
January 1, 1999 the euro was launched by 11 of the 15 member states of the EU. The
“Eurozone,” which initially consisted of 11 member states (1998) that agreed to adopt the euro as
their common currency, has since grown to 18 countries, with Latvia representing the most
recent addition, having adopted the euro on January 1, 2014 (http://europa.eu, The History of the
European Union). The remaining EU member states (except for Denmark and the UK) are
legally bound to adopt the euro when convergence criteria are met; however, only a few
countries have set firm target dates for accession (Kuchler, 2006). For example, Sweden has
circumvented the requirement to adopt the euro because it does not meet the membership criteria
(i.e., two years’ membership in ERM II, which Sweden has chosen not to join) (Government
Offices of Sweden, EMU and the Euro).
There are many benefits to adopting a single European currency: for instance, the euro
provides efficiency because of a single market that easily facilitates the travel of goods among
EU countries, therefore eliminating exchange rate problems, providing price transparency,
2

creating a single financial market, securing price stability and low interest rates, and providing a
currency used internationally and protected against from potential shocks by the large amount of
internal trade that occurs within the Eurozone (European Commission, 2010). Since its launch,
the single currency euro, which is controlled by the European Central Bank (ECB), has become
the second largest reserve currency in the world (DB Research, 2007).
1.2 Regulating Pharmaceuticals in Europe
Healthcare expenditures in Europe, as in most of the developed world, continue to rise. For
example, both Germany and France spent over 10% of GDP on health care in 2009
(Eurostat/Eurpoean Commission). Governmental regulation plays a major role in this industry.
Governments regulate pharmaceutical markets to protect public health; secure patient access to
safe and effective medicines; improve the quality of care; and control pharmaceutical
expenditures. More specifically, a government’s involvement in the pharmaceutical sector
pertains to analyses of both the supply-side and the demand-side of the market (Mossialos et al.,
2004).
It is important to maintain a productive and transparent relationship between the
pharmaceutical industry and the government because this is often an important determinant of
the government’s approach to managing pharmaceuticals at the national level and, in this case, at
the level of the EU. For instance, even though most aspects of market authorization are uniform
across EU member states, there are still aspects of the regulation of the pharmaceutical industry
that vary significantly among EU countries. These variations are direct responses to the ways in
which health and industrial policy objectives are formulated and operated at national levels
(Mossialos et al., 2004). Pricing and reimbursement policies represent two of the most significant
3

differences among EU countries’ approaches to pharmaceutical regulation. For instance, some
countries negotiate pharmaceutical prices via direct control, while others regulate prices
indirectly (e.g., through profit controls or maximum reimbursement prices). Despite these
differences, in general, most countries prioritize similar objectives, although some countries are
more willing to trade-off slightly higher pharmaceutical prices if they see a valuable return from
pharmaceutical companies in terms of R&D. When all of these factors are considered, it’s
apparent that the relationship between government and industry has a significant impact on the
market structure for pharmaceuticals in the EU.
The European Commission is responsible for regulating the pharmaceutical market in three
areas (Mossialos et al., 2004):
1. national prices, profit, reimbursement, rational use and advertising
2. free movement and competition issues
3. market access through harmonization and eventual centralized authorization procedures
through the European Agency for the Evaluation of Medicinal Products (EMEA).
Currently, there are a variety of approaches used to regulate pharmaceuticals in Europe,
which means that public policy objectives that seek to control costs while improving efficiency,
quality of care, and equity are significantly affected. Comparing international approaches is
useful for explaining how and why these different policies are being implemented and their
effectiveness and efficiency across countries. Additionally, contextual information about the
social, economic, medical, health care, and political environments of these particular countries is
important for a deeper understanding about how these policies are developed and implemented in
practice. A policy adopted in one country, therefore, may not be appropriate for another country
due to the countries’ different health and industrial policy objectives.
4
In an effort to provide guidance for negotiating various health/industrial policy trade-offs, a
framework of general principles for “best practice” has been developed for policy makers’
reference. These best practices consist of the following directives:
• the objective of the policy must be clear from the outset, and consideration must be given
to its possible impact on all of the evaluative dimensions (i.e., efficiency, equity, quality,
and cost)
• price control (alone) cannot improve efficiency; to control total expenditures, demand-
side applications are very important for improving efficiency, equity, and quality
• newly innovated drugs and variations in product mixtures affect drug expenditures;
therefore, one of the biggest challenges to policy makers is to consider how to define
“valuable innovation” so that drug expenditure reflects the value of drugs’ benefits to
society (Mossialos et al., 2004).
1.3 The Off-Patent Pharmaceutical Market in Europe
Many irregularities exist within pharmaceutical markets, some of which are insurance and
third party payers, information asymmetry, and agency relationships. As a result, price
competition is said to be weak because of the impact of all of these market imperfections. This
ultimately means that for the pharmaceutical market in the EU, prices may not respond to the
entry of new products to the market as is normally predicted. Additionally, this atypical pattern
may also lead to low levels of elasticity of demand (Vandoros et al., 2012). Because of the
irregularity that exists within this sector, market regulations are used to offset these market
failures and to provide more efficient resource allocation.
It is important to understand the dynamics of this market because knowing these dynamics
5

can better inform how governmental regulations are imposed; thus contributing to or preventing
the growth of this unique market. When an original drug’s patent expires, generic drugs can enter
the market and compete to capture the market share from the originators. Generic equivalents are
considered to be very effective substitutes for original drugs, and are therefore expected to
capture a significant share from the market originators; however, despite these expectations and
the proven equivalence of generics with original drugs’ potency, some patients still prefer
branded to generic products. This preference can be explained through a variety of reasons: for
instance, some patients may simply believe that branded products are better than generics, or in
other cases, their physicians may suggest that they purchase branded products over generics
(Vandoros et al., 2012). Although this sort of brand loyalty may provide some motivation for the
consumer to continue purchasing the original drug, there is evidence from the EU that this
situation does not substantially limit off-patent competition after a patent’s expiration. In general,
because of financial incentives, physicians, pharmacists and patients most often make decisions
in favor of using generics; thus increasing product selection due to price sensitivity (Kanavos et
al., 2007). The characteristics of the off-patent pharmaceutical market create the potential for
price competition, which can be encouraged by pricing and reimbursement regulations.
The market for generic drugs has received more serious attention in EU countries over the
past few years, primarily due to new policies that promote the use of off-patent drugs. These
subsequently result in the penetration of generic medicines into the market. Germany is the most
highly developed generic market in Europe because; it is also the largest pharmaceutical market
in Western Europe. In contrast, generic markets in the UK, France, Italy, and Spain are not as
developed as Germany. To categorize the generic markets in EU countries as highly or less
developed, it is important to look at differences in:
6

• the extent of generic entry and the penetration of branded generics
• price differences between original brands and generics
• price regulation of on-patent and off-patent drugs
• the extent of product selection based on price (Mrazek et al., 2004)
In the EU, the status of off-patent pharmaceutical markets is determined largely by policy
developments and regulations. In 1998, a Mutual Recognition Procedure (MRP) – which is used
when a company wants to market the same product in more than one EU country – provided
market authorization for generic medicines to compete with the on-patent market
(Ghalamkarpour, 2009). As mentioned briefly above, national health care systems are extremely
influential in affecting the penetration of generic medicines in pharmaceutical markets. Of the
EU countries that have a greater penetration of generics in their pharmaceutical markets, most all
have adopted policies supporting their use (e.g., generic substitution, reference pricing, financial
incentives targeting physicians, pharmacists or patients); however, in other EU countries,
widespread concerns about the safety and quality of generics have negatively influenced their
use, resulting in a substantially less robust penetration of generics into these markets (Mrazek et
al., 2004).
Markets in EU countries are different from other countries’ markets primarily because of
how pricing regulations are structured within the off-patent pharmaceutical sector. Of these
various regulations, the reference pricing system is one of the most important and common
strategies for managing generic drug prices. This type of pricing system classifies drugs into
groups that are considered to be close substitutes for the originals, and sets a single reference
price for each group as the maximum reimbursement allowed for all drugs in that group
(Vandoros et al., 2012). The reference pricing system has been successful in encouraging product
7

prices to converge to a specific level; there are very few instances in which decreases below the
reference price occur (Mrazek et al., 2004).
Determining the most appropriate regulatory interventions for each country depends on the
objectives of the country’s policy makers, national health care systems, the involvement of
health care professionals, and the availability of supply. These are very important implications
that ought to be discussed further by policy makers, the industry, health professionals and the
public, as generics continue to play an even more significant role in pharmaceutical policies in
the EU (Vogler, 2012).
1.4 Contributions
Patents and the lack of good substitutes for new drugs provide substantial monopoly
power, which encourage national governments in the EU to develop price control policies
(Danzon and Chao, 2000a). When patents expire, generic substitutes introduce price competition
into the market. Ultimately, the extent to which generics capture the market share from branded
original drugs depends upon a particular government’s regulatory policies.
This dissertation is unique and necessary because it examines the extent of competition
between generic products and therapeutic substitutes under different regulatory regimes within
the pharmaceutical industry in the EU. In particular, the study described within this paper
investigates the effect of generic competition on drug prices at the product level among the five
largest European countries – the UK, Germany, France, Italy and Spain – given an analysis of
comprehensive Intercontinental Medical Statistics (IMS) data over the span of 10 years (1994-
2003). This analysis finds that generic competition has a significant negative effect on price for
Germany, whereas for the countries with strict price regulation (the United Kingdom, France,
8

Italy, and Spain), the number of generic competitors has either no effect or a positive effect on
prices. As Danzon and Chao (2000a) points out, this is consistent with evidence that in countries
with strict regulation, generic competitors are predominantly either licensed co- marketers or
new versions of old molecules that manufacturers introduce in order to obtain a price increase.
On the other hand, in countries with relatively free pricing regime, successive generics enter at
lower prices, and prices at the product levels are negatively related to the number of generics.
This dissertation is structured as follows: Section two provides a background of the EU
pharmaceutical market; section three is a literature review describing the nature of off-patent
market competition; section four outlines the research strategy implemented in this study; section
five presents empirical results; and finally, section six provides concluding remarks and
suggestions for future research related to this topic.
9

Chapter 2
A Background of the Pharmaceutical Industry in the European Union
The purpose of this chapter is to carefully examine the pharmaceutical industry in the
EU, and specifically, to focus on explaining how this market’s characteristics differ from other
markets (e.g., the United States). The ultimate goal is to identify the implications of pricing and
reimbursement regulations.
2.1 Identifying Characteristics of Pharmaceutical Markets
The pharmaceutical industry is responsible for manufacturing, processing, researching, and
producing medicinal drug products that provide treatments and remedies for a variety of medical
conditions. Oftentimes, a close relationship exists between the product market and the
“therapeutic class,” which is a system for classifying medical drugs by their functions. The
European Commission’s Competition Directorate has adopted the practice of defining the
relevant product market according to the therapeutic classes identified in the Anatomical
Therapeutic Classification (ATC) system, which is recognized and used by the World Health
Organization (WHO) (OECD, 2002).
The pharmaceutical market is a high-technology, knowledge-intensive industry. In terms of
market structure, this market consists of two main groups: the large firms (i.e., patent holders)
that expend the biggest portion of Research and Development (R&D) investments, and the
10

smaller-sized firms, which operate in the off-patent market (OECD, 2002). Among other factors,
this market is heavily influenced by regulatory policies, which have been developed with the
intention of providing three vital benefits:
1) improving innovation with intensive research and development
2) auditing the quality of drugs for public health
3) managing the costs of pharmaceutical expenditures
Growth in the industry, from patents issued for newly developed pharmaceuticals, is a vital
component in the achievement of these goals. In this industry, companies’ investments in R&D
ventures are often extremely costly and risky; therefore, R&D expenses are most often financed
with funds obtained through intellectual property rights, especially patents. In 1998, the EU
adopted what is called a “mutual recognition procedure,” which is an agreement that EU member
states will recognize the national marketing authorizations of one another. This policy granted
marketing authorization for all of the EU countries and allowed for the free movement of
medicinal products throughout the EU (OECD, 2002).
The pharmaceutical market is distinguished from other markets primarily because both its
demand and supply side have characteristics not found in typical “well-behaved” markets. On the
demand side, there are physicians acting as agents for consumers. Physicians are considered
“imperfect agents” for consumers, since they are not responsible for the financial obligation of
purchasing drugs. Another important characteristic of the demand side is the fact that consumers
often are reimbursed some if not all of the purchase price. These reimbursement policies differ
across countries as well as across drugs in the same country. Reimbursement policies increase
demand while at the same time, cause demand to be less elastic. This is important in the EU, as
member countries typically provide generous insurance coverage.
11

Maintaining competition within the pharmaceutical industry depends on the number of
producers and the nature of demand for products on the market. The pharmaceutical industry is
understood to be a market with a high degree of effective competition because it includes such a
large number of rival producers, and because these rivals then compete among one another by
responding to the price-sensitive demand for drugs. In outlying cases where competition is not
primarily focused on price, it is typically shifted to R&D or to marketing.
2.2 Pricing and Reimbursement Regulations in the EU Pharmaceutical Market
The pharmaceutical industry is heavily regulated. Every moment of the life of a
pharmaceutical product, from its initial conception to earning marketing approval,
commercialization, patent expiration and generic competition, is subject to extremely strict
regulation. Regulatory controls on production and government insurance on the consumption
side result in both supply and demand being affected by government policies. Thorough analysis
requires investigating both supply and demand. For instance, on the supply side, there is a high
cost – and thus risk – associated with R&D activities. For this reason, Intellectual Property
Rights, which protect newly innovated drugs from competition with a substantial reward, are
designed to encourage R&D by providing drug companies with the opportunity to recoup the
substantial investments that have been made in R&D for the development of new medications.
Alternatively, on the demand side, health insurance systems affect the quality and the quantity of
drug consumption. This ultimately means that the interaction of the supply side with the demand
side allows for an understanding of the specific type of unique competition that exists within
particular markets (OECD, 2001).
12

2.2.1 The Regulation of Drug Supply
Patents have significant power in motivating continued investments in research and
innovation in the pharmaceutical industry because without the protection provided by patents,
pharmaceutical companies would be unlikely to risk investing in the R&D of new drugs (OECD,
2001). The value of patent protection depends on the length of the period of exclusivity. For
instance, currently in the EU, the effective life of a patent is less than 20 years. However, due to
increasing concerns about the consequences of a potential decrease in the effective life term, a
“supplementary protection certificate,” which extends patent life up to five additional years, was
adopted in 1993 in all European countries (OECD, 2001).
A patent is a reward for companies investing in R&D. Patent protection not only confers
exclusive rights to the production, sale, and use of newly developed drugs, but due to the entry
barrier it creates, prices can also be set and remain well above marginal cost. The total economic
value of a patent depends on the individual drug’s market characteristics, such as pricing and
reimbursement policies, availability of therapeutic substitutes and ability to price discriminate
(OECD, 2001). Although patents are generally accepted as necessary for encouraging continued
investments in developing new products, they also may be responsible for creating market
distortions, such as the higher price of a pharmaceutical as compared with the cost of alternative
products, forcing patients to incur higher costs for treatment.
Lastly, patents make innovations public information, which means that they provide access
to new knowledge for other entrepreneurs’ use in the development of new technologies, and
eventually, for competitors. Although a patent is often the primary motivating factor in the
development of pharmaceutical products, a patent’s expiration marks the beginning of a new
cycle of competition: the entry of generics into the market.
13

When a patent expires, the patent-holder loses monopoly power in the production and
distribution of the patented molecule. Drugs that have an equivalent composition as the
originally patented drugs, named generics, may then enter the market.
However, despite the resulting increase in competition because of the introduction of
generics into the market, regulatory controls have substantial impacts on the effects of this
competition on prices. Additional factors such as brand loyalty and consumers’ price
insensitivity may limit the extent of generic competition. Numerous case studies provide
evidence that original drug prices often increase following the entry of a generic drug (at a lower
price) (OECD, 2001). In response to this scenario, national health care systems in Europe have
developed pricing regulations for post-patent drug markets. Countries within the EU use
formalized pricing regulations to control generic prices, which support generic uptake following
the patent’s expiration. The most commonly used regulatory policies are reference pricing and
price caps (Vandoros, 2013). Reference pricing is the most popular regulatory policy used in off-
patent markets within EU countries. Under reference pricing, prices among similar products (or
prices for the same product in other EU countries) are compared and grouped together
accordingly, in order to determine a maximum reimbursement price. European countries that use
reference pricing in off-patent markets include Germany, France, Italy and Spain. Another
policy, used in the UK, is price capping. Under price capping, generic prices are set at a
maximum percentage of branded prices (Vandoros, 2013).
Another technique used to promote the use of generic medicines is to provide incentives to
pharmacists. Given that pharmacists are responsible for dispensing prescriptions to their clients,
it is assumed that they can also play an important role in promoting consumers’ use of generic
medicines. However, because generics are promoted through generic substitution, when generic
14
substitution is allowed, physicians and patients can usually reserve the right to refuse substitution
(Mrazek et al., 2004). Therefore, policymakers sometimes offer financial incentives that
motivate pharmacists to dispense less expensive generic drugs to their patients; this incentive
occurs across the EU countries. Additionally, pharmacists’ decisions to select the lowest-cost
generic equivalents are also encouraged through the use of higher margins on generic products
(Mrazek et al., 2004).
In the generic pharmaceutical market, market interventions are necessary for correcting
demand-side imperfections. If these interventions do not occur, the market may not achieve a
high-volume use of generics, despite a lower price as compared with the price of the original
product. However, determining whether or not a given country should apply any of these specific
approaches depends almost entirely on the contexts of its policy makers’ objectives, health care
systems, and health care professionals.
2.2.2 The Regulation of Drug Demand
Health insurance is another important factor affecting the demand for pharmaceuticals.
For example, if all consumers in the market were fully insured, the consumers would not
substitute across drugs of different perceived quality based on price differences. In this case,
drug companies would be willing to increase their investments in perceived quality of these
drugs as they could obtain a higher profit margin. The branded drugs would have an advantage
and generics would find it hard to capture market share. However, consumers do not write the
prescriptions. So even with insurance, originators still have a high incentive for influencing
physicians’ prescribing behavior.
15
This hypothetical full insurance is not available in most countries. The entire price of the
drug is not always reimbursed. There are various reimbursement policies operating within EU
countries. The most commonly employed reimbursement policies in the EU are copayments and
positive listing. Certain pharmaceuticals are partly or completely excluded from health insurance
coverage. A “copayment” refers to the out of pocket cost to the consumers. Patient co-payments
are levied according to four mechanisms: a fixed fee (per item, per prescription, or according to
pack size); a percentage of the value of the prescribed drug; a deductible up to a certain limit;
and a combination of the above, usually a fixed fee or a deductible plus a percentage of the value
of the drug. The total cost of treating the disease affects the demand for pharmaceuticals, in
general, while a change in the marginal cost of a drug provides an incentive to substitute lower-
priced forms of the same molecule.
Another commonly used reimbursement policy is a “positive list,” which is the explicit
listing of pharmaceutical products by the health care funder, indicating whether or not a specific
product may be adopted for reimbursement (OECD, 2001). The main objective of this
reimbursement regulation is to provide detailed information about the availability of effective
and less expensive pharmaceutical products.
Physicians play an influential role in consumers’ decision-making processes about
pharmaceuticals because they usually face incentives from regulatory policies to promote
particular drugs. Furthermore, on an even higher level, drug companies and health insurers have
great incentives to influence physicians’ prescribing decisions through direct “command and
control,’’ or through the use of financial incentives which seek to align the incentives of the
physician with the insurer (OECD, 2001). Of these two approaches, the “command and control”
approach is by far the most common. Widely employed forms of controls on physicians include
16

guidelines on prescribing practices and some type of limits on the quantity of drugs that can be
prescribed per day or per episode. For example, physicians may be required to substitute among
drugs within a particular therapeutic class, to try low-cost therapies first, or to seek advance
approval before prescribing certain drugs. One drawback of the command and control
intervention is that doctors may not necessarily choose the best alternatives for their patients, in
terms of costs and benefits analyses (OECD, 2001). In order to respond to this issue, some
regulatory controls provide financial incentives to physicians in order to maintain a high level of
cost-effectiveness in their prescribing behavior. As OECD (2001) defines, “GP fundholder”
programme in the U.K. is one of the leading examples of such financial incentives. Under this
scheme, the health provider receives a fixed payment per year, and is able to exercise discretion
over how these funds are used in the purchase of health outcomes. In this scheme competition
between suppliers is an essential element. In the absence of competition, the health care supplier
would have a strong incentive to restrict access to health services and would have little incentive
to maintain a high level of care. In the GP fundholder scheme, the local doctor (the General
Practitioner) receives a fixed sum each year according to the number of people in his/her care.
The GP fundholder is responsible for allocating these funds in such a way as to purchase the
maximum amount of health care possible and is able to retain any savings resulting from more
efficient use of pharmaceuticals. Under this programme, GPs have quite strong incentives to
choose the best mix of pharmaceutical inputs. By 1994 about one-third of all UK GPs were
involved in a fundholder scheme (OECD, 2001).
In the generics market, there are no barriers to entry or economies of scale prohibiting the
production of the same drugs by different competitors, making it a highly competitive market.
17

But government health services do have monopsony power. By employing price control
mechanisms, competition can be introduced into drug production (OECD, 2001).
In the 1990s, one of the priorities of the EU health care system was controlling
pharmaceutical expenditures. Numerous market factors affect pharmaceutical expenditures such
as newly innovated and more expensive drugs, adjustments in the product mix, and changes in
how diseases are treated. In order to more effectively control pharmaceutical expenditures, EU
countries have employed regulatory policies designed to generate lower costs while improving
efficiency.
As noted above, the pharmaceutical market has notable imperfections in the supply and
demand sides of the market, which cause market failures (such as a high level of drug
expenditures). In order to reduce pharmaceutical expenditures, EU governments employ price
controls on the supply side of the market. Price regulations vary among EU countries, reflecting
distinct pricing strategies that result from national goals. One of the most important system of
pricing regulations is direct price controls. Examples of direct price controls include negotiated
prices, maximum fixed price, international price comparisons, and price cuts or freezes (Mrazek
et al. 2004). An indirect price regulation is a different method of regulation achieved through
profit controls and reimbursement limits (OECD, 2001).
An important part of this dissertation examines pharmaceutical price regulations within
the EU and their impacts on the market structure, particularly the competitive effects of generic
entry on the pharmaceutical market. Existing literature in this field provides empirical results,
which compare drug prices between countries having different supply and demand-side policies.
Due to differences in methodology, it is difficult to generalize conclusions from these studies.
Studies that have examined the relationship between the price level and regulatory regimes have
18

provided contradictory results. For instance, the U.S. General Accounting Office (1994) showed
that pricing policies in France, Germany, and the UK were causing drug price increases that were
lower than the overall inflation rate during the 1980s and 1990s (Mrazek et. al, 2004). Garattini
et al. (1994), Jonsson (1994), and Rovira et al. (2001) provided evidence that countries with
strict pricing and reimbursement regulations (e.g., the United Kingdom, France, Italy, and Spain)
have lower prices than countries with less strict regulatory structures (e.g., Germany). On the
other hand, Reekie (1998) and Danzon and Chao (2000a) examined both on-patent and off-patent
pharmaceutical markets and provided evidence that less-regulated markets (such as Germany)
have lower prices as compared to strictly regulated markets. The differences in these empirical
results can be explained by heterogeneity in the methodologies used, the products considered, the
study periods chosen, and the methods of estimation. Three common regulatory methods are
detailed below.
In direct price controls, fixed maximum pharmaceutical prices are set. The level of
maximum price depends on certain contextual factors (such as prescribing behavior, budget
limits, and the volume of the country’s pharmaceutical industry) and therefore varies across
different EU countries. All EU countries (except for Germany and the UK) use direct price
controls for on-patent drugs. In Germany, newly patented drugs can be freely priced at launch,
and in the UK, prices for newly patented drugs are regulated through profit controls. Since 2003,
this type of free pricing regime has also been used in France, but only for innovative drugs.
An indirect method of regulation, employed in the UK, is profit controls. Under the UK’s
policy, drug companies are allowed to make a profit of up to 21 percent return on capital
invested. If a company exceeds a 21 percent rate of return, it can retain up to 40 percent over the
originally permitted return if it has not received a price increase for any product in the same year.
19

If profit exceeds the margin of tolerance, the company must cut its prices and repay the excess
profit to the Department of Health (Mrazek et. al, 2004).
The other commonly employed regulation is reference pricing. Reference pricing sets
fixed reimbursement limits for products assigned to the same group. Patients are responsible for
paying any excess of the price of the prescribed drug over the reference price. Imposing this
additional cost to patients is expected to be effective in increasing consumers’ awareness of the
prescribed drug’s price and in encouraging them to choose a drug listed at the reference price
(Mrazek et al., 2004).
Various studies show that reference pricing has proven effective in reducing price
differences among drugs defined as “therapeutic substitutes.” EU countries use reference pricing
for products defined in the same category, with similar therapeutic values. When no generic
equivalents exist, these classifications often become controversial. In Germany, France, Italy,
and Spain, a reference pricing regulation is applied only to off-patent drugs (Vandoros et al.,
2012).
A wide literature shows how a downward price convergence occurs as a result of the
implementation of a reference pricing policy. For example, Pavcnik (2002) shows evidence of
price decreases in the German pharmaceutical market following patients’ choices to switch to
drugs at the reference price. As a result, German pharmaceutical companies eventually
responded by reducing their prices. In other cases, Donatini et al. (2001) and Nink et al. (2001)
show that reference pricing causes some savings in pharmaceuticals, but only for the short-term
(Italy and Germany). For instance, Nink et al. (2001) explain their finding that some German
doctors prescribe products that were not included in the reference pricing system and they do not
spend time to discuss co-payments with their patients.
20

Both direct and indirect price controls are effective in slowing price increases and/or
lowering drug prices; however, the impact of these price controls on drug expenditures depends
on growth within the mix of products on the market (which includes more expensive drugs). On
the demand side of the market, consumers’ cost awareness about alternative treatments is an
important factor in promoting competition primarily because this awareness generates
competition for lower prices. Additionally, financial incentives for health care providers,
pharmacists and patients also play an important role in patients’ cost awareness of generic drugs.
2.3 Summary of Features of the EU Pharmaceutical Industry
Pharmaceutical pricing and reimbursement systems are often very complex, as they are
customized to respond to the specific economic and health care needs of a country. Furthermore,
in the EU, health care systems continuously adjust as Member States review their health care
systems (searching for strategies to increase the efficiency of pharmaceutical services) or strive
to keep their pharmaceutical budget within specific limits. These efforts often cause a reaction
from other players in the market, such as pharmaceutical manufacturers, wholesalers, doctors,
pharmacists or patients. Some examples of these reactions include changes in pricing and
reimbursement regulations within the market or in patients’ consumption patterns.
Collectively, these developments provide comprehensive and up-to-date information,
which is useful for monitoring price competition in both on-patent and off-patent pharmaceutical
markets. Therefore, it is important to understand comprehensive and detailed information about
pharmaceutical systems within the individual EU Member States because doing so elicits
information about similar cost drivers and policy measures, which can make maintaining the
21

existing monitoring and enforcement of in-patent and off-patent market competition rules more
efficient.
The purpose of this dissertation is to examine the extent of generic competition in
European countries, given an understanding of these countries’ different pharmaceutical price
regulations and health care structures. This study is focused on generic price competition within
the pharmaceutical industries of the five largest European markets: the United Kingdom,
Germany, France, Italy and Spain. Both within and across these countries, different interventions
are being applied to in-patent and off-patent markets (See Table 8). For example, in Germany,
markets for on-patent drugs are largely unregulated and prices are set relatively freely; however,
once generics enter the market, the German government uses reference pricing to set
reimbursement rates. In the UK, originator medicine prices are free from direct regulatory
intervention, but are subject to a rate of return regulation. Additionally, once generics enter the
market, the UK’s government uses price caps. France, Italy, and Spain, on the other hand, use
direct price controls for originator drugs and reference pricing system for generic drugs.
It is especially important to gather available information and to acquire more specific
knowledge about how the pharmaceutical systems in the Member States of the EU function
(European Commission, 2006) because doing so allows for:
1. achieving increased transparency within this industry and exposing the particularities of
competition rules
2. identifying the relevant players in the pharmaceutical market of each Member State
3. investigating regulatory measures as well as demand side and supply-side strategies
adopted with regard to cost-containing effects in the pharmaceutical market
4. providing information for EU policy-makers pertaining to mechanisms on pricing,
22

reimbursement and dispensing of pharmaceuticals
5. providing an in-depth, comprehensive description of the in-patent and off-patent
competition in EU Member States.
23

Chapter 3
Literature Review
The purpose of this chapter is to provide a comprehensive overview of the existing
literature on generic price competition in the EU pharmaceutical market. This information is
critical for justifying where this study’s topic originates. It is important to note that although this
information is extremely pertinent to this topic, it is not necessarily useful for drawing
generalized conclusions primarily because of the studies’ methodological differences, the range
of products considered, the extent to which generics were included or not included in the study’s
sample, the length of time in which data was collected for analysis, and the method used to
calculate price indices (Danzon, 1998; Kanavos and Mossialos, 1999). Drawing universal
conclusions from this data is additionally complicated when considering the identification of
causal effects because of the many secondary factors that influence drug prices (Kanavos et al.,
2007), for instance:
• differences in health system structure and financing
• pharmaceutical subsidies
• cost-containment policies
• product mix
• production costs
24

Price competition has been an important topic in various empirical studies of the
pharmaceutical industry. However, studies that focus on price competition offer conflicting
results about how regulation impacts drug prices. For instance, Jonsson (1994) and Kanavos et
al. (2013) suggest that countries with strict price regulations have lower prices than countries
with less strict price regulations. On the other hand, the studies of Grabowski & Vernon (1996),
Rizzo & Zeckhauser (2005) and Caves et al. (1991) cite empirical evidence showing that prices
do not decrease after generics enter the market; they argue that generic entry only leads to a
slower rate at which drug prices (ultimately) increase. Danzon and Chao (2000a) cite empirical
evidence identifying how, in less-regulated markets, competition has kept prices low. Therefore,
as stated above, it is not possible to draw accurate, universal conclusions from these studies due
to differences among the methodological choices of the researchers, as well as the range of
products considered, the extent to which generics were included or not, and other such factors
(Kanavos and Mossialos, 1999; Kanavos and Srivastava, 2008).
A similar situation exists after patent expiry, when competition from generics initiates
price fluctuation in the market (Magazzini et al., 2004). Anis et al. (2003) conclude that in cases
where less regulation is imposed, substantially more competition exists. Their study ultimately
concludes that pricing regulations failed to achieve the goal of lowering prices and in fact, in this
case, pricing regulations resulted in the opposite occurrence. Hudson’s study (2000), which also
examines the relationship between patent expiry and the diffusion of generics, finds that both
generic entry and the lag time between patent expiry and generic entry can be traced to the size
of the market at the time of the patent’s expiration. These findings also provide evidence
supporting the argument that the rate at which the original brand loses revenue is proportional to
both the size of the market and the price of the original brand prior to generic entry. In the US,
25

the impact of generic entry on original brand sales is found to be much bigger, as compared with
statistics from the UK, Japan and Germany. This finding is most likely a reflection of the larger
size of the U.S. pharmaceutical market and the consequence of its regulatory environment.
Hudson (2000) also argues that more successfully marketed drugs initially attract generic
competition but tend to lose sales after patent expiry. Conversely, less successful drugs aren’t as
adversely affected by generic competition. Thus, a patent’s value to a particular company ought
to be computed by taking into account not only the period of patent protection, but also the
period after the patent’s expiration. Since patent expiry does not always induce the entry of
generics to the market, and because there is sometimes a lag time of several years between patent
expiry and generic entry, firms’ revenues will not disappear immediately, but will gradually
decrease over a period of time. Thus, it can be reasonably argued that a patent’s value extends
beyond the actual moment of its expiration.
The results of these studies suggest that generic competition has less of an effect on prices
in tightly regulated markets for three specific reasons. First, pricing and reimbursement
regulations keep the prices of branded drugs lower, and this reduces the motivation for generics
to enter the market. Second, strict regulatory system reduces opportunities for generic
competition because major market players – patients and physicians - have less incentive for
substituting generic drugs for original branded products; thus, demand elasticity is lower in this
context. Third, producers sometimes exploit pricing regulations via co-marketing generics with
generic suppliers or developing new products with only minor changes from the originals, and
then negotiating higher prices (Pammolli et al., 2002).
Conversely, in less-regulated regimes, innovators of effective drugs can profit from higher
prices, which subsequently attract the entry of generics. In response to this competition, the
26

original brand producer sometimes tries to differentiate its product (e.g., advertising or applying
market segmentation strategies). Within these less-regulated regimes, the pre-entry prices of
pioneer brands can be maintained (or, in some cases, extended) upon patent expiry because of
strong brand loyalty toward original brands (Caves, Whinston & Hurwitz, 1991; Grabowski &
Vernon, 1992). Alternatively, off-patent pioneer products sometimes become Over-The-Counter
drugs (OTCs) and are paid for out-of-pocket by the consumer. Almost immediately upon the
entry of off-patent pioneer products into the OTC market, competition among generics becomes
substantial and soon after, prices fall; reducing market shares of the branded drug. In countries
where the pharmaceutical market is managed by less-regulated regimes, markets generate a sharp
distinction between innovators and imitators (Pammolli et al. 2002).
In contrast, Garattini (1994) and Rovira (2001) have found that countries with strict price
regulation policies have lower overall prices than countries with less strict regulations. On the
other hand, Reekie (1998) claims that competition yields low prices in markets with less strict
regulation (e.g, Germany). And, empirical study from Canadian pharmaceutical markets shows
that the effect of generic competition to keep prices low was very moderate or nonexistent (Jones
et al., 2001).
Despite consumers’ benefits from lower market prices as a result of stricter price regulation
policies, one of the consequences of this type of price regulation is what is referred to as a
“ratchet effect” (Bergman & Rudholm, 2003). This effect occurs when prices signal low
marginal costs.
Price competition sometimes leads generic products to exit, or partially withdrawal from
the product market. In this case, it would be expected that new generic competitors would
attempt to capture market share while the originator primarily keeps capturing the small market
27

share of the brand loyal market (Kanavos et al., 2007). However, generic firms have incentives
to maximize their market shares in response to use the existing regulatory measures (such as
reference pricing) to their advantage in order to maximize market shares and rents (Aronson et
al., 2001; Kanavos et al., 2007).
Brekke et al. (2007) have studied the impact of regulatory regimes on generic price
competition and pharmaceutical pricing using a unique policy experiment in Norway, where
Reference Pricing (RP) replaced price cap regulation in 2003 for a sample of generic products. In
this case, they found that RP leads to lower relative prices because of strong brand-name price
reductions. They also found that RP increases generic competition, resulting in lower brand-
name market shares.
In a similar study, Dalen et al. (2006) examined the impact of index price regulation on
both demand and market power. Their results suggest that the index price helped to increase
market shares of generic drugs. Puig’s (2010) study examined the impact of European
pharmaceutical price regulation on generic price competition and found that RP systems cause a
reduction in the consumer price of all pharmaceuticals subject to this system, to a varying degree
in different countries and different periods of time. Beyond the price reduction forced by pricing
regulation alone, the entry of new generic competitors is useful for lowering the real transaction
price of purchases made by pharmacies (dynamic price competition at the ex-factory level).
Podnar et al.’s (2007) research addresses how a sector of the Slovenian pharmaceutical
market was influenced by reference pricing. On the basis of their descriptive analysis, they argue
that the RP system caused an increase in the share of generic drugs. Similarly, Adriaen et al.
(2008) examined the pricing strategies of generic medicines following patent expiry in Belgium
and concluded that pricing strategies are influenced by regulatory aspects, such as:
28

• successive reductions in reference prices and prescription status of medicines
• market incentives in the form of price competition between generic medicines and
competition between originator and generic medicines by medication class
• market power held by the manufacturer of the originator medicine
Therefore, they argue that there is no single pricing strategy that authorities can use to predict
the pricing behavior of generic medicines following patent expiry or to foresee the development
of the generic medicines market. Furthermore, Kanavos et al., (2007) finds that cost savings to
health insurance is not realized because of the ineffective generic policies and because generic
drug prices are high and depend on originator drug prices. They also find that reference pricing
attracts generic entry and reduces generic prices marginally.
In terms of the pharmaceutical market in the EU, Perry (2006) suggests that while it is
necessary to ensure that pricing systems encourage price competition and more affordable
quality healthcare for patients, it is equally important that pricing systems are managed with the
objective of guaranteeing the long-term sustainability of the EU-based generic medicine industry
so that it can compete effectively in EU and global markets. Consequently, it is governments’
responsibility to address the generics challenge head on. Some suggest that they ought to
accomplish this by implementing pro-generics policy measures, particularly in the area of pricing
and reimbursement, while better informing doctors, pharmacists and patients about the benefits
of generic medicines.
Augurzky et al. (2009) provide information on ex-factory generic prices, reference prices,
manufacturers, type of prescription drug, and market entries and exits. Their results show that
there is no full price adjustment: a 1%-change in reference prices leads to a 0.3%-change in
market prices. Furthermore, the introduction of a RP reduces the market prices of the affected
29

products by approximately 7%. Kanavos et al., (2007) has argued that reimbursed generic prices
may be too high, and as a result, a significant proportion of the reimbursed price accrues to the
distribution chain in a fashion that resembles an indirect subsidy. This ultimately means that it is
possible for a single purchaser (such as the NHS) to purchase generic drugs more cheaply than it
expects to and, consequently, realize further cost savings (which could be allocated elsewhere in
the service).
The theoretical discussion presented above concludes that there may be limitations in
generic penetration, which may, in turn, hinder the benefits of generic competition. In fact, there
may be barriers to entry in generic markets resulting from (Kanavos et al., 2007):
• regulatory or discounting practices
• strategic pricing by first entrants, implying that there may be first mover advantages in
the market for generics (Hollis, 2002)
• interaction between stakeholders, such as providers, physicians and pharmacists and their
incentive structures
Empirical studies in literature does not provide a clear explanation for the nature of generic
competition, the impact of regulation and the extent to which countries differ in their price
sensitivity to drugs. Overall, pharmaceutical markets respond to significant imperfections both
from the demand side and supply side, which leads to significant differences among markets.
One way to pursue further research on this topic is to examine the influence of generic
competition among different markets (Kanavos et al., 2007). Therefore, in response to the need
for additional scholarship in this area, this dissertation focuses on how drug prices change over
time as a consequence of generic competition, taking into consideration different regulatory
regimes across the countries examined.
30

The results of this analysis suggest that the relationships between the dynamics of drug
prices and generic competition are, at the very least, complex and differentiated across countries.
This study explores ways of analyzing these differences by utilizing a different empirical
strategy: a fully interacted model and an extremely comprehensive data set that traces the market
for cardiovascular medicines in the five biggest European countries. More specifically, this
dissertation examines the effects of generic competition on individual product prices at the retail
level and finds that generic competition has a negative effect on price for relatively less strictly
regulated markets, whereas for countries with strict price regulation policies, the number of
generic competitors has either no effect or a positive effect on prices. These results are consistent
with evidence that in countries with strict regulatory policies, generic competitors are
predominantly either licensed co-marketers or new versions of old molecules that manufacturers
introduce in order to obtain a price increase (Danzon and Chao, 2000a). In contrast, in countries
with free pricing, successive generics enter the market at lower prices, and therefore, prices at the
product level are inversely related to the number of generics available. These findings suggest
that regulations undermine generic competition and that the cost savings from post-patent
competition are not realized in countries with strict pricing and reimbursement policies.
31
Chapter 4
Research Methodology
This chapter explains the conceptual framework, data and methods employed in this
study. The first section describes the research questions of this analysis. The second section
summarizes the data used. Finally, the third section explains the methodologies, variables and the
empirical models estimated.
4.1 Conceptual Framework
Drug pricing, including generics, is a major responsibility of the national health services
of nearly every country. Policies toward drug pricing differ across various nations. As such,
competition amongst generics and on patent drugs also differs. This study aims to examine the
extent of competition between generic products and therapeutic substitutes under different
regulatory regimes. In particular, this analysis focuses on the effect of generic entry on prices in
the five largest European pharmaceutical markets. Cardiovascular drugs are the focus of the
study. Ten years of comprehensive IMS data at both the molecule and individual product level
are employed.
4.2 Data
This study analyzes retail prices of drugs used to treat cardiovascular disease (CVD), the
32

third-leading cause of death in OECD countries. Importantly, the effectiveness of CVD drug
therapies is short-term, so patients must continually receive treatment to maintain its health
benefits. As detailed in Table 10, similar to Dickson and Jacobzone (2003) and Timur (2006), the
study sample consists of drugs from eight CVD therapeutic categories, which cover both newer
and older innovations that form the core of pharmacotherapy for CVD.
Data used in this study were obtained from IMS Health, an international pharmaceutical
consulting company that collects sales and price data from various countries. Data are collected
at the level within the pharmaceutical market supply and distribution chain that provides reliable
information. The IMS Health measure for all dosage forms and strengths is the IMS standard unit
(SU). The SU is a single dose e.g., one tablet or capsule, five liquid milliliters (i.e. one teaspoon),
or one ampoule or vial of an injected product (IMS 2005). Prices are measured at the ex-
manufacturer level and converted from local currencies to euros by IMS Health using constant
exchange rates. A country’s SU price for a molecule is its volume-weighted average price per
dose over all presentations, including generic, licensed, OTC, and parallel imported products
(Danzon and Furukawa 2003; Timur, 2006). Products are categorized by the Anatomic
Therapeutic Category (ATC) system, which is developed and maintained by European
Pharmaceutical Marketing Research Association, EphMrA (EPHMRA 2004). Products are
categorized in the sales, medical and promotional audits according to the EphMrA/PBIRG
Anatomical Classification System, the main principle of which is that there is only one
Anatomical Classification code allocated to a product/pack. This allows each product to be
classified consistently in all countries (EphMrA, 2004; Timur, 2006).
The IMS data used here are on all drug sales through retail pharmacies for 10 years
between 1994 and 2003. The study restricts the sample to single-molecule ‘‘global’’ products,
33

that is, products that contain a single active ingredient (molecule) and are available in all five
countries. A given molecule may have multiple products (defined by molecule, manufacturer,
and IMS product name)—for example, originator brand, licensees, parallel imports, and
generics—and each product may have multiple packs, defined by strength, presentation forms,
and pack sizes. Although the sample of molecules is uniform across countries, the number of
products per molecule, manufacturers, and packs differ across countries. The main unit of
analysis here is the product, aggregated over packs for each product.
The sample includes the five largest pharmaceutical markets in the European Union:
Germany, the United Kingdom (UK), Italy, Spain, and France. These countries are also the
leading pharmaceutical markets in the world after the US and Japan. The study sample contains
259 molecules with a total of 3347 products. The study further restricts the sample to molecules
that are available in all five countries as described above. Germany is specified as the baseline
country because it contains the most products, is the largest market in the EU, and it is the
relatively least regulated market in the EU.
4.3 Variable Definitions
Price. For each pack, IMS reports the price per standard unit. This study defines the
average price per standard unit for each product as the volume-weighted average over all forms
and packs of the product. For the regression analysis the paper uses the log transformation of
price and of all explanatory variables where proportional effects are expected.
Quality. This study controls for several ‘‘quality’’ characteristics that impact the product’s
efficacy and its price. Molecule Age, measured as (log) months from the last observation month
to the launch date of the first product in the molecule in that specific country. Molecule Age is an
34

inverse indicator of therapeutic effectiveness, assuming that more recent compounds are
generally more effective. Molecule Age is the same for all products in a molecule but is country
specific. Strength is the mean grams of active ingredient per standard unit, averaged over all
packs within the product. One can expect a positive relationship between strength and price.
Form Code is the number of different product formulations for each molecule and product, and
is intended to reflect choice and convenience available to patients. Forms include different types
of tablets, capsules, ampoules, powders, drops, syrups, syringes, and liquids, along with different
strengths and pack sizes. The coefficient is expected to be positive, assuming that manufacturers
launch new forms only where the expected increase in price is sufficient to cover the fixed costs
of developing a new form.
Competition. Measures of competition distinguish between generic and therapeutic
substitutes. Generic Competitors is the number of generically equivalent products in the
molecule, including originator, licensed, and parallel imported products, as well as post patent
generic imitators. The expected effect of generic imitators on price is negative in markets where
manufacturer prices are unregulated. Therapeutic Substitute Molecules is the number of
molecules within the same three-digit therapeutic category ATC3. These drugs are competitors
that are chemically distinct but used to treat the same indication, thus reflecting increased
availability of substitutes and should thereby be negatively related with price. Generic Entry Lag
is the (log) number of years between the product’s own launch date and the launch date of the
first product in the molecule (plus one). This ranges from one for the originator product to large
positive values for late entrants. The expected sign is negative, under the hypothesis that the
originator product has a first-mover advantage relative to later generic producers of the same
molecule, which offer little or no therapeutic advantage. Therapeutic Substitute Molecule Entry
35
Lag is (log) years from the launch of this molecule to the launch of the first molecule in the
therapeutic category. The sign could be negative or positive, depending on whether first-mover
advantage of the pioneer molecule in a class dominates or is dominated by superior efficacy of
later molecules. Pack Size is the number of SUs averaged over all packs in a molecule. This
market variable is converted to standard units according to IMS (2005) guidelines. Price is
expected to be inversely related to pack size in countries with competitive retail pharmacy,
where manufacturers, particularly generics, compete by offering volume discounts to
pharmacists on large packs.
4.4 Methodology
This study investigates the effect of generic entry on pharmaceutical prices by employing
two different research strategies. The first section explains the nature of the quasi-hedonic
regressions model and the second section describes the fully interacted model in detail.
4.4.1 Quasi-hedonic Price Regressions
This analysis first uses hedonic price regressions to address cross-country differences in
product specifications. Products serving the same purpose might have different attributes in
different countries. In the sample of this study, the forms, strength levels, and pack sizes are the
quality and market characteristics of drugs that vary across countries.
This study examines the price models through quasi-hedonic regressions for three reasons
(Danzon and Chao, 2000a; Timur et al. 2010). First, while the standard hedonic model assumes
that price determinants differ randomly across products, pharmaceutical prices are expected to
differ systematically across countries, reflecting differences in health care regimes. Because
36

some price variation across countries is explained by factors other than observed product
characteristics and that change very little over time, the models include country-specific
intercepts. Second, hedonic price regressions estimate the marginal contribution of each
characteristic to the value of a product. However, pharmaceutical market imperfections drive a
wedge between price and marginal value. These include deviations between patient and
physician preferences, moral hazard from insurance coverage, and monopsony power of national
health systems on the demand side, along with patent restrictions providing monopoly power to
producers and marketing restrictions through drug approval and testing requirements on the
supply side. Third, drug prices also vary across countries because of time-varying differences in
regulatory and reimbursement environments. To address this, our model specifies market
competition measures, which would not appear in a pure hedonic regression, as additional
explanatory variables. This study uses the same model for all countries, but tests for cross-
national differences in parameters.
As defined in Danzon and Chao (2000a) and Timur et al. (2010), this model uses log
transformations of product prices and characteristics,
All the product quality and competition (market) characteristics appear on the right hand
side of Equation 1. Accordingly k, j, and t represent an individual product, country and year
respectively. P measures the average price per standard unit for each product that is the volume-
weighted average over all forms and packs of the product. Xc indicates a vector of quality and
competition characteristics of products. βc captures the different impact of the imperfectly
competitive market for pharmaceuticals in different countries and thus measures the country-
specific differences between the baseline country Germany and other countries. The model also
37

includes d variables that are indicators for country j, year t and product k. λj,t is the parameter that
estimates the average price difference in time t between the baseline country Germany and
country j, which is omitted from the country indicator vector, across products. This price gap is
net of variation induced by differences across quality and competition characteristics, products,
time and countries (Timur et al. 2010). And, finally u is the regression error in the quasi-hedonic
regressions model.
This analysis estimates quasi-hedonic price regressions model by employing panel data
methods, where the product-specific intercepts are treated as fixed effects. The fixed effects
model refers to the possibility that each unit of observation, market, quality, and time period,
would have unique parameters. Following this, in this model, there are market, quality, and time
specific “fixed” effects. This analysis combines data from pooling methodology. It is important
to note that drug prices also reflect intrinsic value that is not observable. If these are time-
invariant and product-specific, then the fixed effects model is efficient (Wooldridge, 2001). On
the other hand, this study also estimates a random effects model (by holding ATC3 indicators
constant for market and regulatory factors) for time-invariant characteristics because they are not
identified in the fixed effects model. The two time-invariant competition variables, generic entry
lag and therapeutic substitute molecule entry lag, are included as an explanatory factor in the
random effects model.
In the panel data model, δk is called a ‘’random effect’’ when it is treated as a random
variable, and a ’’fixed effect’’ when it is treated as a parameter to be estimated for each cross
section observation (Wooldridge, 2001). The term fixed effect means that one is allowing for
arbitrary correlation between the unobserved effect δk and the observed explanatory variables
Xk,j,t. Accordingly, δk is called an “individual fixed effect.” In the quasi-hedonic price regressions
38
model, the zero conditional mean assumption - where the mean of the error terms given a
specific value of the independent variable is zero E(uk,j,t | Xk,j,t, δk) = 0 is the necessary condition
for consistent fixed effects and random effects estimations. Additionally, the observed
explanatory variables and the unobserved effect have to yield zero correlation between them,
because the random effects model implicitly places δk in the error term, therefore the assumption
of Cov(Xk,j,t, δk) = 0 is very crucial for consistent estimations (Wooldridge, 2001). In this
analysis, the whole point of using panel data is to allow for δk to be arbitrarily correlated with
Xk,j,t. A fixed effects analysis achieves this purpose explicitly, and yields arbitrary correlation
between the observed explanatory variables and the unobserved effect, Xk,j,t and δk respectively.
Therefore, the fixed effects model gives more robust estimation than the random effects model
does (Wooldridge, 2001). The advantage of the random effects model is consistent estimations of
time-invariant variables (generic entry lag and therapeutic substitute molecule entry lag), which
cannot be estimated in the fixed effects model, because it is not possible to distinguish the effects
of time-invariant observables and unobservables (Wooldridge 2001). Finally, this study uses the
Hausman (1978) test to compare the results between the random effects and fixed effects
analyses, and concludes in favor of fixed effects model.
Tables 3 and 4 report the product level and molecule level results of fixed and random
effects estimation of Equation 1 respectively. All variables are specified in log form, thus each
coefficient is interpreted as the elasticity of price with respect to the quality or market
characteristic. The regressors have the expected signs in the analysis.
4.4.2 Fully Interacted Model
The fully interacted model expands the quasi-hedonic price regressions model (Equation
39

1) to estimate the effect of quality and competition (market) characteristics on price across
different countries between 1994 and 2003. Mean values of the quality and competition (market)
characteristics, parameter values and fixed country effects represent heterogeneity across
different countries and over time, therefore this model measures price differences between the
baseline country Germany and all other countries by considering all these discrepancies for
consistent estimations.
In the fully interacted model, quality and competition (market) characteristics have
different effects across different countries and over time. The regression includes controls for
product characteristics that vary over time within a drug. Thus, the model controls for drug
quality and market characteristics that varies across drugs. The new model in Equation 2
includes interactions between product characteristics and country fixed effects; product
characteristics and year fixed effects; and finally interactions between product characteristics,
country fixed effects and year fixed effects. This model includes product fixed effects to control
for unobserved drug heterogeneity, and year fixed effects to control for price inflation and for all
other unmeasured time effects. Rather than estimate separate regressions for each country, the
study pools the data for all five countries and estimates a fully interacted model as follows:
The new model has the same definitions of variables and parameters as in Equation 1, and
additionally uses new coefficients ρ, γ, and θ for the new interactions between the product
characteristics and the country and year indicators. As in Equation 1, βc measures the country-
40

specific differential between parameter effects for Germany and other countries j. Net implicit
prices for product characteristics are β for Germany in 1994, (β + γt) for Germany in year t =1995
- 2003, (β + ρj) for other countries j in 1994, and (β + γt + ρj + θj,t) for other countries j in year t =
1995 – 2003 (Danzon and Chao, 2000a; Timur et al., 2010).
As explained previously, Germany is used as the baseline country because it is the least
regulated market for both manufacturer prices and pharmacy margins and it has the most
products in the sample. This fully interacted model yields the same coefficient estimates with
separate, country-specific regressions.
This study uses panel data analysis in order to estimate the model. As Gujarati (2003)
says, “panel data methods are used because they can give ‘more informative data, more
variability, less collinearity among variables, more degrees of freedom and more efficiency.” In
the case of panel data analysis, fixed effects estimators are considered to be quite efficient. The
econometric model used in this analysis accounts for the endogeneity of market entry by
employing a fixed effects model, which controls for all observed and unobserved time varying
and time-constant variables, and the econometric model also takes advantage of the panel data to
eliminate both observed and unobserved heterogeneity and to remedy the problems with error
terms. Thus fixed effects model explicitly accounts for endogeneity that resulting from time
variant and time-invariant omitted variables. In order to see if it is safe to use fixed effects, the
analysis also performs the Hausman test indicating that, since fixed effects model is consistent
when observed explanatory variables and unobserved effects are correlated, but random effects
model is inconsistent, a statistically significant difference is interpreted as evidence in favor of
the fixed effects model.
Table 5 reports fully interacted regressions for product-level prices for 1994 and 2003,
41

which allows all parameters to differ across countries. Table 6 reports results with the fully
interacted model for generic competition variable, in five countries for all years between 1995
and 2003.
42

Chapter 5
Empirical Results
This chapter reports research results of this analysis. The first section describes summary
statistics of the analysis at the product level and molecule level. The second section summarizes
the empirical results for quasi-hedonic price regressions. And, finally the third section reports the
fully interaction model estimations at the product level.
5.1 Descriptive Statistics
Table 1 reports summary statistics for the product-level variables and Table 2 lists
summary statistics for the molecule-level variables, by country. Since the unit of observation in
Table 1 is the product, some molecules have more observations than others. This analysis
categorizes the variables in the tables as quality characteristics and competition (market)
characteristics.
The mean Price per product shows some variations across countries. As reported in Table
1, the SU price (Local Euro) ranges from €0.21 in France, €0.23 in Spain, €0.31 in Italy, to €0.52
in Germany, and €0.62 in the United Kingdom.
Quality characteristics are summarized in the first section of Table 1. The mean Strength
per product does not differ significantly across countries. Strength ranges from 0.05 in Germany
and the United Kingdom to 0.12 in France, with an overall mean of 0.07. More effective
43

molecules are assumed to have a higher level of strength, implying a positive relationship
between strength and price.
The overall mean for Molecule Age is 22 years, ranging from 16 years in Spain to 24
years in Germany and the United Kingdom. The high sample mean age for all countries reflects
the influence of a few very old molecules (Danzon and Chao, 2000a). As Timur (2010) says
“molecule age is expected to be inversely related with price, since newer treatments are typically
introduced precisely because they are more effective, and thus have higher value, than older
treatments.”
Form Code includes different types of tablets, capsules, ampoules, powders, drops,
syrups, syringes, and liquids, along with different strengths and pack sizes suggesting a positive
relationship with price. The overall mean is 2.50, ranging from 1 in France, Italy and Spain to 3
in Germany and the United Kingdom.
Competition (market) characteristics are summarized in the second section of Table 1.
The average SU Pack Size ranges from 27 in Italy to 90 in Germany, with an overall mean of 64.
Mean Pack Size is significantly lower in France, Italy, and Spain, which require more unit pack
dispensing than Germany and the United Kingdom. Economies of scale at the manufacturer level
will imply a negative relationship between price and pack size.
Generic Competitors are manufacturers of products containing the molecule, including
originators, licensees, parallel imports and generics. The overall mean is 12, ranging from 4 in
France, 5 in Spain, 6 in Italy, and 6 in the United Kingdom to 18 in Germany. Germany has the
highest number of generic competitors in the sample consistent with the high mean age of the
sample, which also reflects laxer regulations in Germany. This implies that global molecules are
the most valuable ones and attract the most products per molecule.
44

Consistent with this, the mean of Therapeutic Substitute Molecules (molecules in the
ATC categories) is higher in Germany than in France, Italy, Spain and the United Kingdom.
Therapeutic Substitute Molecules also reflect increased availability of substitutes that range from
13 in the United Kingdom to 19 in Germany, with an overall mean of 17.
Generic Entry Lag at the product level is longer for Germany (11 years) compared with 9
years or less for the other countries. Relatively high Generic Entry Lag values for Germany
suggest a relatively large number of recent generic entrants. A longer average entry lag implies
that generics continue to enter later in the life of the molecule in Germany than in the regulated
countries. Danzon and Chao (2000a) points out that in the regulated countries, generic entry
(when it occurs) is disproportionally by licensees. As licensees would typically enter early in a
molecule life, this is consistent with the shorter average entry lag in the four more heavily
regulated countries.
Finally, Therapeutic Substitute Molecule Entry Lag ranges from 13 in the United
Kingdom to 19 in Germany, Italy, and Spain with the highest number of years from the launch of
the molecule to the launch of the first molecule in the therapeutic category.
5.2 Quasi-hedonic Price Regressions
Tables 3 and 4 contain the product level and molecule level results of fixed and random
effects estimations of Equation 1 respectively. Quasi-hedonic price regressions define all
variables in the log form; therefore each coefficient in the model is interpreted as the elasticity of
price with respect to the quality and competition (market) characteristics. The model yields the
expected coefficients with consistent fixed and random effects results.
45

Consistent with the expectations, the average SU price rises significantly with product
strength. Since most of the countries in the sample use reference pricing system, this product-
specific feature structures a positive relationship between strength and therapeutic effectiveness.
The estimations show that a 10% increase in product strength raises price by 1–1.5%, under both
the fixed effects model and random effects model.
Fixed effects model yields little information for molecule age variable; the plausible
reason is that fixed effects model considers only within-molecule age variation that changes
separately from the fixed year and molecule effects only via the non-linearity of the log
transformation (Danzon and Chao 2000a; Timur et al. 2010). On the other hand, the random
effects model yields consistent estimates for the relationship between price and molecule age
since it considers cross-molecule variation. The significantly negative coefficient in Table 3
implies that relative therapeutic value declines with age as more effective products are
introduced in the market. Accordingly, a 10% increase in age reduces price by about 6% in the
random effects model.
As shown in Table 3, form code, reflecting choice and convenience available to patients,
suggests a positive relationship with price in the fixed effects model. This means that with fixed
prices, introduction of a new formulation might provide an opportunity for manufacturers to
renegotiate prices upward (Timur, 2010). In other words, manufacturers have an incentive to
introduce new forms where expected prices are sufficient to cover the fixed costs of introducing
a new form. Random effects model yields a negative relationship with price since it does not
allow arbitrary correlation between the observed explanatory variables and the unobserved
effect. The fixed effect model is therefore more robust than the random effect model
(Wooldridge, 2001).
46
In the competition characteristics, price decreases substantially with pack size, which
indicates economies of scale in packaging, EMEA packaging and labeling regulations, and use in
reference pricing calculations (Timur et al. 2010). Both fixed effects and random effects models
show that the price of a 10% larger pack size will be lower by about 2.5-3.5%.
Generic competition is negatively related with price in both fixed effects and random
effects models. Generic competition reduces price, as expected, by less than 1% for each 10%
increase. Pricing and reimbursement regulations in generic drug market may underestimate the
effect of generic competition on price in strictly regulated European Union countries. For
instance, the German government allows generic suppliers to formulate and test products and
complete product review in another country during the life of patent. It is not unheard of for
generics to enter in the German market the day following patent expiration. France, on the other
hand, does not allow submission for review of entry documents until the patent expires, delaying
launch dates by up to 5 years (Timur, 2010).
The number of therapeutic substitute molecules is significantly positively related to price
in both models. As shown in Table 3, the coefficients imply that a 10% increase in the number of
therapeutic substitute molecules raises price by 4–5%. Both fixed effects and random effects
models yield similar estimations.
The generic entry lag, in years, is a time-invariant market characteristic identified only in
the random effects model and it is negatively related with price, as expected, by about 2% for
each 10% increase. The therapeutic substitute entry lag, in years, is also a time-invariant market
characteristic identified only in the random effects model. Its coefficient is positive, indicating
that a 10% increase raises price by 3%.
47

5.3 Fully Interacted Model
To ease exposition, a detailed discussion of the fully interacted model will only cover 2
years, the first (1994) and last (2003). In the appendix, this study presents results for the other 8
years. Complete annual results for the major variable of interest – generic competition – will be
presented and discussed in this section.
5.3.1 Quality Characteristics
Table 5 reports fully interacted regressions for product-level prices for 1994 and 2003,
which allows all parameters to differ across countries. Table 6 reports empirical results with the
fully interacted model for generic competition variable for all years between 1995 and 2003.
Price increases in Strength per SU in all countries and over both years, due to the fact that
therapeutic value increases with strength, and strength is a direct measure of relative prices. The
elasticity of unit price with respect to strength ranges from 0.03 in France to 0.16 in the United
Kingdom.
Molecule Age is significantly negatively related to product price in all five countries.
Competitive generic prices in Germany are expected to estimate the marginal cost of production,
which is related to the therapeutic value of the molecule (Danzon and Chao, 2000a).
Additionally, renegotiation of fixed prices as molecules age is the source of large effects in the
more strictly regulated countries (Mossialos et al. 2004; Seget 2003; Timur et al. 2010);
consistent with the hypothesis that molecule age is an inverse indicator of relative quality. In the
United Kingdom, France, Italy, and Spain the Molecule Age interactions are significantly
negative due to regulatory restrictions on post launch price increases and due to weaker generic
competition. The Molecule Age elasticity is (-0.96) in Germany, (-0.48) in the United Kingdom,
48

(-0.56) in France, (-0.21) in Italy, and (-0.54) in Spain. As Danzon and Chao (2000a) says, “the
full price-age effect at the product level is the combined effect of its Molecule Age and its
Generic Entry Lag relative to the first product in that molecule.” Since the Generic Entry Lag
coefficient is negative for Germany and positive for other more regulated countries, the full
price-age effect at the product level indicates that the price decline with age is more attributable
to competition in relatively less regulated market Germany and more to regulation in the United
Kingdom, France, Italy, and Spain.
Form Codes are positively related with price in all countries. The number of formulations
increases price in Germany and Spain throughout the period, which indicates that introducing
line extensions is an effective tool for a price increase in countries that do not allow price
increases for established products (Danzon and Chao, 2000a). In France, Italy and the United
Kingdom, the price elasticity with respect to the number of forms also indicates a positive
relationship for many years since manufacturers have an incentive to introduce new forms where
expected prices are sufficient to cover the fixed costs of introducing a new form. The price
elasticity with respect to the number of forms in France, Italy and the United Kingdom indicates
a negative relationship only for few years, which implies weaker incentives to introduce new
forms to get a higher price during those periods of time.
5.3.2 Competition Characteristics
Price significantly decreases with Pack Size in all countries and years, implied by
economies of scale in packaging, EMEA packaging and labeling regulations, and use in
reference pricing calculations. Consistent with this negative estimation, patient co-payment is
based on pack size in Germany and maximum price is based on maximum pack size in the
49

United Kingdom (Timur, 2010). The elasticity of unit price with respect to pack size for
Germany is (-0.25), for the United Kingdom is (-0.47), for France is (-0.51), for Italy is (-0.33),
and for Spain is (-0.68).
Table 5 and Table 6 report empirical results for the elasticity of unit price with respect to
Generic Competition at the product level between 1994 and 2003. Germany is the only country
that demonstrates a decrease in prices as a result of generic competition. An increase in generic
competition by 10% leads to a decrease in drug prices by about 1%-2%. German pharmaceutical
markets are relatively least regulated where originator market prices are set freely. Therefore,
originator drug prices are higher in Germany. Following patent expiration, generic drugs enter
the market at a lower price and introduce price competition to originators due to high price gap
between originators and generics. In this case, generic firms are able to steal market share from
originators via price competition. Originators often decrease their prices to match with generic
drug prices. As time passes, market share of originators also decrease and market share of
generic drugs increase. Overall, average price per standard unit decreases in Germany. By
contrast, in the United Kingdom, the coefficient of the variable representing generic entry is
positive and statistically significant. This means that an increase in generic entry by 10% leads to
an increase in prices by between 1.1% and 2.2% over 10 years. This study finds evidence that the
generics paradox is present in the United Kingdom, as originator prices increase post-generic
entry. In the United Kingdom, originator prices are subject to rate of return regulation i.e. profit
controls, which were introduced in 1993. Additionally, price caps were introduced in the United
Kingdom at the end of 1990s, and price caps were found not being effective price regulation in
lowering drug prices. There is some evidence in the literature that price caps have a positive
effect on prices. Frank and Salkever (1997) found that the price of generic products decreases as
50

a result of price caps regulation. However, while more patients use generics, many still use the
originator. The group taking the originator has inelastic demand, providing the producer the
incentive to raise price and therefore revenue. Thus, the average price of the drug may be higher
with a price cap. In Spain, Italy, and France, where direct price regulations are present, generic
entry has a positive effect on prices. A 10% increase in generic entry in these countries leads to
an increase in prices by 1.0% or less over all years. In these countries, originator markets are
heavily regulated; therefore originator drug prices are low. Following patent expiration, when
generics enter the market, they cannot introduce price competition to originators due to low
originator prices and they are not able to capture market share from originators by competing via
price. In this case, generic competition is typically non-price competition. They cannot compete
via price but compete with different form codes and pack size, thus they compete via product
differentiation, often with higher price per standard unit. Overall, the prices are not affected
negatively by increasing generic competition; consistent with the theory that generic entry does
not necessarily lead to a reduction in prices in the regulated markets and may only slow down the
increase in these prices. This theory is consistent with the results showing that strict pricing and
reimbursement regulations lead to an increase in prices in the United Kingdom and France and
also slow down the increase in prices in Italy and Spain throughout the study period. In the
regulated markets, fixed prices protect generic entrants from price competition from other
generic entrants, thus there is no incentive to lower prices as the number of generic entrants
increases.
Evidence of the generic paradox should signal to policy makers that under their
regulatory structure, generic entry will not lead to price-reducing competition. Thus, as Vandoros
et al. (2012) says, “for generic policies to be successful, a switch to generic alternatives must
51

take place as early as possible post-patent expiry.” In sum, this analysis shows that generic
competition effectively reduces prices only in Germany, where originator prices are high and
free from regulations. The opposite effect is found in the United Kingdom, Spain, Italy and
France. In these regulated markets, as mentioned earlier, there is no incentive to lower prices as
the number of generic entrants increases.
Looking at the effect of the generic entry on the post generic entry price per standard
unit, there are two facts observed in the study. In Germany, where the prices of the originator
drugs are high to begin with and where the generic entry leads to a decrease in the price per
standard unit, as the time goes by (from 1995 to 2003), the magnitude of this negative effect
monotonically increases (from -0.0261 to -0.1775). On the other hand, in the other four more
regulated countries, where the prices of the originators are lower before the generic entry and in
general the prices per standard unit increase following generic entry, the magnitude of this
positive effect decreases over time (from 0.1104 to 0.0006, for instance in the case of Italy).
One possible explanation for the monotonic increase in the negative effect of generic
entry in Germany is that over time the generics become more acceptable substitutes for the
originator drugs. This would both lead to lower prices for originator drugs post generic entry and
lower market shares for these originator drugs. If that is the case in less regulated market
Germany, as time passes, the competition brought about by generic drugs become more intense
and thus the price of the originators decrease more significantly in response to the entry of the
generic drug, lowering the overall price per standard unit (a weighted average of the originator
drug prices and generic drug prices) which is observed in data. In addition, the market share of
the generics would have also increased over time, which would have further lowered the average
price.
52

There are several possible explanations for why generic drugs become more acceptable
substitutes of the originators over time. First, the consumers become more informed of the
existence of these generics. Second, the consumers’ perception of generics becomes more
favorable over time because they become more aware of the fact that generics are indeed good
substitutes for the originator drugs. Third, the doctors are more likely to prescribe generics either
by their own will (because of either of the reasons mentioned earlier) or because of government
regulations (or health insurers) that required them to prescribe generics. Fourth, if the prices of
the originators increase sufficiently over time (the prices of new patented drugs do increase
significantly), either consumers or doctors or insurers or the regulators are more likely to
consider alternatives (to look for them, to purchase them, to prescribe them, to require them to be
prescribed, to pass laws that required them to be prescribed, etc.).
On the other hand, in more regulated countries, where the prices of the originators are
lower before the generic entry, in general the prices per standard unit increase following generic
entry, but the magnitude of this effect decreases over time. One possible explanation is that
following patent expiration generics enter the market in different form codes and pack sizes with
a higher price per standard unit. As more generics enter the market, they capture market share
with product differentiation and increase the price per standard unit. As time passes generics
continue to enter with higher price per standard unit but they start to capture smaller market
share because they face more stringent spatial competition; more generic entry leaves smaller
product space for firms that compete via product differentiation. Therefore, in these regulated
countries the prices per standard unit still increase following generic entry, but the magnitude of
this positive effect decreases over time.
53
The above conjecture regarding a possible explanation for the change over time in the
effect of the generic entry on the average drug price is only few of the possible explanations,
which at this time this study cannot test because of lack of specific data on the evolution over
time of the price and market shares of the originator drugs.
As further evidence of generic price competition in Germany, generics enter and compete
via price. If market prices are high enough, generic entry will occur in markets with older drugs.
Generic entry lag still lowers the prices. For the United Kingdom, France, Italy, and Spain the
later entrants receive positive price premiums with the positive elasticity of price with respect to
Generic Entry Lag, which is consistent with expected regulatory effects in these countries. For
these regulated countries, the positive entry lag premium also reflects the relatively small number
of generic entrants (mean numbers of generic competitors in these countries are much less than
Germany; 6 or less versus 18).
In Table 5, price is positively related to the number of Therapeutic Substitute Molecules
with an elasticity of (0.49) for Germany indicating that the number of Therapeutic Substitute
Molecules does not have a competitive pressure on price. On the other hand, the price elasticity
with respect to Therapeutic Substitute Molecules is significantly negative for the United
Kingdom (-0.36), France (-0.31), Italy (-0.44), and Spain (-0.11). In these countries, therapeutic
reference pricing regulations are present to encourage across-molecule competition by
therapeutic substitute molecules. In these regulated countries, there is evidence of competition
between therapeutic substitutes in the form of lower prices for successive entrants. Competition,
under therapeutic reference pricing, decreases drug prices (Brekke et al. 2007). These countries
do not have as much generic competition, although generics are much closer substitutes.
54

Since the number of Therapeutic Substitute Molecules does not appear to exert
competitive pressure on price, the price elasticity with respect to Therapeutic Substitute
Molecule Entry Lag is positive for Germany (0.30). Consistent with the negative price elasticity
with respect to Therapeutic Substitute Molecules, Therapeutic Substitute Molecule Entry Lag is
negative for France (-0.23) and Spain (-0.01) indicating that successive entrants receive lower
prices.
5.3.3 Summary of Findings
This analysis focuses on how drug prices change over time as a consequence of generic
competition. The results suggest that the relationships between the dynamics of drug prices and
generic competition are complex and differentiated across EU countries.
The most important factor that increases prices in regulated countries relative to Germany
is non-price competition. The relatively small number of generic entrants and fewer generics are
consistent with the results found in the regulated pharmaceutical markets: generic entry is not
attractive once patent expires due to low regulated prices for originator products. Danzon and
Chao (2000a) says that “the incentives for price-competitive generic strategies are less owing to
price-insensitive purchasers, and the incentives for price- increasing generic strategies are
greater.” The estimates of generic competition in Germany show that reference pricing policy
and free originator pricing together increase generic entry and price competition. In the United
Kingdom, the total generic effect is found to be weaker compared to Germany, due to the lower
number of generics per molecule and most importantly due to profit control and price caps
regulations.
55

There is evidence of competition between therapeutic substitutes in the form of lower
prices for successive entrants. This study shows that the number of Therapeutic Substitute
Molecules has a negative effect on price in the more regulated markets, but this is mostly
attributable to regulation rather than competition, since prices of established products are quite
effective in regulation of new product prices. Generic price competition does not exist in these
regulated countries; even though generics are much closer substitutes. Danzon and Chao (2000a)
says, “these pricing and reimbursement regulations cause indistinguishable price incentives for
investment in innovative and imitative R&D.” The results of this work are consistent with
Danzon and Chao’s findings that the more regulated countries have produced a large number of
minor new products but few truly innovative molecules that have achieved global diffusion.
Germany has a free-pricing originator market. It thus has generic price competition and
more generic competitors compared to the other more regulated regimes. The elasticity of
product price with respect to Generic Competitors is negative and significant. One would expect
more entry and price competition in Germany and the results confirm this. These results agree
with other studies that examined other lightly regulated markets (Grabowski and Vernon, 1992
and Ellison et al, 1997). On the other hand, generic entry and product price are positively related
in the more regulated markets of this study. These positive elasticities in the United Kingdom,
France, Italy, and Spain are consistent with evidence that multi-source suppliers in these
countries are usually licensed co-marketers rather than competing generic manufacturers or
minor new products that enter to obtain a higher regulated price.
Finally and most importantly, this analysis does not find any evidence that prices
decrease as a result of generic entry in the heavily regulated European pharmaceutical markets.
The findings are very clear and also show the presence of the generics paradox. Across the four
56

countries the elasticity estimates for generic competition are positive, but differ in magnitude,
with a much larger coefficient in the U.K. than in France, Italy, and Spain.
The number of generic entrants depends on drug prices in the market; when prices are
high, firms enter due to higher expected profits (Danzon and Chao, 2000a). This could lead to a
reverse causation problem and bias the estimates. Other studies have posited that such a bias
would understate the price-lowering effects of generic entry. Thus the true effects in Germany
would be more negative, while the positive effects in the other countries are overstated. Danzon
and Chao (2000a) makes the claim that this bias would be larger in the less regulated countries.
This endogeneity problem in this analysis is limited by two things: First, firms can not obtain a
production permit immediately, it takes time due to regulatory delay for the approval of drug in
the industry, therefore the number of generic competitors is predetermined when price is set.
Second, this study controls for country and product fixed effects as well as interaction between
the country and the time effects. Thus, the analysis allows for a great amount of heterogeneity
that can be correlated with generic entry.
There are few important points that need to be emphasized at this point. First, this study
does not look at comparisons of price levels across countries, but focuses on price changes
within countries. Second, this study does not analyze the determinants of generic entry (see
NERA, 1998). This would be an important and interesting issue for future research. This paper
focuses on a preliminary analysis of generic competition and prices, considering the role of
several fundamental features of the European pharmaceutical market.
57

Chapter 6
Conclusions
This chapter summarizes the main findings regarding generic competition in the
European Union pharmaceutical market. Additionally, limitations and future research are
outlined at the end.
6.1 Main Findings
This study focuses on the microeconomic decisions of pharmaceutical firms, including
competition between branded and generic products. The firms’ strategies reflect the actual and
anticipated decisions of rivals and of governments.
The empirical analysis used comprehensive IMS data for five countries over 10 years
(1994-2003) to estimate the effect of generic competition on drug prices at the level of the
individual product. Generic competition has a significant negative effect on price for Germany,
whereas for the countries with strict price regulation (the United Kingdom, France, Italy, and
Spain), the number of generic competitors has either no effect or a positive effect on prices.
Danzon and Chao (2000a) says, “this is consistent with evidence that in countries with strict
regulation, generic competitors are predominantly either licensed co- marketers or ‘‘new’’
versions of old molecules that manufacturers introduce in order to obtain a price increase.” On
the other hand, in countries with relatively free pricing regime, successive generics enter at lower
58

prices, and prices at the product levels are negatively related to the number of generics.
There is also evidence for therapeutic competition in the form of lower prices for
successive entrants in regulated markets. The number of Therapeutic Substitute Molecules does
appear to reduce prices in the United Kingdom, France, Italy and Spain, where the effect is more
consistent with their regulatory systems than with competition.
As a conclusion, this study examines whether generic price competition exists in
regulated European pharmaceutical market. The analysis finds empirical evidence that the price
lowering benefits from generic competition do not occur in the presence of certain regulations.
When including all five countries in panel data models, this study finds evidence that generic
price competition is not present in the United Kingdom, France, Italy, and Spain as prices
increase with generic entry post-patent expiry. The only country in which generic entry leads to
lower prices is Germany.
In unregulated markets, generic price competition provides cost savings to health
insurers. However, this situation does not hold in regulated pharmaceutical markets since
regulations restrict price competition. The findings in this work agree with Danzon and Chao
(2000a) and suggest that regulations undermine price competition and sacrifice potential cost
savings due to generic entry.
Not all differences are due to market regulations. Pammolli et al. (2002) note that the
health care services, provisions, and medical traditions vary widely across countries. Surely, this
will also affect the effects of generic entry on prices.
Finally, generic price competition can create strong incentives for innovation within the
European pharmaceutical market, allowing higher prices and profits for innovative on patent
products (Pammolli et al., 2002). On the other hand, in the regulated markets, strict price
59

regulation undermines generic price competition, and this reduces the positive effects of generic
competition on innovation within pharmaceuticals (Sloan, Health Economics, 2012).
6.2 Limitations
This research has several limitations that should be emphasized. First, the data set used in
this study focuses on ten years between 1994 and 2003. This study yields interesting results for
regulated European market, and since the regulatory environment has changed over time, future
research can focus on the same topic by considering the early 2010s, when patents of many
widely prescribed products expire.
Second, quality and market characteristics employed in the empirical analysis are based on
the measurability of variables in the data set. A different competition characteristic factor, such
as an “index” variable considering all the different regulations and reimbursements in different
countries, may be very useful in order to better capture the generic price competition (Timur,
2006).
Third, although this study has identified certain factors like returns to age, therapeutic
substitutes, and competition, controlling for these measured factors leaves some unmeasured
country effects. For instance, the contribution of patent expiration and other factors to these
unexplained differences is an important subject for future research.
Fourth, as explained in previous chapters, exchange rate fluctuations are controlled through
IMS fixed euro standard unit prices, thus the role of exchange rate changes must be investigated
separately (Timur, 2006).
Finally, even though they are the largest markets, this analysis focuses only on 5 of the 28
members of the European Union.
60

6.3 Future Research
Future research should address several of the limitations mentioned above.
Heterogeneity in drug prices due to different pricing and reimbursement regimes has provided
arbitrage opportunities across countries. This is called “parallel trade (PT)”, which is a legal
activity within a single pharmaceutical market. Parallel imports have an important effect on price
differences. As a follow up of this work, the theoretical and empirical work could be extended to
the impact of the parallel imported products on pharmaceutical prices in the regulated markets.
Continued research in this area should study the competition of PT by using
comprehensive IMS data for the five largest European pharmaceutical markets – the United
Kingdom, Germany, France, Italy, and Spain. The impact of PT on price competition across
different countries has been discussed for a long time, but the literature has contradicting results.
Therefore, future research can focus on the price competition by examining the parallel traders’
incentives to deviate from the price of the originator products and can analyze if the price of the
original products will be affected negatively as a result of parallel traded products. The paper
should also consider the different pricing and reimbursement regulations applied to parallel
traded products to examine the effect of PT on prices. This analysis will inform policy makers
about whether cost savings are realized in countries with strict regulatory systems as a result of
parallel trade activities.
Finally, continued research in this area would give a better understanding of the dynamic
price competition in the pharmaceutical industry in the EU.
61

Table 1. Overall Mean; (Overall), [Within] Standard Deviation Values; N Unit of Observation: Products, Retail Pharmacy, 1994 – 2003
Variable Germany France United
Kingdom Italy Spain
Overall
SU Price (Local Euro)
0.5208 (1.1888) [0.1871]
5039
0.2116 (0.2051) [0.0135]
1022
0.6290 (3.1275) [0.1456]
945
0.3109 (0.7629) [0.1189]
1822
0.2337 (0.2597) [0.0478]
1298
0.3584 (1.3227) [0.1513] 10126
Quality:
Strength(g)
0.0529 (0.0884) [0.0089]
5039
0.1276 (0.4011) [0.0046]
1022
0.0523 (0.0831) [0.0101]
945
0.0939 (0.1468) [0.0295]
1822
0.0768 (0.1375) [0.0145]
1298
0.0708 (0.1663) [0.1041] 10126
Molecule Age
24.0784 (13.4493) [2.8724]
8160
21.4869 (11.8051) [2.8732]
1530
24.5141 (14.3001) [2.8733]
1410
21.9339 (10.9312) [2.8937]
2650
16.8350 (11.1338) [2.8730]
1910
22.6181 (12.9345) [3.0572] 15660
Form Code
3.3351 (4.4552) [2.0342]
8240
1.1574 (1.1126) [0.6454]
1550
3.0574 (4.5637) [1.4828]
1410
1.2215 (1.1186) [0.5444]
2650
1.3994 (1.4475) [0.7835]
1910
2.5061 (3.7171) [1.7960] 15760
Competition:
Pack Size
90.0948 (22.3983) [6.7413]
5039
33.1120 (13.4247) [2.0104]
1012
68.4500 (83.7458) [51.6193]
945
27.8134 (15.7158) [2.7000]
1822
40.9572 (16.9818) [2.6861]
1298
64.8498 (41.7574) [21.1523]
10116
Generic Competition
18.4353 (16.3496) [5.0843]
8240
3.9309 (3.6622) [2.0654]
1550
5.5673 (6.1620) [1.7857]
1410
6.6290 (6.4981) [2.1331]
2650
4.9062 (5.2283) [3.9564]
1910
12.2327 (14.0546) [4.5613] 15760
Generic Entry Lag
10.8625 (11.2981)
[0] 8150
8.9935 (12.3641)
[0] 1540
7.2205 (18.2439)
[0] 1360
8.6981 (10.4850)
[0] 2650
6.3979 (7.7276)
[0] 1910
8.6002 (11.7480) [0.6012] 15610
Therapeutic Substitute Molecule
19.5940 (7.4819) [1.4054]
8240
14.4954 (4.7608) [1.2526]
1550
13.0198 (4.0079) [1.3880]
1410
16.6022 (5.3471) [1.5518]
2650
15.1722 (6.2132) [1.2986]
1910
17.4654 (6.9412) [1.7413] 15760
Therapeutic Substitute Molecule Entry Lag
18.6639 (15.9104)
[0] 7290
15.7381 (11.1827)
[0] 1260
13.1951 (9.7283)
[0] 1230
19.5043 (10.6759)
[0] 2280
19.2616 (11.7163)
[0] 1720
18.1219 (13.8951) [0.6987] 13780
62

Table 2. Overall Mean; (Overall), [Within] Standard Deviation Values; N Unit of Observation: Molecule, Retail Pharmacy, 1994 – 2003
Variable Germany France United
Kingdom Italy Spain
Overall
SU Price (Local Euro)
0.7079 (2.9756) [0.2363]
1535
0.2446 (0.2186) [0.0180]
998
0.9954 (3.8324) [1.2219]
954
0.2792 (0.2735) [0.0433]
1105
0.2272 (0.3161) [0.0382]
993
0.5039 (2.2513) [0.9162]
5585
Quality:
Strength(g)
0.1529 (0.4583) [0.0299]
1535
0.1426 (0.4109) [0.0045]
998
0.1097 (0.4174) [0.1090]
954
0.1390 (0.3861) [0.0391]
1105
0.2176 (0.7000) [0.0146]
993
0.1524 (0.4850) [0.1997]
5585
Molecule Age
20.7951 (15.8138) [2.8731]
1660
18.9521 (12.7938) [2.8735]
1150
22.3972 (19.0603) [2.8736]
1070
20.1222 (13.9323) [2.8733]
1350
18.5000 (12.2250) [2.8734]
1190
20.1651 (14.9874) [5.2916]
6420
Form Code
10.1146 (15.6971) [3.3044]
1770
2.3647 (2.6718) [1.0148]
1190
6.1398 (8.5647) [2.4327]
1080
2.4629 (2.7911) [1.0604]
1350
2.5075 (3.1166) [0.9489]
1190
5.1150 (9.6884) [7.7632]
6580
Competition:
Pack Size
85.4489 (29.0398) [8.7029]
1535
34.2039 (16.6044) [7.3645]
998
84.7038 (124.8797) [72.1947]
954
28.0996 (10.8393) [2.1203]
1105
40.7264 (16.9137) [3.4093]
993
56.8663 (60.6243) [50.7921]
5585
Generic Competition
5.9858 (9.8455) [3.1336]
1770
1.9781 (2.6833) [1.4446]
1190
1.8527 (2.4395) [0.8506]
1080
2.3325 (3.1603) [1.0555]
1350
2.5974 (4.1714) [1.7986]
1190
3.2203 (6.0340) [4.8851]
6580
Therapeutic Substitute Molecule
22.3135 (8.0338) [1.6718]
1770
14.4495 (5.2413) [1.2616]
1190
13.7027 (3.8900) [1.4225]
1080
15.3681 (5.1608) [1.5743]
1350
15.1512 (6.2689) [1.3172]
1190
16.7577 (7.0020) [4.1716]
6580
Therapeutic Substitute Molecule Entry Lag
20.2767 (14.8938)
[0] 1120
15.9090 (10.5595)
[0] 880
17.4069 (12.3608)
[0] 860
19.5825 (12.8462)
[0] 1030
19.0434 (12.4329)
[0] 920
18.5800 (12.9081) [3.8204]
4810
63

Table 3. Quasi-Hedonic Price Regression Results Unit of Observation: Products, Retail Pharmacy, 1994-2003 Fixed Effects Random Effects
Quality Characteristics:
Strength (ln)
Molecule Age (ln)
Form Code (ln)
0.1344 (0.0328)**
-0.0393 (0.0580)***
0.0089 (0.0248)**
0.0885 (0.0226)**
-0.6796 (0.0926)***
-0.0506 (0.0366)**
Competition Characteristics:
Pack Size (ln)
Generic Competition (ln)
Generic Entry Lag (ln)
Therapeutic Substitute Molecules (ln)
Therapeutic Subst. Molecule Entry Lag (ln)
-0.2526 (0.0555)***
-0.0263 (0.0403)**
0.5159 (0.0992)***
-0.3396 (0.0687)***
-0.0276 (0.0125)**
-0.1776 (0.0626)***
0.4861 (0.0955)***
0.3010 (0.0458)**
N
R2 (within)
8,773
0.5376
3,524
0.3540
The dependent variable is the log of the SU euro price. p-values in parantheses. *, ** and *** reflect significance at the 1, 5 and 10% levels, respectively.
64

Table 4. Quasi-Hedonic Price Regression Results Unit of Observation: Molecules, Retail Pharmacy, 1994-2003 Fixed Effects Random Effects
Quality Characteristics:
Strength (ln)
Molecule Age (ln)
Form Code (ln)
0.3023 (0.000)*
0.1248 (0.029)**
-0.0987 (0.081)***
0.2160 (0.001)*
-0.2031 (0.001)*
0.0653 (0.193)
Competition Characteristics:
Pack Size (ln)
Generic Competition (ln)
Therapeutic Substitute Molecules (ln)
Therapeutic Subst. Molecule Entry Lag (ln)
-0.3605 (0.000)*
-0.1240 (0.014)**
0.2718 (0.014)**
-0.3924 (0.000)*
-0.0607 (0.030)**
0.0623 (0.570)
0.1103 (0.475)
N
R2 (within)
3,263
0.6369
2,480
0.3689
The dependent variable is the log of the SU euro price. p-values in parantheses. *, ** and *** reflect significance at the 1, 5 and 10% levels, respectively.
65

Table 5. Product Level Pharmaceutical Prices: Log Price Per Unit Fully Interacted Model – Fixed Effect, 1994 – 2003 Variable Year Germany France U.K. Italy Spain Quality:
Strength (ln) 1994 0.1344* (0.004)
0.0619** (0.015)
0.1580* (0.000)
0.1126* (0.003)
0.1557** (0.011)
2003 0.1259* (0.001)
0.0353* (0.006)
0.1598* (0.000)
0.0596* (0.000)
0.1502* (0.004)
Molecule Age (ln) 1994 -0.6797*
(0.000) -0.0970* (0.001)
-0.4834 (0.180)
-0.0367* (0.000)
-0.5392* (0.000)
2003 -0.9603* (0.003)
-0.5663* (0.000)
-0.3968* (0.001)
-0.2144* (0.000)
-0.7134* (0.000)
Form Codes (ln) 1994 0.0089***
(0.080) 0.1763** (0.014)
0.0004 (0.157)
-0.0787** (0.024)
0.1400*** (0.085)
2003 0.0756* (0.000)
-0.0538* (0.000)
-0.0207* (0.000)
0.0728* (0.000)
0.1458* (0.000)
Competition (Market):
Pack Size (ln) 1994 -0.2527* (0.000)
-0.5135* (0.000)
-0.4787* (0.000)
-0.3385* (0.000)
-0.6818* (0.000)
2003 -0.2198* (0.000)
-0.4273* (0.000)
-0.5768* (0.000)
-0.3294* (0.000)
-0.8127* (0.000)
Generic Competition (ln) 1994 -0.0263**
(0.022) 0.0973** (0.017)
0.2252* (0.003)
0.1332* (0.003)
0.1052* (0.001)
2003 -0.1775* (0.000)
0.0374* (0.000)
0.1118* (0.000)
0.0006* (0.000)
0.0039* (0.000)
66

Table 5 (cont.) Product Level Pharmaceutical Prices: Log Price Per Unit Fully Interacted Model – Fixed Effect, 1994 – 2003 Variable Year Germany France U.K. Italy Spain
Generic Entry Lag (ln) 1994 -0.1776* (0.005)
0.2651* (0.002)
0.2813** (0.018)
0.0547* (0.008)
0.0877* (0.003)
2003 -0.1777* (0.005)
0.2650* (0.002)
0.2812** (0.018)
0.0548* (0.008)
0.0877* (0.003)
Therapeutic Substitute Molecules (ln) 1994 0.5159**
(0.016) -0.3138* (0.000)
-0.1373** (0.031)
-0.4497* (0.000)
-0.0478** (0.039)
2003 0.4970** (0.032)
-0.0932* (0.000)
-0.3608* (0.000)
0.1193* (0.000)
-0.1134** (0.029)
Therapeutic Substitute Molecules Entry Lag (ln)
1994 0.3011* (0.000)
-0.2353* (0.000)
0.3196* (0.003)
0.3072** (0.040)
-0.0112* (0.002)
2003 0.3010* (0.000)
-0.2354* (0.000)
0.3196* (0.003)
0.3071** (0.040)
-0.0111* (0.002)
Adjusted R2=0.539; p-values in parantheses. *, ** and *** reflect p < 0.01, p < 0.05 and p < 0.10 respectively.
67

Table 6. Product Level Pharmaceutical Prices: Generic Competition Log Price Per Unit, Fully Interacted Model
Adjusted R2=0.539; p-values in parantheses. *, ** and *** reflect p < 0.01, p < 0.05 and p < 0.10 respectively.
Year Germany France United Kingdom
Italy Spain
1995 -0.0261 (0.173)
0.0981 (0.447)
0.1808* (0.005)
0.1104* (0.007)
0.0923* (0.004)
1996 -0.0081*** (0.094)
0.0684*** (0.056)
0.1849* (0.002)
0.1083* (0.004)
0.0876* (0.002)
1997 -0.0579* (0.004)
0.0382* (0.006)
0.1687* (0.000)
0.1076* (0.000)
0.0794* (0.000)
1998 -0.0882* (0.000)
0.0087* (0.000)
0.1504* (0.000)
0.0960* (0.000)
0.0712* (0.000)
1999 -0.1079* (0.000)
0.0316* (0.000)
0.1780* (0.000)
0.0966* (0.000)
0.0605* (0.000)
2000 -0.1188* (0.000)
0.0373* (0.000)
0.1915* (0.000)
0.0844* (0.000)
0.0564* (0.000)
2001 -0.1336* (0.000)
0.0394* (0.000)
0.1584* (0.000)
0.0663* (0.000)
0.0338* (0.000)
2002 -0.1581* (0.000)
0.0329* (0.000)
0.1242* (0.000)
0.0235* (0.000)
0.0152* (0.000)
2003 -0.1775* (0.000)
0.0374* (0.000)
0.1118* (0.000)
0.0006* (0.000)
0.0039* (0.000)
68

Table 7. National Controls for Pharmaceuticals on the Supply-Side COUNTRY: NATIONAL HEALTH
PRICING: REIMBURSEMENT:
SYSTEMS: *
Germany GKV, statuary health insurance Price freedom for new products a) Reference price for off-patent sector (products subjected to
covers 88% of the population. generic competition; reference price for identical molecule
Most of the remaining only)
population had private b) Drug budgets with caps re-introduced in 1999.
insurance. c) Negative list
d) Positive list
UK The National Health Service a) PPRS: Agreement with industry on profit control, renewed in 1999 a) Negative List
since 1948 financed through for a five-year period b) Homogeneous budget given to PCGs
central government. b) Price cut, as part of PPRS, of 4.5% c) Practice guidelines
c) Free price modulation by 2001. d) Guidance on cost-effectiveness by NICE, influences
prescribing
France Universally covered (99% of a) Price fixing through negotiation (productgs medical value, prices of a) Comite Economique du Medicament decides on
the population) by statuary comparable medicines, volume sales and conditions used) reimbursable prices on advice from Transparency
health insurance. b) Comparisons with other European Countries for iinnovativej committee
products b) Positive List
c) Periodic price reductions for new and expensive products c) Medical References
d) Price freedom has been introduced since 2003** d) Targets for igate-keepingj GP
e) Pharmacoeconomic guidelines under development
f) Prices of generics 30% lower than those of the original
Italy SSN: National Health Service. a) Average European Price (all EU countries) for ioldj products and a) Positive list
Funds are supplemented by products registered with the national procedure; AEP is calculated on b) Reference listing and same prices for same drugsg principle
local taxes and health service ex-manufacturergs price (excl. VAT), of top five selling equivalents, for off-patent drugs
charges. including generics. c) Formal requirement for economic evaluation during price
b) Price negotiation (contractual model) for new and innovative negotiations
products (for drugs registered with EMEA or for those for which d) Guidelines and protocols defined and managed at local
AEP cannot be calculated) level
c) Price freedom for non-reimbursable drugs e) Official earmarked budget for innovative drugs introduced
d) Generics are priced at least 20% below the original in 1998, representing 1% of national drug budget
e) Frequent use of price cuts/freezes
Spain The National statuary health a) Price control trough negotiation on a cost-plus basis a) Positive list
insurance b) International price comparisons b) Negative list
c) Price-volume agreement for expensive products c) Reference pricing for estimating maximum reimbursement
for multi-source products
(Timur 2006), (Kanavos 2001), (Seget 2003), (Blachier and Kanavos), (Jommi), (Kullman), (Mossialos et al. 2004)
69

Table 8. Summary of Approaches in the Regulation of Pharmaceutical Prices by Originator and Generic Drugs (2003)
Countries: Market Free Pricing Direct Price Use of Profit Reference segment Controls international Controls Pricing price comparisons
France Originator X X
Generic X
Germany Originator X
Generic X
Italy Originator X X
Generic X
Spain Originator X X
Generic X X
UK Originator X
Generic X
(Timur 2006), (Mossialos et al. 2004)
70

Table 9. Demand-Side Policies (Prescribing, Dispensing and Consumption) in the Member States Country: Positive List Negative Budget Guidelines / Generic Substitution Incentives Co-payment
List Monitoring Prescribing
France Yes No Yes Yes Yes (limited- Yes Yes % gatekeepers) (gatekeepers)
Germany No (but Yes Yes Yes Yes Yes Yes Flat Fee
planned)
Italy Yes No Yes Yes No Yes No % + flat fee
Spain Yes Yes No Yes Yes (limited) No No % up to a max per item
UK No Yes Yes Yes Yes (limited) No Yes Flat
(Timur 2006), (Kanavos 2001)
71

(Timur 2006), (Jacobzone 2000)
Table 10. ATC Therapeutic Categories for Cardiovascular Disease ATC Code Category Name
C1A Cardiac Glycosides and Combinations
C2A Antihypertensives (of non-herbal origin) Plain:
It includes plain antihypertensives and combinations other than those with diuretics, eg combinations of two synthetic antihypertensives or combinations of one synthetic antihypertensive with reserpine. C3A Diuretics: Combinations with potassium belong to C3A1, C3A2 or C3A3.
C4A Cerebral and Peripheral Vasotherapeutics: This group includes all
products (including citicoline) which are mainly recommend for cerebral vascular diseases or peripheral circulatory disorders excluding venous diseases. Combination products are only classified in this group if they do
not belong to group C1-C3, C7-C11. C7A Beta-Blocking Agents, Plain: Includes, eg acebutolol, alprenolol,
amosulalol, arotinol, atenolol, befunolol, betaxolol, bevantolol, bisoprolol, bopindolol, bucumolol, bufetolol, bunitrolol, bupranolol, butofilolol, carazolol, carteolol, carvedilol, celiprolol, cloranolol, dilevalol, esmolol, indenolol, labetolol, levobunolol, mepindolol, metipranolol, metoprolol, nadolol, nifenalol, nipradilol, oxprenolol, penbutolol, pindolol, practolol, propranolol, sotalol, tertanolol, tilisolol, timolol, toliprolol. C8A Calcium Antagonists, Plain
C9A Ace Inhibitors, Plain : Angiotensin-Converting-Enzyme inhibitors. It
includes eg alacepril, benazepril, captopril, cilazepril, delapril, enalapril, fosinopril, imidapril, lisinopril, moexipril, perindopril, quinapril, ramipril, spirapril, temocapril, trandolapril. C10A Cholesterol and Triglyceride Regulating Preparations: Includes all
products regulating cholesterol and triglycerides only. Combinations with products of group C4 should be classified here.
72

Table 11. Largest Pharmaceutical Markets in the World, National Currency (million), growth: US$, NC
(Timur 2006), (Pammolli et al. 2004)
2000 2001 2002 2003
Rank Country Mill NC +($) +NC Mill NC +($) +NC Mill NC +($) +NC Mill NC +($) +NC
03
1 USA 150,952 14 14 176,748 17 17 197,602 12 12 219,522 11 11
2 Japan 6,231,585 8 2 6,502,706 -7 4 6,603,811 -2 2 7,059,335 12 7
3 Germany 18,157 -8 6 19,921 7 10 21,515 14 8 24,631 30 14
4 France 18,111 -6 9 19,418 4 7 20,183 9 4 22,583 27 12
5 Italy 11,990 -1 15 13,441 9 12 14,136 11 5 15,592 25 10
6 United 7,380 0 7 8,180 5 11 9,111 16 11 10,386 20 14
Kingdom
7 Spain 7,711 2 18 8,349 5 8 9,174 16 10 10,794 34 18
13 Australia 5,452 0 11 6,227 2 14 6,854 16 10 8,088 30 18
17 Belgium 2,722 -7 8 2,862 2 5 3,049 12 7 3,521 31 15
18 Poland 11,013 12 22 11,913 15 8 12,373 4 4 14,407 18 16
19 Greece 1,504 -1 19 1,805 15 20 2,281 33 26 2,898 44 27
20 Sweden 19,690 0 11 21,051 -5 7 22,737 15 8 24,711 22 9
21 Switzerland 2,971 -4 8 3,279 10 10 3,517 16 7 3,926 26 12
23 Austria 1,766 -9 6 1,864 3 6 2,038 15 9 2,284 27 12
24 Portugal 1,702 -6 8 1,848 5 9 1,998 14 8 2,183 24 9
29 Finland 1,071 -5 10 1,201 9 12 1,330 17 11 1,491 27 12
33 Denmark 7,105 -5 10 7,782 6 10 8,799 19 13 9,762 26 11
35 Norway 6,945 -3 9 7,742 9 11 8,912 30 15 9,384 16 5
36 Czeck 28,254 0 11 29,896 7 6 32,763 27 10 38,138 29 16
Republic
73

Figure 1. Pharmaceutical Production in the EU (In million dollars at exchange rate)
Source: OECD Health Data (2003)
74

References
Adriaen M, De Witte K, Simoens S. Pricing Strategies of Originator and Generic Medicines Following Patent Expiry in Belgium. Journal of Generic Medicines. 2008;5:175-87.
Anis A.H., Guh D.P., Woolcott J. (2003). Lowering Generic Drug Prices: Less Regulation Equals More Competition. Med Care 2003; 41(1):135–141.
Anis A. (1994). Substitution Laws, Insurance Coverage, and Generic Drug Use. Medical Care, 32(3):240-256.
Aronson T, Bergman M, Rudholm N. (2001). The Impact of Generic Drug on Brand Name Market Shares: Evidence from Micro Data. Review of Industrial Organization, 19: 425-435.
Augurzky B. (2009). Effects of the German Reference Drug Program on Ex-Factory Prices of Prescription Drugs: a Panel Data Approach. Health Economics, John Wiley & Sons, Ltd., vol. 18(4), pages 421-436.
Bergman MA, Rudholm N. (2003). The Relative Importance of Actual and Potential Competition: Empirical Evidence from the Pharmaceutical Market. The Journal of Industrial Economics, 60: 544-467.
Caves, Richard E.; Whinston, Michael D.; and Hurwitz, Mark A. Patent Expiration, Entry, and Competition in the U.S. Pharmaceutical Industry. (1991). In Brookings Papers on Economic Activity: Microeconomics (1991), pp. 1–48.
Dalen D. M. (2006). Price Regulation and Generic Competition in the Pharmaceutical Market. University of Oslo Health Economics Research Programme, Working paper 2006: 1.
Danzon, P. and Towse, A. (1998). The Pros and Cons of a Single Euro-Price for Drugs and The Economics of Parallel Trade. PharmacoEconomics, Springer Healthcare | Adis, vol. 14(1), pages 135-137.
Danzon, P.M., & Li-Wei, C. (2000a). Does Regulation Drive Out Competition in Pharmaceutical Markets? Journal of Law and Economics,23(2), 311-358.
Danzon, P.M. & Li-Wei, C. (2000b). Cross-National Price Differences for Pharmaceuticals: How Large, and Why? Journal of Health Economics, 19(2), 159-195.
Danzon, P.M., Mulcahy, A.W. & Towse, A.K. (2011). Pharmaceutical Pricing in Emerging Markets: Effects of Income, Competition and Procurement. Health Economics.
75

Deutsche Bank Research. (2007). Euro Riding High as an International Reserve Currency. Frankfurt, GER: Becker, W.
Donatini, A., Rico, A., D’Ambrosio, M.G. et al. (2001). Health Care Systems in Transition: Italy. Copenhagen: European Observatory on Health Care Systems.
Ephmra (2004). Anatomical Classification Guidelines 2004.
Europa. (2014). The History of the European Union. Retrieved from http://europa.eu/about-eu/eu-history/1945-1959/index_en.htm
Europa. (2010). Treaty of Maastricht on European Union. Retrieved from http://europa.eu/legislation_summaries/institutional_affairs/treaties/treaties_maastricht_en.htm
European Commission. (2010). The Euro. In Economic and Financial Affairs. Retrieved from http://ec.europa.eu/economy_finance/euro/index_en.htm European Commission – DG Enterprise. (2001). Overview of Pharmaceutical Pricing and Reimbursement Regulation in Europe. Kanavos, P.
European Commission – DG Competition. (2006). Surveying, Assessing and Analysing the Pharmaceutical Sector in the 25 EU Member States. Retrieved from http://ec.europa.eu/competition/mergers/studies_reports/oebig.pdf
Garattini L., Salvioni F. (1996). Distribution Margins: a European Overview. Pharma Pricing Review, 1(8):154-157.
Garattini L., Tediosi F. (2000). A comparative Analysis of Generic Markets in Five European Countries. Health Policy, 51:149-162.Rovira (2001).
Ghalamkarpour, A. (2009). Marketing Authorization Procedures in the European Union – Making the Right Choice. Life Science Technical Bulletin, 33. 1-5.
Government Offices of Sweden. (2006). EMU and the Euro. In Ministry of Finance. Retrieved from http://www.government.se/sb/d/3326
Grabowski, Henry G., and Vernon, John M. (1992). Brand Loyalty, Entry, and Price Competition in Pharmaceuticals after the 1984 Drug Act. Journal of Law and Economics 35 (1992): 331–50.
Hollis A. (2002). The Importance of Being First: Evidence From Canadian Generic Pharmaceuticals. Health Econ. 2002 Dec;11(8):723-34.
Hudson J. (2000). Generic Take-up in the Pharmaceutical Market following Patent Expiry - A Multi-Country Study. International Review of Law and Economics, 20, 205–221.
76

Jones J.C.H , Potashnik T. and Zhang A. (2001). Patents, Brand Generic Competition and the Pricing of Ethical Drugs in Canada: Some Empirical Evidence form British Columbia 1981-1994. Applied Economics, 33: 947-956.
Jönsson B. (1994). Pricing and Reimbursement of Pharmaceuticals in Sweden. Pharmacoeconomics. 1994;6 (Suppl 1):51–60.
Kanavos, P. and Mossialos, E. (1999). Outstanding Regulatory Issues in the European Union Pharmaceutical Market. Pharmacoeconomics, 15 (6). 519-533. ISSN 1170-7690.
Kanavos, P., Costa-Font, J., Seeley, E. (2007). Competition in Off-Patent Drug Markets: Issues, Regulation and Evidence. London School of Economics.
Kanavos P, Costa Font, J and McGuire AJ. (2007). Product Differentiation, Competition and Regulation of New Drugs: The Case of Statins in four European Countries. Managerial and Decision Economics, vol. 28.
Kanavos P, Srivastava D. (2008). The Impact of Patent Expiry on Product Competition and Generic Market Entry: Evidence From Four European Countries. European Journal of Health Economics.
Kuchler, T. (2006). Almunia Says 'Undesirable' to Act on Sweden's Euro Refusal. Retrieved from http://euobserver.com/economic/22733
Kurt R. Brekke (2007). Regulation and Pricing of Pharmaceuticals: Reference Pricing or Price Cap Regulations? CESifo Working Paper No. 2059.
Magazzini, L., Pammolli, F., Massimo, R. (2004). Dynamic Competition in Pharmaceuticals: Patent Expiry, Generic Penetration, and Industry Structure. European Journal of Health Economics,5(2), 175-182. http://mpra.ub.uni-muenchen.de/15968/
Mossialos, E., Walley, T. & Mrazek, M. (2004). Regulating Pharmaceuticals in Europe: An overview. London, UK: Open University Press.
Mrazek, M. & Frank, R. (2004). The Off-patent pharmaceutical market. In E. Mossialos, M. Mrazek & T. Walley (Eds.), Regulating Pharmaceutical Markets in Europe: Striving for Efficiency, Equity, and Quality (245-258). London: World Health Organization on behalf of the European Observatory on Health Systems and Policies.
NERA (1998). Policy Relating to Generic Medicines in the OECD.
Nink, K., Schroder, H. and Selke, G.W. (2001). Der Arzneimittelmarkt in der BDR [The Pharmaceuticals Market in the Federal Republic of Germany], in U. Schwabe and D. Paffrath (eds). Arzneiverordnungs-Report 2001. Berlin: Springer.
77

Organization for Economic Cooperation and Development, OECD. (2000,2001,2002). Competition and Regulation Issues in the Pharmaceutical Industry. Competition Law and Policy. Retrieved from http://www.oecd.org/regreform/sectors/1920540.pdf Organization for Economic Cooperation and Development OECD, (2008). Pharmaceutical Pricing Policies in a Global Market. OECD Health Policy Studies.
Pammolli F. (2002). The Intensity of Competition after Patent Expiry in Pharmaceuticals: a Cross-country Analysis, (with L. Magazzini, L.Orsenigo), Revue d'Economie Industrielle, 99, 107-132.
Pavcnik, N. (2002). Do Pharmaceutical Prices Respond to Potential Patient out-of-pocket Expenses?, RAND Journal of Economics, 33(3): 469–87.
Perry, G. (2006). The European Generic Pharmaceutical Market in Review: 2006 and Beyond. European Generic Medicines Association Rue d'Arlon. Pieter Dylst, P. and Simoens, S. (2010). Generic Medicine Pricing Policies in Europe: Current Status and Impact. Pharmaceuticals, 3.471-481.
Podnar K. (2007). How Reference Pricing for Pharmaceuticals Can Increase Generic Share of Market: The Slovenian Experience Journal of Public Policy & Marketing, Vol. 26, No. 2, Fall 2007.
Puig-Junoy J. (2010). Impact of European pharmaceutical price regulation on generic price competition: a review. Pharmacoeconomics 2010;28(8):649–663.
Reekie, W. Duncan. (1996). Medicines Prices and Innovations. London: Institute of Economic Affairs, Health and Welfare Unit.
Rizzo J. A., Zeckhauser R. (2005). Generic Scrip Share and the Price of Brand-Name Drugs: The Role of the Consumer. NBER Working Papers 11431, National Bureau of Economic Research, Inc.
Rovira, J. and Darba, J. (2001). Pharmaceutical Pricing and Reimbursement in Spain. European Journal of Health Economics, 2(1): 39–43.
Scherer, F.M. (2000). The Pharmaceutical Industry. In A.J. Culyer & J.P. Newhouse (Eds.), Handbook of Health Economics (1297-1336). Philadelphia: Elsevier.
Sloan, F. (2012). Health Economics. Cambridge, MA: Massachusetts Institute of Technology.
Timur, A., Picone, G. & DeSimone, J.S. (2010). Has the European Union Achieved a Single Pharmaceutical Market? National Bureau of Economic Research Working Paper Series. http://www.nber.org/papers/w16261
Timur, A. (2006). The Single Market and Pharmaceutical Industry in the European
78

Union: Is There Any Evidence of Price Convergence? (Doctoral dissertation). Retrieved from Scholar Commons. (http://scholarcommons.usf.edu/etd/2728).
Vandoros, S. & Kanavos, P. (2013). The generics paradox revisited: empirical evidence from regulated market. Applied Economics, 45(22), 3230-3239.
Vogler, S. (2012). The Impact of Pharmaceutical Pricing and Reimbursement Policies on
Generics Uptake: Implementation of Policy Options on Generics in 29 European Countries – an Overview 2012. Generics and Biosimilars Initiative Journal,1(2).
Wooldridge, J.M. (2001). Econometric Analysis of Cross Section and Panel Data. Cambridge, MA: Massachusetts Institute of Technology.
79

Appendices
80

Appendix A: Tables
Table A.1. Product Level Pharmaceutical Prices: Strength Log Price Per Unit, Fully Interacted Model
Year Germany France United Kingdom
Italy Spain
1995 0.1325 (0.009)
0.0666 (0.051)
0.1407 (0.004)
0.1008 (0.000)
0.1482 (0.002)
1996 0.1314 (0.014)
0.0602 (0.074)
0.1364 (0.004)
0.0979 (0.000)
0.1509 (0.001)
1997 0.1269 (0.014)
0.0636 (0.046)
0.1413 (0.002)
0.0925 (0.000)
0.1498 (0.012)
1998 0.1223 (0.011)
0.0668 (0.030)
0.1517 (0.001)
0.0880 (0.001)
0.1501 (0.022)
1999 0.1237 (0.010)
0.0649 (0.050)
0.1224 (0.001)
0.0901 (0.000)
0.1538 (0.039)
2000 0.1269 (0.008)
0.0596 (0.044)
0.1356 (0.001)
0.0725 (0.000)
0.1516 (0.034)
2001 0.1272 (0.005)
0.0473 (0.032)
0.1212 (0.002)
0.0659 (0.000)
0.1488 (0.019)
2002 0.1311 (0.004)
0.0407 (0.027)
0.1541 (0.000)
0.0541 (0.000)
0.1459 (0.010)
Adjusted R2=0.539; p-values in parentheses.
81

Table A.2. Product Level Pharmaceutical Prices: Molecule Age Log Price Per Unit, Fully Interacted Model
Year Germany France United Kingdom
Italy Spain
1995 -0.5972 (0.031)
-0.1441 (0.021)
-0.3254 (0.039)
-0.1022 (0.006)
-0.6456 (0.000)
1996 -0.6558 (0.006)
-0.2028 (0.005)
-0.5280 (0.006)
-0.1323 (0.030)
-0.7357 (0.000)
1997 -0.6941 (0.000)
-0.1262 (0.000)
-0.1217 (0.000)
-0.1408 (0.000)
-0.7882 (0.000)
1998 -0.6833 (0.000)
-0.0912 (0.000)
-0.1989 (0.000)
-0.1347 (0.000)
-0.8469 (0.000)
1999 -0.7039 (0.000)
-0.1053 (0.000)
-0.3584 (0.000)
-0.1098 (0.000)
-0.9317 (0.000)
2000 -0.7036 (0.000)
-0.1853 (0.000)
-0.4952 (0.000)
-0.1073 (0.000)
-0.9730 (0.000)
2001 -0.7751 (0.003)
-0.2475 (0.000)
-0.5011 (0.001)
-0.1332 (0.006)
-0.8634 (0.000)
2002 -0.8598 (0.001)
-0.3177 (0.000)
-0.5086 (0.000)
-0.1463 (0.002)
-0.7774 (0.000)
Adjusted R2=0.539; p-values in parentheses.
82

Table A.3. Product Level Pharmaceutical Prices: Form Code Log Price Per Unit, Fully Interacted Model
Year Germany France United Kingdom
Italy Spain
1995 0.0120 (0.064)
0.1882 (0.035)
0.0265 (0.131)
-0.0648 (0.053)
0.1290 (0.123)
1996 0.0093 (0.041)
0.1633 (0.031)
0.0569 (0.042)
-0.0110 (0.007)
0.1399 (0.088)
1997 0.0190 (0.177)
0.1062 (0.067)
0.0274 (0.223)
0.0023 (0.031)
0.2339 (0.094)
1998 0.0342 (0.080)
-0.0776 (0.037)
0.0177 (0.213)
-0.0006 (0.032)
0.1652 (0.025)
1999 0.0428 (0.016)
0.1070 (0.014)
0.0482 (0.040)
0.0085 (0.010)
0.1746 (0.001)
2000 0.0421 (0.003)
0.1071 (0.004)
0.0590 (0.013)
0.0099 (0.002)
0.1876 (0.000)
2001 0.0398 (0.006)
0.1181 (0.007)
0.0139 (0.030)
0.0199 (0.002)
0.1721 (0.001)
2002 0.0571 (0.000)
-0.0602 (0.000)
-0.0044 (0.000)
0.0734 (0.000)
0.1595 (0.000)
Adjusted R2=0.539; p-values in parentheses.
83

Table A.4. Product Level Pharmaceutical Prices: Pack Size Log Price Per Unit, Fully Interacted Model
Year Germany France United Kingdom
Italy Spain
1995 -0.2407 (0.000)
-0.5226 (0.000)
-0.4514 (0.000)
-0.2944 (0.000)
-0.6879 (0.000)
1996 -0.2345 (0.000)
-0.4425 (0.000)
-0.4927 (0.000)
-0.2852 (0.000)
-0.6918 (0.000)
1997 -0.2221 (0.000)
-0.6417 (0.000)
-0.5025 (0.000)
-0.2797 (0.000)
-0.7182 (0.000)
1998 -0.1962 (0.000)
-0.4335 (0.000)
-0.5566 (0.000)
-0.2788 (0.000)
-0.7600 (0.000)
1999 -0.2089 (0.000)
-0.4700 (0.000)
-0.5928 (0.000)
-0.2677 (0.000)
-0.7594 (0.000)
2000 -0.2230 (0.000)
-0.2952 (0.000)
-0.6253 (0.000)
-0.2779 (0.000)
-0.7708 (0.000)
2001 -0.2270 (0.000)
-0.3102 (0.000)
-0.6505 (0.000)
-0.3026 (0.000)
-0.8049 (0.000)
2002 -0.2212 (0.000)
-0.3298 (0.000)
-0.6178 (0.000)
-0.3265 (0.000)
-0.8038 (0.000)
Adjusted R2=0.539; p-values in parentheses.
84
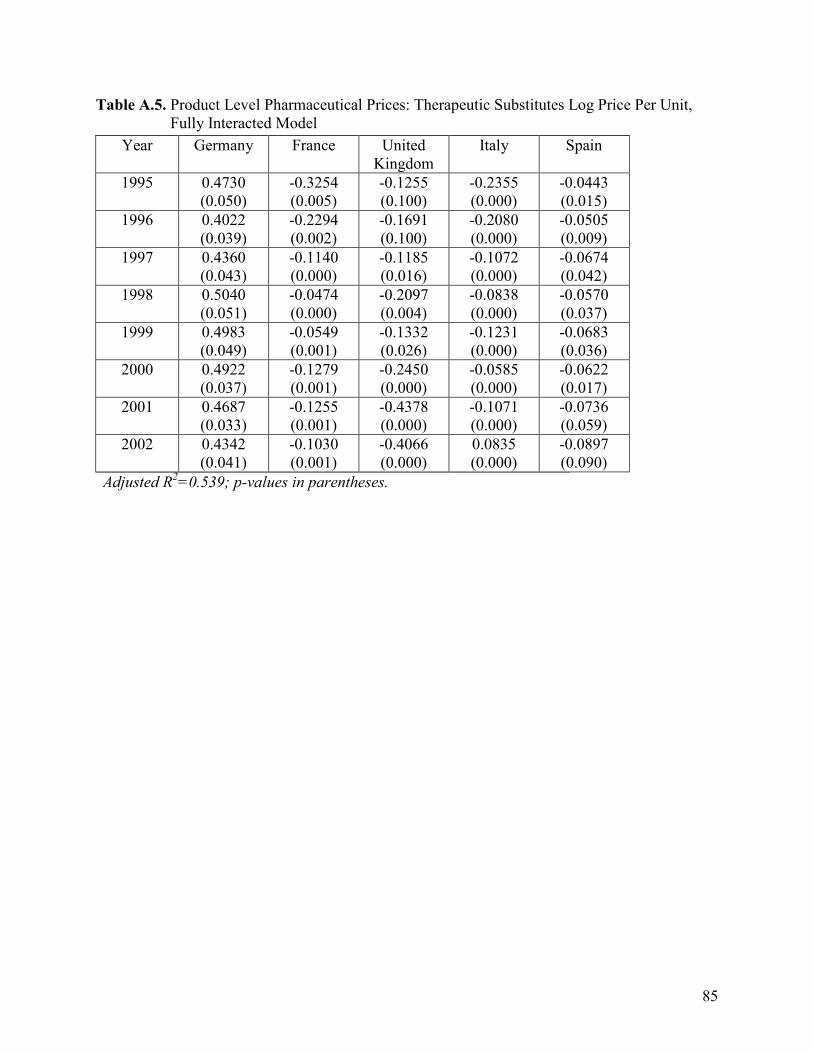
Table A.5. Product Level Pharmaceutical Prices: Therapeutic Substitutes Log Price Per Unit, Fully Interacted Model
Year Germany France United Kingdom
Italy Spain
1995 0.4730 (0.050)
-0.3254 (0.005)
-0.1255 (0.100)
-0.2355 (0.000)
-0.0443 (0.015)
1996 0.4022 (0.039)
-0.2294 (0.002)
-0.1691 (0.100)
-0.2080 (0.000)
-0.0505 (0.009)
1997 0.4360 (0.043)
-0.1140 (0.000)
-0.1185 (0.016)
-0.1072 (0.000)
-0.0674 (0.042)
1998 0.5040 (0.051)
-0.0474 (0.000)
-0.2097 (0.004)
-0.0838 (0.000)
-0.0570 (0.037)
1999 0.4983 (0.049)
-0.0549 (0.001)
-0.1332 (0.026)
-0.1231 (0.000)
-0.0683 (0.036)
2000 0.4922 (0.037)
-0.1279 (0.001)
-0.2450 (0.000)
-0.0585 (0.000)
-0.0622 (0.017)
2001 0.4687 (0.033)
-0.1255 (0.001)
-0.4378 (0.000)
-0.1071 (0.000)
-0.0736 (0.059)
2002 0.4342 (0.041)
-0.1030 (0.001)
-0.4066 (0.000)
0.0835 (0.000)
-0.0897 (0.090)
Adjusted R2=0.539; p-values in parentheses.
85

About the Author
Berna Colak obtained her undergraduate degree in International Finance from
Istanbul Bilgi University in 2003 and her M.A. degree in Economics from Bogazici
University in 2005. After holding positions in the finance industry as a financial auditor
and a corporate finance expert in Turkey, she moved to the USA in 2006.
While teaching a wide range of economics courses at the University of South
Florida, she started to pursue her Ph.D. degree in Economics in 2009. She received her
M.A. degree in Economics in 2011, M.S. degree in Finance in 2012, and Graduate
Certificate degree in Statistics in 2014 from the University of South Florida. She held a
research scientist position at Moffitt Research Center for one year between April 2012
and March 2013 to apply econometric models to the field of health economics. She won
the Provost’s Award for Outstanding Teaching at the University of South Florida in 2014.
Her major areas of research are Industrial Organization, Health Economics, Applied
Econometrics, and International Economics.