generating norwalk, fairfield county, connecticut
TRANSCRIPT

Project Number 152941 A World of Solutions TM
WETLAND DELINEATION REPORT NRG Norwalk Harbor Generating Station Norwalk, Fairfield County, Connecticut
Prepared for: Norwalk Power LLC Norwalk, Connecticut Prepared by:
CB&I Environmental & Infrastructure, Inc.
150 Royall Street
Canton, MA 02021
February 2017

Wetland Delineation Report i NRG Energy Norwalk Generating Station Norwalk, Fairfield County, Connecticut
Table of Contents 1.0 Introduction ............................................................................................................................. 1 2.0 Field Methodology ................................................................................................................... 1 2.1 Tidal Wetland Methodology ............................................................................................ 2
2.1.1 Hydrophytic Vegetation Methodology ..................................................................... 2
2.2 Non‐tidal Wetland and Watercourse Methodology ........................................................ 3
2.2.1 Hydric Soils Methodology ......................................................................................... 3
2.2.2 Mapped Soils ............................................................................................................. 4
2.3 Additional Delineation Methodology ............................................................................... 5
2.3.1 U.S. Army Corps of Engineers Methodology ............................................................ 5
2.3.2 Wetland Hydrology Methodology ............................................................................ 5
3.0 Site Drainage ............................................................................................................................ 7 4.0 Additional Tasks ....................................................................................................................... 7 4.1 Invasive Plant Species ...................................................................................................... 7
4.2 Tree Diameter Measurements ......................................................................................... 8
5.0 Results ...................................................................................................................................... 8 5.1 Tidal Wetlands .................................................................................................................. 8
5.2 Inland Freshwater Wetlands ............................................................................................ 9
5.3 Invasive Plant Species ...................................................................................................... 9
5.4 Trees ............................................................................................................................... 10
6.0 Conclusions ............................................................................................................................ 11 7.0 References ............................................................................................................................. 12 APPENDIX A ‐ Figures
Figure 1: Site Location Plan Figure 2: Site Map with Wetland Delineation Survey Figure 3: Soils Map Figure 4: CTDEEP Map of Known Long‐eared Bat Habitat
APPENDIX B ‐ Photographs APPENDIX C ‐ Wetland Determination Data Forms APPENDIX D ‐ Vegetation
Observed Vegetation Connecticut Invasive Plant List
APPENDIX E ‐ Invasive Species Monitoring Forms
Wetland Delineation Report 1 NRG Energy Norwalk Generating Station Norwalk, Fairfield County, Connecticut
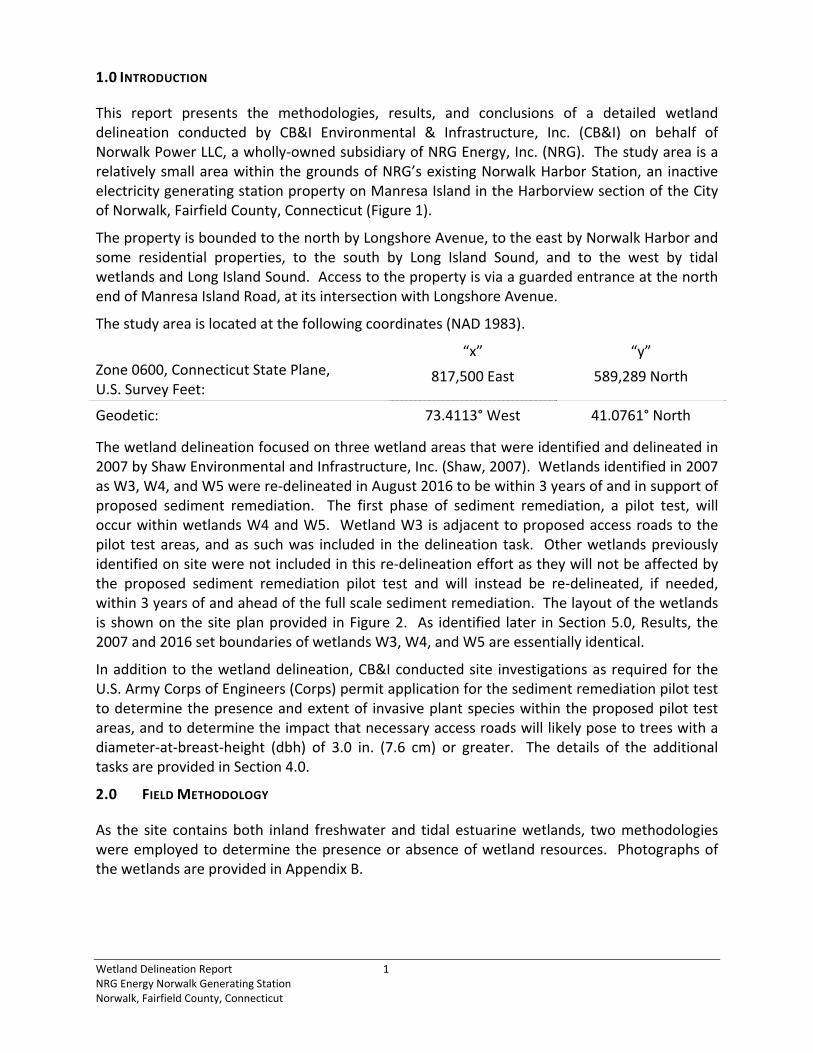
1.0 INTRODUCTION
This report presents the methodologies, results, and conclusions of a detailed wetland delineation conducted by CB&I Environmental & Infrastructure, Inc. (CB&I) on behalf of Norwalk Power LLC, a wholly‐owned subsidiary of NRG Energy, Inc. (NRG). The study area is a relatively small area within the grounds of NRG’s existing Norwalk Harbor Station, an inactive electricity generating station property on Manresa Island in the Harborview section of the City of Norwalk, Fairfield County, Connecticut (Figure 1).
The property is bounded to the north by Longshore Avenue, to the east by Norwalk Harbor and some residential properties, to the south by Long Island Sound, and to the west by tidal wetlands and Long Island Sound. Access to the property is via a guarded entrance at the north end of Manresa Island Road, at its intersection with Longshore Avenue.
The study area is located at the following coordinates (NAD 1983).
“x” “y” Zone 0600, Connecticut State Plane, U.S. Survey Feet:
817,500 East 589,289 North
Geodetic: 73.4113° West 41.0761° North
The wetland delineation focused on three wetland areas that were identified and delineated in 2007 by Shaw Environmental and Infrastructure, Inc. (Shaw, 2007). Wetlands identified in 2007 as W3, W4, and W5 were re‐delineated in August 2016 to be within 3 years of and in support of proposed sediment remediation. The first phase of sediment remediation, a pilot test, will occur within wetlands W4 and W5. Wetland W3 is adjacent to proposed access roads to the pilot test areas, and as such was included in the delineation task. Other wetlands previously identified on site were not included in this re‐delineation effort as they will not be affected by the proposed sediment remediation pilot test and will instead be re‐delineated, if needed, within 3 years of and ahead of the full scale sediment remediation. The layout of the wetlands is shown on the site plan provided in Figure 2. As identified later in Section 5.0, Results, the 2007 and 2016 set boundaries of wetlands W3, W4, and W5 are essentially identical.
In addition to the wetland delineation, CB&I conducted site investigations as required for the U.S. Army Corps of Engineers (Corps) permit application for the sediment remediation pilot test to determine the presence and extent of invasive plant species within the proposed pilot test areas, and to determine the impact that necessary access roads will likely pose to trees with a diameter‐at‐breast‐height (dbh) of 3.0 in. (7.6 cm) or greater. The details of the additional tasks are provided in Section 4.0.
2.0 FIELD METHODOLOGY
As the site contains both inland freshwater and tidal estuarine wetlands, two methodologies were employed to determine the presence or absence of wetland resources. Photographs of the wetlands are provided in Appendix B.

Wetland Delineation Report 2 NRG Energy Norwalk Generating Station Norwalk, Fairfield County, Connecticut
2.1 TIDAL WETLAND METHODOLOGY
Tidal wetlands were identified and delineated in accordance with the guidelines set by the Connecticut Department of Energy and Environmental Protection (CTDEEP), Land and Water Resources Division (LWRD)(formerly Office of Long Island Sound Programs [OLISP]), and found at Connecticut General Statutes, Chapter 440 (Wetlands and Watercourses), Sections 22a‐28 through 22a‐35. The limit of LWRD jurisdiction includes:
…those areas which border on or lie beneath tidal waters, such as, but not limited to banks, bogs, salt marsh, swamps, meadows, flats, or other low lands subject to tidal action, including those areas now or formerly connected to tidal waters, and whose surface is at or below an elevation of one foot above local extreme high water.
As LWRD considers vegetation the primary determinant in identifying jurisdictional tidal wetlands, CB&I ensured that a botanist familiar with tidal vegetative communities directed the field work within tidal wetlands.
2.1.1 HYDROPHYTIC VEGETATION METHODOLOGY
In 2006, the Corps assumed the responsibility of administering the list of wetland plants, and the list formerly administered by the U.S. Fish and Wildlife Service is officially obsolete. Therefore, scientific names and wetland indicator statuses for the vegetation conform to those listed in the National Wetland Plant List: 2016 Wetland Ratings (Lichvar et al., 2016) (NWPL). The indicator statuses specific to the “Northcentral and Northeast Region” as defined by the Corps apply to the site. The official current definitions for vegetation wetland indicator statuses are as follows.
Obligate Wetland (OBL) ‐ Almost always occur in wetlands.
Facultative Wetland (FACW) ‐ Usually occur in wetlands, but may occur in non‐wetlands.
Facultative (FAC) ‐ Occur in wetlands or non‐wetlands.
Facultative Upland (FACU) ‐ Usually occur in non‐wetlands, but may occur in wetlands.
Obligate Upland (UPL) ‐ Almost never occur in wetlands.
In addition, an unofficial status applied for this delineation included the following.
Not Listed (NL) – This was applied to vascular plants that are not listed as hydrophytes in any region, and therefore are not included on the NWPL. It was also applied to plants that are not listed in the Eastern Mountains and Piedmont Region or adjacent regions, but might be listed in other regions. Per the Supplement, these species are assigned the indicator status of UPL on data forms.
Not Applicable (NA) – This was assigned to plants that were not identified to species level, as well as to those species that are non‐vascular or parasitic, which are not included on the NWPL.
Per the original indicator status modifier definitions applied by the USFWS in 1988, a positive (+) sign following an indicator indicated an occurrence toward the wetter end of a category. A negative (‐) sign following an indicator indicated an occurrence toward the drier end of a category. These modifiers are no longer officially applied to indicator statuses, but are sometimes used in detailed floristic quality assessments or to compare the flora of select sites with greater precision.

Wetland Delineation Report 3 NRG Energy Norwalk Generating Station Norwalk, Fairfield County, Connecticut
For consistency, scientific names for plants not included on the NWPL, i.e. plants not found in wetlands in the United States, were those accepted by the Integrated Taxonomic Information System (www.itis.gov).
As shown on the wetland determination data forms in Appendix C, hydrophytic vegetation communities were determined to be present when 1) all of the dominant species were FACW and/or OBL (Rapid Test for Hydrophytic Vegetation), 2) greater than 50 percent of the dominant species’ indicator statuses were FAC, FACW, or OBL (Dominance Test), and/or 3) when the calculated prevalence indices were equal to or less than 3.0.
Dominant plants are those species that when totaled comprise the first 50 percent of their vegetation stratum, as well as those individual species that comprise 20 percent of their vegetation stratum. This concept is termed the “50‐20 Rule.”
2.2 NON‐TIDAL WETLAND AND WATERCOURSE METHODOLOGY
In Connecticut, freshwater, non‐tidal wetlands include:
…land, including submerged land, not regulated pursuant to Chapter 440, Sections 22a‐28 to 22a‐35, inclusive, which consists of any of the soil types designated as poorly drained, very poorly drained, alluvial, and floodplain by the National Cooperative Soils Survey, as may be amended from time to time, of the Natural Resources Conservation Service of the United States Department of Agriculture.
In addition, "watercourses" means “rivers, streams, brooks, waterways, lakes, ponds, marshes, swamps, bogs and all other bodies of water, natural or artificial, vernal or intermittent, public or private, which are contained within, flow through or border upon this state or any portion thereof, not regulated pursuant to sections 22a‐28 to 22a‐35, inclusive.”
The inland freshwater wetland delineation was conducted by a CB&I scientist who meets the federal requirements for acceptance as a soil scientist, per Section 22a‐38 of the Connecticut Inland Wetlands and Watercourses Act.
2.2.1 HYDRIC SOILS METHODOLOGY
In inland freshwater wetlands, test pits were opened with an AMS Sharpshooter shovel with an 18 inch blade to obtain undisturbed samples of the upper soil horizons. Hydric soils indicators defined in the Corps of Engineers Wetlands Delineation Manual (Waterways Experiment Station, 1987) (the Manual), the Regional Supplement to the Corps of Engineers Wetland Delineation Manual: Northcentral and Northeast Region (Version 2.0) (USACE, 2011) (the Supplement), and in Field Indicators of Hydric Soils in the United States, Version 7.0 (USDA‐NRCS, 2010) were used to determine the presence of characteristic soil morphologies resulting from prolonged saturation and/or inundation. Per Land Resource Regions and Major Land Resource Areas of the United States, the Caribbean, and the Pacific Basin (USDA‐NRCS, 2006), hydric soil indicators for Major Land Resource Area 144A (“New England and Eastern New York Upland, Southern Part”) of Land Resource Region R (“Northeastern Forage and Forest Region”) are applicable for the site.
Munsell® Soil Color Charts (GretagMacbeth, 2000) were used to assign standard notations to the samples. All of the soil samples were moist, or moistened prior to analysis in order to assure accurate color readings.
Wetland Delineation Report 4 NRG Energy Norwalk Generating Station Norwalk, Fairfield County, Connecticut
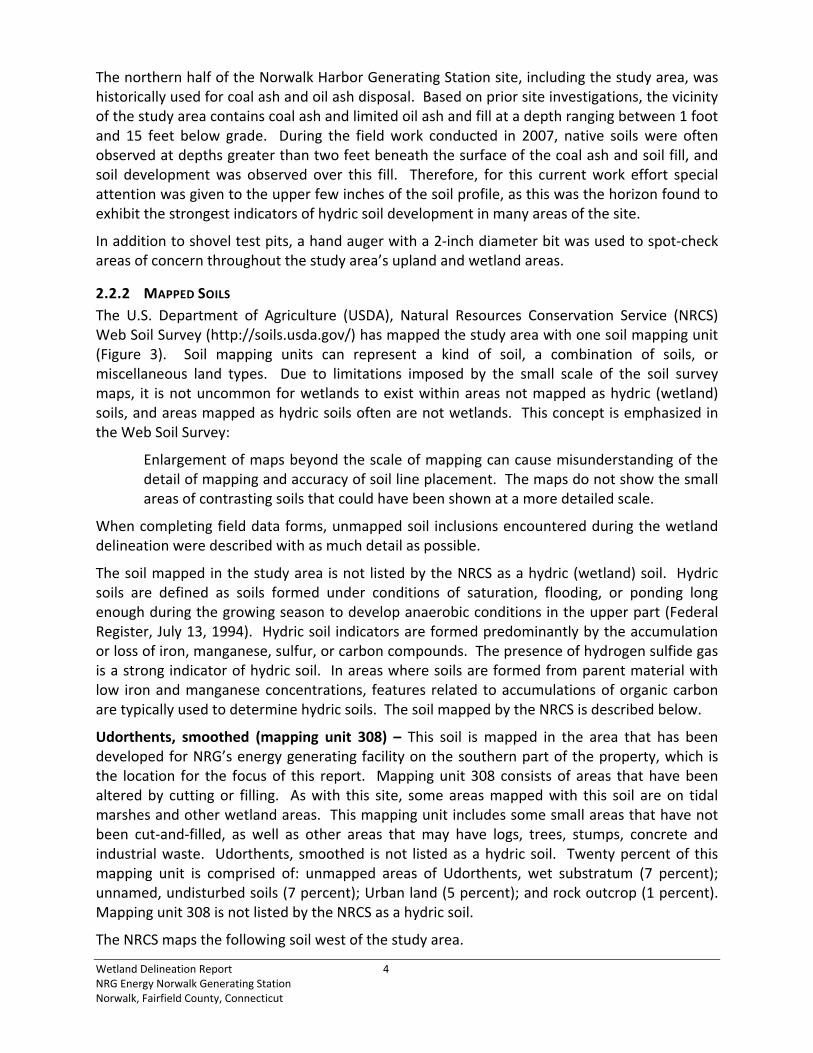
The northern half of the Norwalk Harbor Generating Station site, including the study area, was historically used for coal ash and oil ash disposal. Based on prior site investigations, the vicinity of the study area contains coal ash and limited oil ash and fill at a depth ranging between 1 foot and 15 feet below grade. During the field work conducted in 2007, native soils were often observed at depths greater than two feet beneath the surface of the coal ash and soil fill, and soil development was observed over this fill. Therefore, for this current work effort special attention was given to the upper few inches of the soil profile, as this was the horizon found to exhibit the strongest indicators of hydric soil development in many areas of the site.
In addition to shovel test pits, a hand auger with a 2‐inch diameter bit was used to spot‐check areas of concern throughout the study area’s upland and wetland areas.
2.2.2 MAPPED SOILS
The U.S. Department of Agriculture (USDA), Natural Resources Conservation Service (NRCS) Web Soil Survey (http://soils.usda.gov/) has mapped the study area with one soil mapping unit (Figure 3). Soil mapping units can represent a kind of soil, a combination of soils, or miscellaneous land types. Due to limitations imposed by the small scale of the soil survey maps, it is not uncommon for wetlands to exist within areas not mapped as hydric (wetland) soils, and areas mapped as hydric soils often are not wetlands. This concept is emphasized in the Web Soil Survey:
Enlargement of maps beyond the scale of mapping can cause misunderstanding of the detail of mapping and accuracy of soil line placement. The maps do not show the small areas of contrasting soils that could have been shown at a more detailed scale.
When completing field data forms, unmapped soil inclusions encountered during the wetland delineation were described with as much detail as possible.
The soil mapped in the study area is not listed by the NRCS as a hydric (wetland) soil. Hydric soils are defined as soils formed under conditions of saturation, flooding, or ponding long enough during the growing season to develop anaerobic conditions in the upper part (Federal Register, July 13, 1994). Hydric soil indicators are formed predominantly by the accumulation or loss of iron, manganese, sulfur, or carbon compounds. The presence of hydrogen sulfide gas is a strong indicator of hydric soil. In areas where soils are formed from parent material with low iron and manganese concentrations, features related to accumulations of organic carbon are typically used to determine hydric soils. The soil mapped by the NRCS is described below.
Udorthents, smoothed (mapping unit 308) – This soil is mapped in the area that has been developed for NRG’s energy generating facility on the southern part of the property, which is the location for the focus of this report. Mapping unit 308 consists of areas that have been altered by cutting or filling. As with this site, some areas mapped with this soil are on tidal marshes and other wetland areas. This mapping unit includes some small areas that have not been cut‐and‐filled, as well as other areas that may have logs, trees, stumps, concrete and industrial waste. Udorthents, smoothed is not listed as a hydric soil. Twenty percent of this mapping unit is comprised of: unmapped areas of Udorthents, wet substratum (7 percent); unnamed, undisturbed soils (7 percent); Urban land (5 percent); and rock outcrop (1 percent). Mapping unit 308 is not listed by the NRCS as a hydric soil.
The NRCS maps the following soil west of the study area.

Wetland Delineation Report 5 NRG Energy Norwalk Generating Station Norwalk, Fairfield County, Connecticut
Westbrook mucky peat, 0 to 2 percent slopes, very frequently flooded (mapping unit 98) – This soil is mapped in the tidal marsh west of the study area, separated in part from the study area by Manresa Island Road. This is a nearly level, very poorly drained soil of marshes and estuaries that are subject to tidal inundation. Included with this soil in mapping, and comprising about 10 percent of it, are areas of Pawcatuck soils and Ipswich soils. This mapping unit is listed by the NRCS as a hydric soil.
2.3 ADDITIONAL DELINEATION METHODOLOGY
The wetland delineation was also performed per the Corps methodology including indicators of wetland hydrology.
2.3.1 U.S. ARMY CORPS OF ENGINEERS METHODOLOGY
In addition to CTDEEP regulations and regulatory guidance, the delineation methodology complied with the Corps 1987 Manual and 2011 Supplement. A three‐parameter approach to identify and delineate wetlands presented in the Manual and Supplement requires that except for atypical and disturbed situations wetlands possess hydrophytic vegetation, hydric soils, and wetland hydrology. As such, to ensure compliance with the Corps regulations, vegetation and hydrology were analyzed in inland freshwater wetlands, and soils and hydrology were analyzed in tidal wetlands. The wetlands were classified in accordance with The Classification of Wetlands and Deepwater Habitats of the United States (Cowardin, et al., 1979).
Wetland Determination Data Forms developed for the Supplement were completed at representative wetland and non‐wetland areas within the site and are presented in Appendix C.
2.3.2 WETLAND HYDROLOGY METHODOLOGY
Indicators of wetland hydrology for the Northcentral and Northeast Region are outlined in the Supplement. These include the 18 primary and 11 secondary indicators listed below in Table 2‐1.
Table 2‐1
Wetland Hydrology Indicators for the Northcentral and Northeast Region
Indicator Category
Primary Secondary
Group A – Observation of Surface Water or Saturated Soils
A1 – Surface water A2 – High water table A3 – Saturation Group B – Evidence of Recent Inundation
B1 – Water marks B2 – Sediment deposits B3 – Drift deposits

Wetland Delineation Report 6 NRG Energy Norwalk Generating Station Norwalk, Fairfield County, Connecticut
Table 2‐1
Wetland Hydrology Indicators for the Northcentral and Northeast Region
Indicator Category
Primary Secondary
B4 – Algal mat or crust B5 – Iron deposits B7 – Inundation visible on aerial imagery B8 – Sparsely vegetated concave surface B9 – Water‐stained leaves B13 – Aquatic fauna B15 – Marl deposits B6 – Surface soil cracks B10 – Drainage patterns B16 – Moss trim lines Group C – Evidence of Current or Recent Soil Saturation
C1 – Hydrogen sulfide odor C3 – Oxidized rhizospheres along living roots C4 – Presence of reduced iron C6 – Recent iron reduction in tilled soils C7 – Thin muck surface C2 – Dry‐season water table C8 – Crayfish burrows C9 – Saturation visible on aerial imagery Group D – Evidence from Other Site Conditions or Data
D1 – Stunted or stressed plants D2 – Geomorphic position D3 – Shallow aquitard D4 – Microtopographic relief D5 – FAC‐neutral test

Wetland Delineation Report 7 NRG Energy Norwalk Generating Station Norwalk, Fairfield County, Connecticut
3.0 SITE DRAINAGE
Wetland W4 drains northward to wetland W3 via a culvert beneath a packed gravel maintenance road. Subsequently, wetland W3 drains westward to wetland W5 via a culvert beneath a packed gravel monitoring well access road. The culverts between W3 and W4, and W3 and W5 appear obstructed by soil, leaves, and other debris, and it is likely that these hydrologic connections are limited. Wetland W5 is connected to wetland W6 via a fully functioning box culvert beneath Manresa Avenue, the main road of the Norwalk Harbor generating station. The tidal marsh that defines W6 contains a well‐developed tidal channel that opens via culvert to Long Island Sound.
Wetlands W3 and W4, and the northern part of W5 are not tidally influenced resources. The southern part of Wetland W5 is within tidal, estuarine habitat.
4.0 ADDITIONAL TASKS
As the proposed sediment remediation activities will require disturbance within federal and state jurisdictional wetlands, the Corps New England District has required that NRG undertake site investigations to determine the presence and extent of invasive plant species within the work areas, and to determine the impact that necessary access roads will likely pose to trees with a diameter‐at‐breast‐height (dbh) of 3.0 in. (7.6 cm) or greater. This information will be used for processing the permits required to conduct the remediation.
4.1 INVASIVE PLANT SPECIES
Invasive plants are non‐native plants that are disruptive in a way that causes environmental or economic harm, or harm to human health. In Connecticut, the Connecticut Invasive Plants Council (CIPC) has developed a list of non‐native plants that cause (or have the potential to cause) environmental harm in minimally‐managed areas (CIPC, 2016). The Connecticut General Statutes provided in §22a‐381a through §22a‐381d describe the criteria for listing a plant as an invasive species, as well as regulations developed to control them. The most recent list (2014) of Connecticut’s invasive plants is provided in Appendix D.
CB&I focused on the presence of invasive plants in the areas that will be disturbed by the sediment remediation pilot test though findings are generally applicable to the larger full scale sediment remediation area. Invasive species monitoring forms developed by New England Wetland Technologies, LLC were completed at the pilot test locations and their respective access routes. These forms provide information on the species present, growth stage, cover class, and their percent cover of the vegetation community.
CB&I applied standard USDA symbols for scientific names to the data forms. For example, the invasive grass Phragmites australis and the invasive shrub Elaeagnus umbellata are symbolized respectively “PHAU7” and “ELUM,” the accepted USDA symbols. The cover classes and growth stages used to represent the occurrence of invasive plants on field data forms are presented below in Table 4‐1.
Wetland Delineation Report 8 NRG Energy Norwalk Generating Station Norwalk, Fairfield County, Connecticut
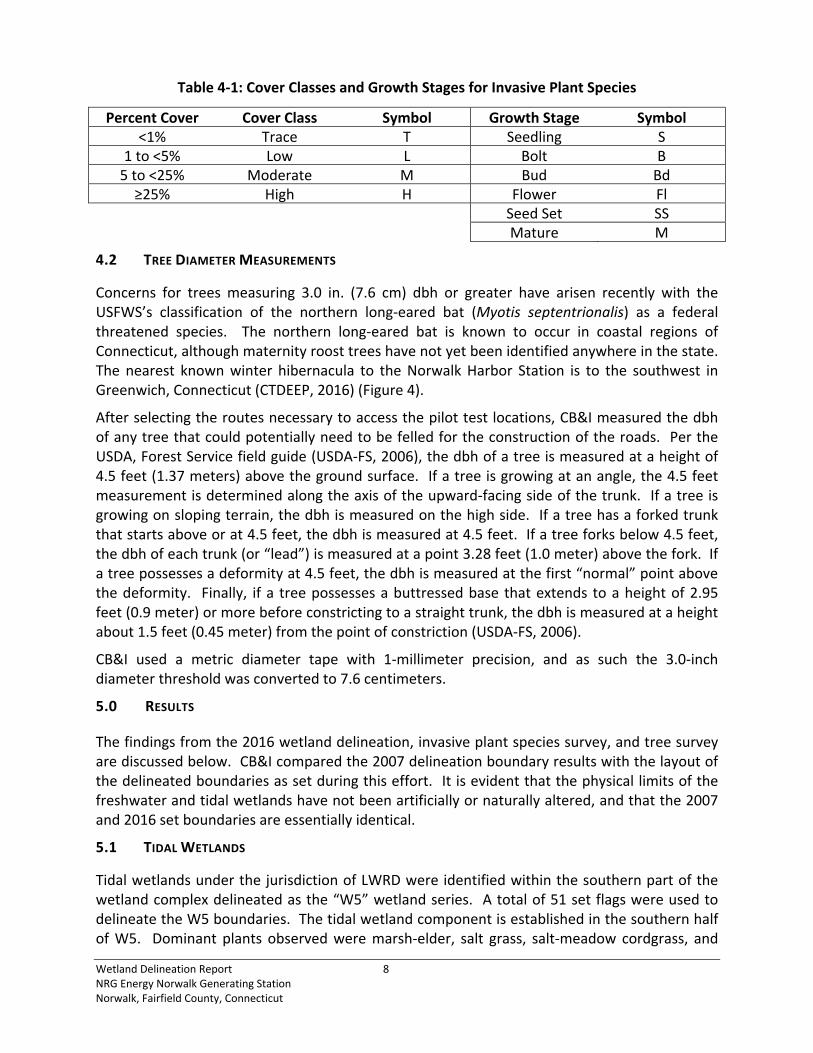
Table 4‐1: Cover Classes and Growth Stages for Invasive Plant Species
Percent Cover Cover Class Symbol Growth Stage Symbol<1% Trace T Seedling S
1 to <5% Low L Bolt B5 to <25% Moderate M Bud Bd≥25% High H Flower Fl
Seed Set SSMature M
4.2 TREE DIAMETER MEASUREMENTS
Concerns for trees measuring 3.0 in. (7.6 cm) dbh or greater have arisen recently with the USFWS’s classification of the northern long‐eared bat (Myotis septentrionalis) as a federal threatened species. The northern long‐eared bat is known to occur in coastal regions of Connecticut, although maternity roost trees have not yet been identified anywhere in the state. The nearest known winter hibernacula to the Norwalk Harbor Station is to the southwest in Greenwich, Connecticut (CTDEEP, 2016) (Figure 4).
After selecting the routes necessary to access the pilot test locations, CB&I measured the dbh of any tree that could potentially need to be felled for the construction of the roads. Per the USDA, Forest Service field guide (USDA‐FS, 2006), the dbh of a tree is measured at a height of 4.5 feet (1.37 meters) above the ground surface. If a tree is growing at an angle, the 4.5 feet measurement is determined along the axis of the upward‐facing side of the trunk. If a tree is growing on sloping terrain, the dbh is measured on the high side. If a tree has a forked trunk that starts above or at 4.5 feet, the dbh is measured at 4.5 feet. If a tree forks below 4.5 feet, the dbh of each trunk (or “lead”) is measured at a point 3.28 feet (1.0 meter) above the fork. If a tree possesses a deformity at 4.5 feet, the dbh is measured at the first “normal” point above the deformity. Finally, if a tree possesses a buttressed base that extends to a height of 2.95 feet (0.9 meter) or more before constricting to a straight trunk, the dbh is measured at a height about 1.5 feet (0.45 meter) from the point of constriction (USDA‐FS, 2006).
CB&I used a metric diameter tape with 1‐millimeter precision, and as such the 3.0‐inch diameter threshold was converted to 7.6 centimeters.
5.0 RESULTS
The findings from the 2016 wetland delineation, invasive plant species survey, and tree survey are discussed below. CB&I compared the 2007 delineation boundary results with the layout of the delineated boundaries as set during this effort. It is evident that the physical limits of the freshwater and tidal wetlands have not been artificially or naturally altered, and that the 2007 and 2016 set boundaries are essentially identical.
5.1 TIDAL WETLANDS
Tidal wetlands under the jurisdiction of LWRD were identified within the southern part of the wetland complex delineated as the “W5” wetland series. A total of 51 set flags were used to delineate the W5 boundaries. The tidal wetland component is established in the southern half of W5. Dominant plants observed were marsh‐elder, salt grass, salt‐meadow cordgrass, and

Wetland Delineation Report 9 NRG Energy Norwalk Generating Station Norwalk, Fairfield County, Connecticut
common reed. Associated species were saltmarsh fleabane, slender glasswort, saltmarsh cordgrass, and sea lavender. The upper reaches of the tidal wetland supported northern bayberry, gray birch, red maple, and switch‐grass. Most of the observed common reed plants in the main body of the tidal wetland were stunted specimens reaching a height of approximately four feet, while those growing in the upper reaches were often twice that height or more.
Per Cowardin et al. (1979), the tidal wetlands were classified as a mix of “Estuarine intertidal emergent (E2EM)” and Estuarine intertidal scrub/shrub (E2SS)” resources.
The pilot test plot identified near WSD‐4 is within the area of lowest elevation within the tidal marsh.
5.2 INLAND FRESHWATER WETLANDS
Wetlands W3 and W4, and the northern part of wetland W5 support inland freshwater wetlands. Wetland W3 was delineated with 17 set flags, and W4 was delineated with 24 set flags. The wetlands each have a forested component, with the dominant tree, by far, being gray birch. These forested wetlands were classed as “Palustrine Forested broad‐leaved Deciduous (PFO1)” wetlands. Other trees in the canopy were red maple, goat willow, and eastern cottonwood. The shrub layer of the freshwater wetlands was strongly dominated by northern bayberry. Other shrubs were seaside rose, autumn olive, and small specimens of goat willow. Woody vines identified in the wetlands were riverbank grape, Asiatic bittersweet, poison ivy, and Virginia creeper. Portions of wetland W4 were dominated by northern bayberry, forming wetland areas classed as “Palustrine Scrub/Shrub Broad‐leaved Deciduous (PSS1)” wetlands.
The north‐central part of wetland W5, the interior of W3, and most of W4 were classed as “Palustrine Emergent Phragmites australis (PEM5)” wetlands dominated by common reed. The colony established within W4 is extremely dense and approximately 12 feet tall. This colony incorporates the entire area selected for the pilot test plot centered on historic sediment sampling location WSD‐6.
Although inland freshwater wetlands in Connecticut are primarily identified by soils analyses, the disturbed soils within most of the study area dictated that a focus on vegetation and hydrology be incorporated into the decision making process. While hydric soil indicators were present throughout the freshwater wetlands, these indicators were often poorly developed and restricted to the upper few inches of the soil profile. Coal ash was present throughout the study area as a dominant component of the soils.
Freshwater wetlands, including the freshwater wetland component of wetland W5, were typically distinctly defined by a sharp topographic break along their perimeter.
5.3 INVASIVE PLANT SPECIES
As previously stated, common reed is a major component of both the freshwater and tidal wetland flora within the study area. Other Connecticut‐listed invasive plant species identified in the vicinity of the work area were tree‐of‐heaven, seaside rose, wine‐berry, autumn olive, Asiatic bittersweet, Morrow’s honeysuckle, Japanese barberry, and Japanese stilt‐grass. Non‐

Wetland Delineation Report 10 NRG Energy Norwalk Generating Station Norwalk, Fairfield County, Connecticut
native species that are not officially listed as invasive plant species were observed including white mulberry, goat willow, nodding thistle, butter‐and‐eggs, and common mullein.
CB&I completed invasive species monitoring forms at each of the pilot test locations, as well as at the most suitable locations for machinery to access the wetlands from the proposed access routes. These forms, developed by New England Wetland Technologies, LLC, are included in Appendix E.
5.4 TREES
Access to the general vicinity of the work area is gained through a gated, packed gravel road that runs generally eastward from its intersection with Manresa Island Road. After passing eastward between wetlands W3 and W4, the road turns sharply to the south to another locked gate. This facility‐maintained road provides unobstructed access to the southern end of wetland W5, the southern side of wetland W3, and the northern and eastern sides of wetland W4. The felling of trees along this road will not be necessary in order to bring work‐related machinery into the work area or to access the pilot test plot in wetland W4. Another packed gravel access road runs a short distance northward from the main access road to two groundwater monitoring wells, NH‐8D and NH‐8S, located between wetlands W3 and W5.
After passing the monitoring wells and moving northward, the road is less defined and becomes essentially a narrow walking path. The path leads to a segment along the boundary of wetland W5 with good access to the sediment remediation pilot test plot (i.e., historic sediment sampling location WSD‐4). Along the monitoring well access road and path, CB&I identified a combined 23 gray birch (Betula populifolia) trees with dbh measurements greater than 3 in. (7.6 cm). The dbh measurements are presented below in Table 5‐1. No other species of tree was identified along the access road and path to the wetland W5 pilot test plot.
Table 5‐1: Diameter at Breast Height of Gray Birch Trees Along the Proposed Access Route to Wetland W5 Pilot Test Plot
Centimeters Inches Centimeters Inches Centimeters Inches
7.9 3.1 10.6 4.2 13.7 5.4
8.0 3.1 10.7 4.2 14.7 5.8
8.3 3.3 11.2 4.4 16.2 6.4
8.8 3.5 11.2 4.4 16.3 6.4
10.0 3.9 11.9 4.7 17.5 6.9
10.3 4.1 12.1 4.8 18.9 7.4
10.5 4.1 12.5 4.9 24.4 9.6
10.5 4.1 13.0 5.1
Average Inches Centimeters
5.0 12.6
As is evident above in Table 5‐1, large trees are not present along the proposed access route to the wetland W5 pilot test plot, with the largest specimen measured at 9.6 in. (24.4 cm) dbh. Fifteen of the trees were less than 5.0 in. dbh. Therefore, access to the sediment remediation

Wetland Delineation Report 11 NRG Energy Norwalk Generating Station Norwalk, Fairfield County, Connecticut
pilot test plot in wetland W5 located within the tidal portion of wetland W5 will necessitate the felling of small gray birch trees, with the maximum number of felled trees being 23. It is likely that the access route can meander around most of the trees and that not all of the 23 trees with dbh measurements of ≥ 3.0 in. (7.6 cm) would need to be felled for machinery access. It is anticipated that similar type and sizes of trees may need to be removed for the full scale sediment remediation.
6.0 CONCLUSIONS
Inland freshwater wetlands and a tidal wetland were identified in the vicinity of NRG’s sediment remediation pilot test program work area. Wetlands identified and delineated for this project were W3 (17 set flags), W4 (24 set flags), and W5 (51 set flags). The 2007 and 2016 set boundaries for wetlands W3, W4, and W5 are essentially identical.
The pilot test plot within wetland W4 is within a dense colony of common reed, a Connecticut‐listed invasive plant species that forms a wetland classed as PEM5. Access to the sediment remediation pilot test plot in wetland W4 will necessitate impacts to the PEM5 wetlands. A small portion of PSS1 wetland is present at the selected access point to wetland W4, and as such trees would not need to be felled for the work within wetland W4.
The pilot test plot within wetland W5 is within tidal wetland habitat classed as E2EM, per Cowardin et al. (1979). Access to the sediment remediation pilot test plot in wetland W5 located within the tidal portion of wetland W5 may necessitate the felling of a select few small gray birch trees. It is likely that the access route can meander around most of the trees and that not all of the 23 trees with dbh measurements of ≥ 3.0 in. (7.6 cm) would need to be felled for machinery access.

Wetland Delineation Report 12 NRG Energy Norwalk Generating Station Norwalk, Fairfield County, Connecticut
7.0 REFERENCES
Connecticut Department of Energy and Environmental Protection. 2016. Map: Northern long‐eared Bat Areas of Concern in Connecticut, to Assist with Federal Endangered Species Act Compliance. February.
Connecticut Invasive Plants Council – Invasive Plant Working Group. http://cipwg.uconn.edu/ipc/. Accessed August 29, 2016.
Cowardin, L.M., V. Carter, F.C. Golet, and E.T. LaRoe. 1979. The Classification of Wetlands and Deepwater Habitats of the United States. U.S. Fish and Wildlife Service, Washington, D.C. FWS/OBS‐79/31.
Crow, Garrett E. and C. Barre Hellquist. 2000. Aquatic and Wetland Plants of Northeastern North America. Volume 1: Pteridophytes, Gymnosperms, and Angiosperms: Dicotyledons. The University of Wisconsin Press. Madison, WI.
Crow, Garrett E. and C. Barre Hellquist. 2000. Aquatic and Wetland Plants of Northeastern North America. Volume 2: Angiosperms: Monocotyledons. The University of Wisconsin Press. Madison, WI.
Fernald, Merritt Lyndon. 1950. Gray’s Manual of Botany. Dioscorides Press. Portland, OR.
GretagMacbeth. 2000. Munsell Soil Color Charts. New Windsor, NY.
Haines, Arthur. 2011. Flora Novae Angliae. Yale University Press. New Haven and London.
Harlow, William M. 1957. Trees of the Eastern and Central United States and Canada. Dover Publications, Inc. New York, NY.
Hitchcock, A.S. 1971. Manual of the Grasses of the United States. Dover Publications, Inc. New York, NY.
Holmgren, Noel H. 1998. Illustrated Companion to Gleason and Cronquist’s Manual: Illustrations of the Vascular Plants of Northeastern United States and Adjacent Canada. The New York Botanical Garden. Bronx, NY.
Integrated Taxonomic Information System. 2015. http://www.itis.gov/
Lichvar, R.W., D.L. Banks, W.N. Kirchner, and N.C. Melvin. 2016. The National Wetland Plant List: 2016 wetland ratings. Phytoneuron 2016‐30: 1‐17. Published 28 April 2016. ISSN 2153 733X. Available at: http://www.phytoneuron.net/
Magee, Dennis W. and Harry E. Ahles. 1999. Flora of the Northeast. University of Massachusetts Press. Amherst, MA.
Newcomb, Lawrence. 1977. Newcomb’s Wildflower Guide. Little, Brown and Company, Inc. Boston, MA.
Rhoads, Ann Fowler, and Timothy A. Block. 2000. The Plants of Pennsylvania: An Illustrated Manual. University of Pennsylvania Press. Philadelphia, PA.
Shaw Environmental & Infrastructure, Inc., 2007. Wetland Delineation Report, NRG Norwalk Harbor Generating Station, South Norwalk, Fairfield County, Connecticut. November 2007.

Wetland Delineation Report 13 NRG Energy Norwalk Generating Station Norwalk, Fairfield County, Connecticut
U.S. Army Corps of Engineers. 2011. Regional Supplement to the Corps of Engineers Wetland Delineation Manual: Atlantic and Gulf Coastal Plain Region (Version 2.0), ed. J.S. Wakely, R.W. Lichvar, and C.V. Noble. ERDC/EL TR‐10‐20. Vicksburg, MS: U.S. Army Engineer Research and Development Center.
U.S. Department of Agriculture, Forest Service. 2006. Forest Inventory and Analysis National Core Field Guide; Volume 1: Field Collection Procedures for Phase 2 Plots (Version 3.1). October.
U.S. Department of Agriculture, Natural Resources Conservation Service. 2016. Web Soil Survey. http://websoilsurvey.sc.egov.usda.gov/App/HomePage.htm
U.S. Department of Agriculture. PLANTS Database. 2016. http://plants.usda.gov
U.S. Department of the Interior, Geological Survey. 2014. Norwalk south Quadrangle, Connecticut‐New York. 7.5 Minute Series (Topographic).
Uva, Richard H., Joseph C. Neal, and Joseph M. DiTomaso. 1997. Weeds of the Northeast. Cornell University Press. Ithaca, NY.

APPENDIX A
FIGURES

OF
FIC
ED
RA
WIN
GN
UM
BE
R6
3121
4871
-A1
DA
TE
DE
SIG
NE
D B
YD
RA
WN
BY
CH
EC
KE
D B
YA
PP
RO
VE
D B
Y
NORWALK HARBOR GENERATING STATIONSOUTH NORWALK, CONNECTICUT
SITE LOCATION PLAN
Norwalk Power LLCManresa Island Avenue
South Norwalk, Connecticut
FIGURE 1
CB&I Environmental & Infrastructure, Inc.150 Royall Street
Canton, Massachusetts
SITE
41°04'35.30"-73°24'42.87"E. 817500.78N. 589289.26

6312
1798
8-D
1D
RA
WIN
GN
UM
BE
RO
FF
ICE
AOC-6 I.C.U. AOC-11LONG ISLAND SOUND
SEDIMENT (BOUNDARIESNOT ILLUSTRATED)
AOC-7EXISTING SEPTIC LEACH
FIELD
AOC-12 CONTAINERSTORAGE AREA
AOC-8FORMER SEPTIC LEACH
FIELD
AOC-5FORMER FUEL
OIL USTSAOC-9ELECTRICALEQUIPMENT
AOC-2 FORMER GASOLINE UST
AOC-3FUEL OIL TANK FARM
AOC-10 FORMER RCRA
IMPOUNDMENT
AOC-1FORMER ASH DISPOSAL
AREA
Norwalk Power LLCManresa Island Avenue
South Norwalk, Connecticut
SITE PLAN WITHWETLAND DELINEATION SURVEY
NORWALK HARBOR GENERATING STATIONSOUTH NORWALK, CONNECTICUT
CB&I Environmental & Infrastructure, Inc.150 Royall Street
Canton, Massachusetts
AOC-4FORMER COAL STORAGE
AREA

Hydric Rating by Map Unit—State of Connecticut
Natural ResourcesConservation Service
Web Soil SurveyNational Cooperative Soil Survey
9/1/2016Page 1 of 5
4548
150
4548
220
4548
290
4548
360
4548
430
4548
500
4548
570
4548
640
4548
710
4548
150
4548
220
4548
290
4548
360
4548
430
4548
500
4548
570
4548
640
4548
710
633250 633320 633390 633460 633530 633600 633670
633250 633320 633390 633460 633530 633600 633670
41° 4' 44'' N73
° 2
4' 5
0'' W
41° 4' 44'' N
73° 2
4' 3
0'' W
41° 4' 24'' N
73° 2
4' 5
0'' W
41° 4' 24'' N
73° 2
4' 3
0'' W
N
Map projection: Web Mercator Corner coordinates: WGS84 Edge tics: UTM Zone 18N WGS840 100 200 400 600
Feet0 45 90 180 270
MetersMap Scale: 1:3,050 if printed on A portrait (8.5" x 11") sheet.

MAP LEGEND MAP INFORMATION
Area of Interest (AOI)Area of Interest (AOI)
SoilsSoil Rating Polygons
Hydric (100%)
Hydric (66 to 99%)
Hydric (33 to 65%)
Hydric (1 to 32%)
Not Hydric (0%)
Not rated or not available
Soil Rating LinesHydric (100%)
Hydric (66 to 99%)
Hydric (33 to 65%)
Hydric (1 to 32%)
Not Hydric (0%)
Not rated or not available
Soil Rating PointsHydric (100%)
Hydric (66 to 99%)
Hydric (33 to 65%)
Hydric (1 to 32%)
Not Hydric (0%)
Not rated or not available
Water FeaturesStreams and Canals
TransportationRails
Interstate Highways
US Routes
Major Roads
Local Roads
BackgroundAerial Photography
The soil surveys that comprise your AOI were mapped at 1:12,000.
Warning: Soil Map may not be valid at this scale.
Enlargement of maps beyond the scale of mapping can causemisunderstanding of the detail of mapping and accuracy of soil lineplacement. The maps do not show the small areas of contrastingsoils that could have been shown at a more detailed scale.
Please rely on the bar scale on each map sheet for mapmeasurements.
Source of Map: Natural Resources Conservation ServiceWeb Soil Survey URL: http://websoilsurvey.nrcs.usda.govCoordinate System: Web Mercator (EPSG:3857)
Maps from the Web Soil Survey are based on the Web Mercatorprojection, which preserves direction and shape but distortsdistance and area. A projection that preserves area, such as theAlbers equal-area conic projection, should be used if more accuratecalculations of distance or area are required.
This product is generated from the USDA-NRCS certified data as ofthe version date(s) listed below.
Soil Survey Area: State of ConnecticutSurvey Area Data: Version 14, Sep 22, 2015
Soil map units are labeled (as space allows) for map scales 1:50,000or larger.
Date(s) aerial images were photographed: Jul 21, 2014—Aug 27,2014
The orthophoto or other base map on which the soil lines werecompiled and digitized probably differs from the backgroundimagery displayed on these maps. As a result, some minor shiftingof map unit boundaries may be evident.
Hydric Rating by Map Unit—State of Connecticut
Natural ResourcesConservation Service
Web Soil SurveyNational Cooperative Soil Survey
9/1/2016Page 2 of 5

Hydric Rating by Map Unit
Hydric Rating by Map Unit— Summary by Map Unit — State of Connecticut (CT600)
Map unit symbol Map unit name Rating Acres in AOI Percent of AOI
98 Westbrook mucky peat,0 to 2 percent slopes,very frequently flooded
100 3.1 8.1%
306 Udorthents-Urban landcomplex
0 3.9 10.2%
308 Udorthents, smoothed 0 29.7 77.1%
W Water 0 1.7 4.5%
Totals for Area of Interest 38.5 100.0%
Hydric Rating by Map Unit—State of Connecticut
Natural ResourcesConservation Service
Web Soil SurveyNational Cooperative Soil Survey
9/1/2016Page 3 of 5

Description
This rating indicates the percentage of map units that meets the criteria for hydricsoils. Map units are composed of one or more map unit components or soil types,each of which is rated as hydric soil or not hydric. Map units that are made updominantly of hydric soils may have small areas of minor nonhydric components inthe higher positions on the landform, and map units that are made up dominantlyof nonhydric soils may have small areas of minor hydric components in the lowerpositions on the landform. Each map unit is rated based on its respectivecomponents and the percentage of each component within the map unit.
The thematic map is color coded based on the composition of hydric components.The five color classes are separated as 100 percent hydric components, 66 to 99percent hydric components, 33 to 65 percent hydric components, 1 to 32 percenthydric components, and less than one percent hydric components.
In Web Soil Survey, the Summary by Map Unit table that is displayed below themap pane contains a column named 'Rating'. In this column the percentage of eachmap unit that is classified as hydric is displayed.
Hydric soils are defined by the National Technical Committee for Hydric Soils(NTCHS) as soils that formed under conditions of saturation, flooding, or pondinglong enough during the growing season to develop anaerobic conditions in theupper part (Federal Register, 1994). Under natural conditions, these soils are eithersaturated or inundated long enough during the growing season to support thegrowth and reproduction of hydrophytic vegetation.
The NTCHS definition identifies general soil properties that are associated withwetness. In order to determine whether a specific soil is a hydric soil or nonhydricsoil, however, more specific information, such as information about the depth andduration of the water table, is needed. Thus, criteria that identify those estimatedsoil properties unique to hydric soils have been established (Federal Register,2002). These criteria are used to identify map unit components that normally areassociated with wetlands. The criteria used are selected estimated soil propertiesthat are described in "Soil Taxonomy" (Soil Survey Staff, 1999) and "Keys to SoilTaxonomy" (Soil Survey Staff, 2006) and in the "Soil Survey Manual" (Soil SurveyDivision Staff, 1993).
If soils are wet enough for a long enough period of time to be considered hydric,they should exhibit certain properties that can be easily observed in the field. Thesevisible properties are indicators of hydric soils. The indicators used to make onsitedeterminations of hydric soils are specified in "Field Indicators of Hydric Soils in theUnited States" (Hurt and Vasilas, 2006).
References:
Federal Register. July 13, 1994. Changes in hydric soils of the United States.
Federal Register. September 18, 2002. Hydric soils of the United States.
Hurt, G.W., and L.M. Vasilas, editors. Version 6.0, 2006. Field indicators of hydricsoils in the United States.
Hydric Rating by Map Unit—State of Connecticut
Natural ResourcesConservation Service
Web Soil SurveyNational Cooperative Soil Survey
9/1/2016Page 4 of 5

Soil Survey Division Staff. 1993. Soil survey manual. Soil Conservation Service.U.S. Department of Agriculture Handbook 18.
Soil Survey Staff. 1999. Soil taxonomy: A basic system of soil classification formaking and interpreting soil surveys. 2nd edition. Natural Resources ConservationService. U.S. Department of Agriculture Handbook 436.
Soil Survey Staff. 2006. Keys to soil taxonomy. 10th edition. U.S. Department ofAgriculture, Natural Resources Conservation Service.
Rating Options
Aggregation Method: Percent Present
Component Percent Cutoff: None Specified
Tie-break Rule: Lower
Hydric Rating by Map Unit—State of Connecticut
Natural ResourcesConservation Service
Web Soil SurveyNational Cooperative Soil Survey
9/1/2016Page 5 of 5

Andover
Ansonia
Ashford
Avon
Barkhamsted
BeaconFalls
Berlin
BethanyBethel
Bethlehem
Bloomfield
Bolton
Bozrah
Branford
Bridgeport
Bridgewater
Bristol
Brookfield
BrooklynBurlington
Canaan
Canterbury
Canton
Chaplin
Cheshire
Chester
Clinton
Colchester
Colebrook
Columbia
Cornwall
Coventry
Cromwell
Danbury
Darien
DeepRiver
Derby
Durham
Eastford
EastGranby
EastHaddam
EastHampton
EastHartford
EastHaven
EastLyme
Easton
EastWindsor
Ellington
Enfield
Essex
Fairfield
Farmington
Franklin
Glastonbury
Goshen
Granby
Greenwich
Griswold
Groton
Guilford
HaddamHamden
HamptonHartford
Hartland
Harwinton
Hebron
Kent
Killingly
Killingworth
Lebanon
Ledyard
Lisbon
Litchfield
Lyme
Madison
Manchester Mansfield
Marlborough
MeridenMiddlebury MiddlefieldMiddletown
Milford
Monroe
Montville
Morris
Naugatuck
NewBritain
NewCanaan
NewFairfield
NewHartford
NewHaven
Newington
NewLondon
NewMilford
Newtown
Norfolk
NorthBranford
NorthCanaan
NorthHaven
NorthStonington
Norwalk
Norwich
OldLymeOld
SaybrookOrange
Oxford
PlainfieldPlainville
Plymouth
Pomfret
Portland
PrestonProspect
Putnam
ReddingRidgefield
RockyHill
Roxbury
Salem
Salisbury
Scotland
Seymour
Sharon
Shelton
Sherman
Simsbury
Somers
Southbury
Southington
SouthWindsor
Sprague
Stafford
Stamford
Sterling
Stonington
Stratford
Suffield
Thomaston
Thompson
TollandTorrington
Trumbull
Union
Vernon
Voluntown
Wallingford
Warren
Washington
Waterbury
Waterford
Watertown
Westbrook
WestHartford
WestHavenWeston
Westport
Wethersfield
Willington
Wilton
Winchester
Windham
Windsor
WindsorLocks
Wolcott
Woodbridge
Woodbury
WoodstockF
Northern long-eared bat areas of concern in Connecticutto assist with Federal Endangered Species Act Compliance
February 1, 2016
Areas with known northern long-eared bat hibernacula*At this time there are no known northern long-eared bat maternity roost trees
For information on federal requirements visit http://www.fws.gov/midwest/endangered/mammals/nleb/

APPENDIX B
PHOTOGRAPHS

Photographs
Site: Date:
Municipality: County:
Photographer:
Direction:
Caption:
Direction:
Caption:
Photograph:
Photograph:
NRG Norwalk Harbor Generating Station August 31, 2016
ConnecticutCity of Norwalk
A. Froonjian
North
View of sediment remediation pilot test plot WSD-4 within the tidal portion of wetland W5. Forest in the distance represents the freshwater component of the wetland.
A. Froonjian
East
View from plot WSD-4 in Wetland W5 along the temporary access route and toward the proposed upland access point for the sediment remediation work.
1
1
2
State:Fairfield
Photographer:

Photographs
Site: Date:
Municipality: County:
Photographer:
Direction:
Caption:
Direction:
Caption:
Photograph:
Photograph:
NRG Norwalk Harbor Generating Station August 31, 2016
ConnecticutCity of Norwalk
A. Froonjian
West
View from the proposed upland access point at the edge of Wetland W5 toward sediment remediation pilot test plot WSD-4.
A. Froonjian
South
View of upland access road to Wetland W5 (Wetland W3 to left, Wetland W5 to right, and Wetland W4 in distance). Blue flagging on gray birch trees >3.0 in. dbh within proposed access.
2
3
4
State:Fairfield
Photographer:

Photographs
Site: Date:
Municipality: County:
Photographer:
Direction:
Caption:
Direction:
Caption:
Photograph:
Photograph:
NRG Norwalk Harbor Generating Station August 31, 2016
ConnecticutCity of Norwalk
A. Froonjian
North
View of upland access route to Wetland W5 (Wetland W5 to left and Wetland W3 to right).Monitoring well NH-8S is visible. Blue flagging on gray birch trees > 3.0 in. dbh within proposed access.
A. Froonjian
East
View along the existing upland access road for the sediment remediation work (Paved main road behind photographer, Wetland W4 to right, and Wetland W5 to left).
3
5
6
State:Fairfield
Photographer:

Photographs
Site: Date:
Municipality: County:
Photographer:
Direction:
Caption:
Direction:
Caption:
Photograph:
Photograph:
NRG Norwalk Harbor Generating Station August 31, 2016
ConnecticutCity of Norwalk
A. Froonjian
North
View of the proposed upland access point to Wetland W4. Trees are not present in this area.
A. Froonjian
South
Dense colony of common reed (Phragmites australis) at WSD-6 within Wetland W4.
4
7
8
State:Fairfield
Photographer:

Photographs
Site: Date:
Municipality: County:
Photographer:
Direction:
Caption:
Direction:
Caption:
Photograph:
Photograph:
NRG Norwalk Harbor Generating Station August 31, 2016
ConnecticutCity of Norwalk
A. Froonjian
East
Sampling point SP-4 within the western part of Wetland W3.
A. Froonjian
West
Sampling point SP-7 within upland habitat between Wetlands W3 and W4. SP-7 is within the existing facility-maintained access road. The gate at ManressaIsland Road is in the distance.
5
9
10
State:Fairfield
Photographer:

APPENDIX C
WETLAND DETERMINATION DATA FORMS

Project/Site: City/County: Sampling Date:
Applicant/Owner: State: Sampling Point:
Investigator(s): Section, Township, Range:
Landform (hillslope, terrace, etc.): Local Relief (concave, convex, none): Slope (%):
Subregion (LRR or MLRA): Lat: Long: Datum:
Soil Map Unit Name: NWI Classification:
Are climatic / hydrologic conditions on the site typical for this time of year? Yes No (If no, explain in Remarks)
Are Vegetation , Soil , or Hydrology significantly disturbed? Are "Normal Circumstances" present? Yes No
Are Vegetation , Soil , or Hydrology naturally probelmatic? (If needed, explain any answers in Remarks)
SUMMARY OF FINDINGS - Attach site map showing sampling point locations, transects, important features, etc.
Hydrophytic Vegetation Present? Yes No Is the Samples Area
Hydric Soils Present? Yes No within a Wetland? Yes No
Wetland Hydrology Present? Yes No If yes, optional Wetland Site ID:
Remarks: (Explain alternative procedures here or in a separate report.)
HYDROLOGYWetland Hydrology Indicators: Secondary Indicators (minimum of two required)
Primary Wetland Hydrology Indicators (minimum of one is required; list all that apply) Surface Soil Cracks (B6)
Surface Water (A1) Water-Stained Leaves (B9) Drainage Patterns (B10)
High Water Table (A2) Aquatic Fauna (B13) Moss Trim Lines (B16)
Saturation (A3) Marl Deposits (B15) Dry-Season Water Table (C2)
Water Marks (B1) Hydrogen Sulfide Odor (C1) Crayfish Burrows (C8)
Sediment Deposits (B2) Oxidized Rhizospheres on Living Roots (C3) Saturation Visible on Aerial Imagery (C9)
Drift Deposits (B3) Presence of Reduced Iron (C4) Stunted or Stressed Plants (D1)
Algal Mat or Crust (B4) Recent Iron Reduction in Tilled Soils (C6) Geomorphic Position (D2)
Iron Deposits (B5) Thin Muck Surface (C7) Shallow Aquitard (D3)
Inundation Visible on Aerial Imagery (B7) Other (Explain in Remarks) Microtopographic Relief (D4)
Sparsely Vegetated Concave Surface (B8) FAC-Neutral Test (D5)
Field Observations:
Surface Water Present? Yes No Depth (inches): (rising)
Water Table Present? Yes No Depth (inches):
Saturation Present? Yes No Depth (inches): Yes No
(includes capliary fringe)
Describe Recorded Data (stream gauge, monitoring well, aerial photos, previous inspections), if available:
Remarks:
Area has experienced an extended drought with above average temperatures.
Tidal wetland; incoming tide during assessment.
LRR R; MLRA 144A 589,092.24 ft. US North 817,574.23 ft. US East NAD 1983
Udorthents, smoothed (mapping unit 308) E2EM/SS1
Wetland W5 at soil pilot test plot WSD-4
Norwalk Harbor Generating Station Norwalk / Fairfield 8/31/2016
NRG Energy Connecticut SP-1
Anthony Froonjian
Marsh Concave 0
2
0
0 Wetland Hydrology Present?
WETLAND DETERMINATION DATA FORM – Northcentral and Northeast Region
US Army Corps of Engineers Northcentral and Northeast Region -- Version 2.0

VEGETATION - Use scientific names of plants. Sampling Point:
DominanceTest worksheet:
Tree Stratum (Plot size: ) Number of Dominant Species
1. That are OBL, FACW, or FAC (A)
2.
3. Total Number of Dominant
4. Species Across All Strata: (B)
5.
6. Percent of Dominant Species
7. That are OBL, FACW, or FAC (A/B)
=Total Cover 50% =
20% = Prevalence Index worksheet:
Sapling/Shrub Stratum (Plot size: ) Multiply by:
1. OBL species x 1 =
2. FACW species x 2 =
3. FAC species x 3 =
4. FACU species x 4 =
5. UPL species x 5 =
6. Column Totals
7. (A) (B)
=Total Cover 50% = Prevalence Index (B/A) =
20% = Hydrophytic Vegetation Indicators:
Herb Stratum (Plot size: ) 1 - Rapid Test for Hydrophytic Vegetation
1. 2 - Dominance Test is > 50%
2. 3 - Prevalence Index is ≤3.01
3. 4 -
4.
5. Problematic Hydrophytic Vegetation1 (Explain)
6.
7.
8.1Indicators of hydric soil and wetland hydrology must
9. be present, unless disturbed or problematic.
10. Definitions of Vegetation Strata:
11
12
=Total Cover 50% =
20% =
(Plot size: )
1.
2. Woody Vines - All woody vines greater than 3.28 feet in height.
3.
4.
=Total Cover 50% = HydrophyticVegetation Present?
20% = Yes No
Remarks: (Include photo numbers here or on a separate sheet.)
0
Absolute
% Cover
Dominant
Species? Indicator Status
xx
178.0
0.0
0.0
0.0
179.0
90.0
SP-1
0.0
2
2
0
1.0
45
18
65.0 Yes FACW
0.0
20.0 Yes FACW
1.0 No OBL
0
0
Morphological Adaptations1 (Provide supporting data
in Remarks or on a separate sheet)
Tree - Woody plants 3 inches (7.6 centimeters) or more in diameter at
breast height (DBH), regardless of height.
Sapling/Shrub - Woody plants less than 3 inches DBH and greater than
3.28 feet (1 meter) tall.
Herb - All herbaceous (non-woody) plants, regardless of size, and
woody plants less than 3.28 feet tall.
4.0 NO FACW
Woody Vine Stratum 30 ft.
90.0
0.0
5 ft.
30 ft.
30 ft.
89.0
Iva frutescens
0.0
1.0
0
0
100.0
Phragmites australis
Distichlis spicata
Salicornia depressa
0.0
Total % Cover of:
0.0
2.0
Spartina patens
US Army Corps of Engineers Northcentral and Northeast Region -- Version 2.0

Soil Sampling Point:
Profile Description: (Describe to the depth needed to document the indicator or confirm the absence of indicators.)
% %
1Type: C=Concentration, D=Depletion, RM=Reduced Matrix, CS = Covered or Coated Sand Grains 2Location: PL=Pore Lining, RC=Root Channel, M=Matrix
Hydric Soil Indicators: Indicators for Problematic Hydric Soils2:
Histosol (A1) Polyvalue Below Surface (S8) (LRR R, MLRA 149B) 2 cm Muck (A10) (LRR K, L, MLRA 149B)
Histic Epipedon (A2) Thin Dark Surface (S9) (LRR R, MLRA 149B) Coast Prairie Redox (A16) (LRR K, L, R)
Black Histic (A3) Loamy Mucky Mineral (F1) (LRR K, L) 5 cm Peat or Mucky Peat (S3) (LRR K, L, R)
Hydrogen Sulfide (A4) Loamy Gleyed Matrix (F2) Dark Surface (S7) (LRR K, L, M)
Stratified Layers (A5) Depleted Matrix (F3) Polyvalue Below Surface (S8) (LRR K, L)
Depleted Below Dark Surface (A11) Redox Dark Surface (F6) Thin Dark Surface (S9) (LRR K, L)
Thick Dark Surface (A12) Depleted Dark Surface (F7) Iron-Manganese Masses (F12) (LRR K, L, R)
Sandy Mucky Mineral (S1) Redox Depressions (F8) Piedmont Floodplain Soils (F19) (MLRA 149B)
Sandy Gleyed Matrix (S4) Mesic Spodic (TA6) (MLRA 144A, 145, 149B)
Sandy Redox (S5) Red Parent Material (F21)
Stripped Matrix (S6) Very Shallow Dark Surface (TF12)
Dark Surface (S7) (LRR R, MLRA 149B) Other (Explain in Remarks)
2Indicators of hydrophytic vegetation and wetland hydrology must be present, unless disturbed or problematic
Restrictive Layer (If observed):
Type:
Depth (inches): Hydric Soil Present? Yes No
Remarks:
Soils appear to be disturbed soils, similar to Westbrook soils mapped in the nearby marsh to the west.
Remarks
SP-1
Hemic
Sapric. Hydrogen
sulfide odor
Coal ash present
Muck
Mucky sand
Redox Features
Muck
(Inches) Color (moist) Color (moist) Type Location Texture
9-16 2.5Y 6/1 95 10YR 5/4 5 C M
4-9 N 2/0 100
0-4 7.5YR 2.5/1 100
Depth Matrix
US Army Corps of Engineers Northcentral and Northeast Region -- Version 2.0

Project/Site: City/County: Sampling Date:
Applicant/Owner: State: Sampling Point:
Investigator(s): Section, Township, Range:
Landform (hillslope, terrace, etc.): Local Relief (concave, convex, none): Slope (%):
Subregion (LRR or MLRA): Lat: Long: Datum:
Soil Map Unit Name: NWI Classification:
Are climatic / hydrologic conditions on the site typical for this time of year? Yes No (If no, explain in Remarks)
Are Vegetation , Soil , or Hydrology significantly disturbed? Are "Normal Circumstances" present? Yes No
Are Vegetation , Soil , or Hydrology naturally probelmatic? (If needed, explain any answers in Remarks)
SUMMARY OF FINDINGS - Attach site map showing sampling point locations, transects, important features, etc.
Hydrophytic Vegetation Present? Yes No Is the Samples Area
Hydric Soils Present? Yes No Not determined within a Wetland? Yes No
Wetland Hydrology Present? Yes No If yes, optional Wetland Site ID:
Remarks: (Explain alternative procedures here or in a separate report.)
HYDROLOGYWetland Hydrology Indicators: Secondary Indicators (minimum of two required)
Primary Wetland Hydrology Indicators (minimum of one is required; list all that apply) Surface Soil Cracks (B6)
Surface Water (A1) Water-Stained Leaves (B9) Drainage Patterns (B10)
High Water Table (A2) Aquatic Fauna (B13) Moss Trim Lines (B16)
Saturation (A3) Marl Deposits (B15) Dry-Season Water Table (C2)
Water Marks (B1) Hydrogen Sulfide Odor (C1) Crayfish Burrows (C8)
Sediment Deposits (B2) Oxidized Rhizospheres on Living Roots (C3) Saturation Visible on Aerial Imagery (C9)
Drift Deposits (B3) Presence of Reduced Iron (C4) Stunted or Stressed Plants (D1)
Algal Mat or Crust (B4) Recent Iron Reduction in Tilled Soils (C6) Geomorphic Position (D2)
Iron Deposits (B5) Thin Muck Surface (C7) Shallow Aquitard (D3)
Inundation Visible on Aerial Imagery (B7) Other (Explain in Remarks) Microtopographic Relief (D4)
Sparsely Vegetated Concave Surface (B8) FAC-Neutral Test (D5)
Field Observations:
Surface Water Present? Yes No Depth (inches):
Water Table Present? Yes No Depth (inches):
Saturation Present? Yes No Depth (inches): Yes No
(includes capliary fringe)
Describe Recorded Data (stream gauge, monitoring well, aerial photos, previous inspections), if available:
Remarks:
Wetland Hydrology Present?
This area is inundated by the high tides.
16
10
Near wetland flag W5-45
Area has experienced an extended drought with above average temperatures. Wetland W5 includes areas with deep deposits of coal ash. Natural soils are too deep to
analyze with standard delineation equipment.
Udorthents, smoothed (mapping unit 308) E2EM/SS1
Marsh concave 0
LRR R; MLRA 144A 589,086.77 ft. US North 817,684.24 ft. US East NAD 1983
WETLAND DETERMINATION DATA FORM – Northcentral and Northeast Region
Norwalk Harbor Generating Station Norwalk / Fairfield 8/31/2016
NRG Energy Connecticut SP-2
Anthony Froonjian
US Army Corps of Engineers Northcentral and Northeast Region -- Version 2.0

VEGETATION - Use scientific names of plants. Sampling Point:
DominanceTest worksheet:
Tree Stratum (Plot size: ) Number of Dominant Species
1. That are OBL, FACW, or FAC (A)
2.
3. Total Number of Dominant
4. Species Across All Strata: (B)
5.
6. Percent of Dominant Species
7. That are OBL, FACW, or FAC (A/B)
=Total Cover 50% =
20% = Prevalence Index worksheet:
Sapling/Shrub Stratum (Plot size: ) Multiply by:
1. OBL species x 1 =
2. FACW species x 2 =
3. FAC species x 3 =
4. FACU species x 4 =
5. UPL species x 5 =
6. Column Totals
7. (A) (B)
=Total Cover 50% = Prevalence Index (B/A) =
20% = Hydrophytic Vegetation Indicators:
Herb Stratum (Plot size: ) 1 - Rapid Test for Hydrophytic Vegetation
1. 2 - Dominance Test is > 50%
2. 3 - Prevalence Index is ≤3.01
3. 4 -
4.
5. Problematic Hydrophytic Vegetation1 (Explain)
6.
7.
8.1Indicators of hydric soil and wetland hydrology must
9. be present, unless disturbed or problematic.
10. Definitions of Vegetation Strata:
11
12
=Total Cover 50% =
20% =
(Plot size: )
1.
2. Woody Vines - All woody vines greater than 3.28 feet in height.
3.
4.
=Total Cover 50% = HydrophyticVegetation Present?
20% = Yes No
Remarks: (Include photo numbers here or on a separate sheet.)
0
0.0 0
Woody Vine Stratum 30 ft. Herb - All herbaceous (non-woody) plants, regardless of size, and
woody plants less than 3.28 feet tall.
Tree - Woody plants 3 inches (7.6 centimeters) or more in diameter at
breast height (DBH), regardless of height.
95.0 47.5 Sapling/Shrub - Woody plants less than 3 inches DBH and greater than
3.28 feet (1 meter) tall.19
Morphological Adaptations1 (Provide supporting data
in Remarks or on a separate sheet)Spartina patens 33.0 FACW Yes
Panicum virgatum 15.0 FAC No
Pluchea odorata 2.0 OBL No
3
5 ft.
Phragmites australis 45.0 FACW Yes
15.0 7.5 2.2
110.0 240.0
0.0 0.0
0.0 0.0
Betula populifolia 3.0 FAC Yes 22.0 66.0
2.0
Morella pensylvanica 4.0 FAC Yes 86.0 172.0
0
30 ft. Total % Cover of:
Iva frutescens 8.0 FACW Yes 2.0
100.0
0.0 0
5
5
SP-2
Absolute
% Cover
Dominant
Species? Indicator Status30 ft.
US Army Corps of Engineers Northcentral and Northeast Region -- Version 2.0

Soil Sampling Point:
Profile Description: (Describe to the depth needed to document the indicator or confirm the absence of indicators.)
% %
1Type: C=Concentration, D=Depletion, RM=Reduced Matrix, CS = Covered or Coated Sand Grains 2Location: PL=Pore Lining, RC=Root Channel, M=Matrix
Hydric Soil Indicators: Indicators for Problematic Hydric Soils2:
Histosol (A1) Polyvalue Below Surface (S8) (LRR R, MLRA 149B) 2 cm Muck (A10) (LRR K, L, MLRA 149B)
Histic Epipedon (A2) Thin Dark Surface (S9) (LRR R, MLRA 149B) Coast Prairie Redox (A16) (LRR K, L, R)
Black Histic (A3) Loamy Mucky Mineral (F1) (LRR K, L) 5 cm Peat or Mucky Peat (S3) (LRR K, L, R)
Hydrogen Sulfide (A4) Loamy Gleyed Matrix (F2) Dark Surface (S7) (LRR K, L, M)
Stratified Layers (A5) Depleted Matrix (F3) Polyvalue Below Surface (S8) (LRR K, L)
Depleted Below Dark Surface (A11) Redox Dark Surface (F6) Thin Dark Surface (S9) (LRR K, L)
Thick Dark Surface (A12) Depleted Dark Surface (F7) Iron-Manganese Masses (F12) (LRR K, L, R)
Sandy Mucky Mineral (S1) Redox Depressions (F8) Piedmont Floodplain Soils (F19) (MLRA 149B)
Sandy Gleyed Matrix (S4) Mesic Spodic (TA6) (MLRA 144A, 145, 149B)
Sandy Redox (S5) Red Parent Material (F21)
Stripped Matrix (S6) Very Shallow Dark Surface (TF12)
Dark Surface (S7) (LRR R, MLRA 149B) Other (Explain in Remarks)
2Indicators of hydrophytic vegetation and wetland hydrology must be present, unless disturbed or problematic
Restrictive Layer (If observed):
Type:
Depth (inches): Hydric Soil Present? Yes No
Not determined
Remarks:
Natural soils are buried by layers of material dominated by coal ash.
sand coal ash12-24 2.5Y 5/2 100
Remarks
0-12 10YR 3/2 100 sand coal ash
(Inches) Color (moist) Color (moist) Type Location Texture
SP-2
Depth Matrix Redox Features
US Army Corps of Engineers Northcentral and Northeast Region -- Version 2.0

Project/Site: City/County: Sampling Date:
Applicant/Owner: State: Sampling Point:
Investigator(s): Section, Township, Range:
Landform (hillslope, terrace, etc.): Local Relief (concave, convex, none): Slope (%):
Subregion (LRR or MLRA): Lat: Long: Datum:
Soil Map Unit Name: NWI Classification:
Are climatic / hydrologic conditions on the site typical for this time of year? Yes No (If no, explain in Remarks)
Are Vegetation , Soil , or Hydrology significantly disturbed? Are "Normal Circumstances" present? Yes No
Are Vegetation , Soil , or Hydrology naturally probelmatic? (If needed, explain any answers in Remarks)
SUMMARY OF FINDINGS - Attach site map showing sampling point locations, transects, important features, etc.
Hydrophytic Vegetation Present? Yes No Is the Samples Area
Hydric Soils Present? Yes No within a Wetland? Yes No
Wetland Hydrology Present? Yes No If yes, optional Wetland Site ID:
Remarks: (Explain alternative procedures here or in a separate report.)
HYDROLOGYWetland Hydrology Indicators: Secondary Indicators (minimum of two required)
Primary Wetland Hydrology Indicators (minimum of one is required; list all that apply) Surface Soil Cracks (B6)
Surface Water (A1) Water-Stained Leaves (B9) Drainage Patterns (B10)
High Water Table (A2) Aquatic Fauna (B13) Moss Trim Lines (B16)
Saturation (A3) Marl Deposits (B15) Dry-Season Water Table (C2)
Water Marks (B1) Hydrogen Sulfide Odor (C1) Crayfish Burrows (C8)
Sediment Deposits (B2) Oxidized Rhizospheres on Living Roots (C3) Saturation Visible on Aerial Imagery (C9)
Drift Deposits (B3) Presence of Reduced Iron (C4) Stunted or Stressed Plants (D1)
Algal Mat or Crust (B4) Recent Iron Reduction in Tilled Soils (C6) Geomorphic Position (D2)
Iron Deposits (B5) Thin Muck Surface (C7) Shallow Aquitard (D3)
Inundation Visible on Aerial Imagery (B7) Other (Explain in Remarks) Microtopographic Relief (D4)
Sparsely Vegetated Concave Surface (B8) FAC-Neutral Test (D5)
Field Observations:
Surface Water Present? Yes No Depth (inches):
Water Table Present? Yes No Depth (inches):
Saturation Present? Yes No Depth (inches): Yes No
(includes capliary fringe)
Describe Recorded Data (stream gauge, monitoring well, aerial photos, previous inspections), if available:
Remarks:
Wetland Hydrology Present?
Area has experienced an extended drought with above average temperatures. SP-3 is in upland habitat near delineation flag W5-45. Hydrophytic vegetation criterion
met due to strong presence of FAC species; no FACW or OBL species present.
Udorthents, smoothed (mapping unit 308) non-wetland
terrace none 0
LRR R; MLRA 144A 589,079.62 ft. US North 817,711.04 ft. US East NAD 1983
WETLAND DETERMINATION DATA FORM – Northcentral and Northeast Region
Norwalk Harbor Generating Station Norwalk / Fairfield 8/31/2016
NRG Energy Connecticut SP-3
Anthony Froonjian
US Army Corps of Engineers Northcentral and Northeast Region -- Version 2.0

VEGETATION - Use scientific names of plants. Sampling Point:
DominanceTest worksheet:
Tree Stratum (Plot size: ) Number of Dominant Species
1. That are OBL, FACW, or FAC (A)
2.
3. Total Number of Dominant
4. Species Across All Strata: (B)
5.
6. Percent of Dominant Species
7. That are OBL, FACW, or FAC (A/B)
=Total Cover 50% =
20% = Prevalence Index worksheet:
Sapling/Shrub Stratum (Plot size: ) Multiply by:
1. OBL species x 1 =
2. FACW species x 2 =
3. FAC species x 3 =
4. FACU species x 4 =
5. UPL species x 5 =
6. Column Totals
7. (A) (B)
=Total Cover 50% = Prevalence Index (B/A) =
20% = Hydrophytic Vegetation Indicators:
Herb Stratum (Plot size: ) 1 - Rapid Test for Hydrophytic Vegetation
1. 2 - Dominance Test is > 50%
2. 3 - Prevalence Index is ≤3.01
3. 4 -
4.
5. Problematic Hydrophytic Vegetation1 (Explain)
6.
7.
8.1Indicators of hydric soil and wetland hydrology must
9. be present, unless disturbed or problematic.
10. Definitions of Vegetation Strata:
11
12
=Total Cover 50% =
20% =
(Plot size: )
1.
2. Woody Vines - All woody vines greater than 3.28 feet in height.
3.
4.
=Total Cover 50% = HydrophyticVegetation Present?
20% = Yes No
Remarks: (Include photo numbers here or on a separate sheet.)
0
0.0 0
Woody Vine Stratum 30 ft. Herb - All herbaceous (non-woody) plants, regardless of size, and
woody plants less than 3.28 feet tall.
Tree - Woody plants 3 inches (7.6 centimeters) or more in diameter at
breast height (DBH), regardless of height.
27.0 13.5 Sapling/Shrub - Woody plants less than 3 inches DBH and greater than
3.28 feet (1 meter) tall.5.4
Morphological Adaptations1 (Provide supporting data
in Remarks or on a separate sheet)
Panicum virgatum 5.0 No FAC
Andropogon virginicus 2.0 No FACU
11
5 ft.
Carex albicans 20.0 Yes UPL
55.0 27.5 3.4
112.0 378.0
20.0 100.0
2.0 8.0
90.0 270.0
0.0
Betula populifolia 15.0 Yes FAC 0.0 0.0
6
30 ft. Total % Cover of:
Morella pensylvanica 40.0 Yes FAC 0.0
75.0
30.0 15
4
Betula populifolia 30.0 Yes FAC 3
SP-3
Absolute
% Cover
Dominant
Species? Indicator Status30 ft.
US Army Corps of Engineers Northcentral and Northeast Region -- Version 2.0

Soil Sampling Point:
Profile Description: (Describe to the depth needed to document the indicator or confirm the absence of indicators.)
% %
1Type: C=Concentration, D=Depletion, RM=Reduced Matrix, CS = Covered or Coated Sand Grains 2Location: PL=Pore Lining, RC=Root Channel, M=Matrix
Hydric Soil Indicators: Indicators for Problematic Hydric Soils2:
Histosol (A1) Polyvalue Below Surface (S8) (LRR R, MLRA 149B) 2 cm Muck (A10) (LRR K, L, MLRA 149B)
Histic Epipedon (A2) Thin Dark Surface (S9) (LRR R, MLRA 149B) Coast Prairie Redox (A16) (LRR K, L, R)
Black Histic (A3) Loamy Mucky Mineral (F1) (LRR K, L) 5 cm Peat or Mucky Peat (S3) (LRR K, L, R)
Hydrogen Sulfide (A4) Loamy Gleyed Matrix (F2) Dark Surface (S7) (LRR K, L, M)
Stratified Layers (A5) Depleted Matrix (F3) Polyvalue Below Surface (S8) (LRR K, L)
Depleted Below Dark Surface (A11) Redox Dark Surface (F6) Thin Dark Surface (S9) (LRR K, L)
Thick Dark Surface (A12) Depleted Dark Surface (F7) Iron-Manganese Masses (F12) (LRR K, L, R)
Sandy Mucky Mineral (S1) Redox Depressions (F8) Piedmont Floodplain Soils (F19) (MLRA 149B)
Sandy Gleyed Matrix (S4) Mesic Spodic (TA6) (MLRA 144A, 145, 149B)
Sandy Redox (S5) Red Parent Material (F21)
Stripped Matrix (S6) Very Shallow Dark Surface (TF12)
Dark Surface (S7) (LRR R, MLRA 149B) Other (Explain in Remarks)
2Indicators of hydrophytic vegetation and wetland hydrology must be present, unless disturbed or problematic
Restrictive Layer (If observed):
Type:
Depth (inches): Hydric Soil Present? Yes No
Remarks:
compact fill
16
gravelly sand fill material2-16 10YR 4/4 100
Remarks
0-2 10YR 3/3 100 loam
(Inches) Color (moist) Color (moist) Type Location Texture
SP-3
Depth Matrix Redox Features
US Army Corps of Engineers Northcentral and Northeast Region -- Version 2.0

Project/Site: City/County: Sampling Date:
Applicant/Owner: State: Sampling Point:
Investigator(s): Section, Township, Range:
Landform (hillslope, terrace, etc.): Local Relief (concave, convex, none): Slope (%):
Subregion (LRR or MLRA): Lat: Long: Datum:
Soil Map Unit Name: NWI Classification:
Are climatic / hydrologic conditions on the site typical for this time of year? Yes No (If no, explain in Remarks)
Are Vegetation , Soil , or Hydrology significantly disturbed? Are "Normal Circumstances" present? Yes No
Are Vegetation , Soil , or Hydrology naturally probelmatic? (If needed, explain any answers in Remarks)
SUMMARY OF FINDINGS - Attach site map showing sampling point locations, transects, important features, etc.
Hydrophytic Vegetation Present? Yes No Is the Samples Area
Hydric Soils Present? Yes No Not determined within a Wetland? Yes No
Wetland Hydrology Present? Yes No If yes, optional Wetland Site ID:
Remarks: (Explain alternative procedures here or in a separate report.)
HYDROLOGYWetland Hydrology Indicators: Secondary Indicators (minimum of two required)
Primary Wetland Hydrology Indicators (minimum of one is required; list all that apply) Surface Soil Cracks (B6)
Surface Water (A1) Water-Stained Leaves (B9) Drainage Patterns (B10)
High Water Table (A2) Aquatic Fauna (B13) Moss Trim Lines (B16)
Saturation (A3) Marl Deposits (B15) Dry-Season Water Table (C2)
Water Marks (B1) Hydrogen Sulfide Odor (C1) Crayfish Burrows (C8)
Sediment Deposits (B2) Oxidized Rhizospheres on Living Roots (C3) Saturation Visible on Aerial Imagery (C9)
Drift Deposits (B3) Presence of Reduced Iron (C4) Stunted or Stressed Plants (D1)
Algal Mat or Crust (B4) Recent Iron Reduction in Tilled Soils (C6) Geomorphic Position (D2)
Iron Deposits (B5) Thin Muck Surface (C7) Shallow Aquitard (D3)
Inundation Visible on Aerial Imagery (B7) Other (Explain in Remarks) Microtopographic Relief (D4)
Sparsely Vegetated Concave Surface (B8) FAC-Neutral Test (D5)
Field Observations:
Surface Water Present? Yes No Depth (inches):
Water Table Present? Yes No Depth (inches):
Saturation Present? Yes No Depth (inches): Yes No
(includes capliary fringe)
Describe Recorded Data (stream gauge, monitoring well, aerial photos, previous inspections), if available:
Remarks:
Wetland Hydrology Present?
near delineation flag W3-8
Area has experienced an extended drought with above average temperatures. Natural soils are beneath deep layer of coal ash. Adjacent upland is access road with
scattered Juncus tenuis , Carex albicans , and Betula populifolia .
Udorthents, smoothed (mapping unit 308) PFO1
Swamp concave 0
LRR R; MLRA 144A 588.974.51 ft. US North 817,769.70 ft. US East NAD 1983
WETLAND DETERMINATION DATA FORM – Northcentral and Northeast Region
Norwalk Harbor Generating Station Norwalk / Fairfield 8/31/2016
NRG Energy Connecticut SP-4
Anthony Froonjian
US Army Corps of Engineers Northcentral and Northeast Region -- Version 2.0

VEGETATION - Use scientific names of plants. Sampling Point:
DominanceTest worksheet:
Tree Stratum (Plot size: ) Number of Dominant Species
1. That are OBL, FACW, or FAC (A)
2.
3. Total Number of Dominant
4. Species Across All Strata: (B)
5.
6. Percent of Dominant Species
7. That are OBL, FACW, or FAC (A/B)
=Total Cover 50% =
20% = Prevalence Index worksheet:
Sapling/Shrub Stratum (Plot size: ) Multiply by:
1. OBL species x 1 =
2. FACW species x 2 =
3. FAC species x 3 =
4. FACU species x 4 =
5. UPL species x 5 =
6. Column Totals
7. (A) (B)
=Total Cover 50% = Prevalence Index (B/A) =
20% = Hydrophytic Vegetation Indicators:
Herb Stratum (Plot size: ) 1 - Rapid Test for Hydrophytic Vegetation
1. 2 - Dominance Test is > 50%
2. 3 - Prevalence Index is ≤3.01
3. 4 -
4.
5. Problematic Hydrophytic Vegetation1 (Explain)
6.
7.
8.1Indicators of hydric soil and wetland hydrology must
9. be present, unless disturbed or problematic.
10. Definitions of Vegetation Strata:
11
12
=Total Cover 50% =
20% =
(Plot size: )
1.
2. Woody Vines - All woody vines greater than 3.28 feet in height.
3.
4.
=Total Cover 50% = HydrophyticVegetation Present?
20% = Yes No
Remarks: (Include photo numbers here or on a separate sheet.)
0
Dense stand of Phragmites australis dominates the wetland interior.
0.0 0
Woody Vine Stratum 30 ft. Herb - All herbaceous (non-woody) plants, regardless of size, and
woody plants less than 3.28 feet tall.
Tree - Woody plants 3 inches (7.6 centimeters) or more in diameter at
breast height (DBH), regardless of height.
67.0 33.5 Sapling/Shrub - Woody plants less than 3 inches DBH and greater than
3.28 feet (1 meter) tall.13.4
Morphological Adaptations1 (Provide supporting data
in Remarks or on a separate sheet)Dichanthelium acuminatum 2.0 No FAC
Phragmites australis 20.0 Yes FACW
Carex scoparia 5.0 No FACW
7
5 ft.
Panicum virgatum 40.0 Yes FAC
35.0 17.5 2.8
137.0 386.0
0.0 0.0
0.0 0.0
112.0 336.0
0.0
25.0 50.0
7
30 ft. Total % Cover of:
Morella pensylvanica 35.0 Yes FAC 0.0
100.0
35.0 17.5
4
Betula populifolia 35.0 Yes FAC 4
SP-4
Absolute
% Cover
Dominant
Species? Indicator Status30 ft.
US Army Corps of Engineers Northcentral and Northeast Region -- Version 2.0

Soil Sampling Point:
Profile Description: (Describe to the depth needed to document the indicator or confirm the absence of indicators.)
% %
1Type: C=Concentration, D=Depletion, RM=Reduced Matrix, CS = Covered or Coated Sand Grains 2Location: PL=Pore Lining, RC=Root Channel, M=Matrix
Hydric Soil Indicators: Indicators for Problematic Hydric Soils2:
Histosol (A1) Polyvalue Below Surface (S8) (LRR R, MLRA 149B) 2 cm Muck (A10) (LRR K, L, MLRA 149B)
Histic Epipedon (A2) Thin Dark Surface (S9) (LRR R, MLRA 149B) Coast Prairie Redox (A16) (LRR K, L, R)
Black Histic (A3) Loamy Mucky Mineral (F1) (LRR K, L) 5 cm Peat or Mucky Peat (S3) (LRR K, L, R)
Hydrogen Sulfide (A4) Loamy Gleyed Matrix (F2) Dark Surface (S7) (LRR K, L, M)
Stratified Layers (A5) Depleted Matrix (F3) Polyvalue Below Surface (S8) (LRR K, L)
Depleted Below Dark Surface (A11) Redox Dark Surface (F6) Thin Dark Surface (S9) (LRR K, L)
Thick Dark Surface (A12) Depleted Dark Surface (F7) Iron-Manganese Masses (F12) (LRR K, L, R)
Sandy Mucky Mineral (S1) Redox Depressions (F8) Piedmont Floodplain Soils (F19) (MLRA 149B)
Sandy Gleyed Matrix (S4) Mesic Spodic (TA6) (MLRA 144A, 145, 149B)
Sandy Redox (S5) Red Parent Material (F21)
Stripped Matrix (S6) Very Shallow Dark Surface (TF12)
Dark Surface (S7) (LRR R, MLRA 149B) Other (Explain in Remarks)
2Indicators of hydrophytic vegetation and wetland hydrology must be present, unless disturbed or problematic
Restrictive Layer (If observed):
Type:
Depth (inches): Hydric Soil Present? Yes No
Not determined
Remarks:
Natural soils are buried by layers of material dominated by coal ash.
Remarks
0-18 10YR 3/2 100 sand coal ash
(Inches) Color (moist) Color (moist) Type Location Texture
SP-4
Depth Matrix Redox Features
US Army Corps of Engineers Northcentral and Northeast Region -- Version 2.0

Project/Site: City/County: Sampling Date:
Applicant/Owner: State: Sampling Point:
Investigator(s): Section, Township, Range:
Landform (hillslope, terrace, etc.): Local Relief (concave, convex, none): Slope (%):
Subregion (LRR or MLRA): Lat: Long: Datum:
Soil Map Unit Name: NWI Classification:
Are climatic / hydrologic conditions on the site typical for this time of year? Yes No (If no, explain in Remarks)
Are Vegetation , Soil , or Hydrology significantly disturbed? Are "Normal Circumstances" present? Yes No
Are Vegetation , Soil , or Hydrology naturally probelmatic? (If needed, explain any answers in Remarks)
SUMMARY OF FINDINGS - Attach site map showing sampling point locations, transects, important features, etc.
Hydrophytic Vegetation Present? Yes No Is the Samples Area
Hydric Soils Present? Yes No within a Wetland? Yes No
Wetland Hydrology Present? Yes No If yes, optional Wetland Site ID:
Remarks: (Explain alternative procedures here or in a separate report.)
HYDROLOGYWetland Hydrology Indicators: Secondary Indicators (minimum of two required)
Primary Wetland Hydrology Indicators (minimum of one is required; list all that apply) Surface Soil Cracks (B6)
Surface Water (A1) Water-Stained Leaves (B9) Drainage Patterns (B10)
High Water Table (A2) Aquatic Fauna (B13) Moss Trim Lines (B16)
Saturation (A3) Marl Deposits (B15) Dry-Season Water Table (C2)
Water Marks (B1) Hydrogen Sulfide Odor (C1) Crayfish Burrows (C8)
Sediment Deposits (B2) Oxidized Rhizospheres on Living Roots (C3) Saturation Visible on Aerial Imagery (C9)
Drift Deposits (B3) Presence of Reduced Iron (C4) Stunted or Stressed Plants (D1)
Algal Mat or Crust (B4) Recent Iron Reduction in Tilled Soils (C6) Geomorphic Position (D2)
Iron Deposits (B5) Thin Muck Surface (C7) Shallow Aquitard (D3)
Inundation Visible on Aerial Imagery (B7) Other (Explain in Remarks) Microtopographic Relief (D4)
Sparsely Vegetated Concave Surface (B8) FAC-Neutral Test (D5)
Field Observations:
Surface Water Present? Yes No Depth (inches):
Water Table Present? Yes No Depth (inches):
Saturation Present? Yes No Depth (inches): Yes No
(includes capliary fringe)
Describe Recorded Data (stream gauge, monitoring well, aerial photos, previous inspections), if available:
Remarks:
Wetland Hydrology Present?
12
10
Wetland W4 at soil pilot test plot WSD-6
Area has experienced an extended drought with above average temperatures.
Udorthents, smoothed (mapping unit 308) PEM5
Swamp concave 0
LRR R; MLRA 144A 588,845.19 ft. US North 817,930.43 ft. US East NAD 1983
WETLAND DETERMINATION DATA FORM – Northcentral and Northeast Region
Norwalk Harbor Generating Station Norwalk / Fairfield 8/31/2016
NRG Energy Connecticut SP-5
Anthony Froonjian
US Army Corps of Engineers Northcentral and Northeast Region -- Version 2.0

VEGETATION - Use scientific names of plants. Sampling Point:
DominanceTest worksheet:
Tree Stratum (Plot size: ) Number of Dominant Species
1. That are OBL, FACW, or FAC (A)
2.
3. Total Number of Dominant
4. Species Across All Strata: (B)
5.
6. Percent of Dominant Species
7. That are OBL, FACW, or FAC (A/B)
=Total Cover 50% =
20% = Prevalence Index worksheet:
Sapling/Shrub Stratum (Plot size: ) Multiply by:
1. OBL species x 1 =
2. FACW species x 2 =
3. FAC species x 3 =
4. FACU species x 4 =
5. UPL species x 5 =
6. Column Totals
7. (A) (B)
=Total Cover 50% = Prevalence Index (B/A) =
20% = Hydrophytic Vegetation Indicators:
Herb Stratum (Plot size: ) 1 - Rapid Test for Hydrophytic Vegetation
1. 2 - Dominance Test is > 50%
2. 3 - Prevalence Index is ≤3.01
3. 4 -
4.
5. Problematic Hydrophytic Vegetation1 (Explain)
6.
7.
8.1Indicators of hydric soil and wetland hydrology must
9. be present, unless disturbed or problematic.
10. Definitions of Vegetation Strata:
11
12
=Total Cover 50% =
20% =
(Plot size: )
1.
2. Woody Vines - All woody vines greater than 3.28 feet in height.
3.
4.
=Total Cover 50% = HydrophyticVegetation Present?
20% = Yes No
Remarks: (Include photo numbers here or on a separate sheet.)
0
0.0 0
Woody Vine Stratum 30 ft. Herb - All herbaceous (non-woody) plants, regardless of size, and
woody plants less than 3.28 feet tall.
Tree - Woody plants 3 inches (7.6 centimeters) or more in diameter at
breast height (DBH), regardless of height.
100.0 50 Sapling/Shrub - Woody plants less than 3 inches DBH and greater than
3.28 feet (1 meter) tall.20
Morphological Adaptations1 (Provide supporting data
in Remarks or on a separate sheet)
0
5 ft.
Phragmites australis 100.0 Yes FACW
0.0 0 2.0
100.0 200.0
0.0 0.0
0.0 0.0
0.0 0.0
0.0
100.0 200.0
0
30 ft. Total % Cover of:
0.0
100.0
0.0 0
1
1
SP-5
Absolute
% Cover
Dominant
Species? Indicator Status30 ft.
US Army Corps of Engineers Northcentral and Northeast Region -- Version 2.0

Soil Sampling Point:
Profile Description: (Describe to the depth needed to document the indicator or confirm the absence of indicators.)
% %
1Type: C=Concentration, D=Depletion, RM=Reduced Matrix, CS = Covered or Coated Sand Grains 2Location: PL=Pore Lining, RC=Root Channel, M=Matrix
Hydric Soil Indicators: Indicators for Problematic Hydric Soils2:
Histosol (A1) Polyvalue Below Surface (S8) (LRR R, MLRA 149B) 2 cm Muck (A10) (LRR K, L, MLRA 149B)
Histic Epipedon (A2) Thin Dark Surface (S9) (LRR R, MLRA 149B) Coast Prairie Redox (A16) (LRR K, L, R)
Black Histic (A3) Loamy Mucky Mineral (F1) (LRR K, L) 5 cm Peat or Mucky Peat (S3) (LRR K, L, R)
Hydrogen Sulfide (A4) Loamy Gleyed Matrix (F2) Dark Surface (S7) (LRR K, L, M)
Stratified Layers (A5) Depleted Matrix (F3) Polyvalue Below Surface (S8) (LRR K, L)
Depleted Below Dark Surface (A11) Redox Dark Surface (F6) Thin Dark Surface (S9) (LRR K, L)
Thick Dark Surface (A12) Depleted Dark Surface (F7) Iron-Manganese Masses (F12) (LRR K, L, R)
Sandy Mucky Mineral (S1) Redox Depressions (F8) Piedmont Floodplain Soils (F19) (MLRA 149B)
Sandy Gleyed Matrix (S4) Mesic Spodic (TA6) (MLRA 144A, 145, 149B)
Sandy Redox (S5) Red Parent Material (F21)
Stripped Matrix (S6) Very Shallow Dark Surface (TF12)
Dark Surface (S7) (LRR R, MLRA 149B) Other (Explain in Remarks)
2Indicators of hydrophytic vegetation and wetland hydrology must be present, unless disturbed or problematic
Restrictive Layer (If observed):
Type:
Depth (inches): Hydric Soil Present? Yes No
Remarks:
M Sand Coal ash deposits5-18 10YR 5/1 95 10YR 4/4 5 C
Remarks
0-5 10YR 4/1 100 Silt
(Inches) Color (moist) Color (moist) Type Location Texture
SP-5
Depth Matrix Redox Features
US Army Corps of Engineers Northcentral and Northeast Region -- Version 2.0
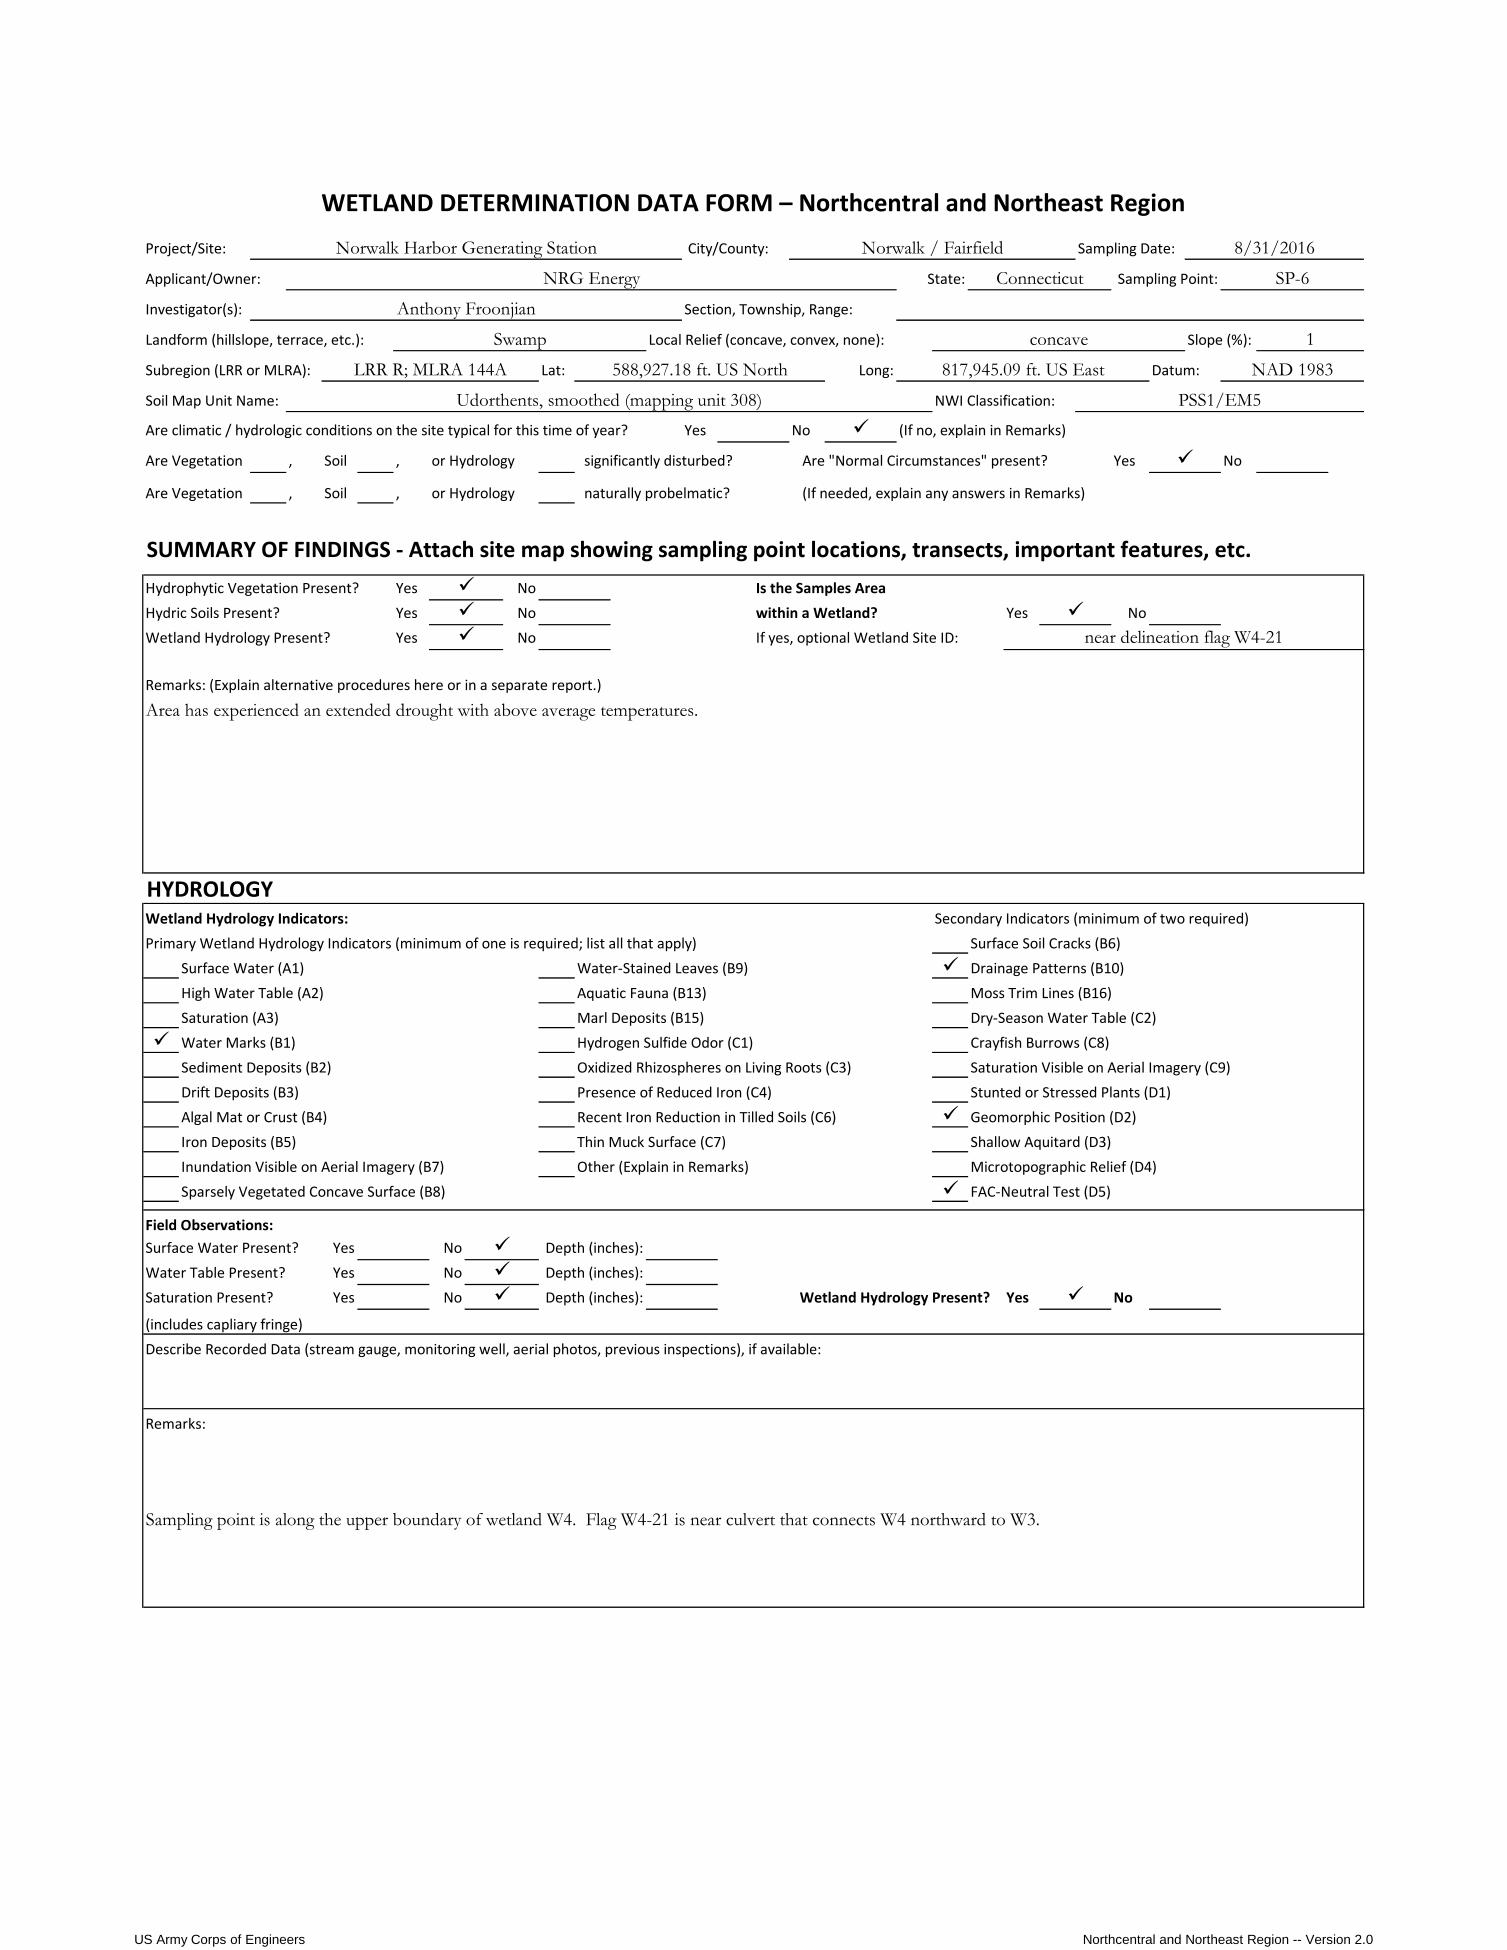
Project/Site: City/County: Sampling Date:
Applicant/Owner: State: Sampling Point:
Investigator(s): Section, Township, Range:
Landform (hillslope, terrace, etc.): Local Relief (concave, convex, none): Slope (%):
Subregion (LRR or MLRA): Lat: Long: Datum:
Soil Map Unit Name: NWI Classification:
Are climatic / hydrologic conditions on the site typical for this time of year? Yes No (If no, explain in Remarks)
Are Vegetation , Soil , or Hydrology significantly disturbed? Are "Normal Circumstances" present? Yes No
Are Vegetation , Soil , or Hydrology naturally probelmatic? (If needed, explain any answers in Remarks)
SUMMARY OF FINDINGS - Attach site map showing sampling point locations, transects, important features, etc.
Hydrophytic Vegetation Present? Yes No Is the Samples Area
Hydric Soils Present? Yes No within a Wetland? Yes No
Wetland Hydrology Present? Yes No If yes, optional Wetland Site ID:
Remarks: (Explain alternative procedures here or in a separate report.)
HYDROLOGYWetland Hydrology Indicators: Secondary Indicators (minimum of two required)
Primary Wetland Hydrology Indicators (minimum of one is required; list all that apply) Surface Soil Cracks (B6)
Surface Water (A1) Water-Stained Leaves (B9) Drainage Patterns (B10)
High Water Table (A2) Aquatic Fauna (B13) Moss Trim Lines (B16)
Saturation (A3) Marl Deposits (B15) Dry-Season Water Table (C2)
Water Marks (B1) Hydrogen Sulfide Odor (C1) Crayfish Burrows (C8)
Sediment Deposits (B2) Oxidized Rhizospheres on Living Roots (C3) Saturation Visible on Aerial Imagery (C9)
Drift Deposits (B3) Presence of Reduced Iron (C4) Stunted or Stressed Plants (D1)
Algal Mat or Crust (B4) Recent Iron Reduction in Tilled Soils (C6) Geomorphic Position (D2)
Iron Deposits (B5) Thin Muck Surface (C7) Shallow Aquitard (D3)
Inundation Visible on Aerial Imagery (B7) Other (Explain in Remarks) Microtopographic Relief (D4)
Sparsely Vegetated Concave Surface (B8) FAC-Neutral Test (D5)
Field Observations:
Surface Water Present? Yes No Depth (inches):
Water Table Present? Yes No Depth (inches):
Saturation Present? Yes No Depth (inches): Yes No
(includes capliary fringe)
Describe Recorded Data (stream gauge, monitoring well, aerial photos, previous inspections), if available:
Remarks:
Wetland Hydrology Present?
Sampling point is along the upper boundary of wetland W4. Flag W4-21 is near culvert that connects W4 northward to W3.
near delineation flag W4-21
Area has experienced an extended drought with above average temperatures.
Udorthents, smoothed (mapping unit 308) PSS1/EM5
Swamp concave 1
LRR R; MLRA 144A 588,927.18 ft. US North 817,945.09 ft. US East NAD 1983
WETLAND DETERMINATION DATA FORM – Northcentral and Northeast Region
Norwalk Harbor Generating Station Norwalk / Fairfield 8/31/2016
NRG Energy Connecticut SP-6
Anthony Froonjian
US Army Corps of Engineers Northcentral and Northeast Region -- Version 2.0

VEGETATION - Use scientific names of plants. Sampling Point:
DominanceTest worksheet:
Tree Stratum (Plot size: ) Number of Dominant Species
1. That are OBL, FACW, or FAC (A)
2.
3. Total Number of Dominant
4. Species Across All Strata: (B)
5.
6. Percent of Dominant Species
7. That are OBL, FACW, or FAC (A/B)
=Total Cover 50% =
20% = Prevalence Index worksheet:
Sapling/Shrub Stratum (Plot size: ) Multiply by:
1. OBL species x 1 =
2. FACW species x 2 =
3. FAC species x 3 =
4. FACU species x 4 =
5. UPL species x 5 =
6. Column Totals
7. (A) (B)
=Total Cover 50% = Prevalence Index (B/A) =
20% = Hydrophytic Vegetation Indicators:
Herb Stratum (Plot size: ) 1 - Rapid Test for Hydrophytic Vegetation
1. 2 - Dominance Test is > 50%
2. 3 - Prevalence Index is ≤3.01
3. 4 -
4.
5. Problematic Hydrophytic Vegetation1 (Explain)
6.
7.
8.1Indicators of hydric soil and wetland hydrology must
9. be present, unless disturbed or problematic.
10. Definitions of Vegetation Strata:
11
12
=Total Cover 50% =
20% =
(Plot size: )
1.
2. Woody Vines - All woody vines greater than 3.28 feet in height.
3.
4.
=Total Cover 50% = HydrophyticVegetation Present?
20% = Yes No
Remarks: (Include photo numbers here or on a separate sheet.)
0
xx
0.0 0
Woody Vine Stratum 30 ft. Herb - All herbaceous (non-woody) plants, regardless of size, and
woody plants less than 3.28 feet tall.
Tree - Woody plants 3 inches (7.6 centimeters) or more in diameter at
breast height (DBH), regardless of height.
100.0 50 Sapling/Shrub - Woody plants less than 3 inches DBH and greater than
3.28 feet (1 meter) tall.20
Morphological Adaptations1 (Provide supporting data
in Remarks or on a separate sheet)
4
5 ft.
Phragmites australis 100.0 Yes FACW
20.0 10 2.2
120.0 260.0
0.0 0.0
0.0 0.0
20.0 60.0
0.0
Betula populifolia 5.0 Yes FAC 100.0 200.0
0
30 ft. Total % Cover of:
Morella pensylvanica 15.0 Yes FAC 0.0
100.0
0.0 0
1
1
SP-6
Absolute
% Cover
Dominant
Species? Indicator Status30 ft.
US Army Corps of Engineers Northcentral and Northeast Region -- Version 2.0

Soil Sampling Point:
Profile Description: (Describe to the depth needed to document the indicator or confirm the absence of indicators.)
% %
1Type: C=Concentration, D=Depletion, RM=Reduced Matrix, CS = Covered or Coated Sand Grains 2Location: PL=Pore Lining, RC=Root Channel, M=Matrix
Hydric Soil Indicators: Indicators for Problematic Hydric Soils2:
Histosol (A1) Polyvalue Below Surface (S8) (LRR R, MLRA 149B) 2 cm Muck (A10) (LRR K, L, MLRA 149B)
Histic Epipedon (A2) Thin Dark Surface (S9) (LRR R, MLRA 149B) Coast Prairie Redox (A16) (LRR K, L, R)
Black Histic (A3) Loamy Mucky Mineral (F1) (LRR K, L) 5 cm Peat or Mucky Peat (S3) (LRR K, L, R)
Hydrogen Sulfide (A4) Loamy Gleyed Matrix (F2) Dark Surface (S7) (LRR K, L, M)
Stratified Layers (A5) Depleted Matrix (F3) Polyvalue Below Surface (S8) (LRR K, L)
Depleted Below Dark Surface (A11) Redox Dark Surface (F6) Thin Dark Surface (S9) (LRR K, L)
Thick Dark Surface (A12) Depleted Dark Surface (F7) Iron-Manganese Masses (F12) (LRR K, L, R)
Sandy Mucky Mineral (S1) Redox Depressions (F8) Piedmont Floodplain Soils (F19) (MLRA 149B)
Sandy Gleyed Matrix (S4) Mesic Spodic (TA6) (MLRA 144A, 145, 149B)
Sandy Redox (S5) Red Parent Material (F21)
Stripped Matrix (S6) Very Shallow Dark Surface (TF12)
Dark Surface (S7) (LRR R, MLRA 149B) Other (Explain in Remarks)
2Indicators of hydrophytic vegetation and wetland hydrology must be present, unless disturbed or problematic
Restrictive Layer (If observed):
Type:
Depth (inches): Hydric Soil Present? Yes No
Remarks:
Hydric soil developing in upper part of the profile, above coal ash deposits.
Sand Coal ash4-18 10YR 5/2 100
Remarks
0-4 10YR 4/1 90 10YR 6/6 10 C M Silt loam
(Inches) Color (moist) Color (moist) Type Location Texture
SP-6
Depth Matrix Redox Features
US Army Corps of Engineers Northcentral and Northeast Region -- Version 2.0

Project/Site: City/County: Sampling Date:
Applicant/Owner: State: Sampling Point:
Investigator(s): Section, Township, Range:
Landform (hillslope, terrace, etc.): Local Relief (concave, convex, none): Slope (%):
Subregion (LRR or MLRA): Lat: Long: Datum:
Soil Map Unit Name: NWI Classification:
Are climatic / hydrologic conditions on the site typical for this time of year? Yes No (If no, explain in Remarks)
Are Vegetation , Soil , or Hydrology significantly disturbed? Are "Normal Circumstances" present? Yes No
Are Vegetation , Soil , or Hydrology naturally probelmatic? (If needed, explain any answers in Remarks)
SUMMARY OF FINDINGS - Attach site map showing sampling point locations, transects, important features, etc.
Hydrophytic Vegetation Present? Yes No Is the Samples Area
Hydric Soils Present? Yes No within a Wetland? Yes No
Wetland Hydrology Present? Yes No If yes, optional Wetland Site ID:
Remarks: (Explain alternative procedures here or in a separate report.)
HYDROLOGYWetland Hydrology Indicators: Secondary Indicators (minimum of two required)
Primary Wetland Hydrology Indicators (minimum of one is required; list all that apply) Surface Soil Cracks (B6)
Surface Water (A1) Water-Stained Leaves (B9) Drainage Patterns (B10)
High Water Table (A2) Aquatic Fauna (B13) Moss Trim Lines (B16)
Saturation (A3) Marl Deposits (B15) Dry-Season Water Table (C2)
Water Marks (B1) Hydrogen Sulfide Odor (C1) Crayfish Burrows (C8)
Sediment Deposits (B2) Oxidized Rhizospheres on Living Roots (C3) Saturation Visible on Aerial Imagery (C9)
Drift Deposits (B3) Presence of Reduced Iron (C4) Stunted or Stressed Plants (D1)
Algal Mat or Crust (B4) Recent Iron Reduction in Tilled Soils (C6) Geomorphic Position (D2)
Iron Deposits (B5) Thin Muck Surface (C7) Shallow Aquitard (D3)
Inundation Visible on Aerial Imagery (B7) Other (Explain in Remarks) Microtopographic Relief (D4)
Sparsely Vegetated Concave Surface (B8) FAC-Neutral Test (D5)
Field Observations:
Surface Water Present? Yes No Depth (inches):
Water Table Present? Yes No Depth (inches):
Saturation Present? Yes No Depth (inches): Yes No
(includes capliary fringe)
Describe Recorded Data (stream gauge, monitoring well, aerial photos, previous inspections), if available:
Remarks:
Wetland Hydrology Present?
Area has experienced an extended drought with above average temperatures. SP-7 is on access road between wetlands W3 and W4. Hydrophytic vegetation criterion
met due to strong presence of FAC species; non-dominant species are FACU and UPL - no FACW or OBL species present.
Udorthents, smoothed (mapping unit 308) non-wetland
terrace convex 1
LRR R; MLRA 144A 588,952.77 ft. US North 817,937.81 ft. US East NAD 1983
WETLAND DETERMINATION DATA FORM – Northcentral and Northeast Region
Norwalk Harbor Generating Station Norwalk / Fairfield 8/31/2016
NRG Energy Connecticut SP-7
Anthony Froonjian
US Army Corps of Engineers Northcentral and Northeast Region -- Version 2.0

VEGETATION - Use scientific names of plants. Sampling Point:
DominanceTest worksheet:
Tree Stratum (Plot size: ) Number of Dominant Species
1. That are OBL, FACW, or FAC (A)
2.
3. Total Number of Dominant
4. Species Across All Strata: (B)
5.
6. Percent of Dominant Species
7. That are OBL, FACW, or FAC (A/B)
=Total Cover 50% =
20% = Prevalence Index worksheet:
Sapling/Shrub Stratum (Plot size: ) Multiply by:
1. OBL species x 1 =
2. FACW species x 2 =
3. FAC species x 3 =
4. FACU species x 4 =
5. UPL species x 5 =
6. Column Totals
7. (A) (B)
=Total Cover 50% = Prevalence Index (B/A) =
20% = Hydrophytic Vegetation Indicators:
Herb Stratum (Plot size: ) 1 - Rapid Test for Hydrophytic Vegetation
1. 2 - Dominance Test is > 50%
2. 3 - Prevalence Index is ≤3.01
3. 4 -
4.
5. Problematic Hydrophytic Vegetation1 (Explain)
6.
7.
8.1Indicators of hydric soil and wetland hydrology must
9. be present, unless disturbed or problematic.
10. Definitions of Vegetation Strata:
11
12
=Total Cover 50% =
20% =
(Plot size: )
1.
2. Woody Vines - All woody vines greater than 3.28 feet in height.
3.
4.
=Total Cover 50% = HydrophyticVegetation Present?
20% = Yes No
Remarks: (Include photo numbers here or on a separate sheet.)
0
0.0 0
Woody Vine Stratum 30 ft. Herb - All herbaceous (non-woody) plants, regardless of size, and
woody plants less than 3.28 feet tall.
Tree - Woody plants 3 inches (7.6 centimeters) or more in diameter at
breast height (DBH), regardless of height.
26.0 13 Sapling/Shrub - Woody plants less than 3 inches DBH and greater than
3.28 feet (1 meter) tall.5.2
Morphological Adaptations1 (Provide supporting data
in Remarks or on a separate sheet)
Carex albicans 20.0 Yes UPL
Andropogon virginicus 1.0 No FACU
11
5 ft.
Panicum virgatum 5.0 No FAC
55.0 27.5 3.4
111.0 374.0
20.0 100.0
1.0 4.0
90.0 270.0
0.0
Betula populifolia 15.0 Yes FAC 0.0 0.0
6
30 ft. Total % Cover of:
Morella pensylvanica 40.0 Yes FAC 0.0
100.0
30.0 15
4
Betula populifolia 30.0 Yes FAC 4
SP-7
Absolute
% Cover
Dominant
Species? Indicator Status30 ft.
US Army Corps of Engineers Northcentral and Northeast Region -- Version 2.0

Soil Sampling Point:
Profile Description: (Describe to the depth needed to document the indicator or confirm the absence of indicators.)
% %
1Type: C=Concentration, D=Depletion, RM=Reduced Matrix, CS = Covered or Coated Sand Grains 2Location: PL=Pore Lining, RC=Root Channel, M=Matrix
Hydric Soil Indicators: Indicators for Problematic Hydric Soils2:
Histosol (A1) Polyvalue Below Surface (S8) (LRR R, MLRA 149B) 2 cm Muck (A10) (LRR K, L, MLRA 149B)
Histic Epipedon (A2) Thin Dark Surface (S9) (LRR R, MLRA 149B) Coast Prairie Redox (A16) (LRR K, L, R)
Black Histic (A3) Loamy Mucky Mineral (F1) (LRR K, L) 5 cm Peat or Mucky Peat (S3) (LRR K, L, R)
Hydrogen Sulfide (A4) Loamy Gleyed Matrix (F2) Dark Surface (S7) (LRR K, L, M)
Stratified Layers (A5) Depleted Matrix (F3) Polyvalue Below Surface (S8) (LRR K, L)
Depleted Below Dark Surface (A11) Redox Dark Surface (F6) Thin Dark Surface (S9) (LRR K, L)
Thick Dark Surface (A12) Depleted Dark Surface (F7) Iron-Manganese Masses (F12) (LRR K, L, R)
Sandy Mucky Mineral (S1) Redox Depressions (F8) Piedmont Floodplain Soils (F19) (MLRA 149B)
Sandy Gleyed Matrix (S4) Mesic Spodic (TA6) (MLRA 144A, 145, 149B)
Sandy Redox (S5) Red Parent Material (F21)
Stripped Matrix (S6) Very Shallow Dark Surface (TF12)
Dark Surface (S7) (LRR R, MLRA 149B) Other (Explain in Remarks)
2Indicators of hydrophytic vegetation and wetland hydrology must be present, unless disturbed or problematic
Restrictive Layer (If observed):
Type:
Depth (inches): Hydric Soil Present? Yes No
Remarks:
Remarks
0-18 10YR 5/4 100 gravelly fine sand compact fill material
(Inches) Color (moist) Color (moist) Type Location Texture
SP-7
Depth Matrix Redox Features
US Army Corps of Engineers Northcentral and Northeast Region -- Version 2.0

APPENDIX D
OBSERVED VEGETATION
CONNECTICUT INVASIVE PLANT LIST

Appendix DVegetation Inventory August 30 and 31, 2016
NRG Energy
Norwalk Harbor Generating Station
Fairfield County, Connecticut
Acronym Numerical Wetlands Uplands
Acer rubrum Red maple FAC 0
Ailanthus altissima Tree-of-heaven UPL 5
Anaphalis margaritacea Pearly everlasting FACU 3
Andropogon virginicus Broom-sedge FACU 3
Berberis thunbergii Japanese barberry FACU 3
Betula lenta Black birch FACU 3
Betula populifolia Gray birch FAC 0
Bulbosylis capillaris Sand-rush FACU 3
Carduus nutans Nodding thistle FACU 3
Carex albicans White-tinged sedge UPL 5
Carex annectens Yellow-fruit sedge FACW -3
Carex scoparia Pointed broom sedge FACW -3
Carex swanii Swan's sedge FACU 3
Celastrus orbiculatus Asiatic bittersweet UPL 5
Cornus florida Flowering dogwood FACU 3
Cyperus echinatus Globe flatesedge FAC 0
Cyperus strigous Straw-color flatsedge FACW -3
Dichanthelium acuminatum Tapered rosette-grass FAC 0
Distichlis spicata Saltgrass FACW -3
Elaeagnus umbellata Autumn olive NL 5
Eragrostis spectabilis Love grass UPL 5
Hypericum gentianoides Orange-grass FACU 3
Iva frutescens Marsh-elder FACW -3
Juncus tenuis Path rush FAC 0
Juniperus virginiana Eastern red cedar FACU 3
Limonium carolinianum Sea lavender OBL -5
Linaria vulgaris Butter-and-eggs NL 5
Lonicera morrowii Morrow's honeysuckle FACU 3
Malus sp. Crab-apple NL 5
Microstegium vimineum Japanese stiltgrass FAC 0
Morella pensylvanica Northern bayberry FAC 0
Morus alba White mulberry FACU 3
Nuttallanthus canadensis Blue toadflax NL 5
Panicum virgatum Switch-grass FAC 0
Parthenocissus quinquefolia Virginia creeper FACU 3
Phragmites australis Common reed FACW -3
Pinus rigida Pitch pine FACU 3
Pinus strobus Eastern white pine FACU 3
Pluchea odorata Saltmarsh fleabane OBL -5
Populus deltoides Eastern cottonwood FAC 0
Prunus serotina Black cherry FACU 3
Quercus rubra Northern red oak FACU 3
Quercus velutina Black oak NL 5
Rosa rugosa Seaside rose FACU 3
Invasive
Indicator Status*Non-
nativeScientific Name Common Name

Appendix DVegetation Inventory August 30 and 31, 2016
NRG Energy
Norwalk Harbor Generating Station
Fairfield County, Connecticut
Acronym Numerical Wetlands Uplands Invasive
Indicator Status*Non-
nativeScientific Name Common Name
Rubus phoenicolasius Wineberry FACU 3
Salicornia depressa Virginia glasswort OBL -5
Salix caprea Goat willow FAC 0
Senecio hieraciifolius Pilewort FACU 3
Spartina alterniflora Saltmarsh cordgrass OBL -5
Spartina patens Salt-meadow cordgrass FACW -3
Thelypteris palustris Marsh fern FACW -3
Toxicodendron radicans Poison ivy FAC 0
Tridens flavus Purple-top UPL 5
Verbascum thapsus Common mullein UPL 5
Vitis riparia Riverbank grape FAC 0
*Indicator Statuses
Obligate Wetland (OBL, -5) - Almost always occur in wetlands
Facultative Wetland (FACW, -3) - Usually occur in wetlands, but may occur in non-wetlands
Facultative (FAC, 0) - Occur in wetlands or non-wetlands
Facultative Upland (FACU, 3) - Usually occur in non-wetlands, but may occur in wetlands
Obligate Upland (UPL, 5) - Almost never occur in wetlands
Unofficial Indicator Used in this Table
Not Listed (NL, 5) - Not found on the National Wetland Plant List
Total OBL Taxa 4 Percent 7.3%
Total FACW Taxa 8 Percent 14.5%
Total FAC Taxa 12 Percent 21.8%
Total FACU Taxa 20 Percent 36.4%
Total UPL and NL Taxa 11 Percent 20.0%
Average Numerical Wetland Indicator Status 1.3 ("FAC-")
Source: Lichvar, R.W., D.L. Banks, W.N. Kirchner, and N.C. Melvin. 2016. The National Wetland Plant List:
2016 wetland ratings. Phytoneuron 2016-30: 1-17. Published 28 April 2016. ISSN 2153 733X
http://www.phytoneuron.net/
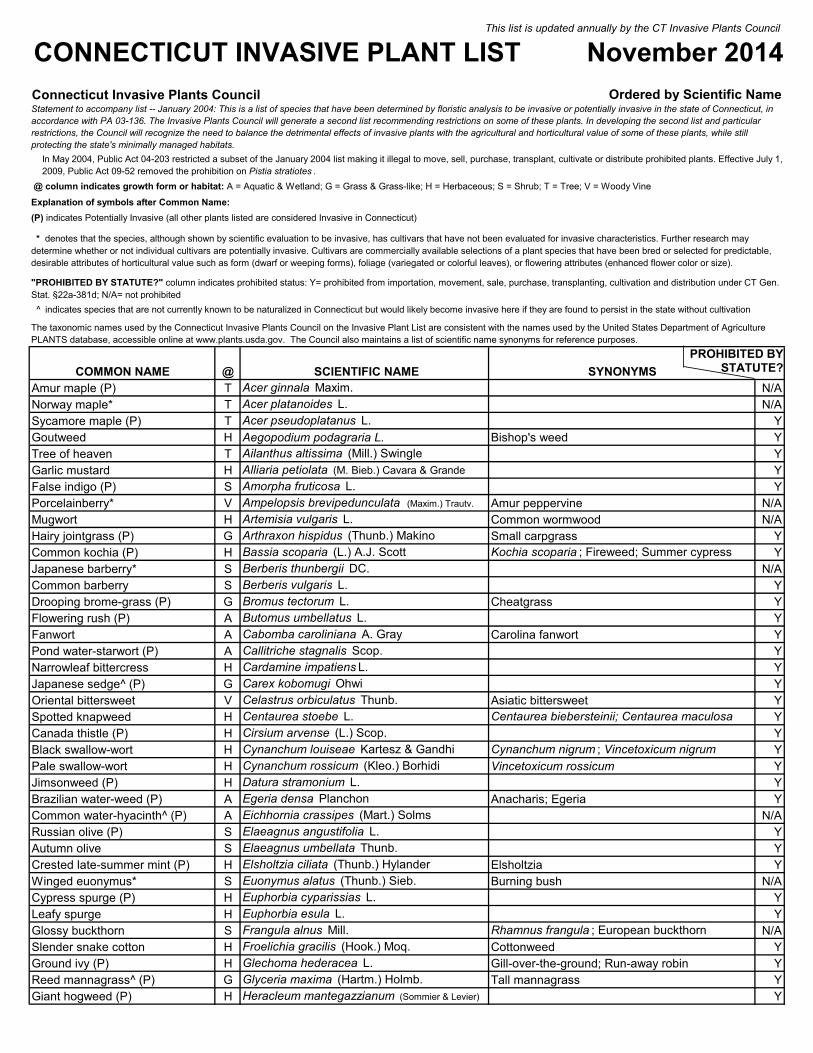
This list is updated annually by the CT Invasive Plants Council
Ordered by Scientific Name
COMMON NAME @ SCIENTIFIC NAME SYNONYMSAmur maple (P) T Acer ginnala Maxim. N/ANorway maple* T Acer platanoides L. N/ASycamore maple (P) T Acer pseudoplatanus L. YGoutweed H Aegopodium podagraria L. Bishop's weed YTree of heaven T Ailanthus altissima (Mill.) Swingle YGarlic mustard H Alliaria petiolata (M. Bieb.) Cavara & Grande YFalse indigo (P) S Amorpha fruticosa L. YPorcelainberry* V Ampelopsis brevipedunculata (Maxim.) Trautv. Amur peppervine N/AMugwort H Artemisia vulgaris L. Common wormwood N/AHairy jointgrass (P) G Arthraxon hispidus (Thunb.) Makino Small carpgrass YCommon kochia (P) H Bassia scoparia (L.) A.J. Scott Kochia scoparia ; Fireweed; Summer cypress YJapanese barberry* S Berberis thunbergii DC. N/ACommon barberry S Berberis vulgaris L. YDrooping brome-grass (P) G Bromus tectorum L. Cheatgrass YFlowering rush (P) A Butomus umbellatus L. YFanwort A Cabomba caroliniana A. Gray Carolina fanwort YPond water-starwort (P) A Callitriche stagnalis Scop. YNarrowleaf bittercress H Cardamine impatiens L. YJapanese sedge^ (P) G Carex kobomugi Ohwi YOriental bittersweet V Celastrus orbiculatus Thunb. Asiatic bittersweet YSpotted knapweed H Centaurea stoebe L. Centaurea biebersteinii; Centaurea maculosa YCanada thistle (P) H Cirsium arvense (L.) Scop. YBlack swallow-wort H Cynanchum louiseae Kartesz & Gandhi Cynanchum nigrum ; Vincetoxicum nigrum YPale swallow-wort H Cynanchum rossicum (Kleo.) Borhidi Vincetoxicum rossicum YJimsonweed (P) H Datura stramonium L. YBrazilian water-weed (P) A Egeria densa Planchon Anacharis; Egeria YCommon water-hyacinth^ (P) A Eichhornia crassipes (Mart.) Solms N/ARussian olive (P) S Elaeagnus angustifolia L. YAutumn olive S Elaeagnus umbellata Thunb. YCrested late-summer mint (P) H Elsholtzia ciliata (Thunb.) Hylander Elsholtzia YWinged euonymus* S Euonymus alatus (Thunb.) Sieb. Burning bush N/ACypress spurge (P) H Euphorbia cyparissias L. YLeafy spurge H Euphorbia esula L. YGlossy buckthorn S Frangula alnus Mill. Rhamnus frangula ; European buckthorn N/ASlender snake cotton H Froelichia gracilis (Hook.) Moq. Cottonweed YGround ivy (P) H Glechoma hederacea L. Gill-over-the-ground; Run-away robin YReed mannagrass^ (P) G Glyceria maxima (Hartm.) Holmb. Tall mannagrass YGiant hogweed (P) H Heracleum mantegazzianum (Sommier & Levier) Y
The taxonomic names used by the Connecticut Invasive Plants Council on the Invasive Plant List are consistent with the names used by the United States Department of Agriculture PLANTS database, accessible online at www.plants.usda.gov. The Council also maintains a list of scientific name synonyms for reference purposes.
CONNECTICUT INVASIVE PLANT LIST November 2014
Statement to accompany list -- January 2004: This is a list of species that have been determined by floristic analysis to be invasive or potentially invasive in the state of Connecticut, in accordance with PA 03-136. The Invasive Plants Council will generate a second list recommending restrictions on some of these plants. In developing the second list and particular restrictions, the Council will recognize the need to balance the detrimental effects of invasive plants with the agricultural and horticultural value of some of these plants, while still protecting the state's minimally managed habitats.
In May 2004, Public Act 04-203 restricted a subset of the January 2004 list making it illegal to move, sell, purchase, transplant, cultivate or distribute prohibited plants. Effective July 1, 2009, Public Act 09-52 removed the prohibition on Pistia stratiotes .
indicates species that are not currently known to be naturalized in Connecticut but would likely become invasive here if they are found to persist in the state without cultivation
@ column indicates growth form or habitat: A = Aquatic & Wetland; G = Grass & Grass-like; H = Herbaceous; S = Shrub; T = Tree; V = Woody Vine
Explanation of symbols after Common Name:(P) indicates Potentially Invasive (all other plants listed are considered Invasive in Connecticut)
* denotes that the species, although shown by scientific evaluation to be invasive, has cultivars that have not been evaluated for invasive characteristics. Further research may determine whether or not individual cultivars are potentially invasive. Cultivars are commercially available selections of a plant species that have been bred or selected for predictable, desirable attributes of horticultural value such as form (dwarf or weeping forms), foliage (variegated or colorful leaves), or flowering attributes (enhanced flower color or size).
"PROHIBITED BY STATUTE?" column indicates prohibited status: Y= prohibited from importation, movement, sale, purchase, transplanting, cultivation and distribution under CT Gen. Stat. §22a-381d; N/A= not prohibited
Connecticut Invasive Plants Council
PROHIBITED BY STATUTE?

Dame's rocket H Hesperis matronalis L. YJapanese hops (P) H Humulus japonicus Sieb. & Zucc. Japanese hop YHydrilla A Hydrilla verticillata (L.f.) Royle Water thyme YOrnamental jewelweed (P) H Impatiens glandulifera Royle Tall impatiens YYellow iris A Iris pseudacorus L. Yellow flag iris; Pale yellow iris YPerennial pepperweed H Lepidium latifolium L. Tall pepperwort YBorder privet (P) S Ligustrum obtusifolium Sieb. & Zucc. YCalifornia privet (P) S Ligustrum ovalifolium Hassk. N/AEuropean privet (P) S Ligustrum vulgare L. N/AJapanese honeysuckle* V Lonicera japonica Thunb. YAmur honeysuckle S Lonicera maackii (Rupr.) Herder YMorrow's honeysuckle S Lonicera morrowii A. Gray YTatarian honeysuckle (P) S Lonicera tatarica L. YBelle honeysuckle S Lonicera x bella Zabel Bell's honeysuckle (misapplied ) YDwarf honeysuckle^ (P) S Lonicera xylosteum L. European fly-honeysuckle YRagged robin (P) H Lychnis flos-cuculi L. YMoneywort* (P) H Lysimachia nummularia L. Creeping jenny N/AGarden loosestrife* (P) H Lysimachia vulgaris L. Garden yellow loosestrife YPurple loosestrife A Lythrum salicaria L. YEuropean waterclover (P) A Marsilea quadrifolia L. Water shamrock YJapanese stilt grass G Microstegium vimineum (Trin.) A. Camus YEulalia* (P) G Miscanthus sinensis Andersson Chinese or Japanese silvergrass N/AForget-me-not A Myosotis scorpioides L. True forget-me-not; Water scorpion-grass YParrotfeather (P) A Myriophyllum aquaticum (Vell.) Verdc. YVariable-leaf watermilfoil A Myriophyllum heterophyllum Michx. YEurasian watermilfoil A Myriophyllum spicatum L. YBrittle water-nymph (P) A Najas minor All. Eutrophic water-nymph YOnerow yellowcress (P) A Nasturtium microphyllum Boenn. ex. Rchb. Rorippa microphylla YWatercress (P) A Nasturtium officinale W.T. Aiton Rorippa nasturtium-aquaticum YAmerican water lotus (P) A Nelumbo lutea Willd. American water lotus YYellow floating heart (P) A Nymphoides peltata (S.G. Gmel.) Kuntze YScotch thistle (P) H Onopordum acanthium L. YStar-of-Bethlehem (P) H Ornithogalum umbellatum L. N/APrincess tree (P) T Paulownia tomentosa (Thunb.) Siebold & Zucc. ex Steud. Empress-tree YReed canary grass G Phalaris arundinacea L. N/ACommon reed G Phragmites australis (Cav.) Trin. ex Steud. Phragmites YWater lettuce^ (P) A Pistia stratiotes L. N/ACanada bluegrass (P) G Poa compressa L. YBristled knotweed H Polygonum caespitosum Blume Persicaria longiseta; Oriental lady's thumb YJapanese knotweed H Polygonum cuspidatum Siebold & Zucc. Fallopia japonica YMile-a-minute vine H Polygonum perfoliatum L. Persicaria perfoliata YGiant knotweed (P) H Polygonum sachalinense F. Schmidt ex. Maxim. Fallopia sachalinense YWhite poplar (P) T Populus alba L. YCrispy-leaved pondweed A Potamogeton crispus L. Curly pondweed or Curly-leaved pondweed YKudzu (P) V Pueraria montana (Lour.) Merr. Pueraria lobata YFig buttercup H Ranunculus ficaria L. Lesser celandine; Ficaria verna YCommon buckthorn S Rhamnus cathartica L. YBlack locust* T Robinia pseudoacacia L. N/AMultiflora rose S Rosa multiflora Thunb. YRugosa rose* (P) S Rosa rugosa Thunb.* Beach, Salt spray, Japanese, or Ramanas Rose N/A
Wineberry S Rubus phoenicolasius Maxim. YSheep sorrel (P) H Rumex acetosella L. YGiant salvinia^ (P) A Salvinia molesta Mitchell YTansy ragwort^ (P) H Senecio jacobaea L. Stinking Willie YCup plant (P) H Silphium perfoliatum L. YBittersweet nightshade (P) H Solanum dulcamara L. Climbing nightshade YWater chestnut A Trapa natans L. YColtsfoot H Tussilago farfara L. YGarden heliotrope (P) H Valeriana officinalis L. Garden Valerian Y
*Note: This plant is especially aggressive in coastal areas

APPENDIX E
INVASIVE SPECIES MONITORING FORMS
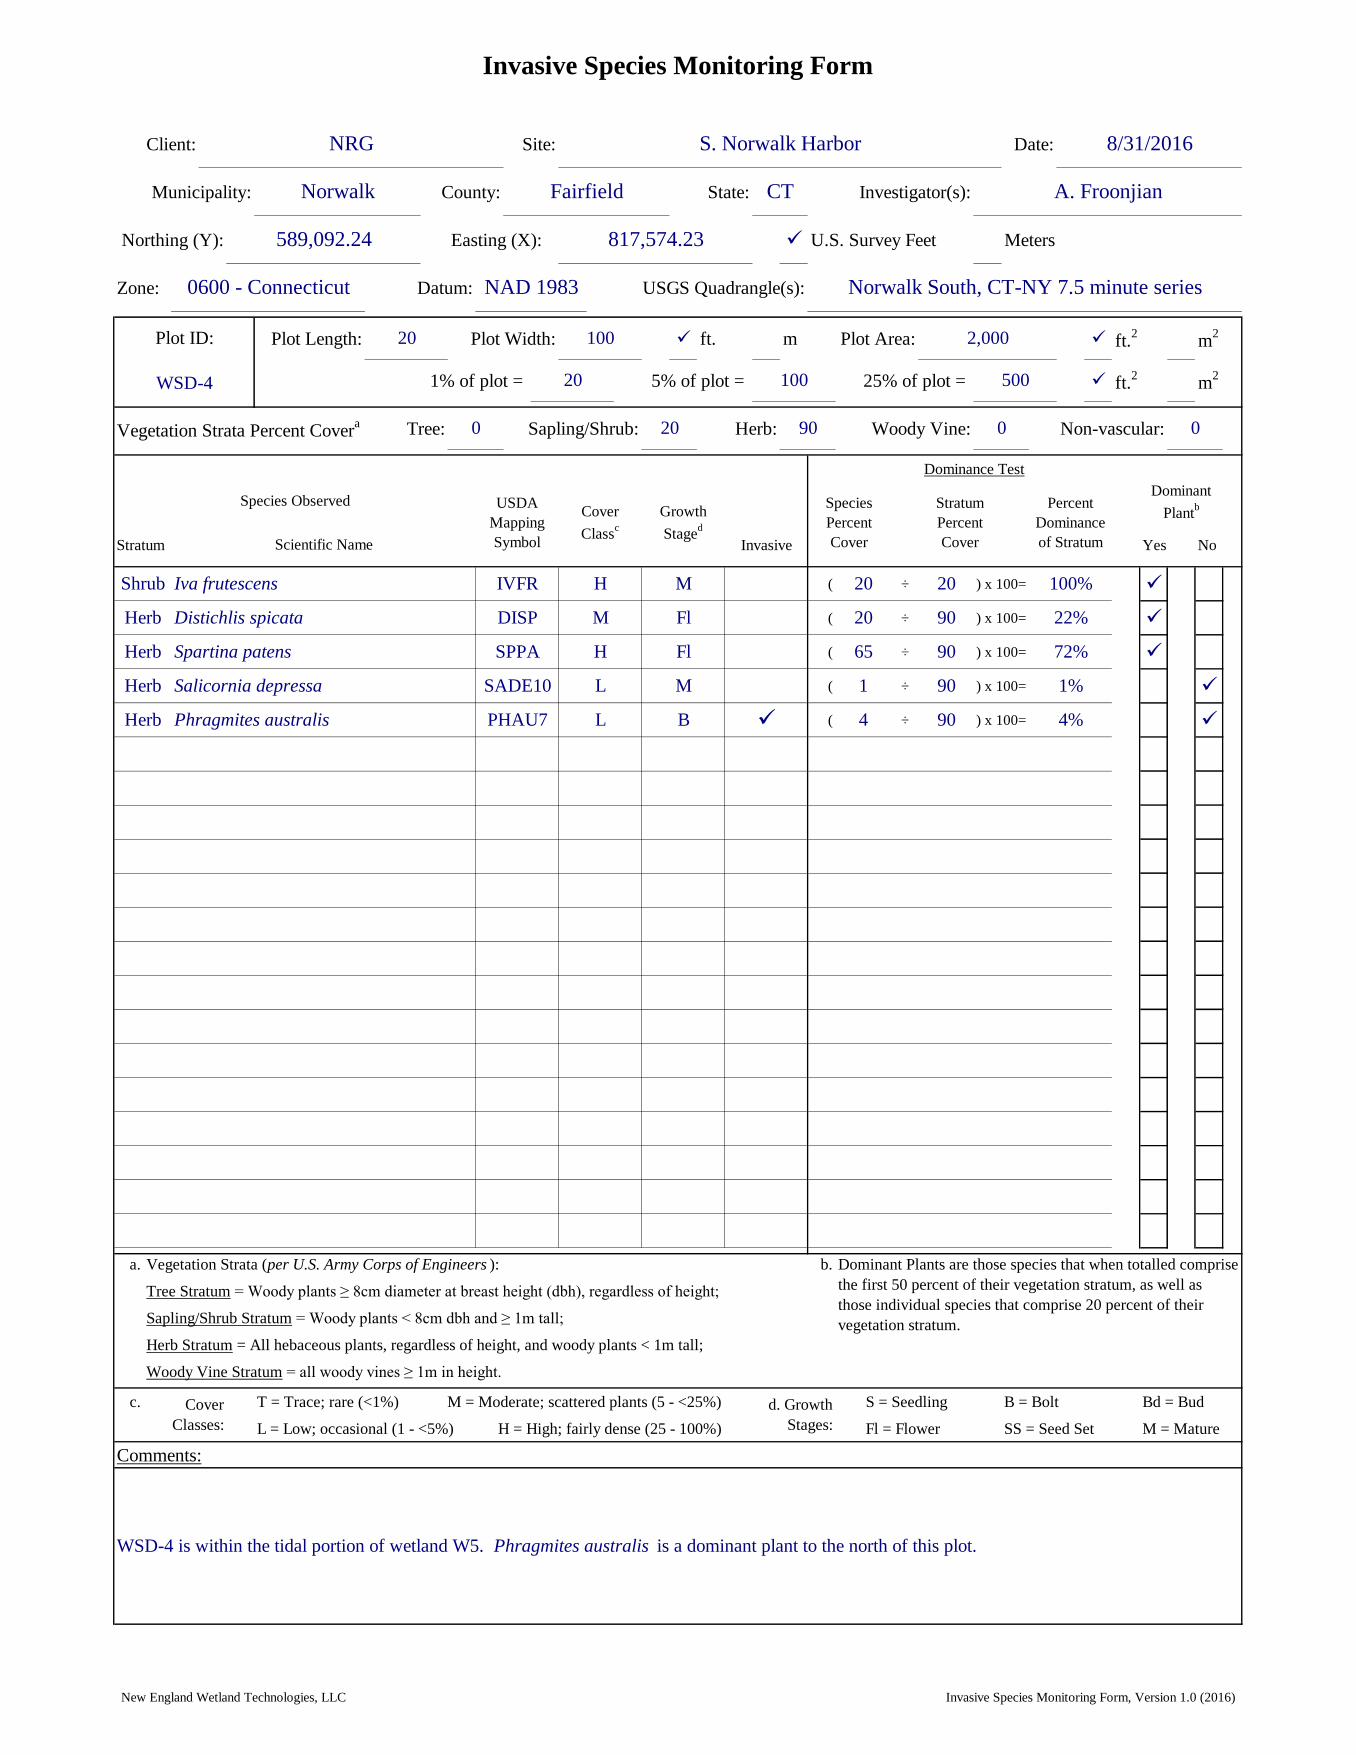
Invasive Species Monitoring Form
Client: Site: Date:
Municipality: County: State: Investigator(s):
Northing (Y): Easting (X): U.S. Survey Feet Meters
Zone: Datum: USGS Quadrangle(s):
Plot Length: Plot Width: ft. m Plot Area: ft.2
m2
1% of plot = 5% of plot = 25% of plot = ft.2
m2
Vegetation Strata Percent Covera Tree: Sapling/Shrub: Herb: Woody Vine: Non-vascular:
Stratum Invasive Yes No
( ÷ ) x 100=
( ÷ ) x 100=
( ÷ ) x 100=
( ÷ ) x 100=
( ÷ ) x 100=
a. Vegetation Strata (per U.S. Army Corps of Engineers ): b.
Tree Stratum = Woody plants ≥ 8cm diameter at breast height (dbh), regardless of height;
Sapling/Shrub Stratum = Woody plants < 8cm dbh and ≥ 1m tall;
Herb Stratum = All hebaceous plants, regardless of height, and woody plants < 1m tall;
Woody Vine Stratum = all woody vines ≥ 1m in height.
c. T = Trace; rare (<1%) M = Moderate; scattered plants (5 - <25%) S = Seedling B = Bolt Bd = Bud
L = Low; occasional (1 - <5%) H = High; fairly dense (25 - 100%) Fl = Flower SS = Seed Set M = Mature
Comments:
WSD-4 is within the tidal portion of wetland W5. Phragmites australis is a dominant plant to the north of this plot.
Norwalk
NRG
A. Froonjian
Dominant Plants are those species that when totalled comprise
the first 50 percent of their vegetation stratum, as well as
those individual species that comprise 20 percent of their
vegetation stratum.
Cover
Classes:
d. Growth
Stages:
Herb Phragmites australis PHAU7 L B 4 90 4%
Herb Salicornia depressa SADE10 L M 1 90 1%
Herb Spartina patens SPPA H Fl 65 90 72%
Herb Distichlis spicata DISP M Fl 20 90 22%
Shrub Iva frutescens IVFR H M
0
Dominance Test
Dominant
PlantbUSDA
Mapping
Symbol
Cover
Classc
Growth
Staged
Species
Percent
Cover
Stratum
Percent
Cover
Percent
Dominance
of Stratum
20 20 100%
0
817,574.23589,092.24
0600 - Connecticut NAD 1983
Plot ID: 20 100 2,000
Norwalk South, CT-NY 7.5 minute series
S. Norwalk Harbor 8/31/2016
Fairfield CT
Species Observed
Scientific Name
WSD-4 20 100 500
0 20 90
New England Wetland Technologies, LLC Invasive Species Monitoring Form, Version 1.0 (2016)

Invasive Species Monitoring Form
Client: Site: Date:
Municipality: County: State: Investigator(s):
Northing (Y): Easting (X): U.S. Survey Feet Meters
Zone: Datum: USGS Quadrangle(s):
Plot Length: Plot Width: ft. m Plot Area: ft.2
m2
1% of plot = 5% of plot = 25% of plot = ft.2
m2
Vegetation Strata Percent Covera Tree: Sapling/Shrub: Herb: Woody Vine: Non-vascular:
Stratum Invasive Yes No
( ÷ ) x 100=
( ÷ ) x 100=
( ÷ ) x 100=
( ÷ ) x 100=
( ÷ ) x 100=
( ÷ ) x 100=
( ÷ ) x 100=
a. Vegetation Strata (per U.S. Army Corps of Engineers ): b.
Tree Stratum = Woody plants ≥ 8cm diameter at breast height (dbh), regardless of height;
Sapling/Shrub Stratum = Woody plants < 8cm dbh and ≥ 1m tall;
Herb Stratum = All hebaceous plants, regardless of height, and woody plants < 1m tall;
Woody Vine Stratum = all woody vines ≥ 1m in height.
c. T = Trace; rare (<1%) M = Moderate; scattered plants (5 - <25%) S = Seedling B = Bolt Bd = Bud
L = Low; occasional (1 - <5%) H = High; fairly dense (25 - 100%) Fl = Flower SS = Seed Set M = Mature
Comments:
NRG S. Norwalk Harbor 8/31/2016
Norwalk Fairfield CT A. Froonjian
Plot WSD-4E is located where the proposed pilot soil remediation project route enters wetland W5 in order to access WSD-4.
WSD-4E 4 20 100
0 15 95 0
817,684.24589,086.77
0600 - Connecticut NAD 1983 Norwalk South, CT-NY 7.5 minute series
Plot ID: 20 20 400
Scientific Name
Shrub Iva frutescens IVFR H M
0
Dominance Test
Dominant
PlantbSpecies Observed USDA
Mapping
Symbol
Cover
Classc
Growth
Staged
Species
Percent
Cover
Stratum
Percent
Cover
Percent
Dominance
of Stratum
8 15 53%
Shrub Morella pensylvanica MOPE6 H Fl 4 15 27%
Shrub Betula populifolia BEPO M Fl 3 15 20%
Herb Phragmites australis PHAU7 H M 45 95 47%
Herb Spartina patens SPPA H B 33 95 35%
15 95 16%
Herb Pluchea odorata PLOD L M 2
Herb Panicum virgatum PAVI2 M Fl
95 2%
Dominant Plants are those species that when totalled comprise
the first 50 percent of their vegetation stratum, as well as
those individual species that comprise 20 percent of their
vegetation stratum.
Cover
Classes:
d. Growth
Stages:
New England Wetland Technologies, LLC Invasive Species Monitoring Form, Version 1.0 (2016)

Invasive Species Monitoring Form
Client: Site: Date:
Municipality: County: State: Investigator(s):
Northing (Y): Easting (X): U.S. Survey Feet Meters
Zone: Datum: USGS Quadrangle(s):
Plot Length: Plot Width: ft. m Plot Area: ft.2
m2
1% of plot = 5% of plot = 25% of plot = ft.2
m2
Vegetation Strata Percent Covera Tree: Sapling/Shrub: Herb: Woody Vine: Non-vascular:
Stratum Invasive Yes No
( ÷ ) x 100=
a. Vegetation Strata (per U.S. Army Corps of Engineers ): b.
Tree Stratum = Woody plants ≥ 8cm diameter at breast height (dbh), regardless of height;
Sapling/Shrub Stratum = Woody plants < 8cm dbh and ≥ 1m tall;
Herb Stratum = All hebaceous plants, regardless of height, and woody plants < 1m tall;
Woody Vine Stratum = all woody vines ≥ 1m in height.
c. T = Trace; rare (<1%) M = Moderate; scattered plants (5 - <25%) S = Seedling B = Bolt Bd = Bud
L = Low; occasional (1 - <5%) H = High; fairly dense (25 - 100%) Fl = Flower SS = Seed Set M = Mature
Comments:
NRG S. Norwalk Harbor 8/31/2016
Norwalk Fairfield CT A. Froonjian
WSD-6 is within wetland W4. Most of the wetland is a pure colony of Phragmites australis .
WSD-6 20 100 500
0 0 100 0
817,930.43588,845.19
0600 - Connecticut NAD 1983 Norwalk South, CT-NY 7.5 minute series
Plot ID: 20 100 2,000
Scientific Name
H Phragmites australis PHAU7 H M
0
Dominance Test
Dominant
PlantbSpecies Observed USDA
Mapping
Symbol
Cover
Classc
Growth
Staged
Species
Percent
Cover
Stratum
Percent
Cover
Percent
Dominance
of Stratum
100 100 100%
Dominant Plants are those species that when totalled comprise
the first 50 percent of their vegetation stratum, as well as
those individual species that comprise 20 percent of their
vegetation stratum.
Cover
Classes:
d. Growth
Stages:
New England Wetland Technologies, LLC Invasive Species Monitoring Form, Version 1.0 (2016)

Invasive Species Monitoring Form
Client: Site: Date:
Municipality: County: State: Investigator(s):
Northing (Y): Easting (X): U.S. Survey Feet Meters
Zone: Datum: USGS Quadrangle(s):
Plot Length: Plot Width: ft. m Plot Area: ft.2
m2
1% of plot = 5% of plot = 25% of plot = ft.2
m2
Vegetation Strata Percent Covera Tree: Sapling/Shrub: Herb: Woody Vine: Non-vascular:
Stratum Invasive Yes No
( ÷ ) x 100=
( ÷ ) x 100=
( ÷ ) x 100=
( ÷ ) x 100=
( ÷ ) x 100=
( ÷ ) x 100=
( ÷ ) x 100=
( ÷ ) x 100=
( ÷ ) x 100=
a. Vegetation Strata (per U.S. Army Corps of Engineers ): b.
Tree Stratum = Woody plants ≥ 8cm diameter at breast height (dbh), regardless of height;
Sapling/Shrub Stratum = Woody plants < 8cm dbh and ≥ 1m tall;
Herb Stratum = All hebaceous plants, regardless of height, and woody plants < 1m tall;
Woody Vine Stratum = all woody vines ≥ 1m in height.
c. T = Trace; rare (<1%) M = Moderate; scattered plants (5 - <25%) S = Seedling B = Bolt Bd = Bud
L = Low; occasional (1 - <5%) H = High; fairly dense (25 - 100%) Fl = Flower SS = Seed Set M = Mature
Comments:
NRG S. Norwalk Harbor 8/31/2016
Norwalk Fairfield CT A. Froonjian
Plot WSD-6N is located where the proposed pilot soil remediation project route enters wetland W4 in order to access WSD-6.
WSD-6N 4 20 100
20 90 95 0
817,950.83588,926.68
0600 - Connecticut NAD 1983 Norwalk South, CT-NY 7.5 minute series
Plot ID: 20 20 400
Scientific Name
Tree Betula populifolia BEPO M M
0
Dominance Test
Dominant
PlantbSpecies Observed USDA
Mapping
Symbol
Cover
Classc
Growth
Staged
Species
Percent
Cover
Stratum
Percent
Cover
Percent
Dominance
of Stratum
20 20 100%
Shrub Morella pensylvanica MOPE6 M M 20 90 22%
Shrub Elaeagnus umbellata ELUM H M 65 90 72%
Shrub Rubus phoenicolasius RUPH T B 1 90 1%
Herb Phragmites australis PHAU7 L M 4 95 4%
20 95 21%
Herb Panicum virgatum PAVI2 H SS 65
Herb Dichanthelium acuminatum DIAC2 M M
95 68%
Herb Cyperus strigosus CYST T SS 1 95 1%
Herb Senecio hieraciifolius SEHI3 L B 5 95 5%
Dominant Plants are those species that when totalled comprise
the first 50 percent of their vegetation stratum, as well as
those individual species that comprise 20 percent of their
vegetation stratum.
Cover
Classes:
d. Growth
Stages:
New England Wetland Technologies, LLC Invasive Species Monitoring Form, Version 1.0 (2016)