generated by plan4learning.com 1 of 33 october 18, 2021 2
TRANSCRIPT

Fort Worth Independent School District
163 Bruce Shulkey Elementary School
2021-2022 Campus Improvement Plan
163 Bruce Shulkey Elementary SchoolGenerated by Plan4Learning.com 1 of 33 October 18, 2021 2:41 PM

Mission StatementWe, the staff, students and parents of Bruce Shulkey, believe that all students can and will learn. We believe that our school is a place where teaching and learning takes place.
Our school has a positive atmosphere that is conducive to learning. We will provide quality and equity in instruction. We have high expectations for our students. Our mission isto provide all students with a comprehensive knowledge base, critical thinking skills, and courage to make decisions that create a better future.
VisionIgniting a passion for learning in every student.
163 Bruce Shulkey Elementary SchoolGenerated by Plan4Learning.com 2 of 33 October 18, 2021 2:41 PM

Table of Contents
Comprehensive Needs Assessment 4Demographics 4Student Learning 5School Processes & Programs 9Perceptions 11
Priority Problem Statements 13Comprehensive Needs Assessment Data Documentation 14Goals 15
Goal 1: Early Literacy Increase the percentage of 3rd grade students who score at meets grade level or above on STAAR Reading from 34% to 47% by August 2024. 16Goal 2: Early Math Increase the percentage of 3rd grade students who score at meets grade level or above on STAAR Mathematics from 34% to 45% by August 2024. 21Goal 3: CCMR Increase the percentage of students graduating with a CCMR indicator from 43% to 48% by June 2024. 24Goal 4: Learning Environment (based on the BOE constraints) Ensure all students have access to a safe, supportive and culturally responsive learning environment. 26
Site-Based Decision Making Committee 31Campus Funding Summary 32
163 Bruce Shulkey Elementary SchoolGenerated by Plan4Learning.com 3 of 33 October 18, 2021 2:41 PM
Comprehensive Needs AssessmentRevised/Approved: September 9, 2021
Demographics
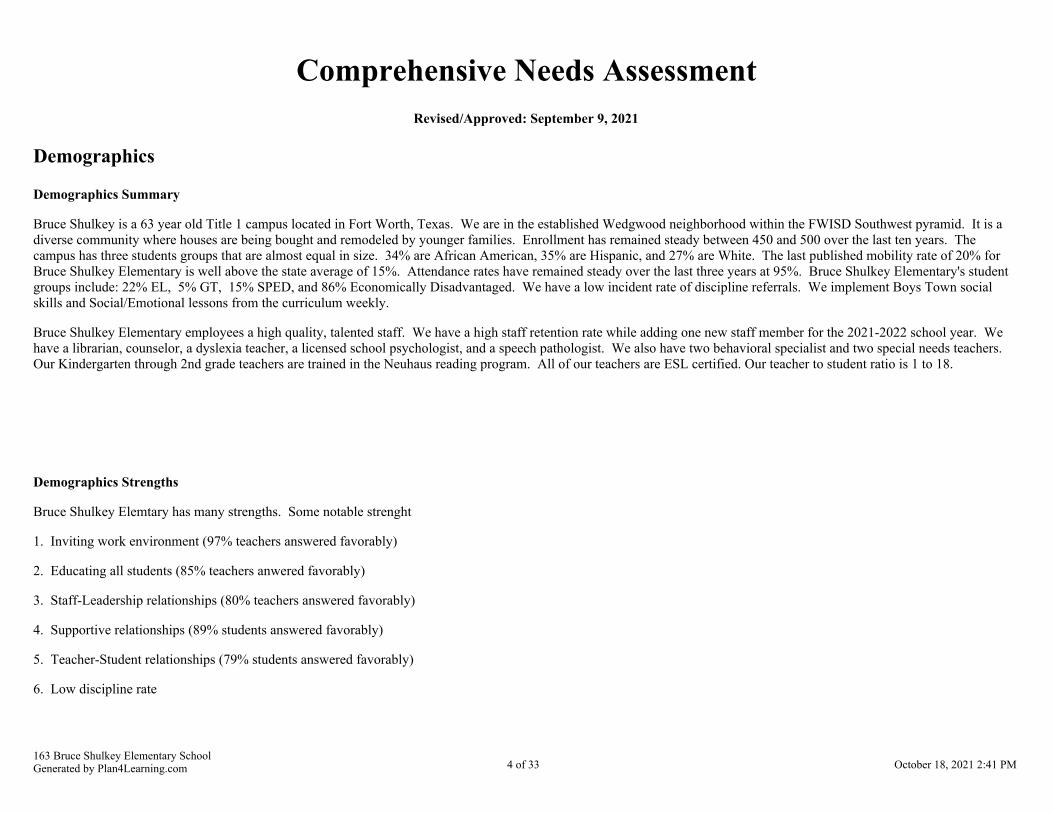
Demographics Summary
Bruce Shulkey is a 63 year old Title 1 campus located in Fort Worth, Texas. We are in the established Wedgwood neighborhood within the FWISD Southwest pyramid. It is adiverse community where houses are being bought and remodeled by younger families. Enrollment has remained steady between 450 and 500 over the last ten years. Thecampus has three students groups that are almost equal in size. 34% are African American, 35% are Hispanic, and 27% are White. The last published mobility rate of 20% forBruce Shulkey Elementary is well above the state average of 15%. Attendance rates have remained steady over the last three years at 95%. Bruce Shulkey Elementary's studentgroups include: 22% EL, 5% GT, 15% SPED, and 86% Economically Disadvantaged. We have a low incident rate of discipline referrals. We implement Boys Town socialskills and Social/Emotional lessons from the curriculum weekly.
Bruce Shulkey Elementary employees a high quality, talented staff. We have a high staff retention rate while adding one new staff member for the 2021-2022 school year. Wehave a librarian, counselor, a dyslexia teacher, a licensed school psychologist, and a speech pathologist. We also have two behavioral specialist and two special needs teachers. Our Kindergarten through 2nd grade teachers are trained in the Neuhaus reading program. All of our teachers are ESL certified. Our teacher to student ratio is 1 to 18.
Demographics Strengths
Bruce Shulkey Elemtary has many strengths. Some notable strenght
1. Inviting work environment (97% teachers answered favorably)
2. Educating all students (85% teachers anwered favorably)
3. Staff-Leadership relationships (80% teachers answered favorably)
4. Supportive relationships (89% students answered favorably)
5. Teacher-Student relationships (79% students answered favorably)
6. Low discipline rate
163 Bruce Shulkey Elementary SchoolGenerated by Plan4Learning.com 4 of 33 October 18, 2021 2:41 PM

Problem Statements Identifying Demographics Needs
Problem Statement 1 (Prioritized): In the 20-21 school year attendance rate has dropped school wide from 96% to 93% as of April. Root Cause: Lack of systems and protocolsin place to accurately monitor attendance with fidelity.
163 Bruce Shulkey Elementary SchoolGenerated by Plan4Learning.com 5 of 33 October 18, 2021 2:41 PM

Student Learning
Student Learning Summary
Bruce Shulkey met standard on 2019 STAAR and earned a "B" according to the state accountability rating system. Our domain ratings from 2019 are as follows: Overall 82%;Student Achievement 72%, School Progress 83%, and Closing the Gap 79%. We earned four distinction designations in ELA Reading, Comparative closing the gap,Comparative Academic growth, and post-secondary readiness.
The table below represents our 2018 and 2019 STAAR 3rd Grade Reading scores. We tested about the same number of students and had growth of 8% in the meets and 6% in themasters categories. We had the greatest gains in the meets category. Trends to address are lack of growth Hispanic in all categories and African American at approaches.
163 - Bruce Shulkey ES NumberTested
% ApproachesGrade Level
% Meets Grade Level % Masters Grade Level
Subject Grade LanguageStudent Group
2018 2019 2018 2019 Diff 2018 2019 Diff 2018 2019 Diff
Reading 03 E
AllStudents
65 67 66 67 1 31 39 8 15 21 6
Hispanic 20 22 75 64 -11 55 36 -19 20 14 -6Asian 8 8 88 75 -13 25 25 0 25 25 0AfricanAmerican
18 20 61 55 -6 6 25 19 6 15 9
White 18 17 56 82 26 33 65 32 17 35 18Two OrMore
1
ED 57 61 63 66 3 28 34 6 16 20 4EL 26 23 62 65 3 19 30 11 15 26 11SE 5 12 20 50 30 20 33 13 0 8 8
163 Bruce Shulkey Elementary SchoolGenerated by Plan4Learning.com 6 of 33 October 18, 2021 2:41 PM

Below is our MAP Reading Scores from BOY to MOY for all grade levels and student groups. Our English Language Learners outperformed all other groups, with an averageincrease of 5.8 RIT points. A trend to address is the small growth in the African American, Hispanic, and Economic Disadvantage student groups.
Below is our MAP Math Scores from BOY to MOY for all grade levels and student groups. Our average RIT score growth was 5.5. A trend to address is the growth of theAfrican American, Hispanic, and Special Education student groups.
163 Bruce Shulkey Elementary SchoolGenerated by Plan4Learning.com 7 of 33 October 18, 2021 2:41 PM

Compare eoy cycle reports (report card) passing percentages with passing rate on STAAR
Student Learning Strengths
Bruce Shulkey Elementary have many strengths. Some of the most student learning strengths include:
1. 3rd Grade Math exceeded grade level norms projected growth for MAP.
2. 53% of 5th Graders met projected growth for MAP Growth from BOY to MOY for Reading.
3. EL students made the highest projected growth at 43% for Reading from BOY to MOY on the MAP Growth test.
163 Bruce Shulkey Elementary SchoolGenerated by Plan4Learning.com 8 of 33 October 18, 2021 2:41 PM

Problem Statements Identifying Student Learning Needs
Problem Statement 1 (Prioritized): According to 3rd Grade MAP Growth Reading MOY scores, when looking at the percent of students who met their growth projection,White performed at 47% and Hispanic performed at 44%, and African Americans at 40%. Root Cause: It has been difficult to shift the mind set from Balance Literacy to the newdistrict literacy framework and the four fundamentals of Literacy instruction.
163 Bruce Shulkey Elementary SchoolGenerated by Plan4Learning.com 9 of 33 October 18, 2021 2:41 PM
School Processes & Programs
School Processes & Programs Summary
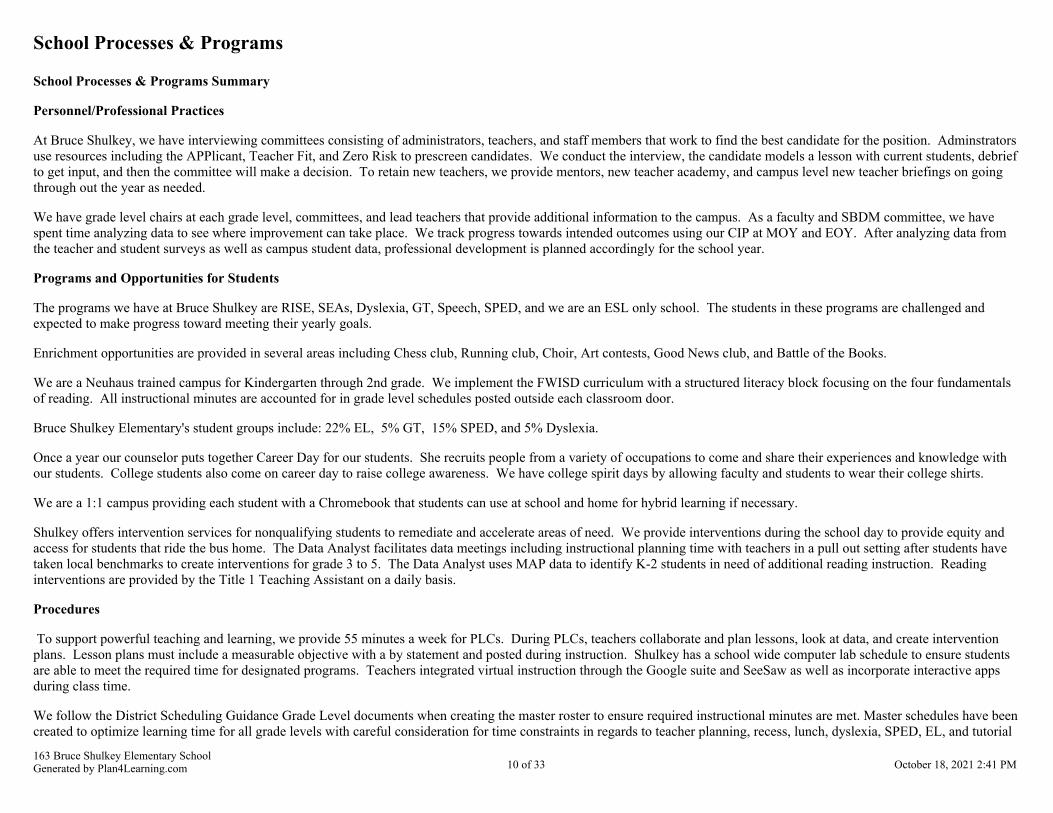
Personnel/Professional Practices
At Bruce Shulkey, we have interviewing committees consisting of administrators, teachers, and staff members that work to find the best candidate for the position. Adminstratorsuse resources including the APPlicant, Teacher Fit, and Zero Risk to prescreen candidates. We conduct the interview, the candidate models a lesson with current students, debriefto get input, and then the committee will make a decision. To retain new teachers, we provide mentors, new teacher academy, and campus level new teacher briefings on goingthrough out the year as needed.
We have grade level chairs at each grade level, committees, and lead teachers that provide additional information to the campus. As a faculty and SBDM committee, we havespent time analyzing data to see where improvement can take place. We track progress towards intended outcomes using our CIP at MOY and EOY. After analyzing data fromthe teacher and student surveys as well as campus student data, professional development is planned accordingly for the school year.
Programs and Opportunities for Students
The programs we have at Bruce Shulkey are RISE, SEAs, Dyslexia, GT, Speech, SPED, and we are an ESL only school. The students in these programs are challenged andexpected to make progress toward meeting their yearly goals.
Enrichment opportunities are provided in several areas including Chess club, Running club, Choir, Art contests, Good News club, and Battle of the Books.
We are a Neuhaus trained campus for Kindergarten through 2nd grade. We implement the FWISD curriculum with a structured literacy block focusing on the four fundamentalsof reading. All instructional minutes are accounted for in grade level schedules posted outside each classroom door.
Bruce Shulkey Elementary's student groups include: 22% EL, 5% GT, 15% SPED, and 5% Dyslexia.
Once a year our counselor puts together Career Day for our students. She recruits people from a variety of occupations to come and share their experiences and knowledge withour students. College students also come on career day to raise college awareness. We have college spirit days by allowing faculty and students to wear their college shirts.
We are a 1:1 campus providing each student with a Chromebook that students can use at school and home for hybrid learning if necessary.
Shulkey offers intervention services for nonqualifying students to remediate and accelerate areas of need. We provide interventions during the school day to provide equity andaccess for students that ride the bus home. The Data Analyst facilitates data meetings including instructional planning time with teachers in a pull out setting after students havetaken local benchmarks to create interventions for grade 3 to 5. The Data Analyst uses MAP data to identify K-2 students in need of additional reading instruction. Readinginterventions are provided by the Title 1 Teaching Assistant on a daily basis.
Procedures
To support powerful teaching and learning, we provide 55 minutes a week for PLCs. During PLCs, teachers collaborate and plan lessons, look at data, and create interventionplans. Lesson plans must include a measurable objective with a by statement and posted during instruction. Shulkey has a school wide computer lab schedule to ensure studentsare able to meet the required time for designated programs. Teachers integrated virtual instruction through the Google suite and SeeSaw as well as incorporate interactive appsduring class time.
We follow the District Scheduling Guidance Grade Level documents when creating the master roster to ensure required instructional minutes are met. Master schedules have beencreated to optimize learning time for all grade levels with careful consideration for time constraints in regards to teacher planning, recess, lunch, dyslexia, SPED, EL, and tutorial
163 Bruce Shulkey Elementary SchoolGenerated by Plan4Learning.com 10 of 33 October 18, 2021 2:41 PM

pull outs.
Bruce Shulkey has incorporated the Boys Town program to assist students with their social and emotional needs. All teachers had two days of restorative training leading to adecrease in student discipline referrals and a decrease in out of school suspensions.
Due to necessity of increased health safety protocols during the pandemic, we created the "Bruce Shulkey Elementary Back to School In-Person Learning Plan Handbook". Thehandbook included COVID-19 precautions, new procedures for arrival and dismissal, transitions within the school, and transportation and nutritional services protocols.
School Processes & Programs Strengths
Bruce Shulkey Elementary has many strengths. Some of the notable areas include:
1. Low teacher attrition rate, thus higher years of experience.
2. Explicit phonics instruction for grades K-2 supplemental to the reading curriculum through the Neuhaus program.
3. Technology-smart boards in every classroom, 1:1 Chromebooks for students, incorporation of interactive apps and assessments, computer lab, and technology carts.
4. Targeted PLCs focused on data and standards alignment.
5. Professional Development that is focused on Blended and virtual learning best practices.
6. Implementation of a detailed and specific COVID plan; instructional, wellness (vision van and telehealth), and safety.
7. Resources purchased to enhance and ease the transition to virtual and in person learning (cordless microphones, ziggies, cameras for computers)
Problem Statements Identifying School Processes & Programs Needs
Problem Statement 1 (Prioritized): According to 3rd Grade MAP Growth Math MOY scores, when looking at the percent of students who met their growth projection, Whiteperformed at 53% and Hispanic performed at 56%, and African Americans at 20%. Root Cause: The lack of Racial awareness and tailoring instruction to meet the needs of AAstudents.
163 Bruce Shulkey Elementary SchoolGenerated by Plan4Learning.com 11 of 33 October 18, 2021 2:41 PM

Perceptions
Perceptions Summary
Bruce Shulkey has been an established part of the Wedgwood community since its opening in 1958. Parent commitment to the school and support of teachers and staff is averagedue to the percentage of families that struggle financially, parent education, and language barriers. These factors sometimes hinder parent involvement and support directly to thedifferent aspects of the school. We have the support of several community churches which provide mentors, after school programs, uniforms, school supplies, and teachergoodies.
Students
Attendance for the 2019-2020 school year was similiar amongst all seven ethinicity group with the average being 96%. The average attendance for all groups was 96%, Hispanic95%, African American 96%, White 95%, Two or More 96%, Other 97%, LEP 97%, and SE 95%.
For the 2020-2021 school year, we have had two suspenions, both being African American students for fighting. Overall, Shulkey has a low number of disciplinary referrals. Reduction in conflict is due to teacher training in Restorative practices, implementation of Boys Town Social Skills program, and daily "Words of Wisdom" during morningannouncements.
Our student survey results indicated we are strong in the areas of: Supportive relationships, teacher-student relationships, and Sense of belonging. Areas of improvement are:Engagement and Emotional regulation.
Staff Engagement
We employ high quality and talented staff with minimal turnover year to year. Collaboration and teamwork are at the heart of all we do and help contribute to a welcoming andsafe school environment. Teachers and staff create student centered classrooms that are highly engaging. Programs/Clubs are offered at our campus which helps build a deeperstudent/family connection and promote attendance and academic achievement. We have a Family Communications Liaison that provides support and coordinates volunteeropportunities. Shulkey provides strong, top quality customer service to all stakeholders. Our survey results indicated we are strong in the areas of: Inviting work environment,Staff-leadership relationships, and Educating all students. Areas of improvement are: Faculty growth mindset and Cultural awareness.
Parent/Guardian/Community Engagement
Parent/Guardian engagement is measured by logins to Parent Portal, number of parents participating in family education opportunities, and PTA memberships. Shulkey has anSBDM committee comprising of business leaders, teachers, parents, community members, as well as district and local administrators. Shulkey has open communication viaBlackboard messages, newsletters, flyers, social media, website, and email.
Our student survey results indicated we are strong in the areas of: Supportive relationships, teacher-student relationships, and Sense of belonging. Areas of improvement are:Engagement and Emotional regulation.
Perceptions Strengths
Bruce Shulkey Elementary has many strengths. Some notable strenghts include:
163 Bruce Shulkey Elementary SchoolGenerated by Plan4Learning.com 12 of 33 October 18, 2021 2:41 PM

Parent Liason that works to keep strong ties and open communication with families89% of students feel supported by their relationship with friends, family, and adults at the school79% of students feel a stong social connection between themselves and their teachers within and beyond the classroom.97% of teachers feel the school has an inviting work environment80% of teachers feel there are strong staff-leadership relationship with school leaders.
Problem Statements Identifying Perceptions Needs
Problem Statement 1 (Prioritized): Bruce Shulkey has a lack of direct parental involvement with only 9 members (non staff) active in PTA, and 282 parents are registered inparental portal. Root Cause: Lack of communication that reaches parents in their native language, in their preferred modality of receiving information, and centered on theirneeds.
163 Bruce Shulkey Elementary SchoolGenerated by Plan4Learning.com 13 of 33 October 18, 2021 2:41 PM

Priority Problem StatementsProblem Statement 1: In the 20-21 school year attendance rate has dropped school wide from 96% to 93% as of April.Root Cause 1: Lack of systems and protocols in place to accurately monitor attendance with fidelity.Problem Statement 1 Areas: Demographics
Problem Statement 2: According to 3rd Grade MAP Growth Reading MOY scores, when looking at the percent of students who met their growth projection, White performed at47% and Hispanic performed at 44%, and African Americans at 40%.Root Cause 2: It has been difficult to shift the mind set from Balance Literacy to the new district literacy framework and the four fundamentals of Literacy instruction.Problem Statement 2 Areas: Student Learning
Problem Statement 3: According to 3rd Grade MAP Growth Math MOY scores, when looking at the percent of students who met their growth projection, White performed at53% and Hispanic performed at 56%, and African Americans at 20%.Root Cause 3: The lack of Racial awareness and tailoring instruction to meet the needs of AA students.Problem Statement 3 Areas: School Processes & Programs
Problem Statement 4: Bruce Shulkey has a lack of direct parental involvement with only 9 members (non staff) active in PTA, and 282 parents are registered in parental portal.Root Cause 4: Lack of communication that reaches parents in their native language, in their preferred modality of receiving information, and centered on their needs.Problem Statement 4 Areas: Perceptions
163 Bruce Shulkey Elementary SchoolGenerated by Plan4Learning.com 14 of 33 October 18, 2021 2:41 PM

Comprehensive Needs Assessment Data DocumentationThe following data were used to verify the comprehensive needs assessment analysis:
Accountability Data
Texas Academic Performance Report (TAPR) data
Student Data: Assessments
Local diagnostic reading assessment dataLocal benchmark or common assessments dataTexas approved PreK - 2nd grade assessment data
Student Data: Student Groups
Race and ethnicity data, including number of students, academic achievement, discipline, attendance, and progressSpecial programs data, including number of students, academic achievement, discipline, attendance, and progressEconomically Disadvantaged / Non-economically disadvantaged performance, progress, and participation dataSpecial education/non-special education population including discipline, progress and participation dataAt-risk/non-at-risk population including performance, progress, discipline, attendance, and mobility dataEL/non-EL or LEP data, including academic achievement, progress, support and accommodation needs, race, ethnicity, gender, etc.Gifted and talented data
Student Data: Behavior and Other Indicators
Attendance dataMobility rate, including longitudinal dataDiscipline recordsStudent surveys and/or other feedbackClass size averages by grade and subject
Employee Data
Staff surveys and/or other feedbackTeacher/Student RatioState certified and high quality staff data
163 Bruce Shulkey Elementary SchoolGenerated by Plan4Learning.com 15 of 33 October 18, 2021 2:41 PM

GoalsRevised/Approved: September 9, 2021
Goal 1: Early Literacy Increase the percentage of 3rd grade students who score at meets grade level or above on STAAR Reading from 34% to 47% by August 2024.
Performance Objective 1: Increase the percentage of PK students who score On Track on Circle Phonological Awareness in English from 77% to 82%by May 2022. Increase the percentage of PK students who score On Track on Circle Phonological Awareness in Spanish from __% to __% by May 2022. (NotApplicable)Increase the percentage of African American students or the student group that is most marginalized by instruction on our campus (gender, race, program,other) from 27% to 37% by May 2022.
Evaluation Data Sources: CLI
Strategy 1 Details ReviewsStrategy 1: Develop teacher capacity and home-school communication to improve culturally responsive teaching toensure high academic standards and expectations are held for all students during the implementation of the LiteracyFramework and Creative Curriculum.
Strategy's Expected Result/Impact: Increase in AA percentage on CLI by 5%Cultural Awareness on the Teacher Panorama survey will increase from 56% to 70%.Staff Responsible for Monitoring: Principal and Assistant PrincipalProblem Statements: Student Learning 1
Formative SummativeNov Jan Mar June
Strategy 2 Details ReviewsStrategy 2: Develop capacity of the ILT by implementing protocols for distributive leadership in the areas ofinstructional planning, school culture, and observation and feedback while monitoring progress towards the attainmentof student achievement goals.
Strategy's Expected Result/Impact: Instructional planning meetings will be prescheduled for the year toprovide a day of pull out planning for teachers with the DA.Increase in culturally responsive teaching as measured by an increase on the Panorama survey in the area ofCulture Awareness and Action by 10%.100% completion rate of teacher walk throughs per proration guide by the EOY 2022.Staff Responsible for Monitoring: Principal, Assistant Principal, and Data AnalystProblem Statements: Student Learning 1
Formative SummativeNov Jan Mar June
No Progress Accomplished Continue/Modify Discontinue
163 Bruce Shulkey Elementary SchoolGenerated by Plan4Learning.com 16 of 33 October 18, 2021 2:41 PM

Performance Objective 1 Problem Statements:
Student LearningProblem Statement 1: According to 3rd Grade MAP Growth Reading MOY scores, when looking at the percent of students who met their growth projection, White performedat 47% and Hispanic performed at 44%, and African Americans at 40%. Root Cause: It has been difficult to shift the mind set from Balance Literacy to the new district literacyframework and the four fundamentals of Literacy instruction.
163 Bruce Shulkey Elementary SchoolGenerated by Plan4Learning.com 17 of 33 October 18, 2021 2:41 PM
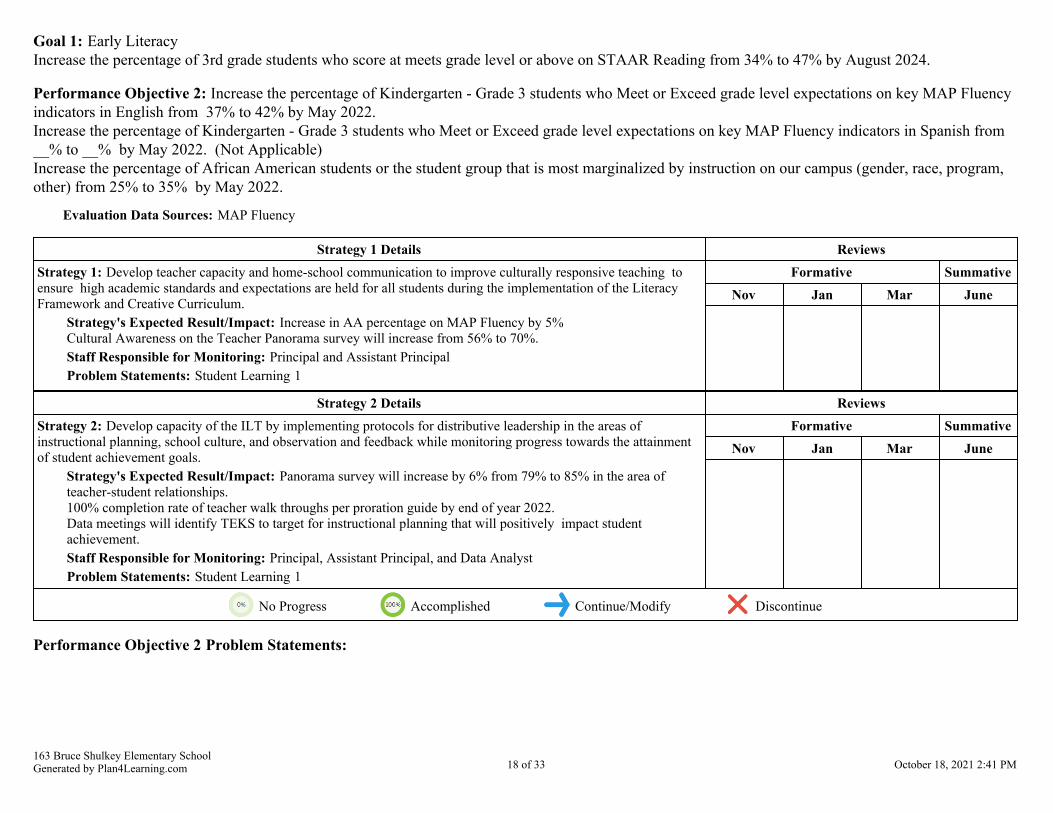
Goal 1: Early Literacy Increase the percentage of 3rd grade students who score at meets grade level or above on STAAR Reading from 34% to 47% by August 2024.
Performance Objective 2: Increase the percentage of Kindergarten - Grade 3 students who Meet or Exceed grade level expectations on key MAP Fluencyindicators in English from 37% to 42% by May 2022. Increase the percentage of Kindergarten - Grade 3 students who Meet or Exceed grade level expectations on key MAP Fluency indicators in Spanish from__% to __% by May 2022. (Not Applicable)Increase the percentage of African American students or the student group that is most marginalized by instruction on our campus (gender, race, program,other) from 25% to 35% by May 2022.
Evaluation Data Sources: MAP Fluency
Strategy 1 Details ReviewsStrategy 1: Develop teacher capacity and home-school communication to improve culturally responsive teaching toensure high academic standards and expectations are held for all students during the implementation of the LiteracyFramework and Creative Curriculum.
Strategy's Expected Result/Impact: Increase in AA percentage on MAP Fluency by 5%Cultural Awareness on the Teacher Panorama survey will increase from 56% to 70%.Staff Responsible for Monitoring: Principal and Assistant PrincipalProblem Statements: Student Learning 1
Formative SummativeNov Jan Mar June
Strategy 2 Details ReviewsStrategy 2: Develop capacity of the ILT by implementing protocols for distributive leadership in the areas ofinstructional planning, school culture, and observation and feedback while monitoring progress towards the attainmentof student achievement goals.
Strategy's Expected Result/Impact: Panorama survey will increase by 6% from 79% to 85% in the area ofteacher-student relationships. 100% completion rate of teacher walk throughs per proration guide by end of year 2022.Data meetings will identify TEKS to target for instructional planning that will positively impact studentachievement.Staff Responsible for Monitoring: Principal, Assistant Principal, and Data AnalystProblem Statements: Student Learning 1
Formative SummativeNov Jan Mar June
No Progress Accomplished Continue/Modify Discontinue
Performance Objective 2 Problem Statements:
163 Bruce Shulkey Elementary SchoolGenerated by Plan4Learning.com 18 of 33 October 18, 2021 2:41 PM

Student LearningProblem Statement 1: According to 3rd Grade MAP Growth Reading MOY scores, when looking at the percent of students who met their growth projection, White performedat 47% and Hispanic performed at 44%, and African Americans at 40%. Root Cause: It has been difficult to shift the mind set from Balance Literacy to the new district literacyframework and the four fundamentals of Literacy instruction.
163 Bruce Shulkey Elementary SchoolGenerated by Plan4Learning.com 19 of 33 October 18, 2021 2:41 PM
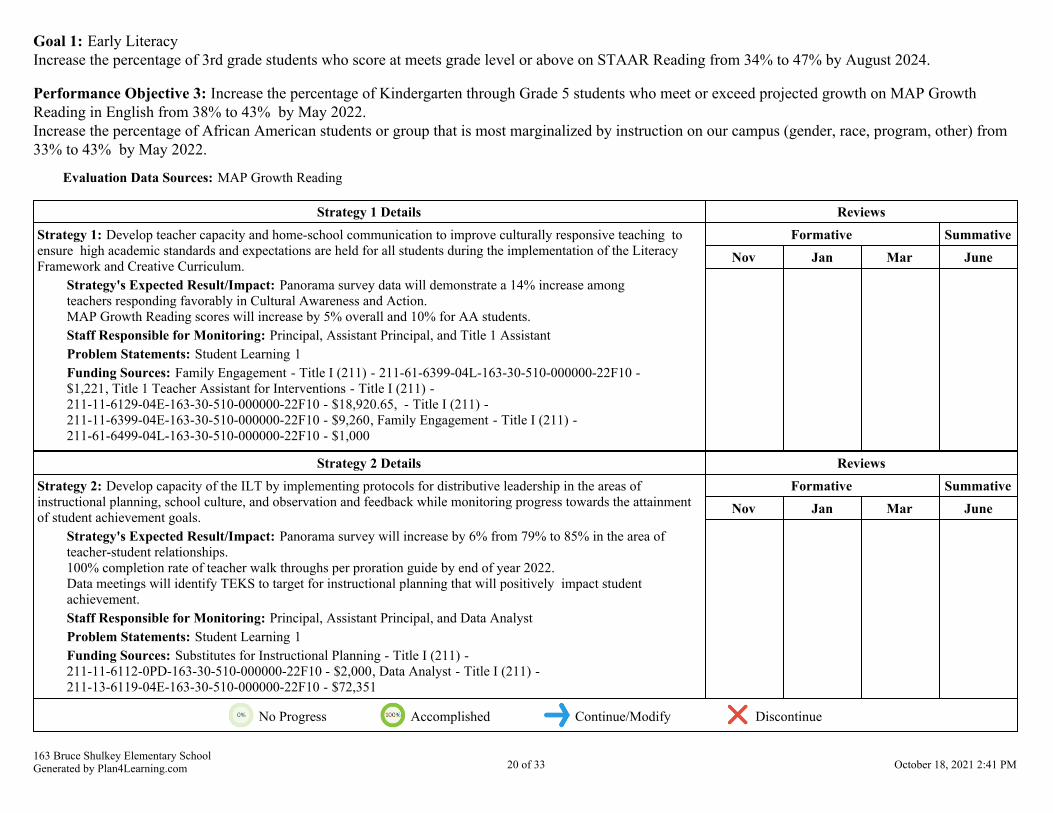
Goal 1: Early Literacy Increase the percentage of 3rd grade students who score at meets grade level or above on STAAR Reading from 34% to 47% by August 2024.
Performance Objective 3: Increase the percentage of Kindergarten through Grade 5 students who meet or exceed projected growth on MAP GrowthReading in English from 38% to 43% by May 2022. Increase the percentage of African American students or group that is most marginalized by instruction on our campus (gender, race, program, other) from33% to 43% by May 2022.
Evaluation Data Sources: MAP Growth Reading
Strategy 1 Details ReviewsStrategy 1: Develop teacher capacity and home-school communication to improve culturally responsive teaching toensure high academic standards and expectations are held for all students during the implementation of the LiteracyFramework and Creative Curriculum.
Strategy's Expected Result/Impact: Panorama survey data will demonstrate a 14% increase amongteachers responding favorably in Cultural Awareness and Action.MAP Growth Reading scores will increase by 5% overall and 10% for AA students.Staff Responsible for Monitoring: Principal, Assistant Principal, and Title 1 AssistantProblem Statements: Student Learning 1Funding Sources: Family Engagement - Title I (211) - 211-61-6399-04L-163-30-510-000000-22F10 - $1,221, Title 1 Teacher Assistant for Interventions - Title I (211) - 211-11-6129-04E-163-30-510-000000-22F10 - $18,920.65, - Title I (211) - 211-11-6399-04E-163-30-510-000000-22F10 - $9,260, Family Engagement - Title I (211) - 211-61-6499-04L-163-30-510-000000-22F10 - $1,000
Formative SummativeNov Jan Mar June
Strategy 2 Details ReviewsStrategy 2: Develop capacity of the ILT by implementing protocols for distributive leadership in the areas ofinstructional planning, school culture, and observation and feedback while monitoring progress towards the attainmentof student achievement goals.
Strategy's Expected Result/Impact: Panorama survey will increase by 6% from 79% to 85% in the area ofteacher-student relationships. 100% completion rate of teacher walk throughs per proration guide by end of year 2022.Data meetings will identify TEKS to target for instructional planning that will positively impact studentachievement.Staff Responsible for Monitoring: Principal, Assistant Principal, and Data AnalystProblem Statements: Student Learning 1Funding Sources: Substitutes for Instructional Planning - Title I (211) - 211-11-6112-0PD-163-30-510-000000-22F10 - $2,000, Data Analyst - Title I (211) - 211-13-6119-04E-163-30-510-000000-22F10 - $72,351
Formative SummativeNov Jan Mar June
No Progress Accomplished Continue/Modify Discontinue
163 Bruce Shulkey Elementary SchoolGenerated by Plan4Learning.com 20 of 33 October 18, 2021 2:41 PM
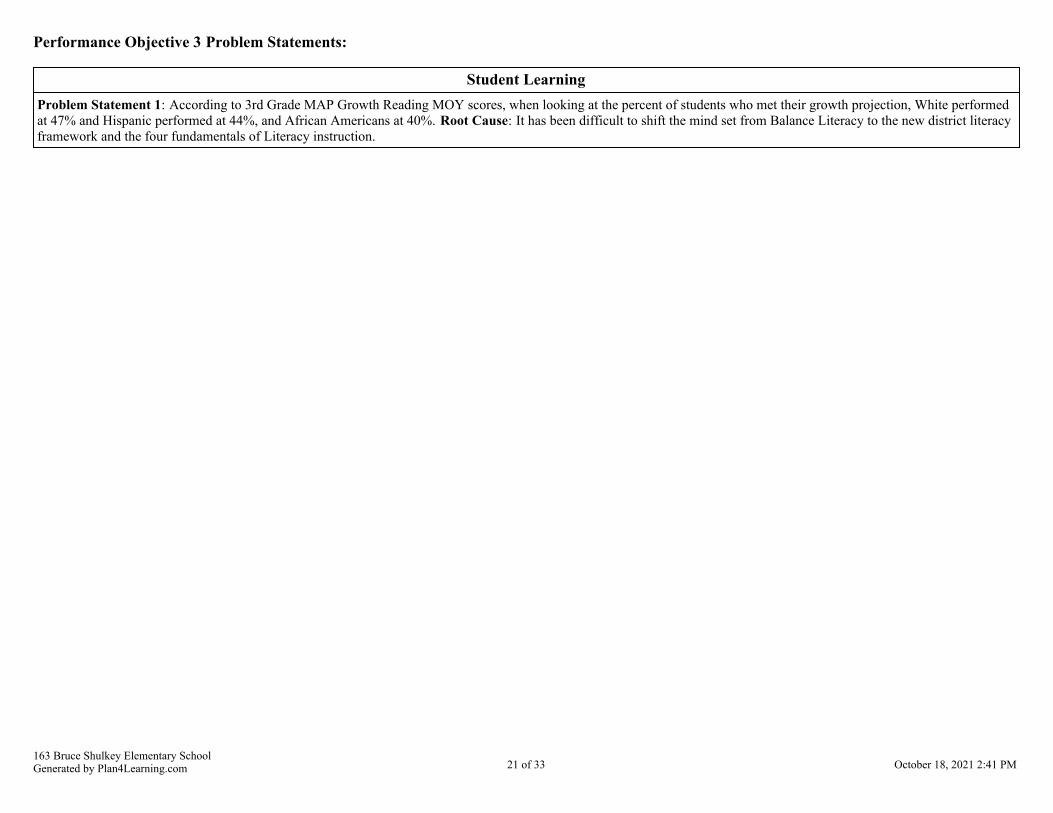
Performance Objective 3 Problem Statements:
Student LearningProblem Statement 1: According to 3rd Grade MAP Growth Reading MOY scores, when looking at the percent of students who met their growth projection, White performedat 47% and Hispanic performed at 44%, and African Americans at 40%. Root Cause: It has been difficult to shift the mind set from Balance Literacy to the new district literacyframework and the four fundamentals of Literacy instruction.
163 Bruce Shulkey Elementary SchoolGenerated by Plan4Learning.com 21 of 33 October 18, 2021 2:41 PM

Goal 2: Early Math Increase the percentage of 3rd grade students who score at meets grade level or above on STAAR Mathematics from 34% to 45% by August 2024.
Performance Objective 1: Increase the percentage of PK students who score On Track on Circle Math from 82% to 87% by May 2022. Increase the percentage of African American students or the student group that is most marginalized by instruction on our campus (gender, race, program,other) from 33% to 43% by May 2022.
Evaluation Data Sources: CLI
Strategy 1 Details ReviewsStrategy 1: Develop teacher capacity and home-school communication to improve culturally responsive teaching toensure high academic standards and expectations are held for all students during the implementation of CreativeCurriculum.
Strategy's Expected Result/Impact: Increase in AA percentage on CLI by 10%.Cultural Awareness on the Teacher Panorama survey will increase from 56% to 70%.Staff Responsible for Monitoring: Principal and Assistant PrincipalProblem Statements: School Processes & Programs 1
Formative SummativeNov Jan Mar June
Strategy 2 Details ReviewsStrategy 2: Develop capacity of the ILT by implementing protocols for distributive leadership in the areas ofinstructional planning, school culture, and observation and feedback while monitoring progress towards the attainmentof student achievement goals.
Strategy's Expected Result/Impact: Instructional planning meetings will be prescheduled for the year toprovide a day of pull out planning for teachers with the DA.Increase in culturally responsive teaching as measured by an increase on the Panorama survey in the area ofCulture Awareness and Action by 10%.100% completion rate of teacher walk throughs per proration guide by the EOY 2022.Staff Responsible for Monitoring: Principal, AP, Data AnalystsProblem Statements: School Processes & Programs 1
Formative SummativeNov Jan Mar June
No Progress Accomplished Continue/Modify Discontinue
Performance Objective 1 Problem Statements:
School Processes & ProgramsProblem Statement 1: According to 3rd Grade MAP Growth Math MOY scores, when looking at the percent of students who met their growth projection, White performed at53% and Hispanic performed at 56%, and African Americans at 20%. Root Cause: The lack of Racial awareness and tailoring instruction to meet the needs of AA students.
163 Bruce Shulkey Elementary SchoolGenerated by Plan4Learning.com 22 of 33 October 18, 2021 2:41 PM

Goal 2: Early Math Increase the percentage of 3rd grade students who score at meets grade level or above on STAAR Mathematics from 34% to 45% by August 2024.
Performance Objective 2: Increase the percentage of Kinder students who score On Track on TX-KEA Math from 22% to 27% by May 2022.Increase the percentage of African American students or the student group that is most marginalized by instruction on our campus (gender, race, program,other) from 0% to 10% by May 2022.
Evaluation Data Sources: TX-KEA
Strategy 1 Details ReviewsStrategy 1: Develop teacher capacity and home-school communication to improve culturally responsive teaching toensure high academic standards and expectations are held for all students through standards aligned planning and lessondelivery during the Math Block.
Strategy's Expected Result/Impact: Increase AA percentage on TX-KEA for students on track, in Math by10%.Cultural Awareness on the Teacher Panorama survey will increase from 56% to 70%.Staff Responsible for Monitoring: Principal, Assistant Principal, and teachersProblem Statements: School Processes & Programs 1
Formative SummativeNov Jan Mar June
Strategy 2 Details ReviewsStrategy 2: Develop capacity of the ILT by implementing protocols for distributive leadership in the areas ofinstructional planning, school culture, and observation and feedback while monitoring progress towards the attainmentof student achievement goals.
Strategy's Expected Result/Impact: Panorama survey will increase by 6% from 79% to 85% in the area ofteacher-student relationships. 100% completion rate of teacher walk throughs per proration guide by end of year 2022.Data meetings will identify TEKS to target for instructional planning that will positively impact studentachievement.Staff Responsible for Monitoring: Principal, Assistant Principal, and Data AnalystProblem Statements: School Processes & Programs 1
Formative SummativeNov Jan Mar June
No Progress Accomplished Continue/Modify Discontinue
Performance Objective 2 Problem Statements:
School Processes & ProgramsProblem Statement 1: According to 3rd Grade MAP Growth Math MOY scores, when looking at the percent of students who met their growth projection, White performed at53% and Hispanic performed at 56%, and African Americans at 20%. Root Cause: The lack of Racial awareness and tailoring instruction to meet the needs of AA students.
163 Bruce Shulkey Elementary SchoolGenerated by Plan4Learning.com 23 of 33 October 18, 2021 2:41 PM

Goal 2: Early Math Increase the percentage of 3rd grade students who score at meets grade level or above on STAAR Mathematics from 34% to 45% by August 2024.
Performance Objective 3: Increase the percentage of Kindergarten - Grade 5 students who Meet or Exceed projected growth on MAP Growth Math from35% to 40% by May 2022. Increase the percentage of African American students or the student group that is most marginalized by instruction on our campus (gender, race, program,other) from 29% to 39% by May 2022.
Evaluation Data Sources: MAP Growth Math
Strategy 1 Details ReviewsStrategy 1: Develop teacher capacity and home-school communication to improve culturally responsive teaching toensure high academic standards and expectations are held for all students through standards aligned planning and lessondelivery during the Math Block.
Strategy's Expected Result/Impact: Increase in MAP Growth Math by 5% for all students.AA will increase from 29% to 39%.Staff Responsible for Monitoring: Principal, Assistant Principal, Data Analyst, and TeachersProblem Statements: School Processes & Programs 1Funding Sources: - SCE (199 PIC 24) - 199-11-6399-001-163-24-313-000000- - $3,012, Tutors - Title I(211) - 211-11-6117-04E-163-30-510-000000-22F10 - $1,868.35
Formative SummativeNov Jan Mar June
Strategy 2 Details ReviewsStrategy 2: Develop capacity of the ILT by implementing protocols for distributive leadership in the areas ofinstructional planning, school culture, and observation and feedback while monitoring progress towards the attainmentof student achievement goals.
Strategy's Expected Result/Impact: Panorama survey will increase by 6% from 79% to 85% in the area ofteacher-student relationships. 100% completion rate of teacher walk throughs per proration guide by end of year 2022.Data meetings will identify TEKS to target for instructional planning that will positively impact studentachievement.Staff Responsible for Monitoring: Principal, Assistant Principal, and Data AnalystProblem Statements: School Processes & Programs 1
Formative SummativeNov Jan Mar June
No Progress Accomplished Continue/Modify Discontinue
Performance Objective 3 Problem Statements:
School Processes & ProgramsProblem Statement 1: According to 3rd Grade MAP Growth Math MOY scores, when looking at the percent of students who met their growth projection, White performed at53% and Hispanic performed at 56%, and African Americans at 20%. Root Cause: The lack of Racial awareness and tailoring instruction to meet the needs of AA students.
163 Bruce Shulkey Elementary SchoolGenerated by Plan4Learning.com 24 of 33 October 18, 2021 2:41 PM
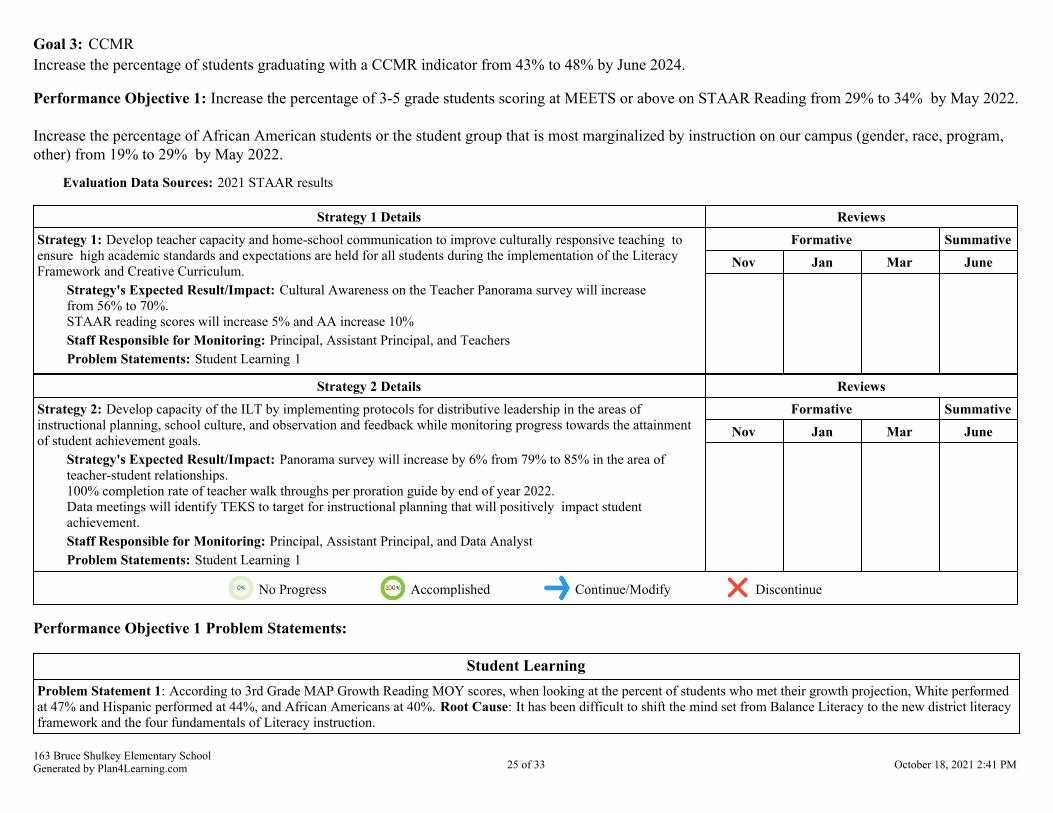
Goal 3: CCMR Increase the percentage of students graduating with a CCMR indicator from 43% to 48% by June 2024.
Performance Objective 1: Increase the percentage of 3-5 grade students scoring at MEETS or above on STAAR Reading from 29% to 34% by May 2022.
Increase the percentage of African American students or the student group that is most marginalized by instruction on our campus (gender, race, program,other) from 19% to 29% by May 2022.
Evaluation Data Sources: 2021 STAAR results
Strategy 1 Details ReviewsStrategy 1: Develop teacher capacity and home-school communication to improve culturally responsive teaching toensure high academic standards and expectations are held for all students during the implementation of the LiteracyFramework and Creative Curriculum.
Strategy's Expected Result/Impact: Cultural Awareness on the Teacher Panorama survey will increasefrom 56% to 70%.STAAR reading scores will increase 5% and AA increase 10%Staff Responsible for Monitoring: Principal, Assistant Principal, and TeachersProblem Statements: Student Learning 1
Formative SummativeNov Jan Mar June
Strategy 2 Details ReviewsStrategy 2: Develop capacity of the ILT by implementing protocols for distributive leadership in the areas ofinstructional planning, school culture, and observation and feedback while monitoring progress towards the attainmentof student achievement goals.
Strategy's Expected Result/Impact: Panorama survey will increase by 6% from 79% to 85% in the area ofteacher-student relationships. 100% completion rate of teacher walk throughs per proration guide by end of year 2022.Data meetings will identify TEKS to target for instructional planning that will positively impact studentachievement.Staff Responsible for Monitoring: Principal, Assistant Principal, and Data AnalystProblem Statements: Student Learning 1
Formative SummativeNov Jan Mar June
No Progress Accomplished Continue/Modify Discontinue
Performance Objective 1 Problem Statements:
Student LearningProblem Statement 1: According to 3rd Grade MAP Growth Reading MOY scores, when looking at the percent of students who met their growth projection, White performedat 47% and Hispanic performed at 44%, and African Americans at 40%. Root Cause: It has been difficult to shift the mind set from Balance Literacy to the new district literacyframework and the four fundamentals of Literacy instruction.
163 Bruce Shulkey Elementary SchoolGenerated by Plan4Learning.com 25 of 33 October 18, 2021 2:41 PM

Goal 3: CCMR Increase the percentage of students graduating with a CCMR indicator from 43% to 48% by June 2024.
Performance Objective 2: Increase the percentage of 3-5 grade students scoring at MEETS or above on STAAR Math from 15% to 20% by May 2022.Increase the percentage of African American students or the student group that is most marginalized by instruction on our campus (gender, race, program,other) from 7% to 17% by May 2022.
Evaluation Data Sources: 2021 STAAR Results
Strategy 1 Details ReviewsStrategy 1: Develop capacity of the ILT by implementing protocols for distributive leadership in the areas ofinstructional planning, school culture, and observation and feedback while monitoring progress towards the attainmentof student achievement goals.
Strategy's Expected Result/Impact: Panorama survey will increase by 6% from 79% to 85% in the area ofteacher-student relationships. 100% completion rate of teacher walk throughs per proration guide by end of year 2022.Data meetings will identify TEKS to target for instructional planning that will positively impact studentachievement.Staff Responsible for Monitoring: Principal, Assistant Principal, and Data AnalystProblem Statements: School Processes & Programs 1
Formative SummativeNov Jan Mar June
Strategy 2 Details ReviewsStrategy 2: Develop teacher capacity and home-school communication to improve culturally responsive teaching toensure high academic standards and expectations are held for all students through standards aligned planning and lessondelivery during the Math Block.
Strategy's Expected Result/Impact: Cultural Awareness on the Teacher Panorama survey will increasefrom 56% to 70%.STAAR Math results will increase by 5% overall and 10% for AA students.Staff Responsible for Monitoring: Principal, Assistant Principal, and TeachersProblem Statements: School Processes & Programs 1
Formative SummativeNov Jan Mar June
No Progress Accomplished Continue/Modify Discontinue
Performance Objective 2 Problem Statements:
School Processes & ProgramsProblem Statement 1: According to 3rd Grade MAP Growth Math MOY scores, when looking at the percent of students who met their growth projection, White performed at53% and Hispanic performed at 56%, and African Americans at 20%. Root Cause: The lack of Racial awareness and tailoring instruction to meet the needs of AA students.
163 Bruce Shulkey Elementary SchoolGenerated by Plan4Learning.com 26 of 33 October 18, 2021 2:41 PM

Goal 4: Learning Environment (based on the BOE constraints)Ensure all students have access to a safe, supportive and culturally responsive learning environment.
Performance Objective 1: Decrease the number and percentage of students who are chronically absent from 24% to 19% by May 2022. Decrease the number and percentage of African American students or the student group that is most marginalized by instruction on our campus (gender,race, program, other) from 16% to 11% by May 2022.
Strategy 1 Details ReviewsStrategy 1: Develop teacher capacity and home-school communication to improve culturally responsive teaching toensure high academic standards and expectations are held for all students during the implementation of the LiteracyFramework and Creative Curriculum.
Strategy's Expected Result/Impact: Cultural Awareness on the Teacher Panorama survey will increasefrom 56% to 70%.STAAR Reading will increase overall performance by 5% and AA by 10%.Staff Responsible for Monitoring: Principal, Assistant Principal, and TeachersProblem Statements: Demographics 1
Formative SummativeNov Jan Mar June
Strategy 2 Details ReviewsStrategy 2: Develop capacity of the ILT by implementing protocols for distributive leadership in the areas ofinstructional planning, school culture, and observation and feedback while monitoring progress towards the attainmentof student achievement goals.
Strategy's Expected Result/Impact: Increase in attendance by 2%.Staff Responsible for Monitoring: Stay in school coordinator, attendance clerk, counselor, teachersProblem Statements: Demographics 1
Formative SummativeNov Jan Mar June
No Progress Accomplished Continue/Modify Discontinue
Performance Objective 1 Problem Statements:
DemographicsProblem Statement 1: In the 20-21 school year attendance rate has dropped school wide from 96% to 93% as of April. Root Cause: Lack of systems and protocols in place toaccurately monitor attendance with fidelity.
163 Bruce Shulkey Elementary SchoolGenerated by Plan4Learning.com 27 of 33 October 18, 2021 2:41 PM

Goal 4: Learning Environment (based on the BOE constraints)Ensure all students have access to a safe, supportive and culturally responsive learning environment.
Performance Objective 2: Increase positive response by students to the learning environment on the Panorama SEL Survey from 67% to 72% by May2022. Increase positive response by African American students or the student group that is most marginalized by instruction on our campus (gender, race,program, other) from 67% to 77% by May 2022.
Evaluation Data Sources: Panorama Student Survey
Strategy 1 Details ReviewsStrategy 1: Develop capacity of the ILT by implementing protocols for distributive leadership in the areas ofinstructional planning, school culture, and observation and feedback while monitoring progress towards the attainmentof student achievement goals.
Strategy's Expected Result/Impact: Panorama survey will increase by 6% from 79% to 85% in the area ofteacher-student relationships. 100% completion rate of teacher walk throughs per proration guide by end of year 2022.Data meetings will identify TEKS to target for instructional planning that will positively impact studentachievement.Staff Responsible for Monitoring: Principal, Assistant Principal, and Data AnalystProblem Statements: Student Learning 1
Formative SummativeNov Jan Mar June
Strategy 2 Details ReviewsStrategy 2: Develop teacher capacity and home-school communication to improve culturally responsive teaching toensure high academic standards and expectations are held for all students during the implementation of the InstructionalFramework, Literacy Framework, Creative Curriculum, and during the math block.
Strategy's Expected Result/Impact: Cultural Awareness on the Teacher Panorama survey will increasefrom 56% to 70%.STAAR Reading and Math, and MAP Growth will increase overall by 5% and 10% for AA students.
Panorama survey will increase from 57% to 62% in the areas of emotional regulation and sense of belonging.Staff Responsible for Monitoring: Principal, Assistant Principal, Data Analyst, and TeachersProblem Statements: Student Learning 1 - School Processes & Programs 1
Formative SummativeNov Jan Mar June
No Progress Accomplished Continue/Modify Discontinue
Performance Objective 2 Problem Statements:
163 Bruce Shulkey Elementary SchoolGenerated by Plan4Learning.com 28 of 33 October 18, 2021 2:41 PM

Student LearningProblem Statement 1: According to 3rd Grade MAP Growth Reading MOY scores, when looking at the percent of students who met their growth projection, White performedat 47% and Hispanic performed at 44%, and African Americans at 40%. Root Cause: It has been difficult to shift the mind set from Balance Literacy to the new district literacyframework and the four fundamentals of Literacy instruction.
School Processes & ProgramsProblem Statement 1: According to 3rd Grade MAP Growth Math MOY scores, when looking at the percent of students who met their growth projection, White performed at53% and Hispanic performed at 56%, and African Americans at 20%. Root Cause: The lack of Racial awareness and tailoring instruction to meet the needs of AA students.
163 Bruce Shulkey Elementary SchoolGenerated by Plan4Learning.com 29 of 33 October 18, 2021 2:41 PM

Goal 4: Learning Environment (based on the BOE constraints)Ensure all students have access to a safe, supportive and culturally responsive learning environment.
Performance Objective 3: Decrease the number of in and out of school suspensions for African American students or the student group that is mostmarginalized on our campus (gender, race, program, other) from 2 to 1 by May 2022.
Evaluation Data Sources: ADQ Cycle Reports
Strategy 1 Details ReviewsStrategy 1: Develop teacher capacity and home-school communication to improve culturally responsive teaching toensure high academic standards and expectations are held for all students during the implementation of the InstructionalFramework, Literacy Framework, Creative Curriculum, and during the math block.
Strategy's Expected Result/Impact: Cultural Awareness on the Teacher Panorama survey will increasefrom 56% to 70%.STAAR Reading and Math, and MAP Growth will increase overall by 5% and 10% for AA students.
Panorama survey will increase from 57% to 62% in the areas of emotional regulation and sense of belonging.Staff Responsible for Monitoring: Principal, Assistant Principal, Data Analyst, and TeachersProblem Statements: Student Learning 1 - School Processes & Programs 1
Formative SummativeNov Jan Mar June
No Progress Accomplished Continue/Modify Discontinue
Performance Objective 3 Problem Statements:
Student LearningProblem Statement 1: According to 3rd Grade MAP Growth Reading MOY scores, when looking at the percent of students who met their growth projection, White performedat 47% and Hispanic performed at 44%, and African Americans at 40%. Root Cause: It has been difficult to shift the mind set from Balance Literacy to the new district literacyframework and the four fundamentals of Literacy instruction.
School Processes & ProgramsProblem Statement 1: According to 3rd Grade MAP Growth Math MOY scores, when looking at the percent of students who met their growth projection, White performed at53% and Hispanic performed at 56%, and African Americans at 20%. Root Cause: The lack of Racial awareness and tailoring instruction to meet the needs of AA students.
163 Bruce Shulkey Elementary SchoolGenerated by Plan4Learning.com 30 of 33 October 18, 2021 2:41 PM

Goal 4: Learning Environment (based on the BOE constraints)Ensure all students have access to a safe, supportive and culturally responsive learning environment.
Performance Objective 4: Cultural Awareness on the Teacher Panorama survey will increase from 56% to 70%.STAAR Reading and Math, and MAP Growth will increase overall by 5% and 10% for AA students.
Strategy 1 Details ReviewsStrategy 1: Develop teacher capacity and home-school communication to improve culturally responsive teaching toensure high academic standards and expectations are held for all students during the implementation of the InstructionalFramework, Literacy Framework, Creative Curriculum, and during the math block.
Strategy's Expected Result/Impact: Panorama survey will increase from 57% to 62% in the areas ofemotional regulation and sense of belonging.Staff Responsible for Monitoring: Principal, Assistant Principal, Data Analyst, and TeachersProblem Statements: Student Learning 1 - School Processes & Programs 1
Formative SummativeNov Jan Mar June
No Progress Accomplished Continue/Modify Discontinue
Performance Objective 4 Problem Statements:
Student LearningProblem Statement 1: According to 3rd Grade MAP Growth Reading MOY scores, when looking at the percent of students who met their growth projection, White performedat 47% and Hispanic performed at 44%, and African Americans at 40%. Root Cause: It has been difficult to shift the mind set from Balance Literacy to the new district literacyframework and the four fundamentals of Literacy instruction.
School Processes & ProgramsProblem Statement 1: According to 3rd Grade MAP Growth Math MOY scores, when looking at the percent of students who met their growth projection, White performed at53% and Hispanic performed at 56%, and African Americans at 20%. Root Cause: The lack of Racial awareness and tailoring instruction to meet the needs of AA students.
163 Bruce Shulkey Elementary SchoolGenerated by Plan4Learning.com 31 of 33 October 18, 2021 2:41 PM

Site-Based Decision Making CommitteeCommittee Role Name PositionClassroom Teacher 1 Randi Bates Teacher
Classroom Teacher 2 Jeff Adams Teacher
Classroom Teacher 3 Lisa Boeshart Teacher
Classroom Teacher 4 Belinda Shakir Teacher
Professional Non-Teaching Staff Priscilla Littles Assistant Principal
Community Representative 2 Patricia Klint Community Member
Business Representative 1 Brett Wiesner Business Member
Business Representative 2 Casey Williams Business Member
DERC Representative 1 Jessica Langston DERC Member
DERC Representative 2 Crystal Gill DERC Member
Additional Representative (optional)
Professional District-Level Staff Janzia Bell-Cook District Level Staff
Parent 1 Hana Auchenbach Parent
Parent 2 Maribel Luna Parent
Parent 3 Fred Willis Parent
Community Representative 1 Kathy Metroka Community Member
163 Bruce Shulkey Elementary SchoolGenerated by Plan4Learning.com 32 of 33 October 18, 2021 2:41 PM

Campus Funding SummaryTitle I (211)
Goal Objective Strategy Resources Needed Description Account Code Amount
1 3 1 Family Engagement Supplies and materials forparental involvement 211-61-6399-04L-163-30-510-000000-22F10 $1,221.00
1 3 1 Title 1 Teacher Assistant for Interventions Teacher Assistant 211-11-6129-04E-163-30-510-000000-22F10 $18,920.65
1 3 1 Supplies and materials forinstructional use 211-11-6399-04E-163-30-510-000000-22F10 $9,260.00
1 3 1 Family Engagement Snacks for parents topromote participation 211-61-6499-04L-163-30-510-000000-22F10 $1,000.00
1 3 2 Substitutes for Instructional Planning Subs for professionaldevelopment 211-11-6112-0PD-163-30-510-000000-22F10 $2,000.00
1 3 2 Data Analyst Data Analyst 211-13-6119-04E-163-30-510-000000-22F10 $72,351.00
2 3 1 Tutors Tutors with degree orcertified 211-11-6117-04E-163-30-510-000000-22F10 $1,868.35
Sub-Total $106,621.00
Budgeted Fund Source Amount $106,621.00
+/- Difference $0.00
SCE (199 PIC 24)Goal Objective Strategy Resources Needed Description Account Code Amount
2 3 1 Supplies and materials forinstructional use 199-11-6399-001-163-24-313-000000- $3,012.00
Sub-Total $3,012.00
Budgeted Fund Source Amount $3,012.00
+/- Difference $0.00
Grand Total $109,633.00
163 Bruce Shulkey Elementary SchoolGenerated by Plan4Learning.com 33 of 33 October 18, 2021 2:41 PM