general motors - drluisortiz.com e final gm… · web viewgeneral motors. by: group e ... our...
TRANSCRIPT

General motors
By: GROUP E - Bioncha Benally, Natasha Lee-Arthur, & Steven Gonzales
OCTOBER 2, 2017General Motors
Mgmt 489 – Strategic Management
General Motor’s Strategic Analysis Outline
General Motor’s corporate strategy is: “GM’s purpose begins with a few simple but incredibly
powerful words: We are here to earn customers for life. Our purpose shapes how we invest in our
brands around the world to inspire passion and loyalty. It drives us to translate breakthrough
technologies into vehicles and experiences that people love. It motivates the entire GM team to
serve and improve the communities in which we live and work around the world.”
(www.gm.com)
Phase 1 – GM Enterprise background
Mission Statement:
o To earn customers for life by building brands that inspire passion and loyalty
through no only breakthrough technologies but also by serving and improving the
communities in which we live and work around the world.
Vision Statement
o To become the world’s most valued automotive company.
Target Market
o World (global market)
GM’s goals: Invest, maintain, and acquire.
Company Info
o Founded by William C. Durant
o Global Headquarters Detroit, MI
o Multinational corporation
o Employees & Board committee
Company History
Competition
SWAT Analysis
Phase 2 – Organizing for Global Business activities
Company Structure
o Business Strategies
o Corporate Strategies
Growth Strategies
o Internal
o External
o Mergers & acquisitions
Current Finances
The corporate strategy for General Motor’s is: “General Motor’s purpose begins with a
few simple but incredibly powerful words: We are here to earn customers for life. Our purpose
shapes how we invest in our brands around the world to inspire passion and loyalty. It drives us
to translate breakthrough technologies into vehicles and experiences that people love. It
motivates the entire General Motor team to serve and improve the communities in which we live
and work around the world.” (www.gm.com)
The Mission Statement for General Motor’s is to earn customers for life by building
brands that inspire passion and loyalty through not only breakthrough technologies but also by
serving and improving the communities in which we live and work around the world. Earning
customers for life by treating them with respect and appreciation. Also, to build brands that
inspire passion and loyalty, such as Chevrolet, GMC, Buick, Cadillac, Holden, Baojun, Wuling,
and Jiefang. Technology breakthroughs include the following: engine, drivetrain development,
alternative energy, and vehicle design. To serve and improve communities in which we live and
work around the world
The Vision Statement for General Motor’s is to become the world’s most valued
automotive company. General Motor’s Target Market is to have a successful global market.
General Motors goal to allocate capital framework is to: first, invest in business, technology and
innovation for sustainability in the long-run. Second, to maintain investment-grade balance sheet
(investing while still providing dividends). Third, after acquiring 20% return on investments and
maintaining an investment-grade balance sheet, the remaining cash flow will be for the
shareholders.

General Motor’s was founded by William C. Durant on September 16, 1908, Flint, MI.
There Global Headquarters is in Detroit, MI. They also have establishments in GM North
America, GM Europe, GM International Operations, GM South America, Multinational
corporation that designs, manufactures and sells cars, trucks and automobile parts. Also provides
automotive financing services through GM Financial Company, Inc. GM employ’s an estimated
181,000 people.
General Motor’s board committee consists of 11 members. Joseph J. Ashton with Finance
and Risk management, Mary T. Barra the executive chair person, Linda R. Gooden with
Auditing and Risk management, Joseph Jimenez with Executive Compensation and Governance
& Corporate responsibility, Jane L. Mendillo with Auditing and Finance, Michael G. Mullen the
chair of Risk management also with Auditing, and Executive, James J. Mulva the chair of
Finance with Executive compensation, Risk management, and Executive, Patricia F. Russo the
chair of Governance & Corporate responsibility also with Executive compensation, Finance,
Risk management, and Executive, Thomas M. Schoewe the chair of Auditing also with Finance,
Risk management, and Executive, Theodore M. Solso an Executive, lastly Carol M. Stephenson
the chair of Executive Compensation also with Governance & Corporate responsibility,
Executive.
During the 1950’s and 60’s General Motors was the major auto manufacturer in the US.
They had such a big industry that brought so much profits that they didn’t know what to do with
the cash. Until 1973 to 1974 when the Arab oil increased its price by four times the normal
amount. This caused GM to adjust to pricing which resulted in “poor designs, problematic
engines, and transmissions that were anything but smooth.” (Brown, A.S., pg. 30) As the
American consumers noticed these flaws they also noticed that Toyota produced affordable little
cars with good mileage. The Japanese auto industry made its way into the US.
GM’s competitors are Toyota, Nissan, BMW, Mercedes-Benz, Honda, Hyundai, and many
others. Toyota became an even bigger competitor when Toyota built manufacturing factories in
the US in 1989. General Motors had a problem keeping up with the efficient production of
Toyota. The competition was ahead in production costs, labor, and consumer demand. General
Motors went through a long process of restructuring their manufacturing process and eventually
came to a solution. This time era for GM is known as the start of GM’s bankruptcy restructuring.
GM produced parts, they once use to outsource, and made them interchangeable. So that
production would become more efficient. Currently GM has manufactured a few smaller cars
such as the Chevy Cruze but still struggles with its competitors in production time to adjust to
customer demand. In our society, today people want to buy a specific color, engine, and other
options in a vehicle. More Competitors of GM are: Volkswagen AG, Toyota Motor Corp,
Daimler AG, Nissan Motor Co Ltd, Fiat Chrysler Automobiles NV, Honda Motor Company Ltd,
Toyota Motor Corp Ltd, Ford Motor Company, & Tesla Inc.
Basic Financial Position/Statistics (Ending 12/31/16)
o $52,968 M market value
o Current stock price $40.38 (as of September 30, 2017)
o $166,380 M in sales/revenue
o $9,427 M in profits
o 8 on Fortune 100

General Motors looks for these three fundamental characteristics in a finance leader.
1. High degree of personal accountability and responsibility.
2. Track record of results.
3. Ability to be a strong business partner.
(Teach, E., pg. 35)
Some changes GM made in 2012 are to pause or discontinue manufacturing in Europe,
Thailand, Indonesia, Australia, and Russia. The reason for this change is to keep track of
profitability in product line by country. So they are able to review return on invested capital and
capital disbursed by product and/or country. GM wants to also obtains the ability to track
profitability down to sales type (retail, finance, cash, etc.).
SWOT Analysis
Strengths
Strong Presence in China – GM has 11 partnerships in China allowing them to overcome
most of the foreign market barriers and to become the second largest automotive seller.
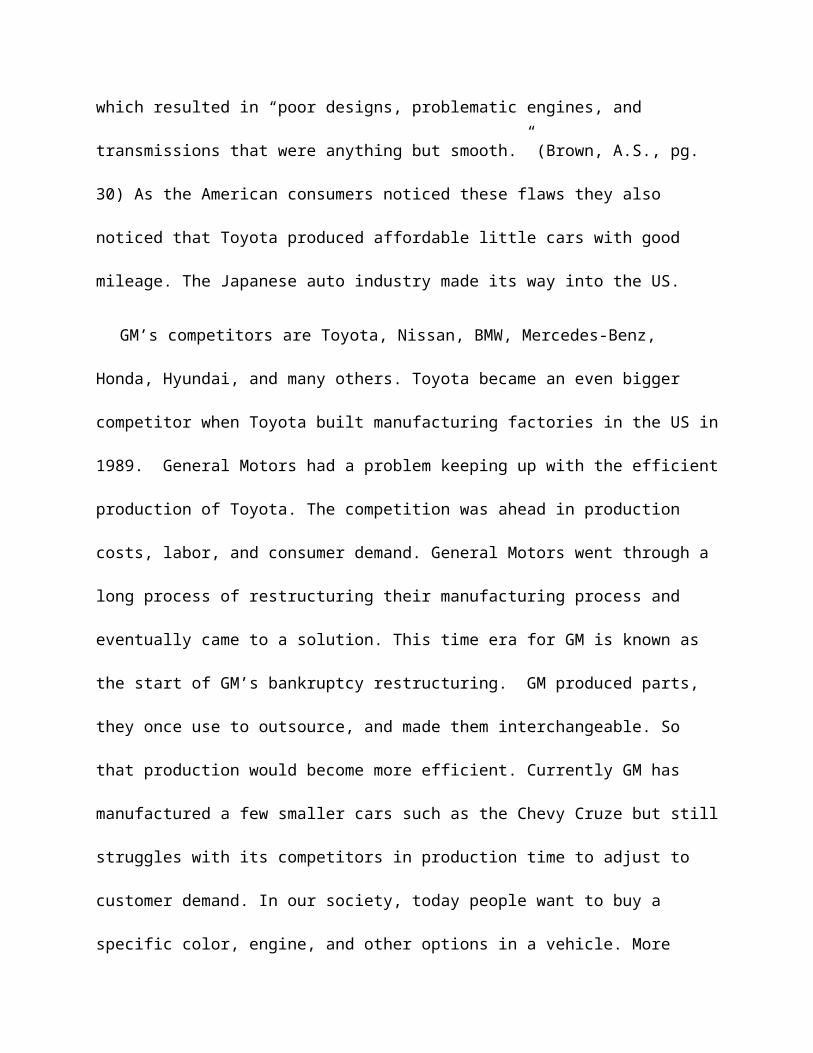
Strong position in the U.S. market – GM is one of the “big three” automotive in the U.S.
holding over a 18.3% market share in the U.S and 24.5% market share in Europe.
Sustainability and environmental policies – Gm earned its fifth U.S. Environmental
Protection Agency ENERGY STAR Award in 2016 at 11 facilities. The company is
committed to reducing and cutting energy each year for each vehicle in its manufacturing
plants.
Strong Brand Portfolio – GM has 18 brands in its portfolio helping to satisfying various
consumers’ needs that are very popular in USA and China.

Rare product recalls – GM scored best in the areas of recall rate, recall timeliness, and
recall proactiveness according to the Auto Remarketing Staff, automotive data and
research company, in Boston.
Weaknesses
Dependence on U.S. to generate most of the revenue – GM depends on the U.S. market to
generate most of the revenue.
Poor Relation between Employee and Management – Poor communication between GM
and its employees is very poor lessening the productivity.
Brand Awareness – GM does not sell any products using its own company name.
Relies on pickup trucks and SUVs for sales growth – SUVs and trucks sell at higher
profit than cars due to the low fuel prices and consumer preference.
Opportunities
Low Fuel Prices in Europe and the USA – Currently, fuel prices are at its lowest,
encouraging consumers to buy big fuel-inefficient vehicles.

Employee-Management Relationship – improvement in this internal relationship should
introduce strong communication within the organization.
Potential Growth in India – GM sales have grown by 61% in India as of 2010, planning
to expand output by 80% by hiring more people, planning to invest $500 million in
production units to increase productions capacity and merge R& D activities, and plan to
start trail production of light commercial vehicles.
Threats
Increased Competition - Manufacturers are beginning to design electric cars and self-
driving cars.
The Fluctuating Currency Exchange Rate – fluctuating rates have a market effect on unit
sales, prices, and cost. Revenue has to be converted to U.S. dollars, could it bring a
positive/negative effect to GM’s financial statements?
Increasing government regulations may raise the costs
Fuel prices – GM does not provide fuel efficient vehicles so if the price of fuel goes up,
the sales of vehicles will go down.
General Motor’s has such a diverse range of vehicle brands that they are able to have an offensive strategy that “maneuvers around competitors and concentrates on capturing unoccupied or less contested market territories.” (A. Thompson, pg. 112) The many brands include Chevrolet, GMC, Buick, Cadillac, Holden, Baojun, Wuling, and Jiefang. General Motors appeals to consumers looking for a reliable and affordable vehicle to those who seek luxury and expensive vehicles. They also are ahead of competition by their technological breakthroughs which are: engine, drivetrain development, alternative energy, and vehicle design.
There are three possible Growth Strategies for GM. First, GM can target an attack on other market leaders who are vulnerable. GM can advertise that their vehicles have high quality and are more reliable than the competitors. Second, GM can target a runner-up firm’s weakness by advancing their strengths. One main strength is they offer a diverse range of vehicles and brands in different locations worldwide. Third, GM can over power a struggling enterprise by out-performing financially in specific segments.
Mergers and acquisitions for GM. I personally don’t think GM needs to merge, only to acquire an online presence. GM does have a website where their fellow enterprise partners are able to order vehicles. What GM can do is allow consumers to purchase vehicles on their websites as well.
GM’s Balance Sheet
In Millions of USD (except for per share items)
As of 2016-12-31GM’s Income Statement
In Millions of USD (except for per share items)
12 months ending 2016-12-31
Cash & Equivalents 12,574.00 Revenue 166,380.00
GM’s Balance Sheet
In Millions of USD (except for per share items)
As of 2016-12-31GM’s Income Statement
In Millions of USD (except for per share items)
12 months ending 2016-12-31
Short Term Investments 11,841.00 Other Revenue, TotalCash and Short Term Investments 24,415.00 Total Revenue 166,380.00Accounts Receivable - Trade, Net 24,827.00 Cost of Revenue, Total 145,125.00Receivables - Other - Gross Profit 21,255.00Total Receivables, Net 24,827.00 Selling/General/Admin. Expenses, Total 11,710.00Total Inventory 11,040.00 Research & DevelopmentPrepaid Expenses - Depreciation/AmortizationOther Current Assets, Total 15,921.00 Interest Expense(Income) - Net OperatingTotal Current Assets 76,203.00 Unusual Expense (Income)Property/Plant/Equipment, Total - Gross - Other Operating Expenses, TotalAccumulated Depreciation, Total - Total Operating Expense 156,835.00Goodwill, Net - Operating Income 9,545.00Intangibles, Net 6,149.00 Interest Income(Expense), Net Non-OperatingLong Term Investments 8,996.00 Gain (Loss) on Sale of AssetsOther Long Term Assets, Total 46,396.00 Other, Net 241.00Total Assets 221,690.00 Income Before Tax 11,684.00Accounts Payable 23,333.00 Income After Tax 9,268.00Accrued Expenses 25,893.00 Minority Interest 159.00Notes Payable/Short Term Debt 0.00 Equity In AffiliatesCurrent Port. of LT Debt/Capital Leases 23,797.00 Net Income Before Extra. Items 9,427.00Other Current liabilities, Total 12,158.00 Accounting ChangeTotal Current Liabilities 85,181.00 Discontinued OperationsLong Term Debt 51,326.00 Extraordinary ItemCapital Lease Obligations - Net Income 9,427.00Total Long Term Debt 51,326.00 Preferred DividendsTotal Debt 75,123.00 Income Available to Common Excl. Extra Items 9,427.00Deferred Income Tax - Income Available to Common Incl. Extra Items 9,427.00Minority Interest 239.00 Basic Weighted Average SharesOther Liabilities, Total 41,108.00 Basic EPS Excluding Extraordinary ItemsTotal Liabilities 177,854.00 Basic EPS Including Extraordinary ItemsRedeemable Preferred Stock, Total - Dilution AdjustmentPreferred Stock - Non Redeemable, Net - Diluted Weighted Average Shares 1,570.00Common Stock, Total 15.00 Diluted EPS Excluding Extraordinary ItemsAdditional Paid-In Capital 26,983.00 Diluted EPS Including Extraordinary Items
Retained Earnings (Accumulated Deficit) 26,168.00 Dividends per Share - Common Stock Primary Issue
Treasury Stock - Common - Gross Dividends - Common StockOther Equity, Total -9,330.00 Net Income after Stock Based Comp. ExpenseTotal Equity 43,836.00 Basic EPS after Stock Based Comp. Expense

GM’s Balance Sheet
In Millions of USD (except for per share items)
As of 2016-12-31GM’s Income Statement
In Millions of USD (except for per share items)
12 months ending 2016-12-31
Total Liabilities & Shareholders' Equity 221,690.00 Diluted EPS after Stock Based Comp. ExpenseShares Outs - Common Stock Primary Issue - Depreciation, SupplementalTotal Common Shares Outstanding 1,500.00 Total Special Items
Normalized Income Before TaxesEffect of Special Items on Income TaxesIncome Taxes Ex. Impact of Special ItemsNormalized Income After TaxesNormalized Income Avail to CommonBasic Normalized EPSDiluted Normalized EPS 6.41

Source Citation:
• Brown, A. S. (2011, October). Under the hood at GM: what GM's resurgence means for American
• manufacturing. Mechanical Engineering-CIME, 133(10), 28+. Retrieved from http://donnelly.nmhu.edu:2048/login?url=http://donnelly.nmhu.edu:2117/ps/i.do?p=ITBC&sw=w&u=nm_a_high&v=2.1&it=r&id=GALE%7CA269338355&asid=4dcf028705072234fe5ef63d63703f6b
• Teach, E. (2015, December). The road ahead: CFO Chuck Stevens discusses major financial, strategic, and cultural changes under way at General Motors. CFO, The Magazine for Senior Financial Executives, 31(10), 30+. Retrieved from http://donnelly.nmhu.edu:2048/login?url=http://donnelly.nmhu.edu:2117/ps/i.do?p=ITBC&sw=w&u=nm_a_high&v=2.1&it=r&id=GALE%7CA437695694&asid=1273b68f91dc1bfbcbf9ae55025db091
• Preston, R. (2014, April 1). GM's Randy Mott: what I believe ... InformationWeek, (1387), 5. Retrieved from http://donnelly.nmhu.edu:2048/login?url=http://donnelly.nmhu.edu:2117/ps/i.do?p=ITBC&sw=w&u=nm_a_high&v=2.1&it=r&id=GALE%7CA367546711&asid=43993ff961bc8c3fe144f4d242bdc29a
• http://www.gm.com/investors/corporate-strategy.html
• http://www.gm.com/investors/corporate-governance.html
• http://insiders.morningstar.com/trading/board-ofdirectors.action? t=0P0000RQZL&culture=en-US
• http://quotes.wsj.com/GM/company-people • https://www.gm.com/company/about-gm.html • http://panmore.com/general-motors-vision-statement-mission-statement-analysis
• Edmunds (2016). The Market Share by Manufacturer. Available at: https://www.edmunds.com/industry-center/data/market-share-by-manufacturer.html. Accessed November 1, 2017.
• GM (2016) Five Star Rating: GM Earns Fifth ENERGY STAR Award. Available at: http://www.gm.com/mol/m-2016-mar-0328-energy-star.html. Accessed October 27, 2017.
• Autoremarketing (2016) Where Automakers Rank When It Comes To Recalls. Available at: http://www.autoremarketing.com/trends/where-automakers-rank-when-it-comes-recalls. Accessed October 15, 2017.
• AA (2017) Check The Latest AA Fuel Price Report. Available at: http://www.theaa.com/driving-advice/driving-costs/fuel-prices. Accessed November 20, 2017.
• Business. General Motors India. Available at: https://business.mapsofindia.com/automobile/car-manufacturers/general-motors-india.html. Accessed November 5, 2017.
• https://donnelly.nmhu.edu:2553/secure/research#list=recent&sec=company&sym=gm
• Arthur A. Thompson, The University of Alabama (4th Edition 2016). Strategy Core Concepts and analytical approaches, McGraw Hill Education, Burr Ridge, Illinois.