general fund revenues and other financing … · 2012-02-14 · miami-dade county, florida...
TRANSCRIPT
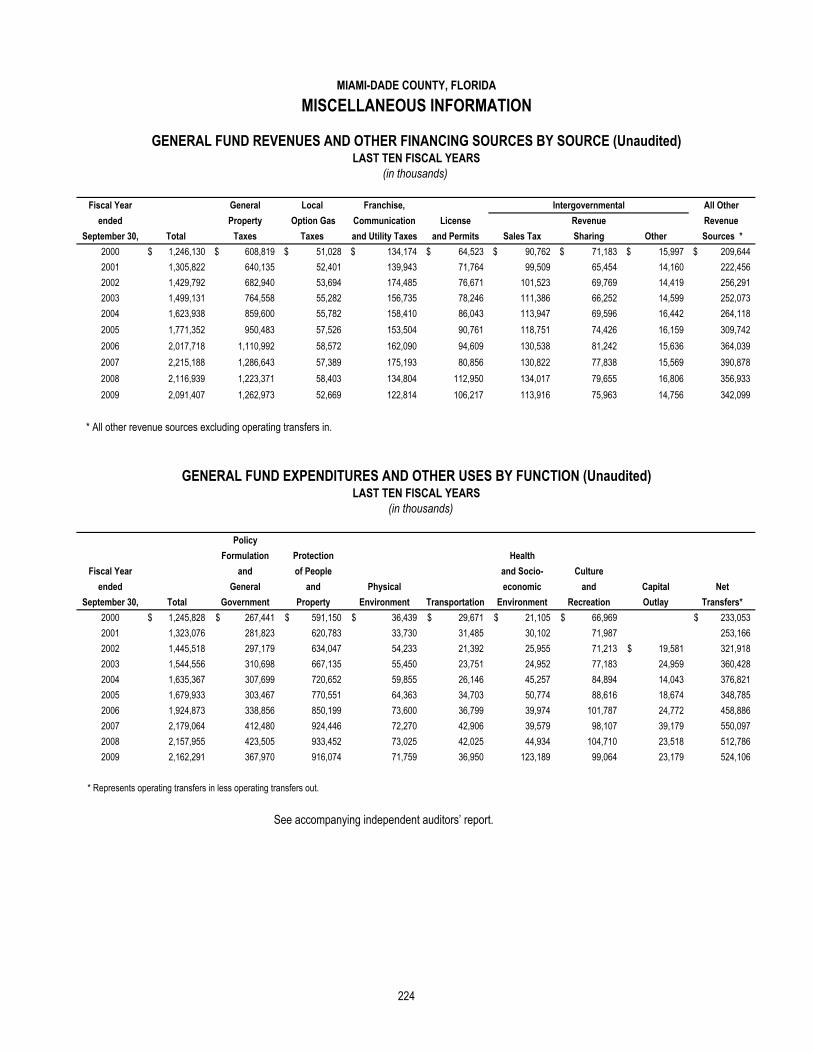
MIAMI-DADE COUNTY, FLORIDAMISCELLANEOUS INFORMATION
GENERAL FUND REVENUES AND OTHER FINANCING SOURCES BY SOURCE (Unaudited)LAST TEN FISCAL YEARS
(in thousands)
Fiscal Year General Local Franchise, Intergovernmental All Other ended Property Option Gas Communication License Revenue Revenue
September 30, Total Taxes Taxes and Utility Taxes and Permits Sales Tax Sharing Other Sources *2000 1,246,130$ 608,819$ 51,028$ 134,174$ 64,523$ 90,762$ 71,183$ 15,997$ 209,644$ 2001 1,305,822 640,135 52,401 139,943 71,764 99,509 65,454 14,160 222,456 2002 1,429,792 682,940 53,694 174,485 76,671 101,523 69,769 14,419 256,291 2003 1,499,131 764,558 55,282 156,735 78,246 111,386 66,252 14,599 252,073 2004 1,623,938 859,600 55,782 158,410 86,043 113,947 69,596 16,442 264,118 2005 1,771,352 950,483 57,526 153,504 90,761 118,751 74,426 16,159 309,742 2006 2,017,718 1,110,992 58,572 162,090 94,609 130,538 81,242 15,636 364,039 2007 2,215,188 1,286,643 57,389 175,193 80,856 130,822 77,838 15,569 390,878 2008 2,116,939 1,223,371 58,403 134,804 112,950 134,017 79,655 16,806 356,933 2009 2,091,407 1,262,973 52,669 122,814 106,217 113,916 75,963 14,756 342,099
* All other revenue sources excluding operating transfers in.
GENERAL FUND EXPENDITURES AND OTHER USES BY FUNCTION (Unaudited)LAST TEN FISCAL YEARS
(in thousands)
PolicyFormulation Protection Health
Fiscal Year and of People and Socio- Cultureended General and Physical economic and Capital Net
September 30, Total Government Property Environment Transportation Environment Recreation Outlay Transfers*2000 1,245,828$ 267,441$ 591,150$ 36,439$ 29,671$ 21,105$ 66,969$ 233,053$ 2001 1,323,076 281,823 620,783 33,730 31,485 30,102 71,987 253,166 2002 1,445,518 297,179 634,047 54,233 21,392 25,955 71,213 19,581$ 321,918 2003 1,544,556 310,698 667,135 55,450 23,751 24,952 77,183 24,959 360,428 2004 1,635,367 307,699 720,652 59,855 26,146 45,257 84,894 14,043 376,821 2005 1,679,933 303,467 770,551 64,363 34,703 50,774 88,616 18,674 348,785 2006 1,924,873 338,856 850,199 73,600 36,799 39,974 101,787 24,772 458,886 2007 2,179,064 412,480 924,446 72,270 42,906 39,579 98,107 39,179 550,097 2008 2,157,955 423,505 933,452 73,025 42,025 44,934 104,710 23,518 512,7862009 2,162,291 367,970 916,074 71,759 36,950 123,189 99,064 23,179 524,106
* Represents operating transfers in less operating transfers out.
See accompanying independent auditors’ report.
224

SE 7th North
South Overtown/ Park West City Florida South Naranja Avenue Midtown North Miami West
District Pointe Park West Addition Omni(1) Center Homestead City Miami Lakes Corridor Miami Miami Beach PerrineMiami Miami Florida South North N. Miami
Municipality Beach Miami Miami Miami Beach Homestead City Miami N/A N/A Miami Miami Beach N/A
Base year (created) 1976 1982 1985 1986 1992 1993 1994 1998 2002 2003 2004 2004 2004 2006
Base assessment 59,637$ 78,306$ 37,462$ 246,899$ 292,572$ 85,619$ 42,804$ 68,437$ 131,293$ 54,233$ 29,282$ 870,434$ 235,289$ 431,320$
RevenueCounty - 2000 2,838$ 217$ N/A 317$ 3,414$ 390$ 73$ 385$
2001 3,602 344 N/A 393 3,984 419 140 3402002 4,173 548 N/A 619 4,930 501 285 3392003 4,717 970 N/A 1,344 5,882 606 313 3012004 7,013 944 N/A 2,046 6,575 808 328 328 125$
(in thousands)
MIAMI-DADE COUNTY, FLORIDAMISCELLANEOUS INFORMATION
TAX INCREMENT DISTRICTS (Unaudited)LAST TEN FISCAL YEARS
2005 9,457 1,189 N/A 2,282 7,236 946 506 334 323 97$ 2006 11,591 1,714 N/A 3,689 10,563 1,491 513 542 539 152 52$ 222$ 197$ 2007 15,104 2,410 N/A 5,289 14,453 2,103 565 740 1,311 269 122 214 5752008 14,669 2,228 N/A 4,652 13,956 1,711 743 719 1,577 286 300 360 756 465$ 2009 16,379 2,706 N/A 5,597 14,846 1,887 1,164 719 1,720 320 1,323 1,139 898 604
Municipality - 2000 3,663$ 355$ N/A 519$ 4,407$ 570$ 100$ 423$ 2001 4,734 574 N/A 624 5,241 656 219 3762002 5,416 898 N/A 1,016 6,419 772 442 3882003 5,971 1,562 N/A 1,982 7,400 911 463 3682004 8,654 1,474 N/A 2,594 8,363 1,096 556 471 51$ 2005 11,767 2,078 N/A 3,273 9,456 1,245 789 470 133 40$ 2006 15,030 2,656 N/A 5,515 14,057 1,739 844 679 266 64 76$ 1,462$ 253$ 2007 19,937 3,923 N/A 8,122 18,991 2,305 1,066 796 571 117 182 3,919 7682008 18,228 3,745 N/A 7,747 17,691 2,125 1,299 752 701 127 478 4,624 1,146 207$ 2009 19,474 4,577 N/A 9,664 18,345 2,356 1,822 797 713 133 2,098 5,124 1,218 251
See accompanying independent auditors’ report.
225
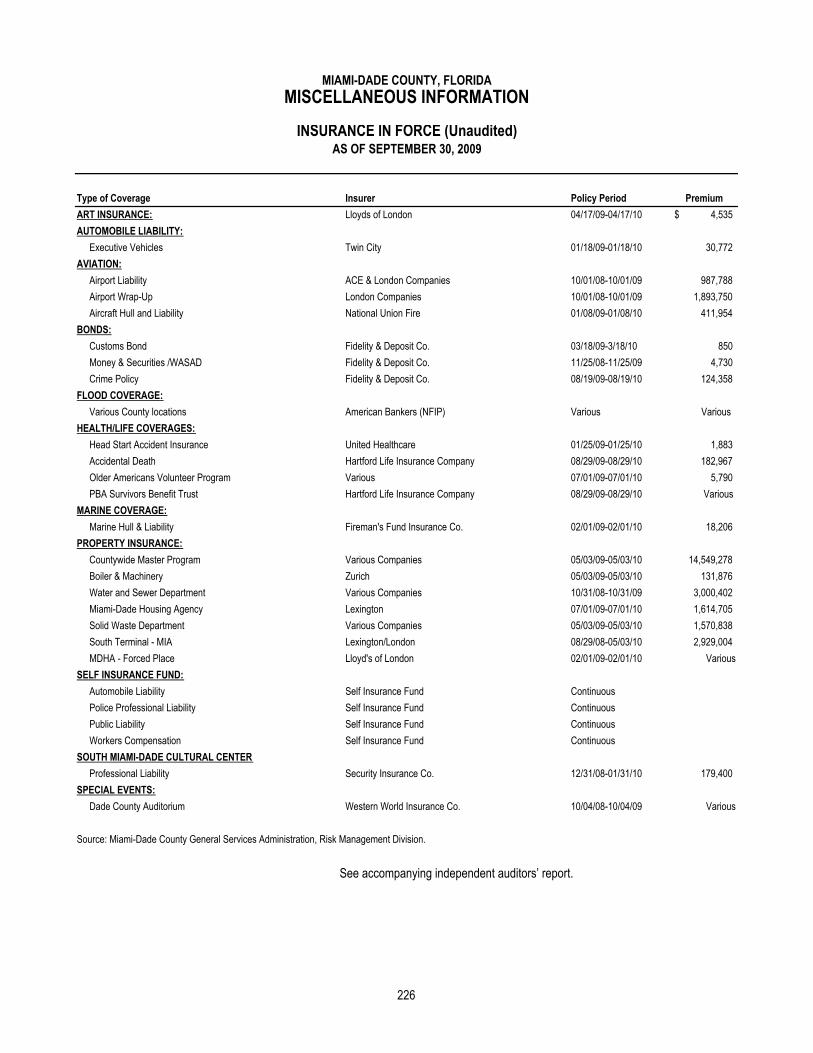
MIAMI-DADE COUNTY, FLORIDAMISCELLANEOUS INFORMATION
INSURANCE IN FORCE (Unaudited)AS OF SEPTEMBER 30, 2009
Type of Coverage Insurer Policy Period PremiumART INSURANCE: Lloyds of London 04/17/09-04/17/10 4,535$ AUTOMOBILE LIABILITY:
Executive Vehicles Twin City 01/18/09-01/18/10 30,772AVIATION:
Airport Liability ACE & London Companies 10/01/08-10/01/09 987,788Airport Wrap-Up London Companies 10/01/08-10/01/09 1,893,750Aircraft Hull and Liability National Union Fire 01/08/09-01/08/10 411,954
BONDS:Customs Bond Fidelity & Deposit Co. 03/18/09-3/18/10 850Money & Securities /WASAD Fidelity & Deposit Co. 11/25/08-11/25/09 4,730Crime Policy Fidelity & Deposit Co. 08/19/09-08/19/10 124,358
FLOOD COVERAGE:Various County locations American Bankers (NFIP) Various Various
HEALTH/LIFE COVERAGES:Head Start Accident Insurance United Healthcare 01/25/09-01/25/10 1,883Accidental Death Hartford Life Insurance Company 08/29/09-08/29/10 182,967Older Americans Volunteer Program Various 07/01/09-07/01/10 5,790PBA Survivors Benefit Trust Hartford Life Insurance Company 08/29/09-08/29/10 Various
MARINE COVERAGE:Marine Hull & Liability Fireman's Fund Insurance Co. 02/01/09-02/01/10 18,206
PROPERTY INSURANCE:Countywide Master Program Various Companies 05/03/09-05/03/10 14,549,278Boiler & Machinery Zurich 05/03/09-05/03/10 131,876Water and Sewer Department Various Companies 10/31/08-10/31/09 3,000,402Miami-Dade Housing Agency Lexington 07/01/09-07/01/10 1,614,705Solid Waste Department Various Companies 05/03/09-05/03/10 1,570,838South Terminal - MIA Lexington/London 08/29/08-05/03/10 2,929,004MDHA - Forced Place Lloyd's of London 02/01/09-02/01/10 Various
SELF INSURANCE FUND:Automobile Liability Self Insurance Fund ContinuousPolice Professional Liability Self Insurance Fund ContinuousPublic Liability Self Insurance Fund ContinuousWorkers Compensation Self Insurance Fund Continuous
SOUTH MIAMI-DADE CULTURAL CENTERProfessional Liability Security Insurance Co. 12/31/08-01/31/10 179,400
SPECIAL EVENTS:Dade County Auditorium Western World Insurance Co. 10/04/08-10/04/09 Various
Source: Miami-Dade County General Services Administration, Risk Management Division.
See accompanying independent auditors’ report.
226
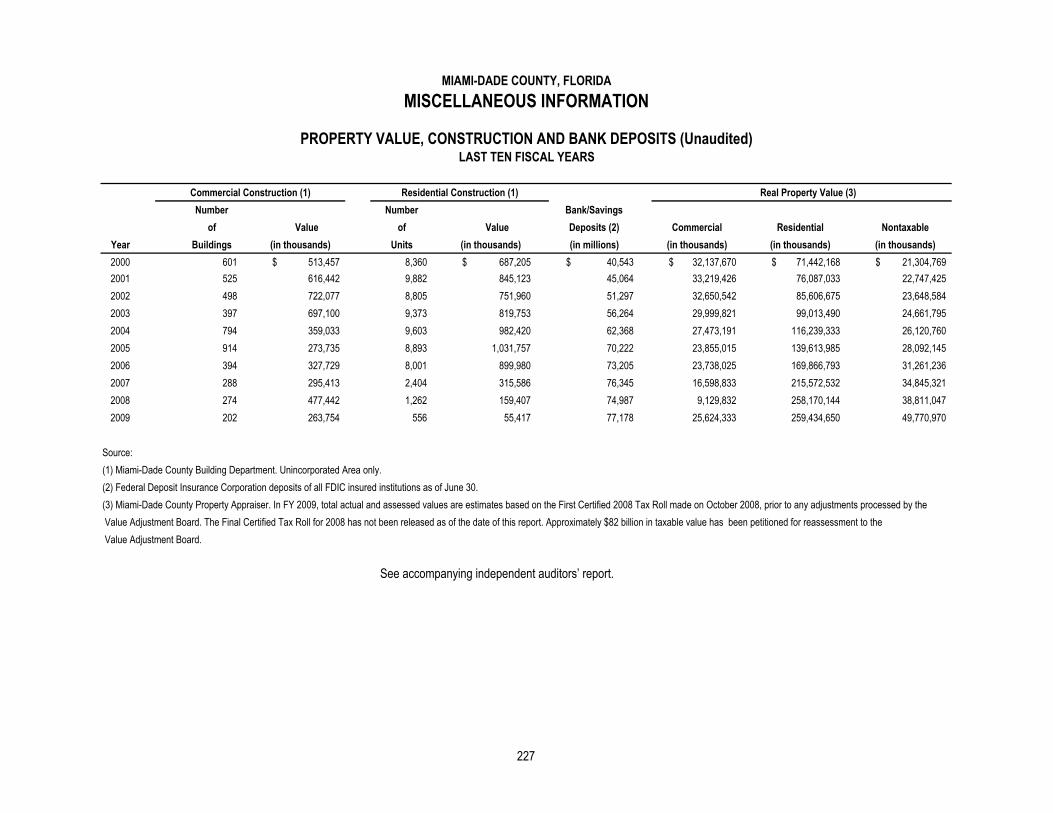
Commercial Construction (1) Residential Construction (1) Real Property Value (3)Number Number Bank/Savings
of Value of Value Deposits (2) Commercial Residential NontaxableYear Buildings (in thousands) Units (in thousands) (in millions) (in thousands) (in thousands) (in thousands)2000 601 513,457$ 8,360 687,205$ 40,543$ 32,137,670$ 71,442,168$ 21,304,769$ 2001 525 616,442 9,882 845,123 45,064 33,219,426 76,087,033 22,747,425 2002 498 722,077 8,805 751,960 51,297 32,650,542 85,606,675 23,648,584 2003 397 697,100 9,373 819,753 56,264 29,999,821 99,013,490 24,661,795 2004 794 359,033 9,603 982,420 62,368 27,473,191 116,239,333 26,120,760 2005 914 273,735 8,893 1,031,757 70,222 23,855,015 139,613,985 28,092,145 2006 394 327,729 8,001 899,980 73,205 23,738,025 169,866,793 31,261,236 2007 288 295,413 2,404 315,586 76,345 16,598,833 215,572,532 34,845,321 2008 274 477,442 1,262 159,407 74,987 9,129,832 258,170,144 38,811,047 2009 202 263,754 556 55,417 77,178 25,624,333 259,434,650 49,770,970
Source:(1) Miami-Dade County Building Department. Unincorporated Area only.(2) Federal Deposit Insurance Corporation deposits of all FDIC insured institutions as of June 30.(3) Miami-Dade County Property Appraiser. In FY 2009, total actual and assessed values are estimates based on the First Certified 2008 Tax Roll made on October 2008, prior to any adjustments processed by the Value Adjustment Board. The Final Certified Tax Roll for 2008 has not been released as of the date of this report. Approximately $82 billion in taxable value has been petitioned for reassessment to the Value Adjustment Board.
See accompanying independent auditors’ report.
MIAMI-DADE COUNTY, FLORIDAMISCELLANEOUS INFORMATION
PROPERTY VALUE, CONSTRUCTION AND BANK DEPOSITS (Unaudited)LAST TEN FISCAL YEARS
227
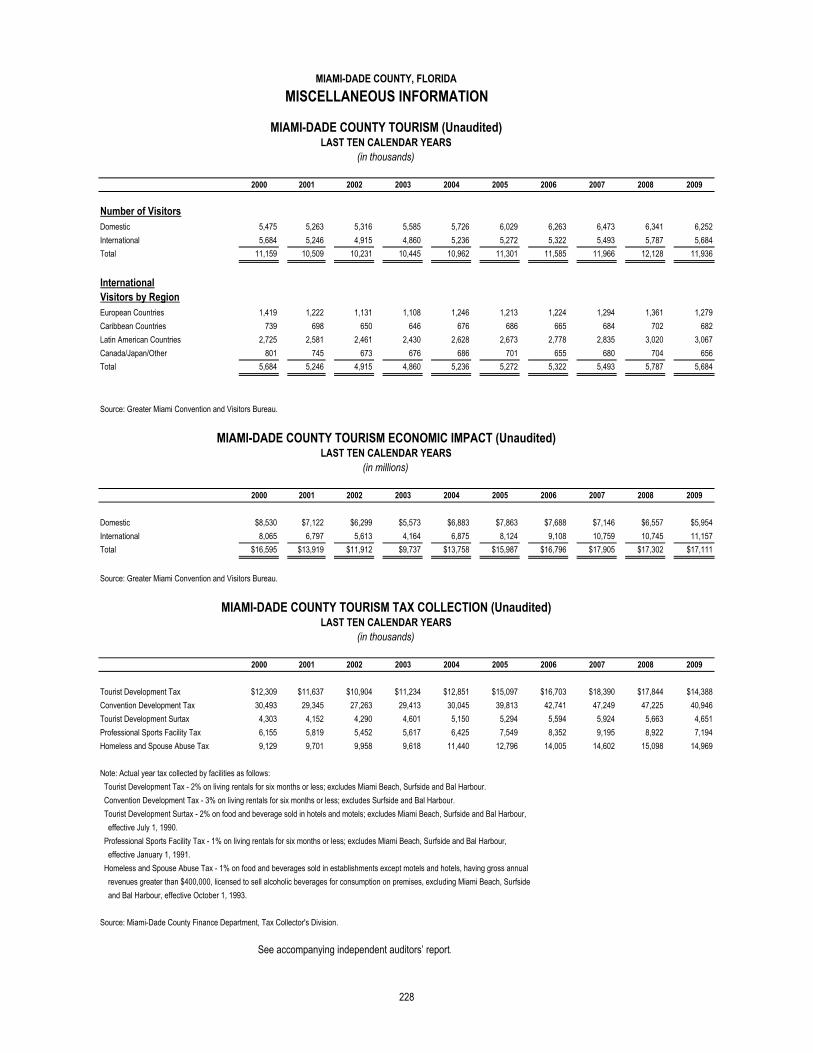
MIAMI-DADE COUNTY, FLORIDAMISCELLANEOUS INFORMATION
MIAMI-DADE COUNTY TOURISM (Unaudited)LAST TEN CALENDAR YEARS
(in thousands)
2000 2001 2002 2003 2004 2005 2006 2007 2008 2009
Number of VisitorsDomestic 5,475 5,263 5,316 5,585 5,726 6,029 6,263 6,473 6,341 6,252International 5,684 5,246 4,915 4,860 5,236 5,272 5,322 5,493 5,787 5,684Total 11,159 10,509 10,231 10,445 10,962 11,301 11,585 11,966 12,128 11,936
InternationalVisitors by RegionEuropean Countries 1,419 1,222 1,131 1,108 1,246 1,213 1,224 1,294 1,361 1,279Caribbean Countries 739 698 650 646 676 686 665 684 702 682Latin American Countries 2,725 2,581 2,461 2,430 2,628 2,673 2,778 2,835 3,020 3,067Canada/Japan/Other 801 745 673 676 686 701 655 680 704 656Total 5,684 5,246 4,915 4,860 5,236 5,272 5,322 5,493 5,787 5,684
Source: Greater Miami Convention and Visitors Bureau.
MIAMI-DADE COUNTY TOURISM ECONOMIC IMPACT (Unaudited)LAST TEN CALENDAR YEARS
(in millions)
2000 2001 2002 2003 2004 2005 2006 2007 2008 2009
Domestic $8,530 $7,122 $6,299 $5,573 $6,883 $7,863 $7,688 $7,146 $6,557 $5,954International 8,065 6,797 5,613 4,164 6,875 8,124 9,108 10,759 10,745 11,157Total $16,595 $13,919 $11,912 $9,737 $13,758 $15,987 $16,796 $17,905 $17,302 $17,111
Source: Greater Miami Convention and Visitors Bureau.
MIAMI-DADE COUNTY TOURISM TAX COLLECTION (Unaudited)LAST TEN CALENDAR YEARS
(in thousands)
2000 2001 2002 2003 2004 2005 2006 2007 2008 2009
Tourist Development Tax $12,309 $11,637 $10,904 $11,234 $12,851 $15,097 $16,703 $18,390 $17,844 $14,388Convention Development Tax 30,493 29,345 27,263 29,413 30,045 39,813 42,741 47,249 47,225 40,946Tourist Development Surtax 4,303 4,152 4,290 4,601 5,150 5,294 5,594 5,924 5,663 4,651Professional Sports Facility Tax 6,155 5,819 5,452 5,617 6,425 7,549 8,352 9,195 8,922 7,194Homeless and Spouse Abuse Tax 9,129 9,701 9,958 9,618 11,440 12,796 14,005 14,602 15,098 14,969
Note: Actual year tax collected by facilities as follows: Tourist Development Tax - 2% on living rentals for six months or less; excludes Miami Beach, Surfside and Bal Harbour. Convention Development Tax - 3% on living rentals for six months or less; excludes Surfside and Bal Harbour. Tourist Development Surtax - 2% on food and beverage sold in hotels and motels; excludes Miami Beach, Surfside and Bal Harbour, effective July 1, 1990. Professional Sports Facility Tax - 1% on living rentals for six months or less; excludes Miami Beach, Surfside and Bal Harbour, effective January 1, 1991. Homeless and Spouse Abuse Tax - 1% on food and beverages sold in establishments except motels and hotels, having gross annual revenues greater than $400,000, licensed to sell alcoholic beverages for consumption on premises, excluding Miami Beach, Surfside and Bal Harbour, effective October 1, 1993.
Source: Miami-Dade County Finance Department, Tax Collector's Division.
See accompanying independent auditors’ report.
228