gender specificity and gender budgeting in bulgaria: socio and economic aspects gender specificity...
TRANSCRIPT

GENDER SPECIFICITY AND GENDER SPECIFICITY AND GENDER BUDGETING IN GENDER BUDGETING IN BULGARIA: SOCIO AND BULGARIA: SOCIO AND
ECONOMIC ASPECTSECONOMIC ASPECTS
Dr. Rossitsa RangelovaDr. Rossitsa Rangelova
Ministry of Labour and Social PolicyMinistry of Labour and Social Policy
Prague, 8-9 November 2007Prague, 8-9 November 2007

The purpose of this presentation is to The purpose of this presentation is to outline the gender specificity in outline the gender specificity in Bulgaria related to the bio-Bulgaria related to the bio-demographic (ageing population, demographic (ageing population, increase in life expectancy, worsened increase in life expectancy, worsened health indicators) and labour market health indicators) and labour market aspects, and thus giving implications aspects, and thus giving implications for working out of principles and for working out of principles and implementation of GB from the point implementation of GB from the point of view of the gender equalityof view of the gender equality..

This gender analysis aims at contributing to This gender analysis aims at contributing to
the successful implementation of GB in budget planning, which the successful implementation of GB in budget planning, which means: means:
to organize more efficient cash flow management,to organize more efficient cash flow management, to organize shared responsibilities and rational spending of the to organize shared responsibilities and rational spending of the
resources between men and women, girls and boys, resources between men and women, girls and boys, to balance accumulated financial resources and theto balance accumulated financial resources and the expenditures of the territorial community,expenditures of the territorial community, to execute more effective control on raising and spending of to execute more effective control on raising and spending of
money, and for its distribution between separate budget units money, and for its distribution between separate budget units on different levels,on different levels,
to organize a more effective application of the labour force, to organize a more effective application of the labour force, to achieve higher living standards.to achieve higher living standards.

Age structure of the Age structure of the totaltotal population population in Bulgaria, 2006, %in Bulgaria, 2006, %
TotalTotal MaleMale FemaleFemale
0-140-14 13.613.6 14.414.4 12.812.8
15-6415-64 69.269.2 70.970.9 67.667.6
65+65+ 17.217.2 14.714.7 19.619.6
TotalTotal 100.0100.0 100.0100.0 100.0100.0

Projection of the population number by age in Projection of the population number by age in Bulgaria, young (0-14) and old people (65 and Bulgaria, young (0-14) and old people (65 and
over), 2003-2050over), 2003-2050
0
200 000
400 000
600 000
800 000
1 000 000
1 200 000
1 400 000
1 600 000
1 800 000
2 000 000
Population (age<15)Population (age>65)

Age structure of the Age structure of the urbanurban population in Bulgaria, 2006, %population in Bulgaria, 2006, %
TotalTotal MaleMale FemaleFemale
0-140-14 13.613.6 14.514.5 12.812.8
15-6415-64 72.872.8 74.174.1 71.571.5
65+65+ 13.613.6 11.411.4 15.715.7
TotalTotal 100.0100.0 100.0100.0 100.0100.0

Age structure of the Age structure of the ruralrural population in Bulgaria, 2006, %population in Bulgaria, 2006, %
TotalTotal MaleMale FemaleFemale
0-140-14 13.413.4 14.014.0 12.812.8
15-6415-64 61.061.0 63.863.8 58.358.3
65+65+ 25.625.6 22.222.2 28.928.9
TotalTotal 100.0100.0 100.0100.0 100.0100.0

Basic demographic indicators, 2006Basic demographic indicators, 2006
TotalTotal UrbanUrban RuralRural
Natural increase (per 1000)Natural increase (per 1000) -5.1-5.1 -2.1-2.1 -12.7-12.7
Structure by location, %Structure by location, % 100.0100.0 70.670.6 29.429.4
Mortality (per 1000), incl.Mortality (per 1000), incl. 14.714.7 12.212.2 20.720.7
MenMen 16.216.2 13.613.6 22.322.3
WomenWomen 13.313.3 11.011.0 19.219.2
Life expect. (years), incl.Life expect. (years), incl. 72.672.6 73.073.0 71.571.5
MenMen 69.169.1 69.469.4 67.967.9
WomenWomen 76.376.3 76.576.5 75.675.6
Average age (years)Average age (years) 41.441.4 39.739.7 45.345.3

Projected variants of Life Expectancy in Projected variants of Life Expectancy in Bulgaria, 2005-2050, yearsBulgaria, 2005-2050, years
20052005 20252025 20502050VARIANTVARIANT - fast improvement of life expectancy - fast improvement of life expectancy
Total Total
(m/f)(m/f)
72.0 72.0 (68.7/75.3)(68.7/75.3)
77.0 77.0 (74.0/80.1)(74.0/80.1)
81.0 81.0 (78.2/83.8)(78.2/83.8)
VARIANTVARIANT - - middlemiddle improvement of life expectancy improvement of life expectancy
Total Total 72.072.0 76.4 76.4 (73.4/79.4)(73.4/79.4)
79.5 79.5 (76.7/82.4)(76.7/82.4)
VARIANTVARIANT - - slowslow improvement of life expectancy improvement of life expectancy
Total Total 72.072.0 75.5 75.5 (72.6/78.4)(72.6/78.4)
77.9 77.9 (75.2/80.6)(75.2/80.6)
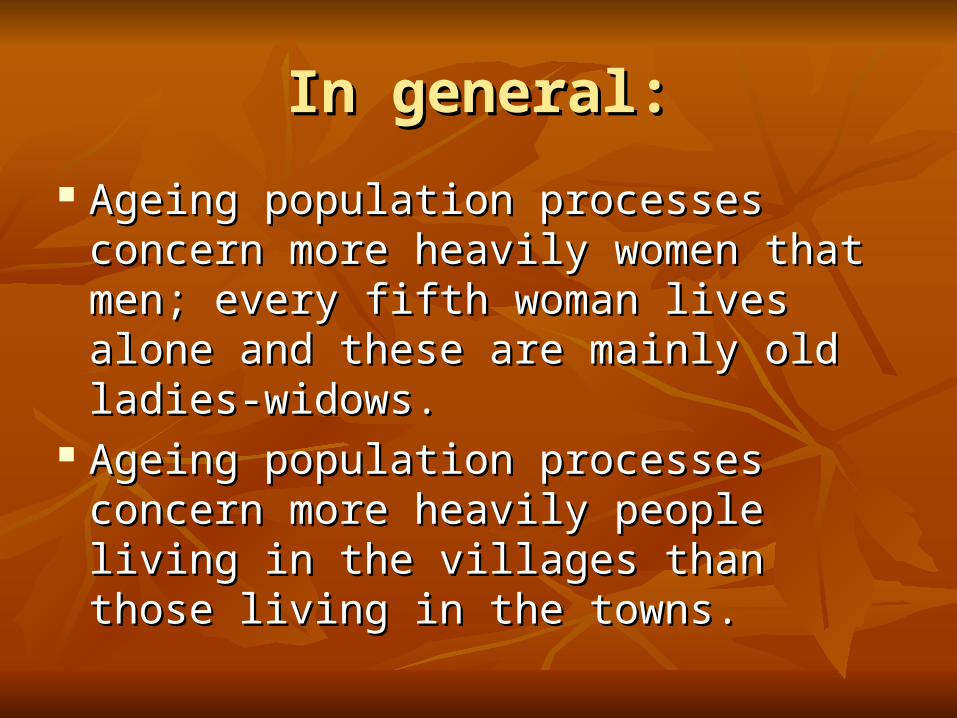
In general:In general:
Ageing population processes concern Ageing population processes concern more heavily women that menmore heavily women that men; ; every every fifth woman lives alone and these are fifth woman lives alone and these are mainly old ladies-widowsmainly old ladies-widows..
Ageing population processes concern Ageing population processes concern more heavily people living in the villages more heavily people living in the villages than those living in the townsthan those living in the towns..

Standardized Death Rates (SDR), 2002-2003Standardized Death Rates (SDR), 2002-2003
ССountryountry TotalTotal ММenen WomenWomen
BulgariaBulgaria 10891089 13341334 855855
ЕЕstoniastonia 10691069 15531553 749749
PolandPoland 10481048 14111411 785785
SlovakiaSlovakia 896896 12181218 660660
HungaryHungary 971971 13031303 729729
CEECEE 10121012 13111311 781781
ЕЕUU-15-15 639639 822822 499499

Utilization of health care expenditure by age Utilization of health care expenditure by age groups, 2003groups, 2003
0,00
1,00
2,00
3,00
4,00
5,00
6,00
7,00
8,00
Out
patie
nt V
isits
per
Cap
ita p
er Y
ear
0,00000
0,00200
0,00400
0,00600
0,00800
0,01000
0,01200
0,01400
0,01600
0,01800
0,02000
Hos
pita
l Adm
issi
ons
per
Yea
r
Outpatient - visits per year Inpatient - admissions per year

Economically active population aged Economically active population aged 15 and over by gender, 15 and over by gender, 20062006
Total number 3,448 thousand or Total number 3,448 thousand or 51.8%51.8%
IncludingIncluding
Men 57.2%Men 57.2% Women – 46.8%Women – 46.8%
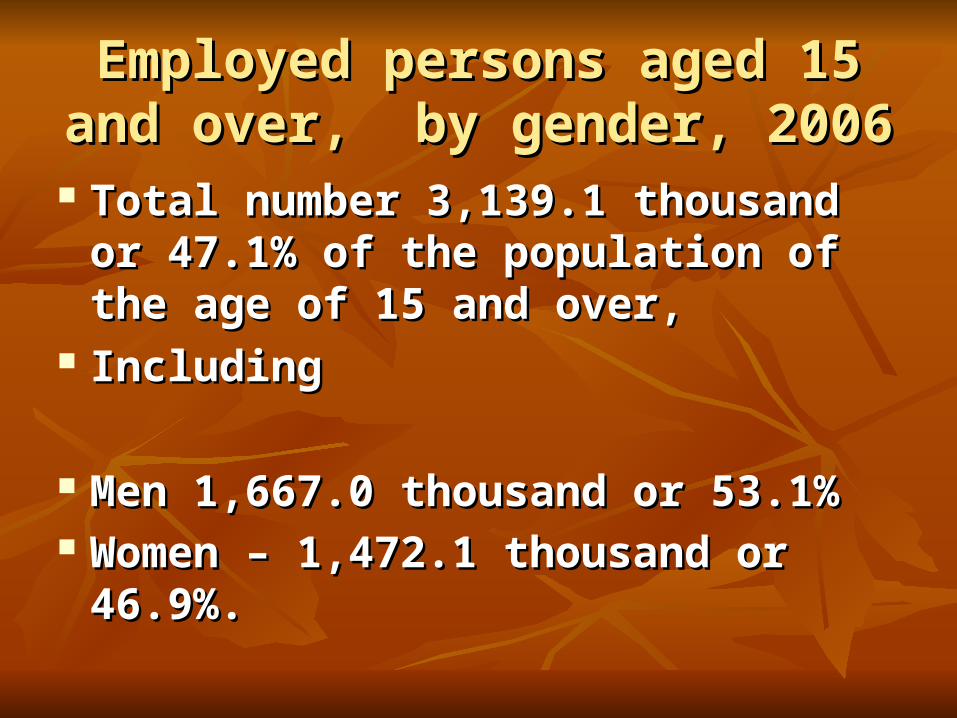
Employed persons aged 15 and over, Employed persons aged 15 and over, by gender, 2006 by gender, 2006
Total numberTotal number 3 3,,139.1 139.1 thousand or thousand or 47.1% 47.1% of the population of the age of of the population of the age of 1515 and over, and over,
IncludingIncluding
Men Men 11,,667.0 667.0 thousand orthousand or 53.1% 53.1% WomenWomen – 1 – 1,,472.1 472.1 thousand orthousand or 46.9%. 46.9%.

Employment rate, 2006Employment rate, 2006
is is 52.252.2% for men% for men andand 42.5 42.5% for women% for women. .
In the urban settlements In the urban settlements totaltotal employment rate is employment rate is 52.1 %, 52.1 %, while while in rural areas it is in rural areas it is 35.5 %. 35.5 %.

Structure of the employed persons Structure of the employed persons by employment status, 2006by employment status, 2006
8%
87%
4%1%
employers
self-employed
employed persons
unpaid homeworkers

The share of employed in private The share of employed in private sector of the total number sector of the total number employed persons has reachedemployed persons has reached nearly 80% (nearly 80% (79.779.7%%)). .

Structure of the employed persons Structure of the employed persons by economic sector, 2006by economic sector, 2006
57%
34%
9%
services
industry
agricultureand forestry

In general:In general:
The most important factor for The most important factor for access to employment of both access to employment of both men and women is their age, men and women is their age, followed by level of education, followed by level of education, place of residence, language skills place of residence, language skills and the last factor is their sex.and the last factor is their sex.

In general:In general:
The larger place of residence and the The larger place of residence and the shorter distance to the administrative shorter distance to the administrative centres the easier access to the labour centres the easier access to the labour market and particularly to a job. market and particularly to a job.

Structure of people by level of education Structure of people by level of education and genderand gender
(Source: National Statistical Institute, 2006)(Source: National Statistical Institute, 2006)
Level of educationLevel of education MenMen WomenWomen
HigherHigher 4040 6060
Secondary (high)Secondary (high) 5252 4848
Basic and lowerBasic and lower 4646 5454

Pay gap between men and womenPay gap between men and women
According to a national representative According to a national representative survey survey (“ (“Women, Labour, Women, Labour, GlobalizationGlobalization”, 2003) ”, 2003) pay gap is on pay gap is on average average 67% 67% in favour of men.in favour of men.
It is due mainly to the lack of access of It is due mainly to the lack of access of women to highly-paid jobs in spite of women to highly-paid jobs in spite of their comparatively higher level of their comparatively higher level of education.education.

Participation in life-long learningParticipation in life-long learning
There are no major differences in female There are no major differences in female and male but in general, women are more and male but in general, women are more active. active.
The place of residence, however, The place of residence, however, influences the participation level. Urban influences the participation level. Urban residents have over 3 times higher residents have over 3 times higher participation rate (25%) compared to participation rate (25%) compared to rural dwellers (7.4%).rural dwellers (7.4%).

Unemployment in 2006 Unemployment in 2006 (for 2007 up to now it is 6.8%)(for 2007 up to now it is 6.8%)
The number of unemployed persons The number of unemployed persons was was 308.9 308.9 thousand or thousand or 9.0% 9.0% of the of the economically active population,economically active population,
of whichof whichMen - Men - 159.3 159.3 thousand (8.7%) and thousand (8.7%) and Women - Women - 149.6 149.6 thousand (9.2%)thousand (9.2%)

Unemployment by place of Unemployment by place of residenceresidence
- - in in urban regionsurban regions are are 195.1 195.1 thousand orthousand or 7.4% 7.4% of the of the economically active populationeconomically active population
- in - in rural regionsrural regions - 113.8 - 113.8 thousand orthousand or 13.9%. 13.9%.

Structure of the unemployed persons Structure of the unemployed persons by level of education:by level of education:
higher - higher - 30.7 30.7 thousand (thousand (3.7%3.7%),),
secondary education - secondary education - 149.8 149.8 thousandthousand ((7.6%7.6%),),
primary or lower education -primary or lower education - 128. 128.44 thousand (thousand (19.5%19.5%)) . .

This gender analysis aims at contributing to This gender analysis aims at contributing to
the successful implementation of GB in budget the successful implementation of GB in budget planning, which means: planning, which means:
to organize more efficient cash flow management,to organize more efficient cash flow management, to balance accumulated financial resources and theto balance accumulated financial resources and theexpenditures of the territorial community,expenditures of the territorial community, to execute more effective control on raising andto execute more effective control on raising andspending of money, and for its distributionspending of money, and for its distributionbetween separate budget units on different levels.between separate budget units on different levels.

ConclusionConclusion possibilities and problems possibilities and problems
for the implementation of gender budgetingfor the implementation of gender budgeting PossibilitiesPossibilities:: - - the real needs of GB implementationthe real needs of GB implementation
- the known good practices in other countries in Europe - the known good practices in other countries in Europe and other regions of the world (Australia, Canada), some of and other regions of the world (Australia, Canada), some of which we could adopt and thus to spend timewhich we could adopt and thus to spend time
- to take an advantage of the coincidence with the - to take an advantage of the coincidence with the forthcoming process of decentralization of municipalities, forthcoming process of decentralization of municipalities, which will optimize the budget expenditures which will optimize the budget expenditures
- the implementation of Gender Mainstreaming could - the implementation of Gender Mainstreaming could proceed mainly from the European Structural Fundsproceed mainly from the European Structural Funds

ConclusionConclusion possibilities and problems possibilities and problems
for the implementation of gender budgetingfor the implementation of gender budgeting
ProblemsProblems::
- - lack of disaggregated gender statisticslack of disaggregated gender statistics
- lack of specific legislation on gender equality- lack of specific legislation on gender equality
- gender problems are not regarded as a priority compared - gender problems are not regarded as a priority compared with other severe social problems at the present timewith other severe social problems at the present time

ChallengesChallenges - - to overcome the underestimation of the gender to overcome the underestimation of the gender
problems compared with other social problemsproblems compared with other social problems
- to make the society and the policy maker to realize - to make the society and the policy maker to realize the real effectiveness of GB implementationthe real effectiveness of GB implementation
- to organize a steady process of GB implementation - to organize a steady process of GB implementation and to control itand to control it
- to take an advantage to accelerate the work on - to take an advantage to accelerate the work on Gender Mainstreaming right away after the Gender Mainstreaming right away after the impending specific legislation on gender equality impending specific legislation on gender equality will come into force will come into force

What should be done in the near What should be done in the near future related to GB?future related to GB?
To organize gender analyses in different aspects:To organize gender analyses in different aspects:- Analysis of the beneficiaries - Analysis of the beneficiaries - Analysis on the state expenditures distribution- Analysis on the state expenditures distribution- Analysis of direct and indirect taxes paid by the - Analysis of direct and indirect taxes paid by the populationpopulation
- Analysis of the budget impact on more rational - Analysis of the budget impact on more rational distribution of the time between paid and unpaid distribution of the time between paid and unpaid workwork
- Preliminary analysis of the municipal resources by - Preliminary analysis of the municipal resources by gender gender
- Preparing gender oriented project of the state budget - Preparing gender oriented project of the state budget

Thank you for your Thank you for your attention.attention.