gender source country characteristics and labor … · gender, source country characteristics, and...
TRANSCRIPT

blau_kahn_papps_immigration_paper_mar_2010.docx3/31/2010
GENDER, SOURCE COUNTRY CHARACTERISTICS AND LABOR MARKET
ASSIMILATION AMONG IMMIGRANTS: 1980-2000
Francine D. Blau Cornell University, NBER, IZA and CESifo
Lawrence M. Kahn Cornell University, IZA, CESifo, and NCER (Australia)
Kerry L. Papps University of Oxford and IZA
April 2007
Revised, October 2009
*The authors are indebted to Alberto Abadie, Martha Bailey, Charlie Brown, John DiNardo, Andrew Oswald, Mark Rosenzweig, Jeff Smith, Dean Yang, two anonymous referees and participants at the Society of Labor Economists meetings in Chicago, May 2007, the Wang Yanan Institute for Studies in Economics 2007 International Symposium on Contemporary Labor Economics, Xiamen University, Xiamen, China, December 2007, the Herman Colloquium, University of Michigan, March 2008, the Centre for European Economic Research (ZEW) Workshop on Gender and the Labour Market, Mannheim, Germany, March 2008, the Sixth Annual Migration Meeting, IZA, Bonn, Germany, May 2009, and the Cornell University Labor Economics Workshop for helpful comments and suggestions, to Fidan Kurtulus and Albert Yung-Hsu Liu for excellent research assistance and the Russell Sage Foundation for financial support. Portions of the research for this paper were completed while Blau and Kahn were Visiting Fellows in the Economics Department of Princeton University, supported by the Industrial Relations Section.
GENDER, SOURCE COUNTRY CHARACTERISTICS, AND LABOR MARKET
ASSIMILATION AMONG IMMIGRANTS: 1980-2000
Abstract Using 1980-2000 Census data to study the impact of source country characteristics on
married adult immigrants’ labor supply assimilation profiles, we find that immigrant women from countries with high female labor supply persistently work more than those from low female supply countries. While both groups of women work less than comparable natives on arrival, women from high female participation countries eventually close the gap with natives entirely, and women from low female labor supply countries eliminate most of it. Men’s labor supply is unaffected by source country female participation, suggesting that the female findings reflect notions of gender roles. Key words: immigration, labor supply, fertility, assimilation, gender
(JEL D10, J16, J22, J24, J61)
Francine D. Blau Lawrence M. Kahn School of Industrial and School of Industrial and Labor Relations Labor Relations Cornell University Cornell University 268 Ives Hall 258 Ives Hall Ithaca, NY 14853-3901 Ithaca, NY 14853-3901 NBER, IZA and CESifo IZA, CESifo and NCER (Australia) Kerry L. Papps Department of Economics and Nuffield College University of Oxford New Road, Oxford OX1 1NF UNITED KINGDOM IZA
1
I. Introduction
A steady flow of new immigration has resulted in an increase in the foreign born share of
the US population from 4.8 percent in 1970 to 11.1 percent in 2000. Perhaps more dramatically,
the percentage of the foreign born population that came from Europe or Canada fell from 70.4 to
18.4 percent between 1970 and 2000, with a corresponding increase in the Asian and Latin
American share from 28.3 percent in 1970 to 52.4 percent in 1980 and 78.2 percent in 2000.1 An
additional feature of the immigrant population that is less frequently noted is that immigrants
typically come from countries with a more traditional division of labor by gender than the United
States. Moreover, during the 1980-2000 period, the gender gap in labor supply in the United
States narrowed much more than in immigrant source countries. If immigrant women’s labor
supply behavior mirrors that in their home countries, rising shares of the US population
composed of immigrants from countries with more traditional gender roles will cause the US
female labor force participation rate to be lower than otherwise. On the other hand, if immigrant
women’s labor supply eventually assimilates to US levels, this effect would be lessened.
While some evidence suggests that source country female participation does influence
immigrant women’s labor supply behavior in the United States (Antecol 2000), little is known
about its effect on the assimilation process. The assimilation profile can shed light on what will
happen in the long run as these women are exposed to labor market conditions and social norms
in the United States. For example, suppose women from a more traditional source country have
on average a 20% hours shortfall relative to comparable immigrant women from less traditional
countries. This could reflect a substantial and persistent 20% shortfall throughout their time in
the United States, or, say, a 40% shortfall during the early stages of their time in the United
States, which falls to zero with longer residence. The two scenarios have different implications
1 These figures on the presence and source region of the foreign born were taken from: http://www.census.gov/population/www/documentation/twps0029/tab02.html and http://www.census.gov/population/www/socdemo/foreign/STP-159-2000tl.html.

2
for convergence of the group to comparable natives and may impact the labor supply behavior of
the second generation of immigrants as well.
In this paper, we study the impact of traditional gender roles in immigrant source
countries on the assimilation of married immigrant women and men into the US labor market.
This paper contributes to a broader literature examining the impact of “culture” or preferences
and beliefs developed in a different time or place on current economic behavior (Fernández
2008), and, in particular, the impact of source country characteristics on immigrant women’s
behavior in the United States. We build on Antecol (2000), who found, using the 1990 Census,
that source country female labor force participation rates were positively correlated with US
labor force participation of immigrant women, even controlling for human capital characteristics.
In addition, Blau’s (1992) study of the effect of source country fertility rates on immigrant
women’s fertility also suggests an impact of gender roles in source countries on the behavior of
immigrant women in the United States. Also of interest is Antecol’s finding of a positive,
though weaker, correlation between US and source country participation for “second and higher
generation” immigrants, defined by their answer to the Census question on ancestry. Similarly,
the labor supply and fertility behavior of US-born daughters of immigrants (the second
generation) has been found to be positively associated with both female participation and fertility
rates in their parents’ country of origin (Fernández and Fogli 2009) and the participation and
fertility patterns of immigrants from those origin countries (Blau, Kahn, Liu and Papps 2008).
To examine the impact of source country characteristics on immigrant women’s
assimilation into the US labor market, we use the 1980-2000 US censuses, which we augment
with an extensive set of source country characteristics, as described in the Appendix. These
include two indicators of the extent of traditional gender roles in the source country: (i) female
relative to male labor force participation and (ii) women’s completed fertility. In addition, in
contrast to most earlier work,2 we control for a variety of other source country characteristics
which may affect immigrants’ labor supply behavior in the United States, thus increasing the
2 Blau (1992) is an exception.

3
likelihood that our models estimate the true effect of source country female labor supply and
fertility rather than the impact of omitted factors that are correlated with these variables.
Moreover, results for the impact of these control variables on the assimilation profile are of
considerable interest in themselves in shedding light on the economics of immigration generally.
Our design allows us to characterize the impact of these source country characteristics on the
entire labor supply assimilation profile, an analysis which previous research on immigrant
assimilation has not performed. We measure source country characteristics at the time each
immigrant came to the United States, although our results are robust to alternative specifications.
This is appropriate, since we would like a measure of the tastes or economic incentives one left
behind in deciding to migrate and changes in the strength of their effect over time in the United
States. We focus on married immigrants for whom gender roles are expected to have a greater
effect and in order to explicitly consider the division of labor in the family among immigrants
compared to natives.
Higher female labor force participation rates in the United States than in many immigrant
source countries may ultimately be due to tastes and beliefs about women’s appropriate roles in
society, although they may also be due to different economic incentives (e.g., higher female
relative wages) in the United States than in the countries of origin. If differences in labor supply
behavior between immigrant women from high and low participation source countries tend to
persist over time in the United States, it suggests that cultural factors are indeed important. If,
however, the labor supply of women from both groups tends to converge as both assimilate to
the US native levels, one might conclude that the hold of home country beliefs on women’s
appropriate roles is relatively weak in the face of US work incentives and possibly a US market
work-oriented culture. By investigating the impact of source country relative female labor
supply on the labor supply assimilation profiles of immigrant women we provide an explicit test
of the persistence of these effects and hence of the potential role and strength of source country
culture on immigrant behavior in the United States. Because immigrants are likely to differ from
natives in significant unmeasured ways, comparing labor supply assimilation paths of
4
immigrants from more and less traditional source countries is a useful way to study the impact of
cultural factors. The great variety of immigrant source countries from which immigrants to the
United States originate, spanning such diverse cultures as those in Scandinavia, Latin America,
Asia, and the Middle East, provides considerable variation in the source country gender division
of labor. Our research design uses this variation to study the issue of assimilation.
In addition to its focus on the assimilation process, our research design provides new
evidence on the impact of source country culture in a number of other ways. First, we examine
the effect of female relative labor supply in the source country on immigrant male labor supply
behavior. An effect of traditional source country patterns that is unique to or stronger for women
than men suggests that the effect for women reflects source country gender roles rather than
other unmeasured factors that may be expected to have a similar effect for both men and women.
Second, we investigate the impact of source country relative female participation of immigrant
men on the labor supply behavior of their native-born wives. A positive correlation between
immigrant husband’s source country female participation and the labor supply of native-born
wives may be due to immigrant men selecting marital partners with similar preferences or
directly impacting the labor supply behavior of their wives, e.g., by being more or less helpful
with family chores or supporting or opposing their labor force entry or career commitment. In
either case, an effect of husband’s source characteristics on these wives is suggestive of an effect
of source country culture on US behavior.3 Finally, unlike previous work on immigrants, we
distinguish between the effects of a woman’s own source country from that of her husband’s
country of origin in the cases where the couple migrated from different countries. This sheds
light on the relative importance of wives’ and husbands’ source country characteristics in
influencing wives’ labor supply when both spouses are foreign born.
A study of the impact of source country characteristics on immigrant women’s labor
supply assimilation raises the question of the shape of that profile and how (or if) it may differ
3 This is similar to Fernández, Fogli, and Olivetti’s (2004) finding of a positive effect on wife’s labor supply of a husband coming from a family in which his mother worked, a result which they interpret as evidence of an impact of culture.
5
between women from more and less traditional source countries. The standard expectation might
be that the assimilation profile would be upward sloping for both husbands and wives, where the
immigrant would start at a disadvantage relative to otherwise similar individuals due to the
disruptions of immigration that could lead to difficulty in finding a job or to temporarily working
positive, but less than desired, hours. The impact of these disruptions is expected to decrease
over time and immigrant labor supply is expected to approach that of natives. A period of
disruption may be even more likely for married women than married men to the extent women
are “tied movers” (Mincer 1978). In addition, some visas obtained by husbands (generally the
primary earner) may not permit their spouse to work.4
An alternative possibility is raised by the family migration model proposed by Baker and
Benjamin (1997) that predicts women will initially take dead-end jobs to finance their husbands’
human capital investments and eventually drop out of the labor market or reduce their labor
supply as their husbands’ labor market outcomes improve. Rather than convergence toward
native labor supply levels, this model predicts a negatively-sloped labor supply profile for
immigrant women relative to natives, a finding that has been observed for Canada (Baker and
Benjamin 1997); but not for the United States (Blau, Kahn, Moriarty and Souza 2003). A recent
study by Cobb-Clark and Crossley (2004), using Australian data, focuses on immigrant families
who migrated together and examines the behavior of the “secondary worker” in such families
(the spouse of the family member who applied for admission to the country). When the
secondary worker in the family is a woman, she works more on arrival than immigrant women in
mixed (immigrant-native) families, supporting the family migration model; but when the
secondary worker is male, he works less than in mixed families, a finding inconsistent with the
model.5
4 We do not have data on visa type, which may be correlated with country of origin characteristics. However, in one of our specifications, we control for source country fixed effects, which may absorb some of the effect of visa requirements, thus making the interpretation of the measured country characteristics stronger than otherwise. 5 The data did not allow the authors to compare immigrant labor supply to that of natives or to follow the immigrants over a long time period, thus preventing analysis of long term changes in immigrant labor supply.
6
The logic of the family migration model, as well as the findings by Cobb-Clark and
Crossley (2004), suggest that gender roles within the family are potentially important in
determining its applicability. One might expect the family migration model to hold more
strongly for families coming from countries with a more traditional division of labor by gender.
If so, couples migrating from such countries may be expected to exhibit more specialization by
gender, implying that immigrant women’s assimilation profiles will have a higher intercept and
more negative (or perhaps less positive) slope the more traditional the source country. While a
complete test of the family migration model is outside the scope of this study, we may contribute
to the literature on this topic by providing evidence on this hypothesis.
II. Data and Descriptive Patterns
Our basic data source is the 1980, 1990 and 2000 US Census of Population public use
micro-samples. In addition, we assembled a time-series, cross-sectional database on source
country characteristics, which we merged into the Census microdata for immigrants based on
their country of origin and the date they arrived in the United States. Because of changes in the
list of countries across censuses, in some cases it was necessary to aggregate countries and
compute appropriately weighted country characteristics. We also performed some imputations
for missing data. (See the Appendix for further details.) Note that the measure of source country
female labor supply we employ is women’s labor force participation relative to men’s (female
LFP/male LFP). This relative measure is appropriate in that it captures the gender division of
labor explicitly. A further advantage is that it implicitly adjusts for problems in measuring the
labor force, particularly at different levels of economic development, at least to the extent that
such problems affect men’s and women’s measured participation rates similarly.
We focus on individuals aged 18-65 who are married to someone aged 18-65 and restrict
the immigrant sample (respondents and spouses) to those who migrated as adults—age 18 or
7
over.6 This is desirable because our empirical approach relies on within immigrant arrival cohort
changes to estimate assimilation effects. If child immigrants are included, some immigrants who
recently arrived in the United States as children will be excluded from the sample of those aged
18-65 in an initial Census but will have attained age 18, and therefore eligibility for sample
inclusion in subsequent Censuses. Thus, the composition of the immigrant sample would change
with time in the United States, as those arriving as children comprise a higher share of those with
longer duration of residence (Friedberg 1993). This is likely to bias the results because those
migrating to the United States as children may be less affected by home country characteristics
and more similar to native-born Americans when they reach adulthood than those migrating as
adults. This also implies that adult immigrants, who are the large majority of immigrants, are the
more appropriate sample on which to study the assimilation process in any case. We use all
immigrants for whom we can match source country characteristics and, for tractability, we take a
4% sample of natives, whom we appropriately weight in all analyses. Overall, we were able to
match over 99% of immigrants who had valid, non-allocated values for country of birth and year
entered the United States to source countries for which we were able to obtain the source country
variables.
Table 1 contains descriptive information on labor market outcomes and personal
characteristics in our sample of married individuals for (adult) immigrants and natives in the
1980 and 2000 Censuses, although we additionally use the 1990 Census in the regression
analyses. Table 1 indicates that, in both years, immigrant women have lower labor supply
(measured either by the probability of positive hours or by average annual work hours, including
those with zero hours) and more children than US women, even though they are about the same
age. Moreover, while immigrant and native women both increased their labor supply between
1980 and 2000, the native-immigrant gap grew considerably: in 1980, natives worked 66 hours
(8%) more than immigrants; by 2000, the gap was 319 hours (32%). In contrast to women,
6 The spouse restriction means that natives or adult immigrants who are married to child immigrants are excluded from the sample.
8
immigrant men worked only 8% fewer hours than native men in 1980, a gap that increased only
slightly (to 11%) by 2000. Thus the gender gap in labor supply fell much more for natives than
for immigrants. Table 1 also shows a widening educational gap between immigrants and natives
and an increase in the relative share of minorities among immigrants.
The finding of a growing immigrant-native labor supply gap among women in the United
States raises the question of whether there are similar trends when female labor supply in
immigrant source countries is compared to that in the United States. To the extent that source
country labor supply patterns mirror the growing native-immigrant gap in labor supply, we may
also ask whether this is associated with a shift in the composition of countries from which
immigrants originate versus different time trends within sending countries and the United States.
These questions are addressed in Table 2, based on our sample of 106 countries, which shows the
mean characteristics of source countries of immigrant women for 1980 and 2000, with source
country characteristics measured at the time immigrants migrated to the United States. (We omit
a corresponding table for men, since the source countries of immigrant men and women tend to
be quite similar.) The table also shows the corresponding means for the United States, similarly
weighted by the number of immigrants in each arrival period cell. For immigrants, two sets of
weights are employed: (i) contemporary-year weights (i.e., 1980 in 1980 and 2000 in 2000) and
(ii) fixed-year weights that hold the mix of source countries constant at the indicated year (1980
or 2000).
Looking first at the results for contemporary-year weights (columns (1) and (5) for
immigrants; columns (3) and (6) for the US), Table 2 indicates that, in each year, the average
immigrant woman came from a country which, at the time of her arrival in the United States, had
lower relative female labor force participation and higher fertility than the United States had at
the same time. Moreover, although average home country relative female labor supply at the
time of arrival increased over the period, the corresponding US value increased by considerably
more, resulting in a growing gap between US and source country relative female labor force
participation—mirroring what we found for immigrant-native differences in the United States.

9
Similarly, source country fertility at time of arrival is higher than US fertility in each year and
fell, but by less than the corresponding US fertility decline. We note however that for recent
immigrants (those who arrived in the past five years) source country fertility decreased
substantially relative to US fertility and was only 44% above the US level for recent immigrants
in 2000, compared to 2.3 times the US level in 1980 (results not shown).7 Thus although origin
countries have higher fertility than the United States, the gap is closing at the margin. Table 2
also indicates that had the distribution of origin countries stayed the same, source country
fertility would have been reduced considerably (compare column (2) with (1) and column (5)
with (4)). However, the relative female participation rate—the key variable for our study—
remains roughly constant when source country mix is fixed.
There were some trends in the control variables as well. The gap between US and source
country GDP per capita increased both absolutely and relatively; this trend was fueled by shifts
in source country mix. Immigrants were less likely to have come from English-speaking
countries in 2000 than 1980, and average distance between the United States and the source
country increased. (Since these variables are fixed over time, these shifts were of course entirely
due to the shifting composition of source countries.) On the other hand, primary and secondary
enrollment gaps between the United States and immigrant source countries have narrowed.
However, the convergence would have been greater had the source country mix remained
constant and, moreover, the secondary enrollment gap remains quite large.
III. Empirical Procedures
Our analysis of the impact of source country characteristics on the labor supply
assimilation of immigrants compares immigrants to natives with the same observable
characteristics. Thus, assimilation here refers to the degree to which immigrants’ labor supply
7 Using recent arrival weights (i.e., the US values for 5 years before each Census), US fertility fell between 1980 and 1990 and then rose back to its 1980 level by 2000.
10
patterns converge to those of otherwise comparable natives. We estimate equations of the
following form on our pooled Census microdata separately for men and women:
��� � ����� � ∑ �� ���� � � ∑ ��� ����
�
�∑ ����,� ����� ����
� � ∑ ��� ���� � ∑ ��� ����
� (1)
�∑ ����,� ����� ����
� � ����90�������00�� � ���
where for individual i in immigrant arrival cohort c, immigrant years since migration category y,
and Census year t (t=1980, 1990 or 2000), H is annual hours worked in the previous year (usual
weekly hours times weeks worked, including those with 0 hours), X is a vector of controls, ����
and ���� are a series of own and spouse ( and ! superscripts) immigrant cohort-of-arrival
dummy variables, ����� and ����
� are a series of dummy variables referring to own and spouse
years since migration (YSM), ����� and ����
� are a series of own and spouse source country
characteristics indexed by j, �90�� and �00�� are year dummies for 1990 and 2000, and ��� is an
error term.8 The dummy variables for immigrant arrival cohort and years since migration
category ( ���� , ���
� , ����� and ����
� ) and the immigrant source country characteristics (����� and ����
� )
are all set to zero for native-born respondents or spouses. We cluster the standard errors at the
respondent’s year of arrival-source country level, treating the US as a source country for natives.
We cluster in this way because this is the level of variation of our group-level explanatory
variables; however, results were robust to alternative assumptions, including clustering at the
source country and source country-Census year level. After creating sampling weights to reflect
the random sample of natives and taking into account Census sampling weights for 1990 and
2000, we adjust each year’s weights so that the total weight of each year’s observations is the
same.
We define the cohort of arrival and years since migration variables for immigrants and
their spouses as follows. Since the immigrant arrival period is defined in interval form in the
8 We also interact own and spouse education with the YSM dummies.

11
1980 and 1990 Censuses, we define sets of cohort of arrival and years since migration dummy
variables that are consistent across the three Censuses. We specify the years since migration
variables as dummies, rather than forming a continuous variable (say by evaluating the intervals
at their midpoints), in order to capture all the available information in the most flexible form.
The full set of years since migration dummies is included: 0-5, 6-10, 11-15, 16-20, and 21-30
years in the US (these are the ����� and ����
� dummies). The sum of the years since migration
dummy variables for the respondent (the ����� ) would be identical to a respondent immigrant
dummy variable, and the sum of the spouse years since migration dummies (the ����� ) would be
identical to a spouse immigrant dummy variable; therefore, respondent and spouse immigration
indicators are not separately included in equation (1). Using the full set of years since migration
dummies requires us to omit one of the possible arrival cohort dummy variable categories; we
have omitted the 1950-59 cohort for both the respondent and spouse. Thus, the cohort of arrival
dummies include: 1995-2000, 1991-94, 1985-90, 1980-84, 1975-79, 1970-74, 1965-69, and
1960-64 (these are the ���� and ���
� dummies). Pooling the sample across three Census years
and assuming common period effects for immigrants and natives together allow us to separately
identify immigrant cohort and assimilation effects (Borjas 1985).
The interval form of the arrival period in the 1980 and 1990 Censuses also affects our
restriction of the sample to adult immigrant respondents and spouses. For each arrival interval,
we only include immigrants who we can definitely conclude were at least 18 years old on arrival
in the United States.9 For comparability, similar procedures are followed for the 2000 Census
data. This requires us to exclude individuals in the open-ended arrival category in the earlier
Censuses (i.e., pre-1950), since we cannot ascertain whether such individuals migrated as
children or adults. The resulting maximum years since migration is thus 30 for 1980, and, for
9 That is, if the immigrant arrived between A0 and A1, we take only individuals for whom (A0 – BY) ≥ 18, where BY is birth year as calculated from the individual’s reported age. An alternative would have been to evaluate the arrival intervals at their midpoints and calculate age of arrival accordingly. We follow former procedure due to its greater accuracy in excluding child immigrants (see Bleakley and Chin 2004).
12
comparability, a maximum of 30 years since migration is also set for 1990 and 2000. This
explains why the above years since migration dummies exhaust the sample of adult immigrants.
The source country characteristics ����� and ����
� are measured at the time the individual
migrated to the United States and, as noted above, are set equal to zero for natives. Thus, they
are in effect interactions between an immigrant dummy variable and the source country
characteristics. Because the years since migration dummies (����� and ����
� ) add up to one for each
immigrant respondent or immigrant spouse, for each country characteristic, the sum of its
interactions with the years since migration variables equals the country characteristic itself.
Therefore we do not include main country characteristics effects (����� and ����
� ). The
specification in equation (1) allows the source country variables to affect both the level of labor
supply and the impact of time in the United States on labor supply.
Source country variables were selected to serve as indicators of the degree to which the
home country has a traditional division of labor by gender and the extent of labor market
preparedness of men and women, and to address possible issues of selective migration. They
include: the female labor force participation rate/male labor force participation rate; the total
fertility rate (an estimate of completed female fertility); GDP per capita in 2000 US dollars; the
proportion of immigrants arriving in the period who were refugees; the female (female
regression) or male (male regression) enrollment rates in primary school and secondary school; a
dummy variable for whether the country is English speaking; a dummy variable for countries
that are not English speaking but in which English is an official language;10 and the distance
between the source country and the United States.
Female relative labor supply and fertility rates in the source country are indicators of
traditional gender roles in the source country. Moreover, these variables, as well as GDP per
capita, education, and use of English are all likely to be related to preparedness for work in the
US labor market. In addition, migration likely involves a disruption of work patterns due to
housing and job search in the United States. Refugees and those who have come a long distance
10 The English speaking and English official variables are from Bleakley and Chin (2004).
13
may suffer the largest disruption, possibly steepening their work assimilation profiles.
Alternatively, because of the fixed costs of migration, those who come from a greater distance
are likely to have higher labor market returns to migration than those coming shorter distances,
all else equal (Chiswick 1978) and this potential selectivity could also be reflected in work
assimilation patterns. For example, migrants moving from a longer distance may be more likely
to have jobs lined up in the United States (contributing to their higher rate of return to
migration), thus raising their work hours at entry and flattening their assimilation profiles (i.e.,
the opposite predictions from the disruption mechanism). Thus, the impact of distance on
assimilation profiles is theoretically ambiguous.
The combination of the cohort and years since migration dummies allows us to
completely characterize immigrant labor supply over time in the United States relative to that of
natives, controlling for the X variables and year effects. The X variables include the following
for respondent and spouse: age, age squared, three education dummies (high school degree,
some college, and college degree, with less than high school as the omitted category),
interactions between an immigrant dummy and the three education dummies, and three
race/Hispanic origin dummy variables (black non-Hispanic, other non-Hispanic, and Hispanic,
with white non-Hispanic the omitted category). X also includes eight Census region dummies,
and dummy variables for each of California, Texas, New York, Florida, Illinois and New Jersey,
the states with the largest immigrant populations. Of special note in our controls is the inclusion
of immigrant-education and spouse immigrant-education interaction terms.11 These variables
allow the impact of education on labor supply to be affected by whether the education was
obtained in the United States and further allow an immigrant’s (or immigrant spouse’s) level of
education to affect the assimilation process. In addition, because we have included source
country school enrollment levels, these interactions in effect transform the immigrant and spouse
immigrant education impacts into effects relative to source country schooling. Implicitly then,
11 Recall that since the own and spouse cohort YSM dummies add up to an own and a spouse immigrant dummy respectively, we do not include main effects for immigrant and spouse immigrant.

14
these variables control for self-selection of immigrants by education, as well as for the
substantive effect of education. Immigrants who are higher up in the educational distribution of
their country of origin may differ in their unmeasured characteristics from those with an equal
level of education who place lower in their home country’s educational distribution. To the
extent this type of selection is controlled for by our specification, we expect to obtain estimates
of the effects of other explanatory variables that are less biased by selectivity. We also note that
equation (1) is a reduced form specification. We seek to estimate the total effects of the source
country variables on the immigrant assimilation process in the United States. We exclude
variables such as number of children and wages, which may be considered endogenous to the
assimilation process.12
We initially estimate equation (1) for all married women and all married men, in order to
characterize the overall effects of source country characteristics on the married immigrant
population’s labor supply assimilation profiles. These estimates pool a number of immigrant
family types—immigrants married to immigrants from the same and different countries, as well
as immigrants married to natives—with our reference group of natives married to natives. In
addition to estimating our models on these subsamples, we implement a number of robustness
checks and alternative specifications on the basic sample of married women. These include
breaking up annual labor supply into the intensive (hours given employment) and extensive
(incidence of employment) margins, measuring source country characteristics as of age 17 (a
perhaps formative age), measuring them as of the current period (perhaps reflecting changing
norms in one’s source country), adding country dummy variables (in order to eliminate any
possible correlation between omitted country-specific factors and the key country characteristics
examined), and using all adults—married and nonmarried (in order to address the possibly
changing selection into marriage).
IV. Results 12 Results are broadly similar in models including these variables; see, Blau, Kahn and Papps ( 2008).

15
A. Source Country Characteristics and Assimilation Profiles for Labor Supply: All
Married Couples
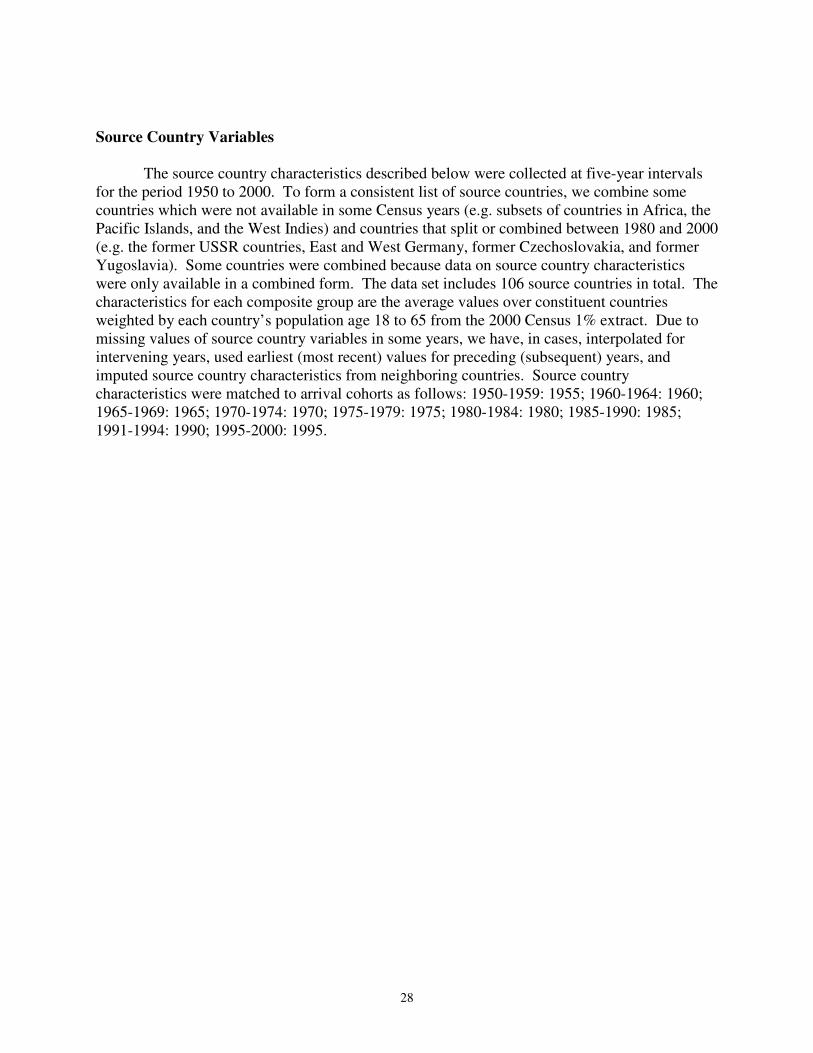
The basic findings from estimating equation (1) are summarized in Table 3 and Figure 1
(for women) and Table 4 and Figure 2 for men. We focus on the sum of the own and spouse
effects of the source country characteristics. The sum corresponds to an experiment in which we
compare a married couple who migrated together from one source country to an otherwise
similar couple who migrated together from a different source country. This is a reasonable way
to summarize the results in that data from the 1980 Census suggest that a couple migrating
together from the same source county is the modal family type for immigrant couples. In 1980,
we have information on individuals’ age at first marriage and the number of times they have
been married. (Unfortunately, there is no comparable information in the 1990 and 2000
Censuses.) Among immigrant women who were in their first marriage (91.0% of immigrant
women), 73.8% were married to immigrants. Of these women, between 62.9 and 78.4% were
married before arriving in the United States to a spouse who arrived at the same time. (This
range occurs because the arrival year is coded in intervals.)13 For both estimates, 89% of the
women identified as married at arrival were from the same source country as their husband. A
further reason for summarizing our results by summing the coefficients for respondents and
spouses is precisely because a high proportion of immigrant couples do come from the same
source country; pooling all Census years, 90.3% of immigrant women married to immigrant men
came from the same source country as their husband. This results in considerable collinearity
between respondent and spouse source country characteristics among immigrant couples—for
example the correlation between wives’ and husbands’ source country female relative activity
rate is 0.942,14 making precise estimates of their individual effects problematic in the 13 The lower figure uses the start point of each arrival interval; the higher figure uses the endpoint. 14 This high correlation also partly reflects a substantial correlation (0.429) between wives’ and husbands’ female relative activity rate even among immigrants married to immigrants from different source countries.

16
specification that pools all family types. Below, we further investigate this issue by looking at
various family types separately (e.g., immigrants migrating from different source countries, or
immigrants married to natives).
Looking first at the results for relative female labor supply in the female regressions, we
see that the source country relative activity rate has a positive, significant effect on annual hours
in each YSM category. Thus, source country female labor supply is strongly positively
associated with immigrant women’s labor supply behavior in the United States. Table 3
indicates that this effect is roughly stable across YSM categories; the effect of the activity rate
ratio on labor supply at 6-10 through 21-30 years since migration is not significantly different
from its effect at arrival (0-5 years), although the point estimate rises somewhat through the 16-
20 year category before dropping back in the 21-30 year group. Thus, the factors mentioned
earlier that might potentially cause the gap between women from high and low activity rate
source countries to intensify or decay over time in the United States appear to roughly cancel
out.
These effects and the relationship of immigrant women’s labor supply to the native-born
reference group are illustrated in Figure 1. The figure shows simulated assimilation profiles for
adult immigrant women married to adult immigrant men who came to the United States from the
same country and at the same time, assuming the couple migrates from a country with (i) a high
female relative activity rate, at the 75th percentile of our sample, or (ii) a low female activity rate,
at the 25th percentile. This calculation uses individual immigrants, not individual source
countries, as the unit of analysis, thereby giving countries sending larger numbers of immigrants
more weight in computing the percentiles. The 75th percentile figure is 0.636 and corresponds
roughly to the Austrian value for the relative female activity rate for 1996, while the 25th
percentile is 0.368 and roughly the level for Pakistan in 1994.15 In order to construct the profiles,
15 For these and other examples in the text of the countries corresponding to the percentiles, we sometimes refer to interpolated data.

17
we assume the sample averages for the cohort arrival dummies and the source country
characteristics apart from the female relative activity rate.
As may be seen in the figure, there is a substantial and persistent gap between the annual
hours of women from high and low activity rate countries: an unweighted average of 136 hours
across YSM categories, corresponding to 14% of immigrant women’s mean hours of 939. Both
groups of women work less than comparable natives upon arrival: 279 hours less for women
coming from a high female activity rate country and 403 hours less for those migrating from a
low female activity rate country. These are sizable deficits of 26% and 37% relative to the
sample average work hours (including natives) of 1093. Work hours for women from both types
of countries assimilate dramatically over time relative to comparable natives. Women from high
female labor supply countries work roughly the same number of hours as natives after 6-10 years
and work at or above the native levels thereafter. Women in families migrating from low female
labor supply countries continue to work less than natives throughout their residence in the United
States, but by the 21-30 year mark they have reduced their deficit to 126 hours (12%). These
upward sloping assimilation profiles for women from both high and low female labor supply
source countries are not consistent with the family migration model.
The assimilation results for married adult immigrant women can be compared to those for
married men, as shown in Table 4 and Figure 2. The activity rate ratio interactions are not
significant and, in the figure, the profiles for men born in high and low female labor supply
countries are virtually identical. Thus, source country female labor supply clearly has much
more important effects on immigrant women’s than immigrant men’s labor supply. The gender
difference in findings is suggestive of an impact of culture and norms of the source country,
rather than unmeasured factors associated with labor supply that might be expected to affect men
and women similarly.
A further indicator of a traditional source country division of labor is its fertility rate.
Tables 3 and 4 indicate that, for each YSM category, work hours are negatively related to source
country fertility for both men and women; these differences are significant for men in each case

18
and for women in four of the five cases (all but the 0-5 years since migration category ).
Evaluating these effects at the 25th (2.49 children or roughly Chile’s 1996 value) and 75th
percentiles (5.63 children or roughly Iran’s 1990 level) of the source country fertility rates yields
an impact of between 79 and 185 hours for women (8-20% of the immigrant mean) and 101 and
204 hours for men (5-11% of the immigrant mean). There is no evidence that the effect of
source country fertility differs with time in the United States for men; for women the effect of
fertility is significantly more negative at 11-15 years since migration than at arrival. Thus, as in
the case of the activity rate, we find substantial and persistent differences in the labor supply
behavior of women from high and low fertility source countries; however, in this case, we find
similar evidence for men as well.
In addition to the effect of traditional gender roles (i.e. relative female activity rates and
fertility), Tables 3 and 4 show some interesting effects of other source country characteristics on
immigrants’ labor supply assimilation profiles. First, coming from a country where English is an
official language has large, statistically significant positive effects on both women’s and men’s
labor supply on arrival: 244 hours for women (26% of the immigrant mean) and 370 hours for
men (39% of the immigrant mean). For both men and women, this difference falls dramatically
with years since migration. For men, the interactions with YSM are no longer significant after
10 years in the United States; for women the interactions remain significant until the 21-30 years
YSM category. The impact of coming from an English speaking country also shows a pattern of
positive effects on men’s and women’s labor supply that decline with time in the United States,
although coefficients are smaller and less often significant.
Second, for both men and women, coming from a greater distance significantly reduces
work hours at arrival. For example, increasing the distance by 5000 miles (roughly the
difference between Canada’s distance and Japan’s distance to the United States) reduces
women’s work hours at arrival by 145 and men’s by 175. However, for both men and women,
the interactions of distance with YSM category are no longer significant after 0-5 years and are
smaller in absolute value than the effect at arrival. Thus, coming from a long distance appears to

19
produce an initial disruption for both men and women that is made up after a relatively short
time in the United States. Since distance does not affect long-run work hours for either men or
women, it does not appear to be an indicator of positive or negative selection with regard to work
behavior. It is also worth noting that refugee proportion has a negative effect on labor supply
that is substantial and significant for men. The effect for males falls in magnitude from -431 at
arrival to -215 after 21-30 years, consistent with a disruptive effect of leaving as a refugee (as
argued earlier); however, this difference (between the effect at arrival and at 21-30 years) is not
statistically significant.
Third, the assimilation profiles differ in interesting ways by level of schooling. For both
men and women, the immigrant-native gap in work hours at arrival (i.e. immigrant hours minus
native hours, all else equal) is much more negative for immigrants with at least a high school
degree than it is for high school dropouts, and these differences are large and highly significant.
Moreover, the gap increases in magnitude with level of education and is largest for college
graduates. For each education category, these effects relative to high school dropouts diminish
in magnitude with time in the United States, indicating steeper assimilation profiles relative to
natives for the more highly educated.16 It is possible that the labor market is more specialized for
those with higher levels of schooling and that it therefore takes a longer period of job search or a
need for additional training for these workers to locate an acceptable job. Additionally, the more
specialized labor markets for those with higher levels of schooling may require additional visas
not needed in more menial jobs, again potentially explaining the lower relative work hours at
arrival and steeper slopes for the more highly educated.17
16 Differences relative to 0-5 years since migration are significant in all cases for men and for those with a college education (some college and graduates) for women. To calibrate the education effects in Tables 3 and 4 relative to natives, we may, as in Figures 1 and 2, evaluate the immigrant-native difference in work hours for high school dropouts for immigrant women married to immigrant men who came to the US from the same country and at the same time, assuming the sample averages for the cohort arrival dummies and the source country characteristics. These differences for women (men) are: 0-5: -146 (-136); 6-10: 57 (137); 11-15: 72 (180); 16-20: 48 (210); 21-30: .3 (297). 17 It is possible that the need for specialized visas for highly technical work or for study at US universities is correlated with some of the country characteristics we have included in our regressions. However, as noted above, our basic conclusions hold even when we include country fixed effects.
20
B. Source Country Characteristics and Assimilation Profiles for Labor Supply:
Separately by Family Type
The findings in Table 3 and Figure 1 suggest a permanent, roughly constant, gap in work
hours in favor of women coming from countries with high female labor force participation
relative to low participation for the overall sample of immigrant women. In Tables 5 and 6, we
probe the results further by examining them for a number of different family types separately. In
each case, the estimated regressions include the indicated subsample of immigrant women and
the base group of native women married to native men. The first two panels show findings for
(1) immigrant women married to immigrant men, and (2) immigrant women married to
immigrant men arriving at the same time from the same country. In Panel (1), we continue to
sum own and spouse source country effects, while in Panel (2), there is only one set of source
country characteristics by construction. In either case, the results are almost identical to those in
Table 3 for both activity rate and fertility. And Figure 3 shows very similar assimilation profiles
among immigrant women married to immigrant men coming from the same country and at the
same time by source country female relative activity rate to those in Figure 1, which was
estimated for all married immigrant women. This close correspondence is perhaps not
surprising, given the substantial share of immigrant women married to immigrant men arriving at
the same time from the same source country noted above.18 The results in panel (2) are of
interest in that they allow for a sharper test of the family migration model in that it might be
argued that this model applies most strongly to couples arriving from the same country at the
same time. However, the results continue to be inconsistent with the family migration model.
Panel (3) of Table 5 shows results for immigrant women married to native men. Fertility
in one’s source country has no effect, while the source country female relative activity rate has a 18 For the full sample (pooling all Census years), 77% of married immigrant women are married to immigrant men; 70% are married to immigrant men from the same country; and 53% are married to immigrant men who migrated from the same country at the same time.

21
positive effect that is generally smaller in magnitude than in the samples of immigrant women
married to immigrant men (Panels 1 and 2). Panel (4) shows a positive association between
source country female labor supply in the husbands’ source country and the labor supply of
native women married to immigrants; the estimated effect is smaller than for immigrant women
who are married to natives (Panel 3). Taken together, these results suggest a role for husband’s
source country female activity rate on wife’s behavior. The effect of the husband is suggested by
the fact that the effect of activity rate ratio is smaller when only the wife is an immigrant (Panel
3) and that an effect is obtained for the native-born wives of immigrant men (Panel 4). As
discussed above, these correlations could represent an impact of husbands on the behavior of
wives, or selection of spouses who share similar values, but in either case a role for culture is
suggested. Finally, the absence of an effect of the source country fertility rate on labor supply in
Panels (3) and (4) is another indication that its effect among immigrant couples may not be due
to the impact of culture but rather other unmeasured source country factors correlated with
fertility. This interpretation was also suggested by the finding that the impact of source country
fertility on labor supply was negative for immigrant men as well as for immigrant women.
The fact that the impact of source country female relative activity on wife’s labor supply
was found to be smaller for native women married to immigrant men (Panel 4) than for
immigrant women married to native men (Panel 3) suggests that the impact of a women’s own
source country characteristics on her behavior is greater than the impact of her husband’s. We
probe this question further in Table 6 where we contrast the effects of a woman’s own source
country characteristics and those of her spouse in the case where the members of the couple have
migrated from different countries. There are about 20,000 such cases in our pooled Census data.
A caution we note here in disentangling these effects is that, even among this sample, there is a
high correlation (0.429) between wives’ and husbands’ female relative activity rate–this
correlation is in itself suggestive of a cultural effect. The results indicate that the effect of
women’s own country female relative activity ratio is more positive through the first 20 years in
the United States than the effect of female labor supply in their spouses’ source country; it is also

22
more often significant. The effect of the respondent’s own source country fertility is generally
more negative than that of fertility in the spouse’s source country, although these effects are
generally not significant in either case. Overall, women are more responsive to their own source
country’s culture, but that of their husband also generally affects their labor supply in the
expected direction. Again, these results are consistent with the findings in Table 5 which
showed a larger effect of source country female relative activity ratio for immigrant women
married to native men than for native women married to immigrant men.
C. Alternative Specifications
As mentioned earlier we attempted a number of alternative specifications of equation (1).
Each of these led to qualitatively similar results to those shown in Tables 3 and 4 and Figures 1
and 2. First, we included a full set of country dummy variables, in effect transforming the
country characteristics effects into within country effects. The effects on married immigrant
women of the female relative activity rate remained highly significant and positive for each years
since migration category. The coefficients rose from 467 hours at 0-5 years, to 899 hours at 16-
20 years before falling back to 828 hours at 21-30 years since migration.19 The rise in this case
was statistically significant, indicating that within countries, an increase in the activity rate raises
both the level and the slope of the profile. (Recall from Table 3 that the slope was increased
through 16-20 years but not significantly so.) The effect of the relative female activity rate
controlling for country dummies is actually larger in magnitude than the results in Table 3. This
comparison implies that, controlling for the other country characteristics, the female relative
activity rate is negatively correlated with unmeasured country-specific factors raising immigrant
women’s labor supply. The significantly positive impact controlling for country dummies gives
us more confidence that our basic results reflect the impact of source country female labor
supply rather than unmeasured country-specific factors. In contrast to the results for female 19 Like the results in Table 3, these represent the sum of the own and spouse country characteristics effects.

23
activity rate, the impact of fertility on women’s labor supply in the country fixed effects
specification was positive but statistically insignificant. And the impact of female activity rate
for men’s labor supply was positive, much smaller in magnitude than for women, and
statistically insignificant for each years since migration category except for 16-20 years.20
Second, we estimated equation 1) with two alternative dependent variables: 1) a dummy
variable indicating that one had positive work hours (a linear probability analysis); and 2) work
hours given employment. In these models, the female relative activity rate had significantly
positive effects for each years since migration category on both employment incidence and hours
given employment for married immigrant women. These effects were relatively stable with time
in the United States, ranging from .205 to .285 for employment and 162 to 248 for hours given
employment. A 75-25 difference in female relative activity rate raises employment incidence by
5.5 to 7.6 percentage points (about 9.6-13.3% of the immigrant mean of .573) and hours given
employment by 43 to 66 hours (or about 2.6-4.0% of the immigrant mean of 1640 hours given
employment). Thus, effects on employment were larger relative to the mean than effects on
hours given employment, but source country characteristics have noticeable effects on both
margins for women.21 Effects of fertility were negative for both dependent variables and
significant four of five times for hours given employment and three of five times for the
incidence of employment. A 75-25 difference in fertility lowered employment by 4.4-15.3% and
hours given employment by 1.8-8.2% of the respective immigrant averages.22 As before, the
effect of fertility was similar for men to what it was for women, and the effect of female activity
rate was small and insignificant.
20 The effects of relative female activity rate for men ranged from 33 to 333 hours. These were more positive than the results in Table 4 which did not control for country dummies, again suggesting that controlling for the other source country characteristics, female relative activity rate is negatively correlated with unmeasured country-specific factors increasing immigrant men’s labor supply (as was the case for women as well). 21 The similarity of the effects of the female relative activity rate on both employment incidence and hours given employment gives us some confidence in this variable as an indicator of the gender division of labor in the source country, despite our lack of information on the hours actually worked by source country. 22 The effect of fertility on hours given employment was significantly more negative for 21-30 years than at arrival, although, again, the magnitude of these effects relative to the mean was small.

24
Third, our basic results were very similar when we measured source characteristics (i) at
age 17, (ii) in the current Census year (i.e., 1980 for the 1980 Census; 1990 for the 1990 Census
and 2000 for the 2000 Census), or (iii) at the same year for the full sample (i.e., two models: one
using 1980 values and one using 1990 values). Thus our findings are robust to a number of
alternative assumptions about the timing of when one’s source country might affect one’s values
and tastes. Fourth, because one might be concerned that selection into marriage may have
changed between 1980 and 2000 (as discussed by Blau and Kahn, 2007), we estimated our
models using all adults and only controlling for one’s own source country characteristics. In
effect these models allow marriage to be endogenous. We obtained very similar results to those
reported in Tables 3 and 4 and Figures 1 and 2. Finally, results were also broadly similar when
we performed separate pairwise analyses for 1980-90 and 1990-2000, rather than pooling all
three years as we do in our main specifications.
V. Conclusions
In this paper, we have examined the assimilation of married immigrant women into the
US labor market. We found that, controlling for personal characteristics, women from high
female labor supply countries work more than those from low female labor supply source
countries and that this gap is substantial and roughly constant with length of residence in the
United States. The work hours of women from both types of source countries do however
assimilate dramatically over time relative to comparable natives. Women from high female labor
supply countries (at the 75th percentile of the distribution) work roughly the same number of
hours as natives after 6-10 years in the United States. While women migrating from low female
labor supply countries (at the 25th percentile of the distribution) continue to lag behind natives,
they greatly reduce their initial work hours deficit.
Our findings suggest that growing up in a country with less traditional gender roles
facilitates the labor market assimilation of women, perhaps by giving them higher (unmeasured)

25
human capital levels or by affecting their views about women’s appropriate roles and hence their
work orientation. A number of our findings are consistent with the latter possibility or an impact
of “culture” on economic behavior. First, we find that the relationship between source country
female participation and immigrant women’s labor supply is persistent over time in the United
States, consistent with a relatively strong hold of source country culture. This inference is
reinforced by our finding that men’s labor supply levels and profile slopes are unaffected by
source country female labor supply, suggesting that the female findings reflect notions of gender
roles rather than the overall work orientation or human capital of all immigrants from a
particular type of source country. Second, when we disaggregate by family type, we find that the
labor supply of the native-born wives of immigrant husbands is positively related to female
participation in the husband’s country of origin. This could be due to a direct effect of husbands
on the behavior of wives, or selection of spouses who share similar values, but either way again
suggests an impact of culture. A final result of interest is that, unlike previous work on
immigrants, we distinguish between the effects on labor supply of an immigrant woman’s own
source country from that of her husband’s, finding that the women’s own source country has a
larger impact on her behavior.
Findings for another indicator of traditional gender roles, source country fertility rates,
are broadly similar for women, with substantial and persistent negative effects of source country
fertility on the labor supply of female immigrants for the full sample of immigrant wives;
however, we also find a similar result for immigrant men, suggesting that source fertility may be
an inverse proxy for general preparedness for work in the United States.
The nature of gender roles in the source countries of immigrants to the United States is
changing in potentially offsetting ways. On the one hand, fertility rates are falling dramatically
in immigrant source countries relative to the United States, potentially raising immigrant
women’s labor supply here. On the other hand, while female labor force participation relative to
men’s grew around the world between 1980 and 2000, it grew even faster in the United States
than in immigrant source countries. These trends could potentially widen the relative gap in

26
labor supply between native and immigrant women. However, more recently female
participation rates in the United States have leveled off, suggesting that source country rates may
begin to catch up to the US rate. Thus, the future assimilation of immigrant women into the US
labor market will depend on the strength of these opposing forces.
27
Data Appendix
Individual Variables
Data were obtained from the 1980, 1990 and 2000 five percent extracts of the US Census,
which are contained in the Integrated Public Use Microdata Series (IPUMS), available at http://www.ipums.umn.edu/. Those people born in the United States or a US territory or possession, or born abroad to an American parent are classified as natives; others are classified as immigrants. All immigrants in the extracts are included, along with all natives who were married to immigrants. A 4% random sample was taken of the remaining observations, with the 1990 and 2000 Census person weights multiplied by 25; comparable weights were created for the 1980 Census for which no Census weights are provided. (Hence, we have a 1/500 sample of natives.) To ensure that each year was given equal weight, the adjusted weights were then divided by the sum of these weights over all observations in a given year.
For the married sample, husband and wife records were matched, with observations dropped if either spouse was not in the 18-65 age range, had zero weight, had allocated annual weeks worked, allocated hours worked per week, allocated birthplace or year of immigration, or had missing source country information. For the total sample, observations were dropped if a person was not in the 18-65 age range; had zero weight; had allocated annual weeks worked, allocated hours worked per week, allocated birthplace or year of immigration, or had missing source country information.
Since we focus on adult immigrants, the preceding samples were further restricted by
excluding immigrants who arrived in the United States before age 18. Data on arrival period in the 1980 and 1990 Censuses is in interval form. For each interval, we only include immigrants for whom we can definitely conclude that they were at least 18 years old on arrival in the United States. That is, if the immigrant arrived between A0 and A1, we take only individuals for whom (A0 – BY) ≥ 18, where BY is birth year as calculated from the individual’s reported age. For comparability, similar procedures were followed for the 2000 Census data. This also required us to exclude individuals in the open-ended arrival category for 1980 and 1990 (i.e., pre-1950), since we cannot ascertain whether such individuals migrated as children or adults. The resulting maximum years since migration is thus 30 for 1980, and, for comparability, a maximum of 30 years since migration is also set for 1990 and 2000. We define sets of cohort of arrival and years since migration variables dummies that are consistent across the three Censuses. The cohort of arrival dummies include all but one possible arrival cohort: 1995-2000, 1991-94, 1985-90, 1980-84, 1975-79, 1970-74, 1965-69, and 1960-64 (1950-59 is the omitted category). The full set of years since migration dummies is included: 0-5, 6-10, 11-15, 16-20, and 21-30 years in the US.
Values for the highest grade completed by husbands and wives in the 1990 and 2000 samples were assigned using Jaeger’s (1997) suggested correspondence. Annual hours worked were defined as the product of the number of weeks worked in the previous year and the number of hours usually worked during those weeks; a respondent was considered to be in the workforce if annual hours were greater than 0.
28
Source Country Variables
The source country characteristics described below were collected at five-year intervals for the period 1950 to 2000. To form a consistent list of source countries, we combine some countries which were not available in some Census years (e.g. subsets of countries in Africa, the Pacific Islands, and the West Indies) and countries that split or combined between 1980 and 2000 (e.g. the former USSR countries, East and West Germany, former Czechoslovakia, and former Yugoslavia). Some countries were combined because data on source country characteristics were only available in a combined form. The data set includes 106 source countries in total. The characteristics for each composite group are the average values over constituent countries weighted by each country’s population age 18 to 65 from the 2000 Census 1% extract. Due to missing values of source country variables in some years, we have, in cases, interpolated for intervening years, used earliest (most recent) values for preceding (subsequent) years, and imputed source country characteristics from neighboring countries. Source country characteristics were matched to arrival cohorts as follows: 1950-1959: 1955; 1960-1964: 1960; 1965-1969: 1965; 1970-1974: 1970; 1975-1979: 1975; 1980-1984: 1980; 1985-1990: 1985; 1991-1994: 1990; 1995-2000: 1995.

Source Country Characteristics: Definitions and Sources
Variable Description
Fertility Total fertility rate: the number of children that would be born per woman, assuming no female mortality at child bearing ages and the age-specific fertility rates of a specified country and reference period. The data are available between 1955 and 2000 at five year intervals. Source: United Nations Statistics Division, Series 13700 (2006).
GDP per Capita GDP per capita (1995 US $): GDP is an aggregate measure of production equal to the sum of the gross values added of all resident institutional units engaged in production. The total population of a country may comprise either all usual residents of the country (de jure population) or all persons present in the country (de facto population) at the time of the census. The data are available annually between 1960 and 2000. Source: United Nations Statistics Division, Series 29918 and 13660 (2006), with supplemental data from U.S. Arms and Control Disarmament Agency and U.S. Department of State,World Military Expenditures and Arms Transfers (various issues).
Female/Male Activity
Rate
Female LFP / Male LFP: Economically active population ("usually active" or "currently active" (currently active is also known as "the labor force")) comprises all persons who furnish the supply of labor for the production of economic goods and services (employed and unemployed, including those seeking work for the first time), as defined by the System of National Accounts (SNA). The rates are calculated for individuals age 15 and up. The data are available between 1950 and 2000 at ten year intervals and in 1995. Source: United Nations Statistics Division, Series 4270 and 4230 (2006).
Refugee Proportion Refugees as a proportion of total immigrants. The data are available between 1950 and 2000 at five year intervals. Source: Statistical Yearbook of the Immigration and Naturalization Service, U.S. Department of Justice (various years)..
Primary School
Enrollment Rate
Female or male primary school enrollment rate: Gross enrollment ratio is the ratio of total enrollment, regardless of age, to the population of the age group that officially corresponds to that level of education in question. The World Bank data are available in 1970, 1975, 1980, 1985, and 1990-1998; Barro-Lee data are available between 1960 and 1985 at five year intervals. Source: World Bank World Development Indicators CD-Rom, Series SE.PRM.ENRR.FE (2002), with supplemental data from Barro and Lee (1994).
Secondary School
Enrollment Rate
Female or male secondary school enrollment rate: Gross enrollment ratio is the ratio of total enrollment, regardless of age, to the population of the age group that officially corresponds to that level of education in question. The World Bank data are available in 1970, 1975, 1980, 1985, and 1990-1998; Barro-Lee data are available between 1960 and 1985 at five year intervals. Source: World Bank World Development Indicators CD-Rom, Series SE.SEC.ENRR.FE (2002), with supplemental data from Barro and Lee (1994).
English-Speaking
Country
English speaking country. Source: Bleakley and Chin (2004); their data were from the World Almanac and Book of Facts (1999).
English Official
Language
English is an official language of the country (for non-English-Speaking countries). Source: Bleakley and Chin (2004); their data were from the World Almanac and Book
of Facts (1999).
Distance to US Distance to the U.S. (miles): computed as the distance between the capital of the foreign country and the closest of three U.S. gateways – New York, Los Angeles or Miami. See http://www.indo.com/distance/ and http://www.cia.gov/cia/publications/factbook

Antecol, Heather, “An Examination of CrossForce Participation Rates,”
Baker, Michael and Dwayne Benjamin, “The Role of the Family in Immigrants’ LaborActivity: An Evaluation of Alternative Explanations.” (1997), 705-727.
Barro, Robert J., and Jong-Wha LeeConference Series on Public Policy
Blau, Francine D., "The Fertility of Immigrant Women: Evidence from HighCountries," in George J. Borjas and Richard B. Freeman, eds., Force: Economic Consequences for the United States and Source AreasUniversity of Chicago Press, 1992
Blau, Francine D. and Lawrence M. Kahn, “Changes in the Labor Supply Behavior of Married Women: 1980-2000,” Journal of Labor Economics
Blau, Francine D., Lawrence M. Kahn, Albert YungTransmission of Women’s Fertility, Human Capital, and Work Orientation Across Immigrant Generations,” NBER
Blau, Francine D., Lawrence M. Kahn, Joan Moriarty, and Andre Souza. "The Role of the Family in Immigrants’ LaborExplanations: Comment,”
Blau, Francine D., Lawrence M. Kahn and Kerry L. Papps, Characteristics and Labor Market Assimilation Among Immigrants: 1980working paper no. 14387
Bleakley, Hoyt and Aimee Chin, “Language Skills and Earnings: Evidence from ChildhoodImmigrants" Review of Economics and Statistics
Borjas, George J. “Assimilation, Changes in Cohort Quality, and the Earnings of Immigrants.” Journal of Labor Economics
Borjas, George J. “Assimilation and ChangeImmigrant Earnings in the 1980s?”
Chiswick, Barry R., “The Effect of Americanization on the Earnings of ForeignJournal of Political Economy
Cobb-Clark, Deborah and Thomas F.Labour Economics 11:3 (
Fernández, Raquel , "Culture and Economics," in eds., The New Palgrave Dictionary of EconomicsYork, Palgrave Macmillan, 2008),
30
References
Antecol, Heather, “An Examination of Cross-Country Differences in the Gender Gap in Labor Force Participation Rates,” Labour Economics 7:4 (2000), 409-426.
Baker, Michael and Dwayne Benjamin, “The Role of the Family in Immigrants’ LaborActivity: An Evaluation of Alternative Explanations.” American Economic Review
Wha Lee, Sources of Economic Growth. CarnegieConference Series on Public Policy 40, (1994), 1–46.
Blau, Francine D., "The Fertility of Immigrant Women: Evidence from High-Fertility Source Countries," in George J. Borjas and Richard B. Freeman, eds., Immigration and the Work
Economic Consequences for the United States and Source Areas (University of Chicago Press, 1992), 93-133.
Blau, Francine D. and Lawrence M. Kahn, “Changes in the Labor Supply Behavior of Married Journal of Labor Economics 25:3 (2007), 393-438.
, Lawrence M. Kahn, Albert Yung-Hsu Liu, and Kerry L. Papps, “The Transmission of Women’s Fertility, Human Capital, and Work Orientation Across Immigrant Generations,” NBER working paper no. 14388 (2008).
Blau, Francine D., Lawrence M. Kahn, Joan Moriarty, and Andre Souza. "The Role of the Family in Immigrants’ Labor-Market Activity: An Evaluation of Alternative Explanations: Comment,” American Economic Review 93:1 (2003), 429-
ence M. Kahn and Kerry L. Papps, “Gender, Source Country Characteristics and Labor Market Assimilation Among Immigrants: 1980
(2008).
Bleakley, Hoyt and Aimee Chin, “Language Skills and Earnings: Evidence from ChildhoodReview of Economics and Statistics 86:2 (2004), 481-496.
Borjas, George J. “Assimilation, Changes in Cohort Quality, and the Earnings of Immigrants.” Journal of Labor Economics 3:4 (1985), 463-489.
Borjas, George J. “Assimilation and Changes in Cohort Quality Revisited: What Happened to Immigrant Earnings in the 1980s?” Journal of Labor Economics 13:2 (1995)
Chiswick, Barry R., “The Effect of Americanization on the Earnings of Foreign-Journal of Political Economy 86:5 (1978), 897-921.
and Thomas F. Crossley, "Revisiting the Family Investment (2004), 373-393.
Fernández, Raquel , "Culture and Economics," in Steven N. Durlauf and Lawrence E. BlumePalgrave Dictionary of Economics, 2nd edition (Basingstoke and New
Palgrave Macmillan, 2008), 333-340.
Country Differences in the Gender Gap in Labor
Baker, Michael and Dwayne Benjamin, “The Role of the Family in Immigrants’ Labor-Market American Economic Review 87:4
Carnegie-Rochester
Fertility Source Immigration and the Work
(Chicago, IL,
Blau, Francine D. and Lawrence M. Kahn, “Changes in the Labor Supply Behavior of Married 438.
Hsu Liu, and Kerry L. Papps, “The Transmission of Women’s Fertility, Human Capital, and Work Orientation Across
Blau, Francine D., Lawrence M. Kahn, Joan Moriarty, and Andre Souza. "The Role of the Market Activity: An Evaluation of Alternative
-447
“Gender, Source Country Characteristics and Labor Market Assimilation Among Immigrants: 1980-2000,” NBER
Bleakley, Hoyt and Aimee Chin, “Language Skills and Earnings: Evidence from Childhood
Borjas, George J. “Assimilation, Changes in Cohort Quality, and the Earnings of Immigrants.”
s in Cohort Quality Revisited: What Happened to 2 (1995), 201-245.
-born Men,”
nvestment Hypothesis,"
Steven N. Durlauf and Lawrence E. Blume, , 2nd edition (Basingstoke and New
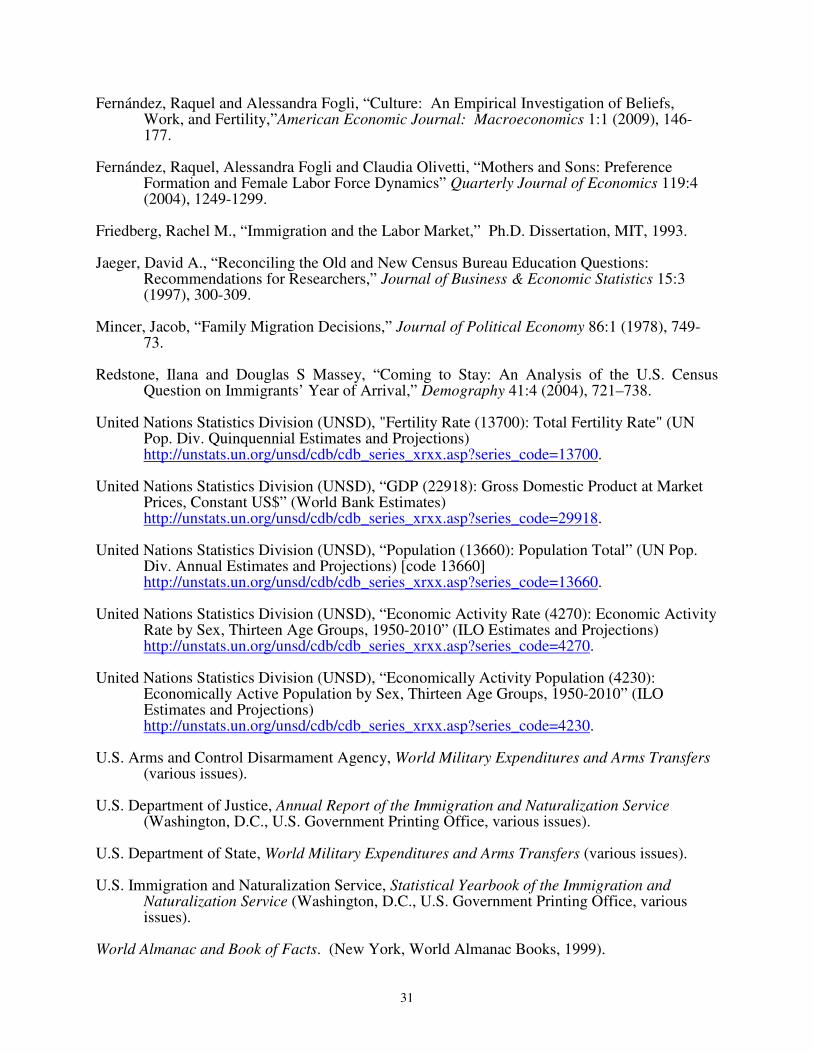
31
Fernández, Raquel and Alessandra Fogli, “Culture: An Empirical Investigation of Beliefs, Work, and Fertility,”American Economic Journal: Macroeconomics 1:1 (2009), 146-177.
Fernández, Raquel, Alessandra Fogli and Claudia Olivetti, “Mothers and Sons: Preference Formation and Female Labor Force Dynamics” Quarterly Journal of Economics 119:4 (2004), 1249-1299.
Friedberg, Rachel M., “Immigration and the Labor Market,” Ph.D. Dissertation, MIT, 1993.
Jaeger, David A., “Reconciling the Old and New Census Bureau Education Questions: Recommendations for Researchers,” Journal of Business & Economic Statistics 15:3 (1997), 300-309.
Mincer, Jacob, “Family Migration Decisions,” Journal of Political Economy 86:1 (1978), 749-73.
Redstone, Ilana and Douglas S Massey, “Coming to Stay: An Analysis of the U.S. Census Question on Immigrants’ Year of Arrival,” Demography 41:4 (2004), 721–738.
United Nations Statistics Division (UNSD), "Fertility Rate (13700): Total Fertility Rate" (UN Pop. Div. Quinquennial Estimates and Projections) http://unstats.un.org/unsd/cdb/cdb_series_xrxx.asp?series_code=13700.
United Nations Statistics Division (UNSD), “GDP (22918): Gross Domestic Product at Market Prices, Constant US$” (World Bank Estimates) http://unstats.un.org/unsd/cdb/cdb_series_xrxx.asp?series_code=29918.
United Nations Statistics Division (UNSD), “Population (13660): Population Total” (UN Pop. Div. Annual Estimates and Projections) [code 13660] http://unstats.un.org/unsd/cdb/cdb_series_xrxx.asp?series_code=13660.
United Nations Statistics Division (UNSD), “Economic Activity Rate (4270): Economic Activity Rate by Sex, Thirteen Age Groups, 1950-2010” (ILO Estimates and Projections) http://unstats.un.org/unsd/cdb/cdb_series_xrxx.asp?series_code=4270.
United Nations Statistics Division (UNSD), “Economically Activity Population (4230): Economically Active Population by Sex, Thirteen Age Groups, 1950-2010” (ILO Estimates and Projections) http://unstats.un.org/unsd/cdb/cdb_series_xrxx.asp?series_code=4230.
U.S. Arms and Control Disarmament Agency, World Military Expenditures and Arms Transfers (various issues).
U.S. Department of Justice, Annual Report of the Immigration and Naturalization Service (Washington, D.C., U.S. Government Printing Office, various issues).
U.S. Department of State, World Military Expenditures and Arms Transfers (various issues).
U.S. Immigration and Naturalization Service, Statistical Yearbook of the Immigration and Naturalization Service (Washington, D.C., U.S. Government Printing Office, various issues).
World Almanac and Book of Facts. (New York, World Almanac Books, 1999).
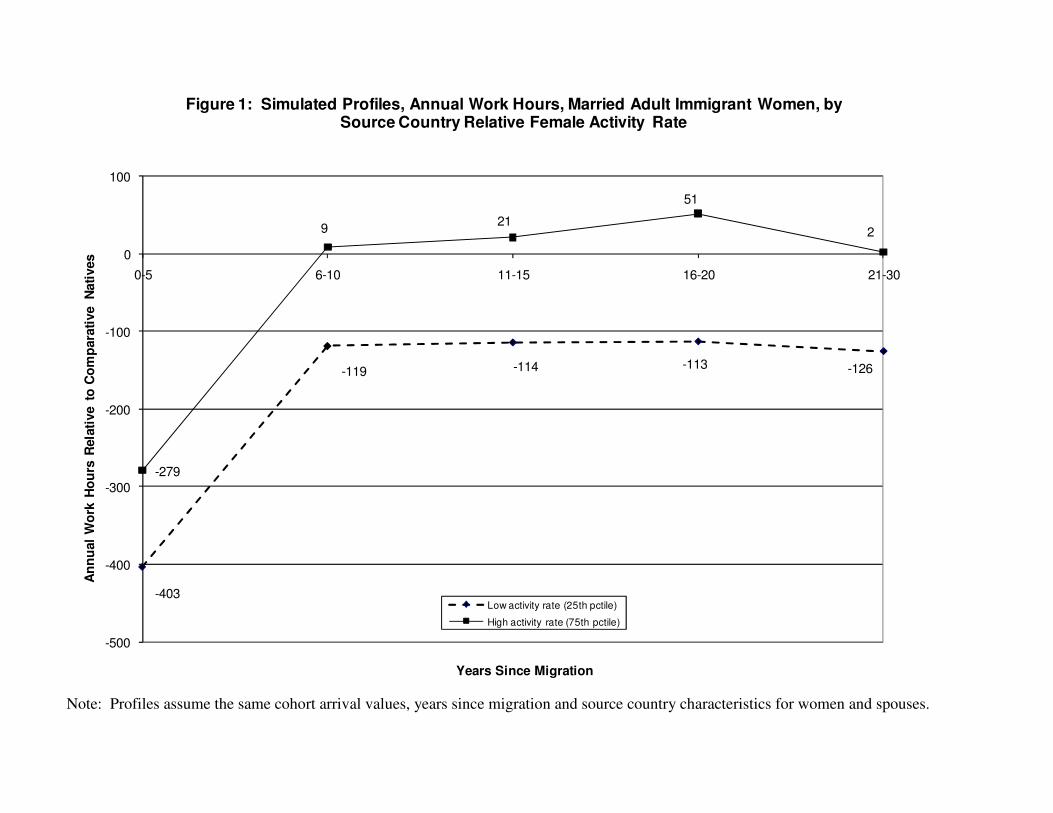
Note: Profiles assume the same cohort arrival values, years since migration and source country characteristics for women and spouses.
-403
-119 -114 -113 -126
-279
921
51
2
-500
-400
-300
-200
-100
0
100
0-5 6-10 11-15 16-20 21-30
An
nu
al
Wo
rk H
ou
rs R
ela
tive t
o C
om
para
tive N
ati
ves
Years Since Migration
Figure 1: Simulated Profiles, Annual Work Hours, Married Adult Immigrant Women, by Source Country Relative Female Activity Rate
Low activity rate (25th pctile)
High activity rate (75th pctile)
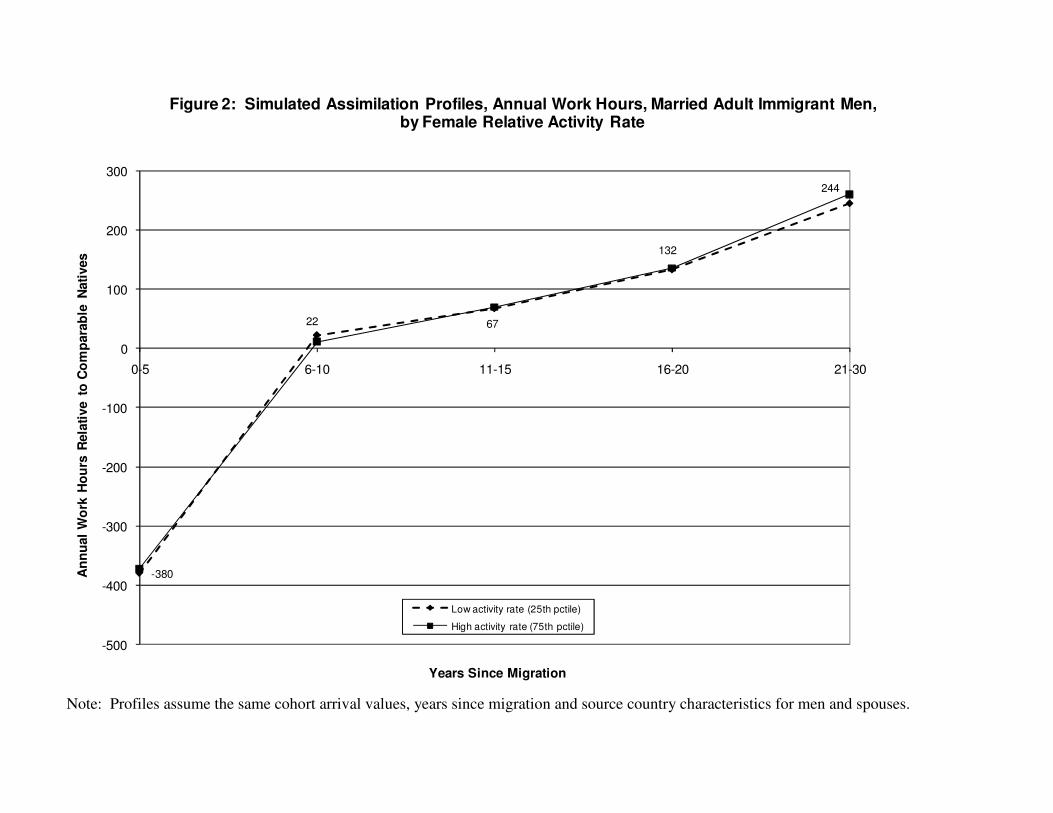
Note: Profiles assume the same cohort arrival values, years since migration and source country characteristics for men and spouses.
-380
22 67
132
244
-500
-400
-300
-200
-100
0
100
200
300
0-5 6-10 11-15 16-20 21-30
An
nu
al
Wo
rk H
ou
rs R
ela
tive t
o C
om
para
ble
Nati
ves
Years Since Migration
Figure 2: Simulated Assimilation Profiles, Annual Work Hours, Married Adult Immigrant Men, by Female Relative Activity Rate
Low activity rate (25th pctile)
High activity rate (75th pctile)

Note: Profiles assume the same cohort arrival values, years since migration and source country characteristics for women and spouses.
-451
-129
-96-116
-153
-314
10
3873
-53
-500
-400
-300
-200
-100
0
100
0-5 6-10 11-15 16-20 21-30
An
nu
al
Wo
rk H
ou
rs R
ela
tive t
o C
om
para
tive N
ati
ves
Years Since Migration
Figure 3: Assimilation Profiles, Annual Work Hours, Adult Immigrant Women Married to Immigrant Men Who Arrived from the Same Country and the Same Time, by Source Country
Relative Female Activity Rate
Low activity rate (25th pctile)
High activity rate (75th pctile)
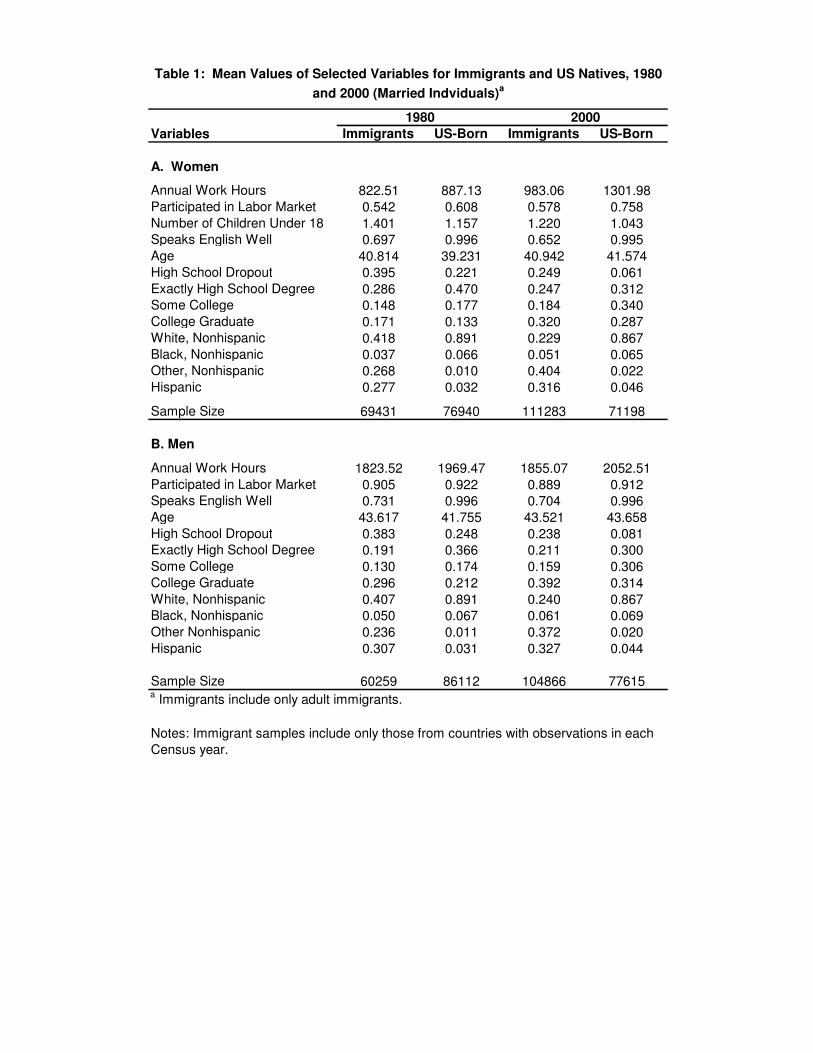
Table 1: Mean Values of Selected Variables for Immigrants and US Natives, 1980
and 2000 (Married Indviduals)a
1980 2000
Variables Immigrants US-Born Immigrants US-Born
A. Women
Annual Work Hours 822.51 887.13 983.06 1301.98Participated in Labor Market 0.542 0.608 0.578 0.758Number of Children Under 18 1.401 1.157 1.220 1.043Speaks English Well 0.697 0.996 0.652 0.995Age 40.814 39.231 40.942 41.574High School Dropout 0.395 0.221 0.249 0.061Exactly High School Degree 0.286 0.470 0.247 0.312Some College 0.148 0.177 0.184 0.340College Graduate 0.171 0.133 0.320 0.287White, Nonhispanic 0.418 0.891 0.229 0.867Black, Nonhispanic 0.037 0.066 0.051 0.065Other, Nonhispanic 0.268 0.010 0.404 0.022Hispanic 0.277 0.032 0.316 0.046
Sample Size 69431 76940 111283 71198
B. Men
Annual Work Hours 1823.52 1969.47 1855.07 2052.51Participated in Labor Market 0.905 0.922 0.889 0.912Speaks English Well 0.731 0.996 0.704 0.996Age 43.617 41.755 43.521 43.658High School Dropout 0.383 0.248 0.238 0.081Exactly High School Degree 0.191 0.366 0.211 0.300Some College 0.130 0.174 0.159 0.306College Graduate 0.296 0.212 0.392 0.314White, Nonhispanic 0.407 0.891 0.240 0.867Black, Nonhispanic 0.050 0.067 0.061 0.069Other Nonhispanic 0.236 0.011 0.372 0.020Hispanic 0.307 0.031 0.327 0.044
Sample Size 60259 86112 104866 77615a Immigrants include only adult immigrants.
Notes: Immigrant samples include only those from countries with observations in each Census year.
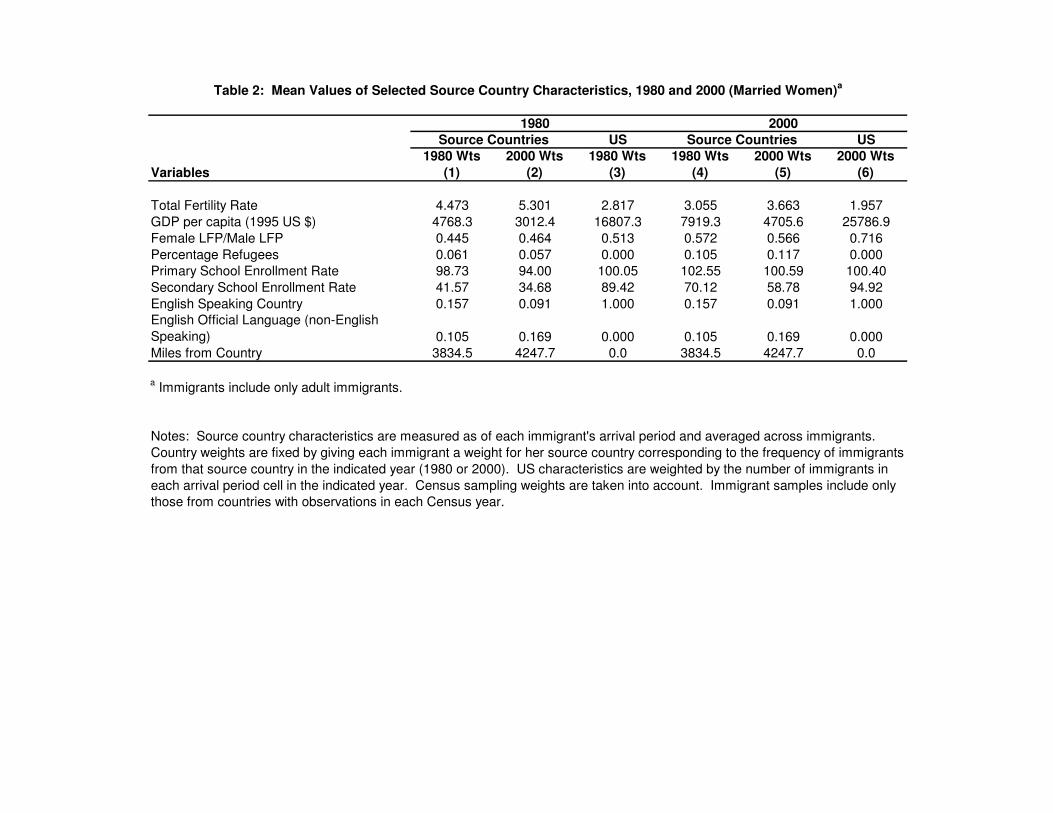
Table 2: Mean Values of Selected Source Country Characteristics, 1980 and 2000 (Married Women)a
1980 2000
US US
1980 Wts 2000 Wts 1980 Wts 1980 Wts 2000 Wts 2000 Wts
Variables (1) (2) (3) (4) (5) (6)
Total Fertility Rate 4.473 5.301 2.817 3.055 3.663 1.957
GDP per capita (1995 US $) 4768.3 3012.4 16807.3 7919.3 4705.6 25786.9
Female LFP/Male LFP 0.445 0.464 0.513 0.572 0.566 0.716
Percentage Refugees 0.061 0.057 0.000 0.105 0.117 0.000Primary School Enrollment Rate 98.73 94.00 100.05 102.55 100.59 100.40
Secondary School Enrollment Rate 41.57 34.68 89.42 70.12 58.78 94.92
English Speaking Country 0.157 0.091 1.000 0.157 0.091 1.000English Official Language (non-English
Speaking) 0.105 0.169 0.000 0.105 0.169 0.000Miles from Country 3834.5 4247.7 0.0 3834.5 4247.7 0.0
a Immigrants include only adult immigrants.
Source Countries Source Countries
Notes: Source country characteristics are measured as of each immigrant's arrival period and averaged across immigrants.
Country weights are fixed by giving each immigrant a weight for her source country corresponding to the frequency of immigrants
from that source country in the indicated year (1980 or 2000). US characteristics are weighted by the number of immigrants in
each arrival period cell in the indicated year. Census sampling weights are taken into account. Immigrant samples include only those from countries with observations in each Census year.

Table 3: Sum of Own and Spouse Effects on Annual Work Hours for Models Including Source Country Interactions,
Married Women, Selected Variables
Variable 0-5 years 6-10 years 11-15 years 16-20 years 21-30 years
Fertility rate -25.304 -55.094* -59.015** † -43.161** -37.180**
(19.829) (22.741) (17.460) (14.039) (13.336)
GDP per capita -0.023** -0.037** †† -0.050** †† -0.037** † -0.026**
(0.003) (0.004) (0.004) (0.004) (0.004)
Activity rate ratio 464.656** 476.427** 506.396** 614.289** 476.716**
(101.708) (122.639) (96.208) (90.313) (76.358)
Refugee proportion -122.953 -95.503 -60.999 -58.982 -162.381**
(81.161) (100.055) (74.057) (52.989) (55.254)
Primary enrollment rate 1.215 1.474 3.572** 3.850** 3.253**
(1.426) (1.257) (1.134) (0.999) (0.822)
Secondary enrollment rate 1.064 1.523 1.095 -0.010 -0.953 †
(1.314) (1.479) (1.126) (0.954) (0.858)
English speaking country 145.288** 104.985* 78.503 68.430 114.505**
(46.724) (51.190) (47.035) (44.064) (31.250)
English official country 244.429** 233.019** 234.421** 156.219** 85.371 ††
(79.532) (66.247) (59.633) (57.896) (62.062)
Miles from home country -0.029** -0.013 † -0.017 -0.009 † 0.007 ††
(0.008) (0.010) (0.010) (0.008) (0.006)
Immigrant × high school -137.091* -133.062* -125.533* -86.181 -98.029
(54.434) (58.426) (58.041) (59.656) (53.946)
Immigrant × some college -259.760** -181.136* † -180.449** † -92.290 †† -104.491 ††
(63.288) (70.264) (64.322) (73.111) (58.749)
Immigrant × college -338.209** -111.660 †† -139.472 †† -94.509 †† -24.270 ††
(77.202) (86.335) (80.039) (74.487) (70.008)
Observations
R-squared
490939
0.09
Notes: Immigrants are restricted to adult immigrants only. All models also include own and spouse variables for: age, age
squared, 5 years since migration dummies, 8 arrival cohort dummies, 3 education dummies, and 3 race/Hispanic origin dummies,
as well as 8 region, 6 state, and 2 year dummies. Standard errors are clustered at the country-year level. * and ** denote
significance levels of 5% and 1% respectively; † and †† denote significance levels of the difference between the indicated
coefficient and the corresponding effect at 0-5 years since migration, 5% and 1% respectively.

Table 4: Sum of Own and Spouse Effects on Annual Work Hours for Models Including Source Country Interactions,
Married Men, Selected Variables
Variable 0-5 years 6-10 years 11-15 years 16-20 years 21-30 years
Fertility rate -41.517** -65.100** -32.310** -56.701** -40.331**
(14.985) (16.670) (11.412) (16.230) (15.364)
GDP per capita 0.017** -0.002 †† -0.001 †† -0.006 †† -0.002 ††
(0.004) (0.003) (0.003) (0.004) (0.005)
Activity rate ratio 28.845 -39.190 10.258 10.513 59.368
(112.415) (105.507) (74.384) (93.415) (74.686)
Refugee proportion -430.768** -309.112** -273.005** -175.966 -215.118*
(119.940) (93.214) (92.224) (133.265) (108.341)
Primary enrollment rate 1.931 0.240 0.458 1.336 1.069
(1.226) (0.972) (0.877) (0.934) (0.818)
Secondary enrollment rate -2.834 -0.585 0.062 -2.322* -2.319*
(1.556) (1.202) (1.007) (1.104) (0.948)
English speaking country 120.359* 52.887 16.392 62.106 2.552
(56.527) (35.624) (31.894) (36.785) (32.357)
English official country 370.358** 118.107** †† 18.505 †† -18.639 †† -72.810 ††
(58.918) (39.509) (38.464) (55.201) (63.633)
Miles from home country -0.035** -0.008 † 0.006 †† 0.014 †† 0.004 ††
(0.011) (0.008) (0.009) (0.011) (0.009)
Immigrant × high school -219.416** -111.804* †† -112.898** †† -119.238** †† -105.256** ††
(48.801) (45.033) (40.328) (39.203) (37.376)
Immigrant × some college -345.472** -176.690** †† -157.331* †† -116.512 †† -92.634 ††
(74.931) (64.969) (65.385) (68.128) (63.260)
Immigrant × college -376.920** -188.083* †† -165.535 †† -66.687 †† 12.613 ††
(95.688) (88.581) (87.732) (85.581) (83.109)
Observations
R-squared
490939
0.15
Notes: Immigrants are restricted to adult immigrants only. All models also include own and spouse variables for: age, age
squared, 5 years since migration dummies, 8 arrival cohort dummies, 3 education dummies, and 3 race/Hispanic origin
dummies, as well as 8 region, 6 state, and 2 year dummies. Standard errors are clustered at the country-year level. * and **
denote significance levels of 5% and 1% respectively; † and †† denote significance levels of the difference between the
indicated coefficient and the corresponding effect at 0-5 years since migration, 5% and 1% respectively.
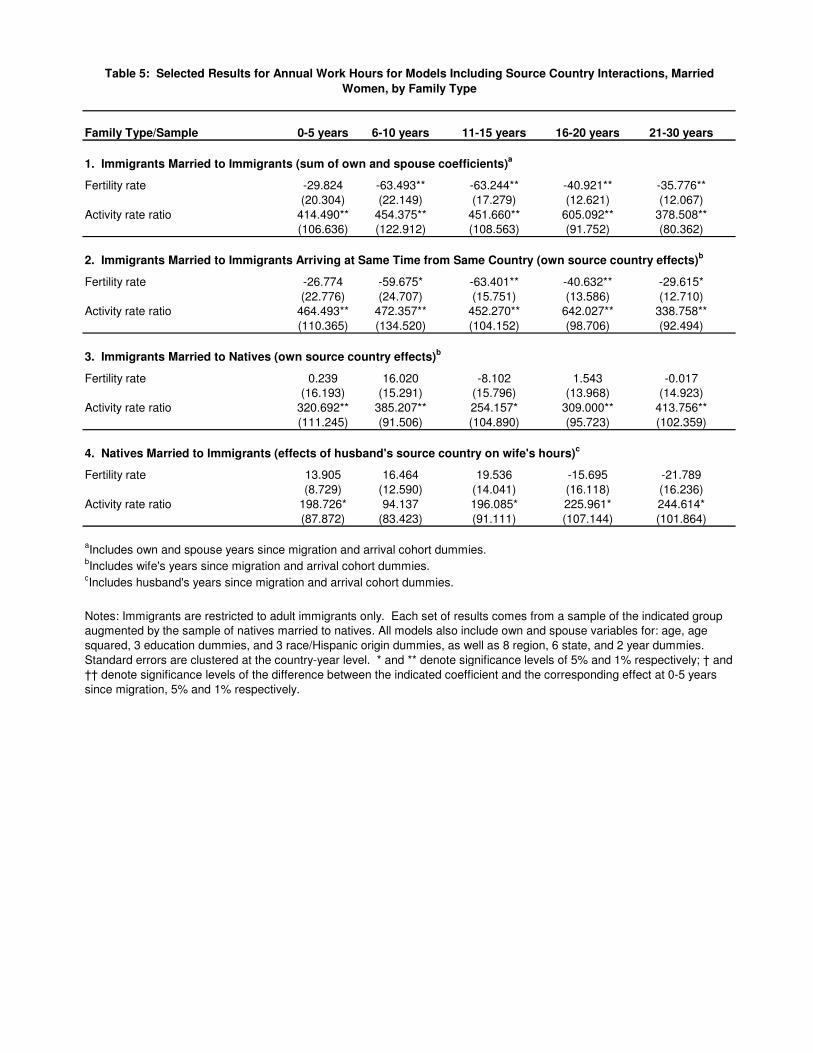
Table 5: Selected Results for Annual Work Hours for Models Including Source Country Interactions, Married
Women, by Family Type
Family Type/Sample 0-5 years 6-10 years 11-15 years 16-20 years 21-30 years
1. Immigrants Married to Immigrants (sum of own and spouse coefficients)a
Fertility rate -29.824 -63.493** -63.244** -40.921** -35.776**
(20.304) (22.149) (17.279) (12.621) (12.067)
Activity rate ratio 414.490** 454.375** 451.660** 605.092** 378.508**(106.636) (122.912) (108.563) (91.752) (80.362)
2. Immigrants Married to Immigrants Arriving at Same Time from Same Country (own source country effects)b
Fertility rate -26.774 -59.675* -63.401** -40.632** -29.615*
(22.776) (24.707) (15.751) (13.586) (12.710)Activity rate ratio 464.493** 472.357** 452.270** 642.027** 338.758**
(110.365) (134.520) (104.152) (98.706) (92.494)
3. Immigrants Married to Natives (own source country effects)b
Fertility rate 0.239 16.020 -8.102 1.543 -0.017(16.193) (15.291) (15.796) (13.968) (14.923)
Activity rate ratio 320.692** 385.207** 254.157* 309.000** 413.756**
(111.245) (91.506) (104.890) (95.723) (102.359)
4. Natives Married to Immigrants (effects of husband's source country on wife's hours)c
Fertility rate 13.905 16.464 19.536 -15.695 -21.789
(8.729) (12.590) (14.041) (16.118) (16.236)
Activity rate ratio 198.726* 94.137 196.085* 225.961* 244.614*
(87.872) (83.423) (91.111) (107.144) (101.864)
aIncludes own and spouse years since migration and arrival cohort dummies.
bIncludes wife's years since migration and arrival cohort dummies.
cIncludes husband's years since migration and arrival cohort dummies.
Notes: Immigrants are restricted to adult immigrants only. Each set of results comes from a sample of the indicated group augmented by the sample of natives married to natives. All models also include own and spouse variables for: age, age
squared, 3 education dummies, and 3 race/Hispanic origin dummies, as well as 8 region, 6 state, and 2 year dummies.
Standard errors are clustered at the country-year level. * and ** denote significance levels of 5% and 1% respectively; † and
†† denote significance levels of the difference between the indicated coefficient and the corresponding effect at 0-5 years
since migration, 5% and 1% respectively.

Table 6: Selected Results for Annual Work Hours for Models Including Source Country Interactions, Immigrant Women
Married to Immigrant Men from a Different Source Country
0-5 years 6-10 years 11-15 years 16-20 years 21-30 years
1. Effect of Own Source Country Characteristics
Fertility rate -12.205 -29.804 -34.341 -18.649 -39.733
(14.805) (19.318) (20.199) (21.450) (22.884)
Activity rate ratio 243.009* 370.203* 549.509* 249.191 -53.800(98.040) (117.711) (128.320) (129.407) (156.859)
2. Effect of Spouse's Source Country Characteristics
Fertility rate -8.931 -37.064* 20.602 -28.569 40.606*†
(15.487) (16.861) (16.066) (17.759) (18.389)
Activity rate ratio 188.021 65.948 330.028* -32.009 213.050(104.406) (124.158) (114.166) (120.646) (132.778)
3. Sum of Effects of Own and Spouse Source Country Characteristics
Fertility rate -21.136 -66.869* -13.739 -47.218 0.873
(19.920) (23.675) (25.470) (26.889) (25.711)
Activity rate ratio 431.030* 436.150* 879.538*† 217.182 159.250(122.542) (150.591) (167.485) (179.909) (189.006)
Notes: Immigrants are restricted to adult immigrants only. Sample includes natives married to natives and immigrants married to immigrants from a different source country. All models also include own and spouse variables for: age, age squared, years since
migration dummies, arrival cohort dummies, 3 education dummies, and 3 race/Hispanic origin dummies, as well as 8 region, 6
state, and 2 year dummies. Standard errors are clustered at the country-year level. * and ** denote significance levels of 5% and 1% respectively; † and †† denote significance levels of the difference between the indicated coefficient and the corresponding
effect at 0-5 years since migration, 5% and 1% respectively.